Article

Modeling the Effect of Soil Type Change on Irrigation Water Requirements of Sunflower and Wheat Using CROPWAT 8.0

1
Vocational School of Technical Sciences, Tekirdağ Namık Kemal University, Tekirdağ 59030, Türkiye
2
Department of Biosystem Engineering, Faculty of Agriculture, Tekirdağ Namık Kemal University, Tekirdağ 59030, Türkiye
*
Author to whom correspondence should be addressed.
Water 2025, 17(10), 1437; https://doi.org/10.3390/w17101437 (registering DOI)
Submission received: 21 February 2025 / Revised: 27 April 2025 / Accepted: 7 May 2025 / Published: 10 May 2025
(This article belongs to the Special Issue Soil Water Use and Irrigation Management)

Abstract

:
Water scarcity, environmental factors, and climate change significantly impact agricultural productivity, making efficient irrigation strategies essential for sustainable crop production. The aim of this study is to determine how different soil types affect the irrigation water requirements of sunflower and wheat. To achieve this aim, the total net irrigation water requirements of sunflower and wheat plants in different soil types in the TR21 Thrace Region (Tekirdağ, Edirne, Kırklareli) during the period 1971–2000 was determined by CROPWAT 8.0. The results reveal that light-textured soils lead to higher irrigation water demand compared to other soil types due to their low water-holding capacity. In the Tekirdağ, Edirne, and Kırklareli provinces, on average, the total net irrigation water requirement for sunflower in three different soil types was 492.1 mm (light), 457.4 mm (medium), and 437.2 mm (heavy), while for wheat it was 342.5 mm (light), 291.0 mm (medium), and 232.9 mm (heavy). It was determined that sunflower required more total net irrigation water than wheat in all three provinces. Total net irrigation water requirement for sunflower decreased by 7.1% in medium-textured soils compared to light-textured soils, by 11.1% in heavy-textured soils compared to light-textured soils, and by 4.3% in heavy-textured soils compared to medium-textured soils in Tekirdağ, Edirne, and Kırklareli provinces. In wheat, the total net irrigation water requirement decreased by 15.0% in medium-textured soils compared to light-textured soils, by 32.0% in heavy-textured soils compared to light-textured soils, and by 20.0% in heavy-textured soils compared to medium-textured soils. Since higher temperatures are observed in Edirne province compared to other provinces, especially during the critical growth periods of sunflower and wheat, the total net irrigation water requirement was found to be higher for both plants. The findings show that climate parameters and soil properties affect agricultural water use, and that soil structure in particular should be taken into consideration when determining irrigation strategies.

1. Introduction

The agricultural sector in Türkiye continues to be an economic and social sector contributing to nutrition, labor, and national income, as well as providing raw materials to industry. Türkiye is in a very advantageous position compared to many countries due to its climate conditions, geographical location, population of approximately 86 million, the majority of whom are young, increasing purchasing power, and expanding domestic and foreign markets [1]. The TR21 Thrace Region stands out as one of the most important agricultural basins in the country, with its fertile lands and enterprises of a size above the Turkish average [2].
According to 2023 TurkStat [3] data, the total agricultural area of the TR21 Thrace Region is 1,010,314 hectares (Table 1). A significant portion of this area is in Tekirdağ province. Most of the agricultural land in the region is devoted to cereals and other plant products. Vegetables, fruits, and ornamental plants are found in smaller proportions throughout the region. According to the distribution throughout Türkiye, it is seen that the region has a remarkable share, especially in cereal production.
The most commonly grown products in the TR21 Thrace Region are wheat, sunflower, rice, barley, and silage maize (Table 2). While wheat ranks first in total cultivation area, sunflower attracts attention in terms of both cultivation area and production amount. This shows that the region is an important production center for these two products.
Wheat is the most widespread crop in terms of total cultivation area. The TR21 Thrace Region accounts for approximately 8% of Türkiye’s wheat and 46% of its sunflower cultivation areas, indicating that the region plays a strategic role in Türkiye’s wheat and sunflower production. Furthermore, the TR21 Thrace Region accounts for about 10% of Türkiye’s wheat production, which demonstrates the importance of the region in agricultural activities. However, despite its large cultivation area, the productivity of wheat remains low compared to other crops, considering the amount of production. The situation is different in sunflower; the TR21 Thrace Region meets about one-third of Türkiye’s sunflower production (649,159 tons) and reaches a high production amount according to its cultivation area. The productivity of sunflower shows that it is adapted to the region and is grown in harmony with climatic conditions, while reinforcing the economic value of sunflower in the region.
The fact that wheat and sunflower stand out as the dominant agricultural products in the TR21 Thrace Region is related not only to the vastness of the cultivation areas but also to the high adaptability of these products to the climate and soil structure of the region. The semi-arid climate characteristics of the TR21 Thrace Region provide ideal conditions for wheat grown in the winter months and sunflower grown in the summer months. However, considering the possible effects of climate change, it is important to take measures for the continuity of these two products [4]. Sunflower is a plant that requires more water than wheat; especially in summer, increasing temperatures and decreasing rainfall increase the need for irrigation of sunflower [5,6,7,8]. Wheat, on the other hand, reduces the total irrigation requirement by benefiting more from precipitation as it grows in winter and spring.
Climate change is expected to increase evapotranspiration rates due to higher temperatures, leading to greater water demand for crops. This is particularly pronounced in regions with coarse-textured soils, where water is less readily available [9,10]. Changes in rainfall distribution, with more intense and prolonged droughts, will exacerbate water scarcity issues, especially in regions with sandy soils that cannot retain water effectively [11]. This situation necessitates that sunflower planting areas be taken into consideration as a priority in irrigation planning. While the increasing water requirement of sunflower during hot and dry summer periods requires the development of more efficient irrigation methods and adaptation strategies in the future, it is also of great importance to prefer more resistant species to protect wheat from the effects of increasing temperature and drought due to climate change. In this context, the effectiveness of irrigation management plays a critical role in the sustainability of both wheat and sunflower production [6,7].
Agricultural irrigation is vital for the sustainability of agricultural production, especially in regions with limited water resources, such as the TR21 Thrace Region. Well-planned irrigation systems not only meet the water needs of plants but also increase soil fertility by preventing soil erosion. While irrigation plays a critical role in the growth stage of crops, efficient use of water can increase farmers’ profitability by reducing agricultural costs. However, rising temperatures and changing rainfall patterns due to climate change necessitate a review of irrigation strategies. In this context, the adoption of modern irrigation techniques such as drip irrigation and sprinkler irrigation, along with irrigation scheduling, provides an important opportunity to increase agricultural productivity by saving water and protecting plant health.
Agricultural irrigation is a complex process affected by many factors. These factors include climatic conditions, plant species, soil structure and texture, irrigation methods, and practices. In particular, different soil textures are an important factor directly affecting the effectiveness of agricultural irrigation practices [12]. Soil texture describes the proportion of particles of different sizes (sand, silt, and clay) contained in a soil sample [13]. These proportions determine the physical properties and workability of the soil. Fine-textured soils, such as clay, have higher water retention capacities compared to coarse-textured soils like sand. This means that crops grown in clay soils may require less frequent irrigation, as these soils can hold water longer during dry periods. On the other hand, coarse-textured soils exhibit a steeper decline in hydraulic conductivity as they dry, making them more sensitive to soil moisture deficits. This necessitates more frequent irrigation to maintain adequate soil moisture levels for crops [14].
Soil texture plays a critical role in determining agricultural productivity and irrigation water requirements by influencing important agricultural properties such as water-holding capacity, aeration, nutrient retention, and plant growth potential. Considering these factors, irrigation management should not only meet the water needs of crops but also include strategies to improve productivity by designing irrigation in accordance with soil properties. The impact of soil texture on irrigation needs varies by region. In Europe, for example, the central and southern areas are expected to see larger increases in irrigation requirements due to their soil and climate conditions [15]. Therefore, the effect of different soil textures on irrigation water requirements emerges as a dimension that should be considered for the sustainability of agricultural production. When literature studies in the region are evaluated, it is seen that the focus is generally on the effects of climate change on plant water needs, irrigation water needs, drought, yield, etc. [8,16,17]. There are a limited number of studies worldwide on the effects of different soil types on irrigation water requirement [18,19]. No study, in this sense, has been found for the TR21 Thrace Region. Determining the effect of soil type on irrigation water requirements is of great importance, especially considering the limited water resources in the TR21 Thrace Region, which is under the influence of climate change [20,21]. It is thought that the findings of this study will provide insight to producers, irrigation managers, and experts working on agricultural water resources.
The aim of this research is to determine the effect of sunflower and wheat plants grown in three different soil types in the TR21 Thrace Region on total net irrigation water in the 1971–2000 reference period with the CROPWAT 8.0 model. The main question of the research is to what extent the irrigation water requirement of sunflower and wheat plants differs in different soil types. This research has comparatively revealed how different soil textures create a change in irrigation water requirement. While seeking an answer to this question, it is expected that the obtained results will contribute to strategies that take soil characteristics into account in irrigation planning.

2. Materials and Methods
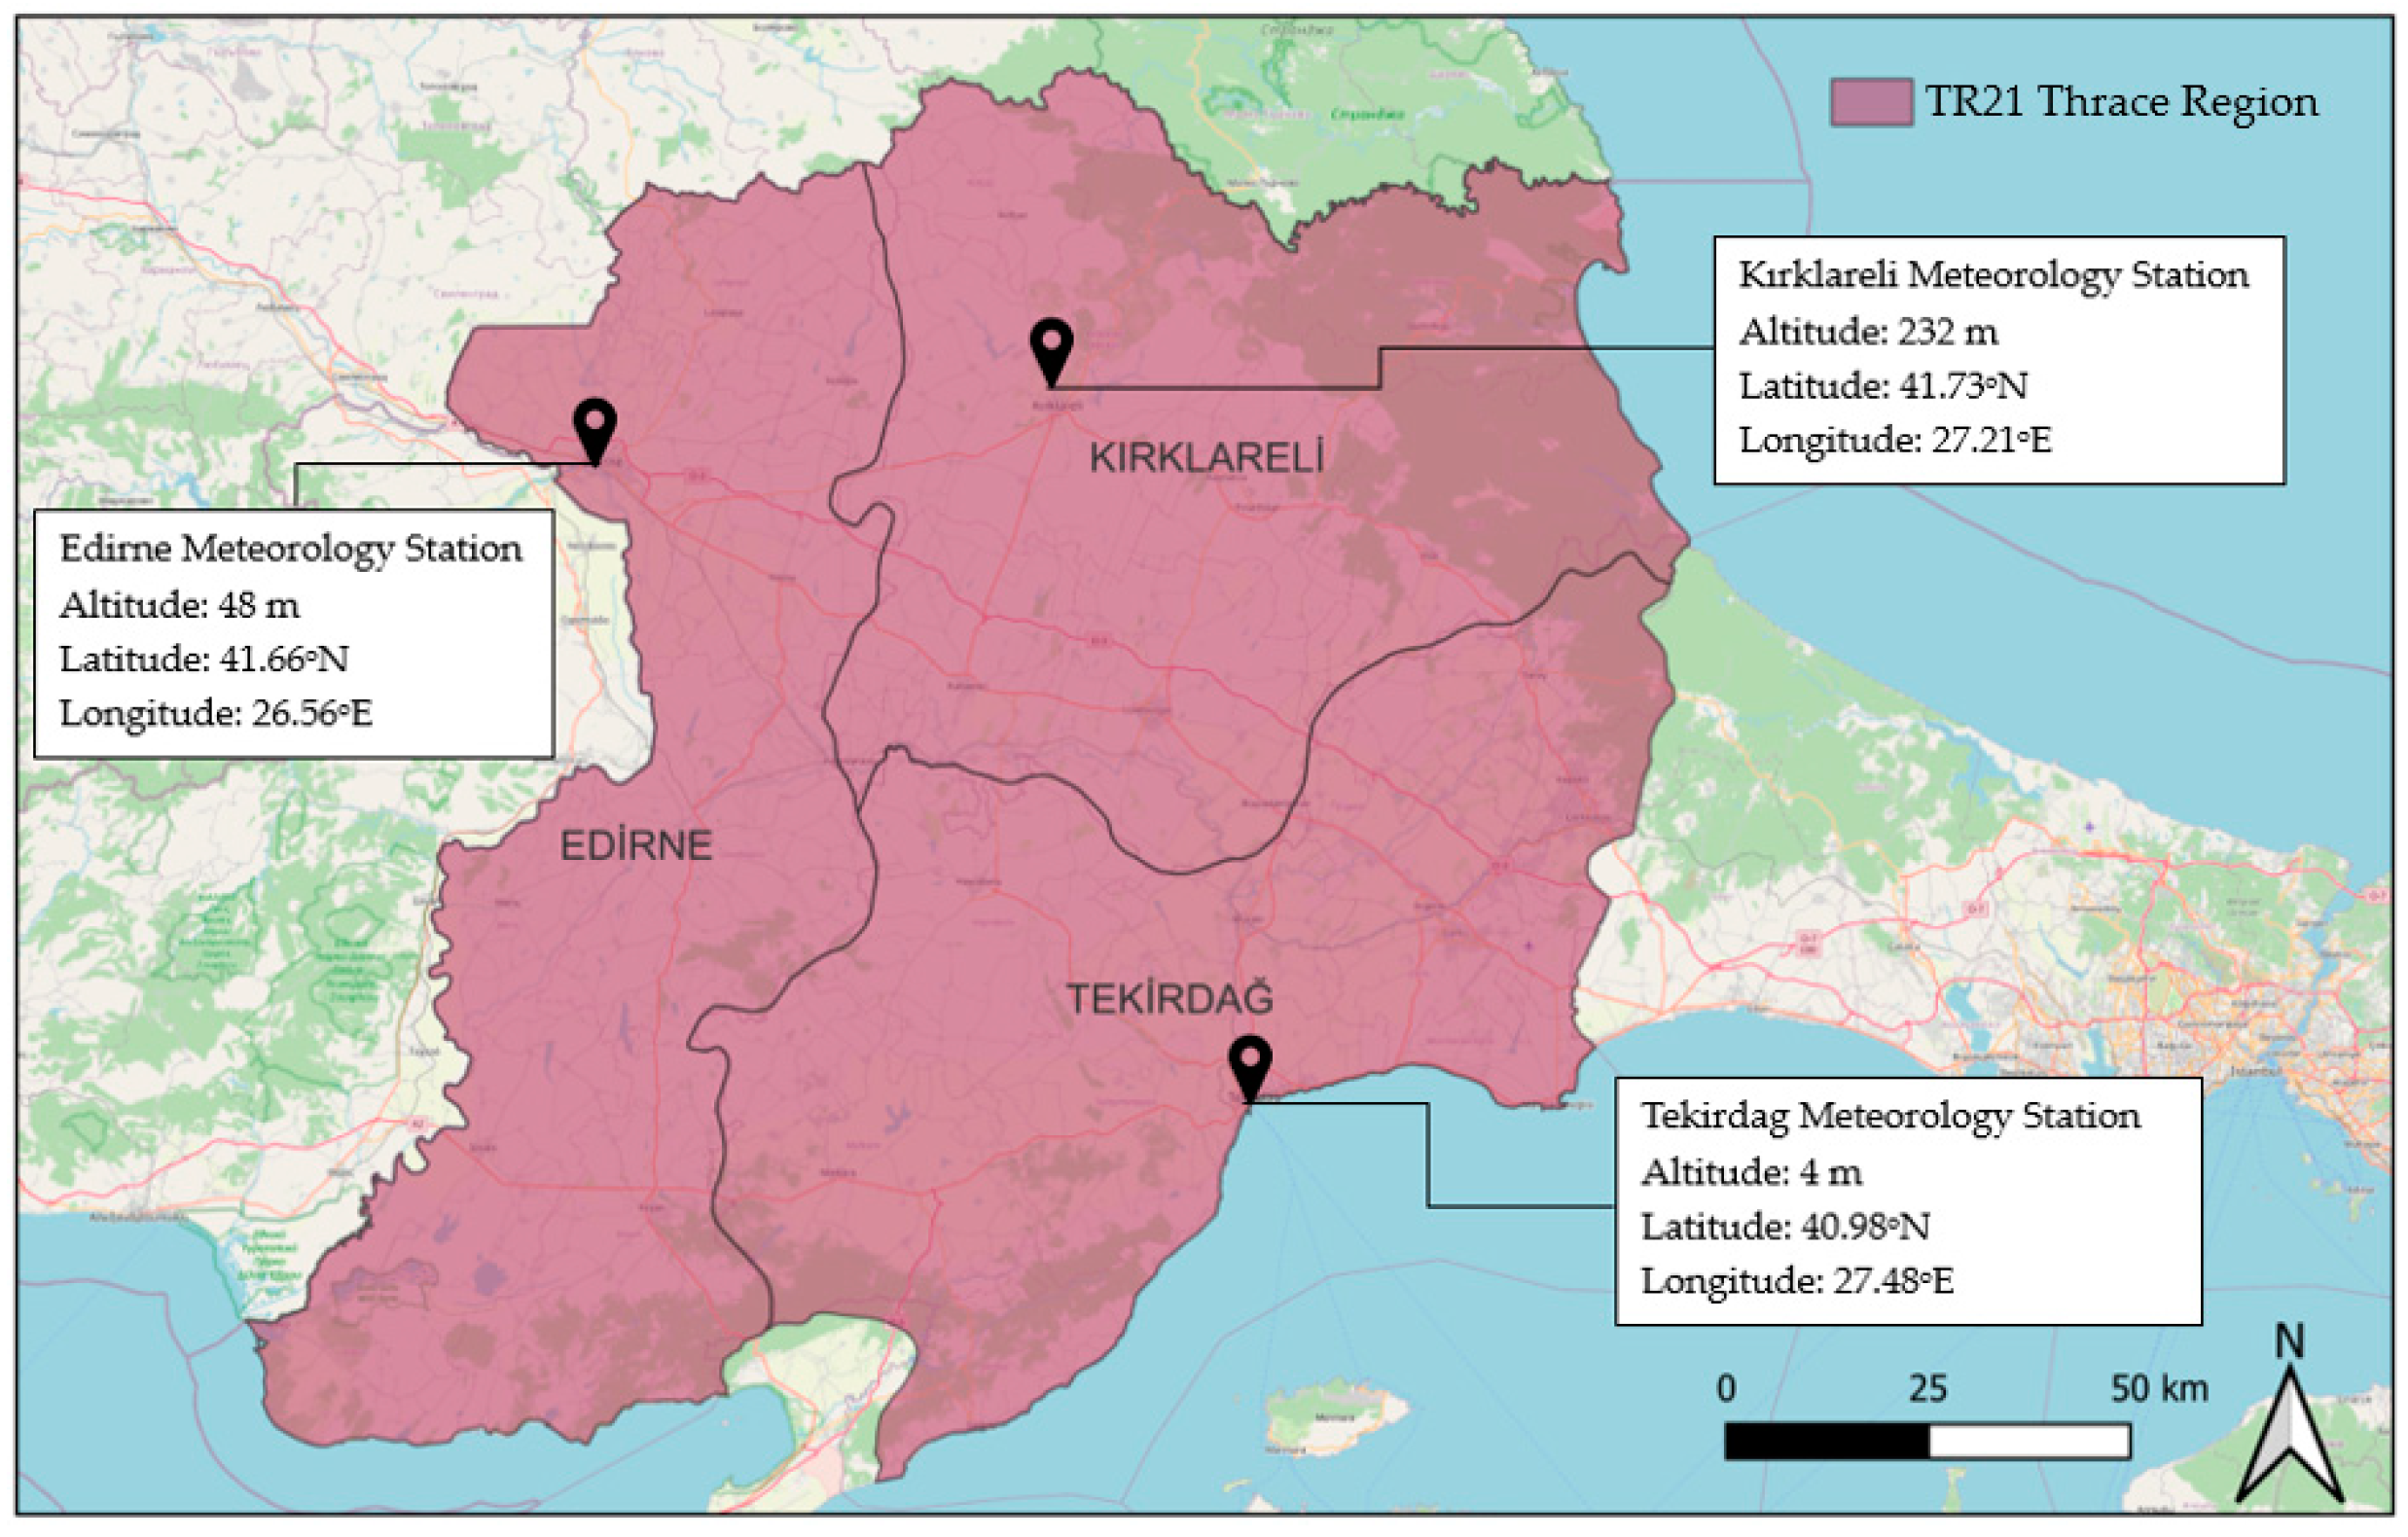
2.1. Research Area

TR21 Thrace Region covers the Tekirdağ, Edirne, and Kırklareli provinces. Its surface area (excluding lakes) is 18,665 km2 [22]. The research area is between 26°01′49″–28°08′41″ east longitudes and 40°32′24″–42°06′35″ north latitudes. It corresponds to a significant part of the Thracian Peninsula, which forms the eastern extension of the European continent [23]. The location of the research area and the location of the meteorological stations where climate data were obtained are shown in Figure 1. Soils of the TR21 Thrace Region are very coarse textured (3%) (sandy-S, loamy sand-LS), slightly coarse textured (33%) (sandy loam-SL, sandy clay loam-SCL), medium-light textured (23%) (silty loam-SiL), silty clay loam-SiCL), medium-heavy textured (29%) (clay loam-CL, loam-L), slightly heavy textured (2%) (silty-Si, sandy clay-SC), and heavy textured (10%) (silty clay-SiC, clay-C) [24].

2.2. Climate of the Research Area

The region has quite different climatic variations. On the Black Sea coast is the typical humid, cool and rainy Black Sea climate; inland is the typical Continental climate with hot and dry summers and cold winters; in the south and southwest and locally on the Black Sea coast, the typical Mediterranean climate is observed, with hot and dry summers and mild and rainy winters [26]. Table 3 shows the long-term average climate data of three provinces (Tekirdağ, Edirne, Kırklareli) in the TR21 Thrace Region. The province with the highest annual average temperature is Edirne (14.1 °C) and the lowest is Kırklareli (13.3 °C). While Edirne has the highest average annual maximum temperature and total precipitation, Tekirdağ has the lowest. The annual average minimum temperature is highest in Tekirdağ (10.5 °C) and lowest in Edirne (8.5 °C).

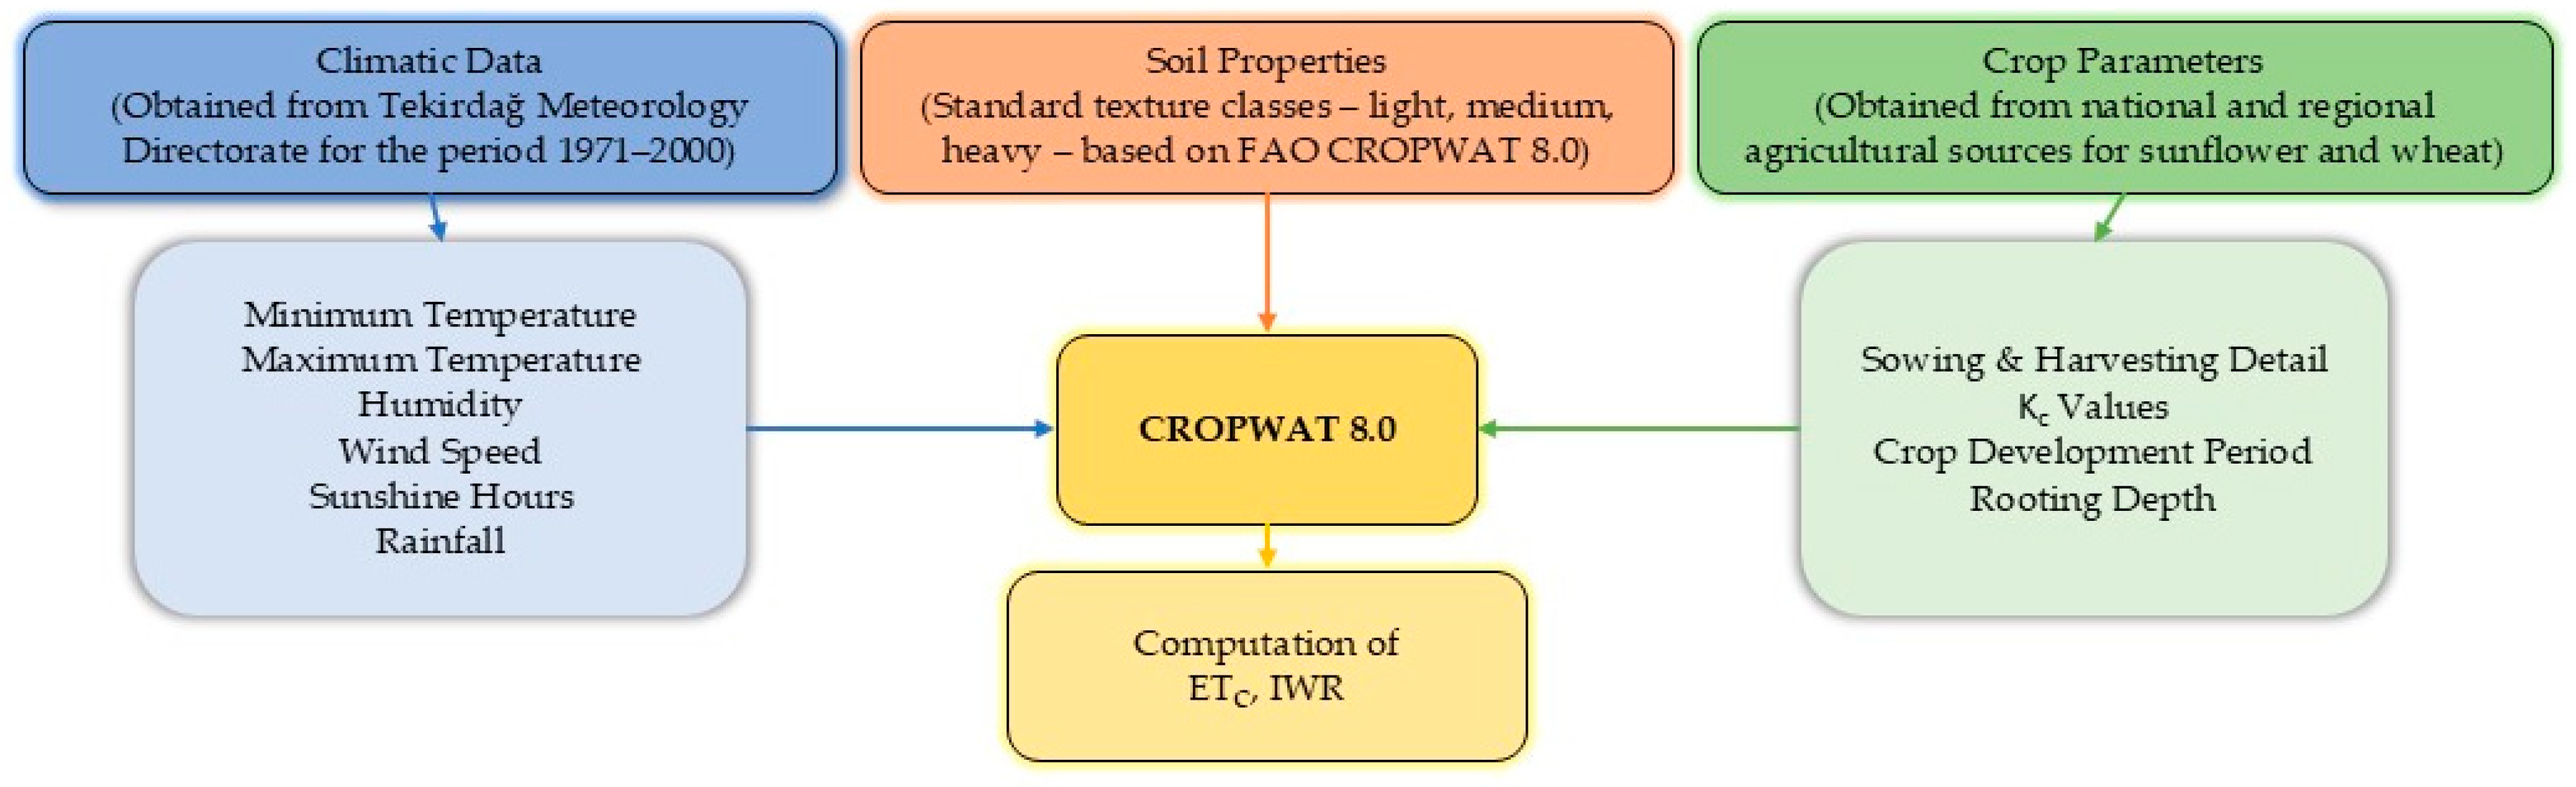
2.3. Climate Data Used in the Research

In this study, climate data for the period 1971–2000 were obtained from Tekirdağ Meteorology Directorate. These data consist of minimum temperature (°C), mean temperature (°C), maximum temperature (°C), relative humidity (%), precipitation (mm), wind speed (m sec−1), and sun hours (hours).

2.4. Plant Data Used in the Research

Plant characteristics of wheat and sunflower used in the research are shown in Table 4. The data consist of crop development period (initial, development, mid-season, late-season), crop coefficient (initial, mid-season, late-season), rooting depth (initial, late-season), sowing date, vegetation duration, critical depletion (fraction), and yield response factor data. The plant coefficient values, planting and harvesting dates of sunflower and wheat plants specific to the provinces have been determined [30].

2.5. Soil Data Used in the Research

In the research area, soil data defined as light (sand), medium (loam) and heavy (clay) available in CROPWAT 8.0 were used. The characteristics of the soil types are shown in Table 5.

2.6. CROPWAT 8.0

CROPWAT 8.0 is a model developed by the Land and Water Development Division of FAO (the Food and Agriculture Organization of the United Nations) [36]. Climate, plant, and soil data are entered into the model. The climate data used as input in the model are shown in detail in Figure 2, plant data in Table 4 and Figure 2, and soil data in Table 5. CROPWAT is designed to perform basic tasks such as calculating reference evapotranspiration (ETo), evapotranspiration (ETc), irrigation water requirements (IWR), and irrigation scheduling.

2.7. Method

In this study, the CROPWAT 8.0 model was used to calculate total net irrigation water, and the stages of this process are summarized in Figure 2. The reason for choosing this model is primarily that it is a standardized and internationally recognized tool. The model is applicable rather than innovative. Many researchers believe that the model is accurate and reliable [37,38,39].
In the first stage, the model’s “Climate/ETo” module used the FAO Penman–Monteith method to determine reference evapotranspiration (ETo) [36]. This method is a standard calculation approach that provides accurate and reliable ETo values by taking into account atmospheric conditions. Meteorological data such as min–max temperature (°C), relative humidity (%), wind speed (m s−1), and sun hours (h) for the period 1971–2000 were used for ETo calculations. The climate data used as inputs in the model were obtained from the Tekirdağ Meteorology Directorate. These data cover the climate data between 1971–2000. Previously, the “Climate Change Projections for Türkiye with New Scenarios” project was carried out by the General Directorate of Meteorology in Türkiye [40] and the “Impact of Climate Change on Water Resources Project” by the General Directorate of Water Management of the Ministry of Forestry and Water Affairs of the Republic of Türkiye [41]. In both projects, the reference period was taken as the 1971–2000 period, and future projections were produced. Many studies have been conducted and continue to be conducted in Türkiye and the TR21 Thrace Region with the obtained data. Therefore, the 1971–2000 period was preferred in order for these studies to be comparable. In addition, the temperature increase that has continued globally since the 1980s has been observed in Türkiye since the 1990s [42]. Therefore, it was thought that the climate data from the 1971–2000 period have a more appropriate representative power.
In the second stage, in the “Rain” module, effective precipitation (Peff) values were computed using the USDA (United States Department of Agriculture) methodology. The derived Peff values were utilized to ascertain the total irrigation need.
In the third stage, the plant data model was inputted through the “Crop” module. Plant data were generally obtained from FAO, the literature on plants specific to the region, and the guide called “Plant Water Consumption of Irrigated Plants in Türkiye”, published by the General Directorate of Agricultural Research and Policies (Table 4) [30]. This guide includes Kc values, planting–sowing dates, and development period lengths for ETc calculation for all plants grown throughout Türkiye. There is no field trial conducted under standard conditions and with the necessary sensitivity in terms of soil water budget for all plants in Türkiye. Therefore, in obtaining Kc values in this guide, scientific result reports and publications produced from field trials conducted in Türkiye, international result reports, postgraduate theses, scientific publications, and the FAO-56 [43] book were used [30]. The wheat and sunflower statistics from the TR21 Thrace Region were incorporated into the model based on the information acquired from these sources.
In the fourth stage, the soil properties were entered into the model based on the three soil types defined by the model in the “Soil” module (light—sandy, medium—loamy, heavy—clayey) (Table 5). At this stage, the total available water (TAW), maximum infiltration rate, and root depth, which are important soil parameters affecting irrigation planning, were taken into account. The total available water amount in the soil is calculated with the following formula (Equation (1)) [43]
T A W = 1000 × ( θ F C θ W P ) × Z r
where
  • TAW: The total available soil water in the root zone (mm),
  • θ F C : The water content at field capacity (m3 m−3),
  • θ W P : The water content at wilting point (m3 m−3),
  • Z r : The rooting depth (m).
The part of this value that is shown to be water stressed by the plant is defined as readily available water (RAW) and is calculated as follows (Equation (2)) [43]
R A W = p × T A W
where
  • RAW: the readily available soil water in the root zone (mm);
  • p: average fraction of total available soil water (TAW) that can be depleted from the root zone before moisture stress (reduction in ET) occurs.
Finally, in the “CWR” module, all climate, plant, and soil data were consolidated to calculate crop water requirement (ETc) and net irrigation water requirement (IWR). These calculations were made with Equations (3) and (4)
ETc = ETo × Kc
where
  • ETc: Evapotranspiration (mm day−1)
  • ETo: Reference evapotranspiration (mm day−1)
  • kc: Plant coefficient
and
IWR = ETc − Peff
where
  • IWR: Irrigation water requirement (mm day−1)
  • ETc: Evapotranspiration (mm day−1)
  • Peff: Effective rainfall (mm day−1)

3. Results

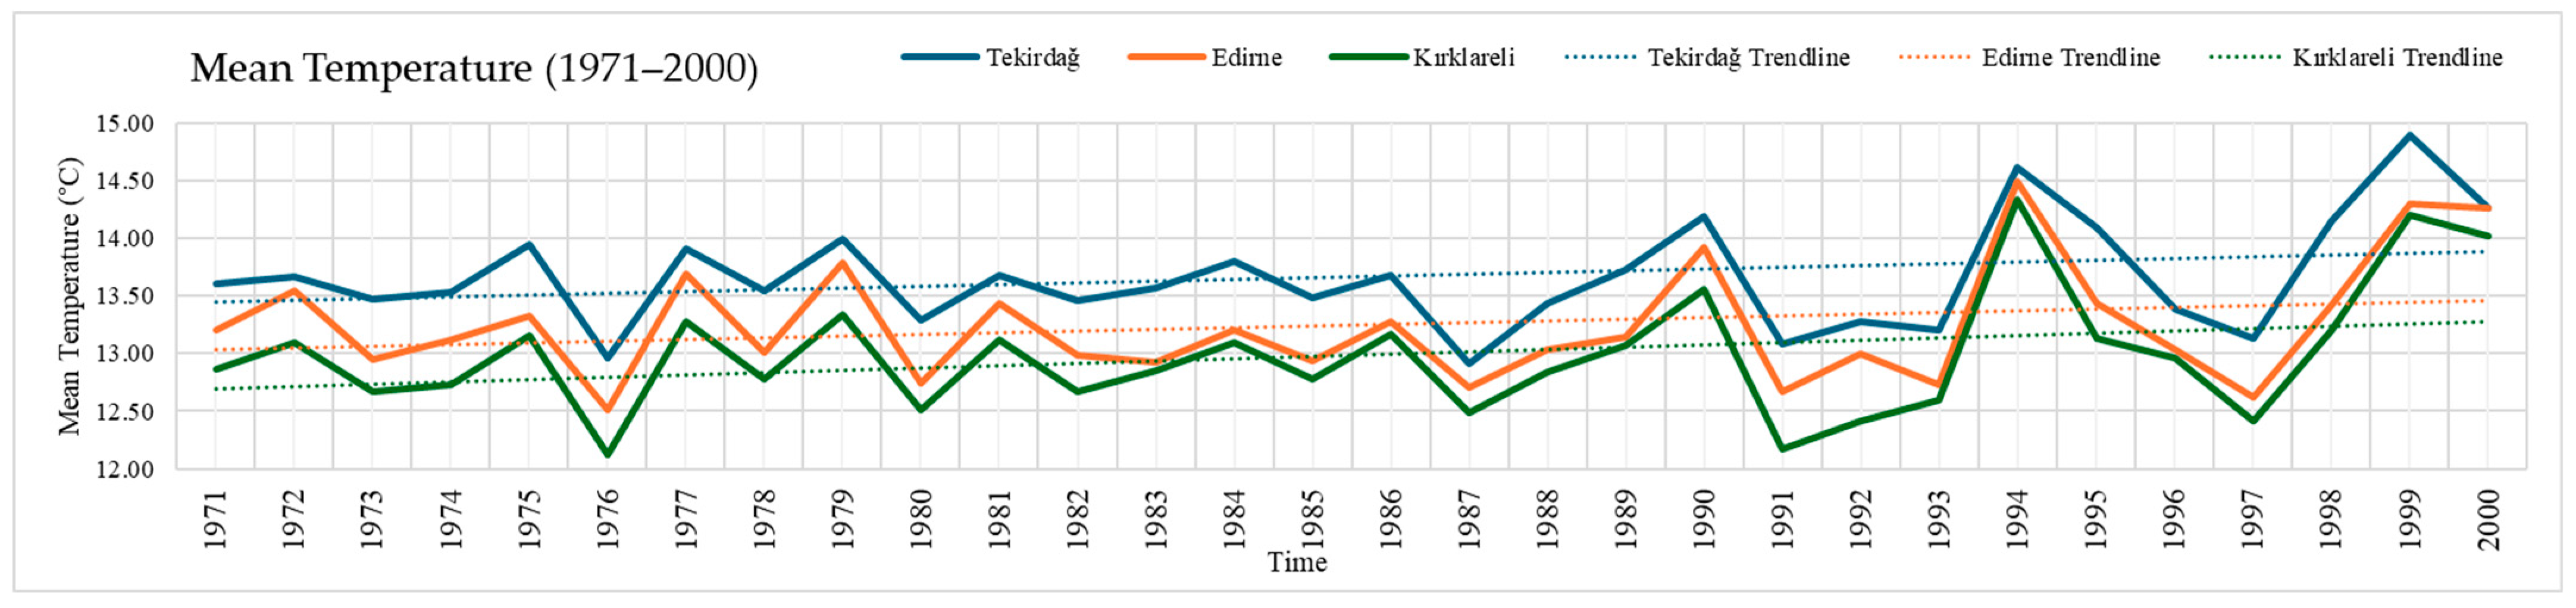
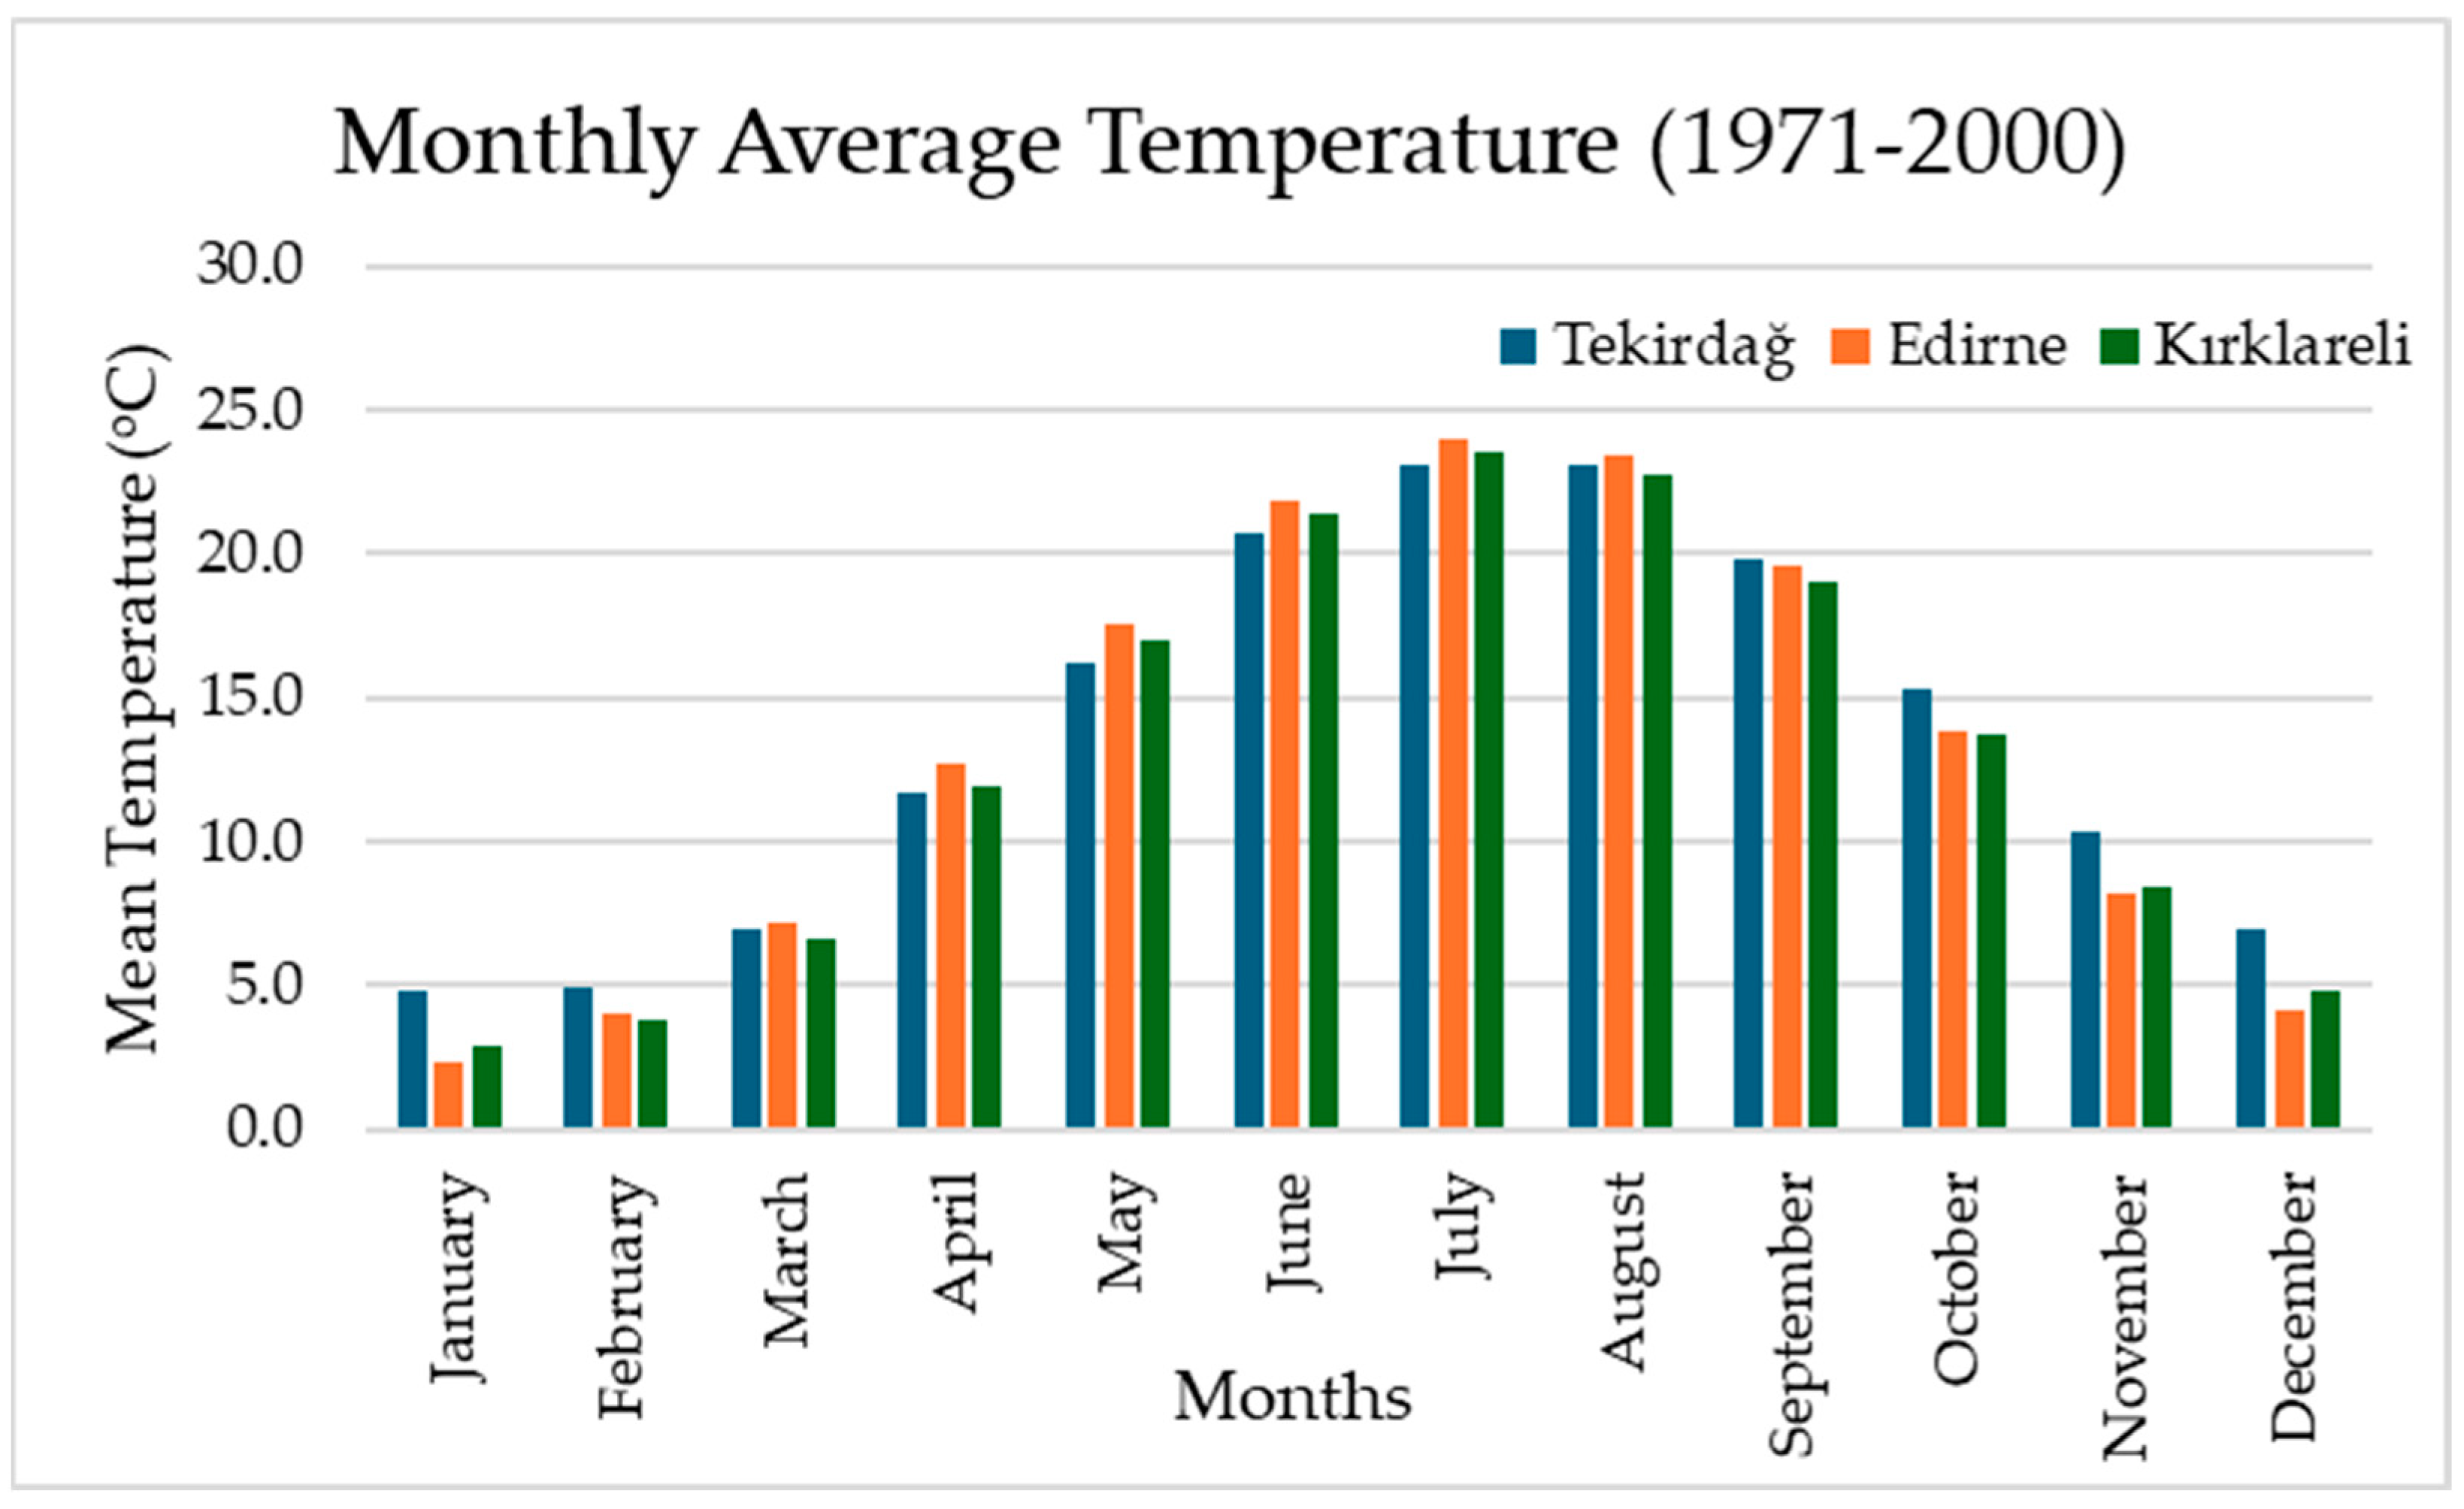
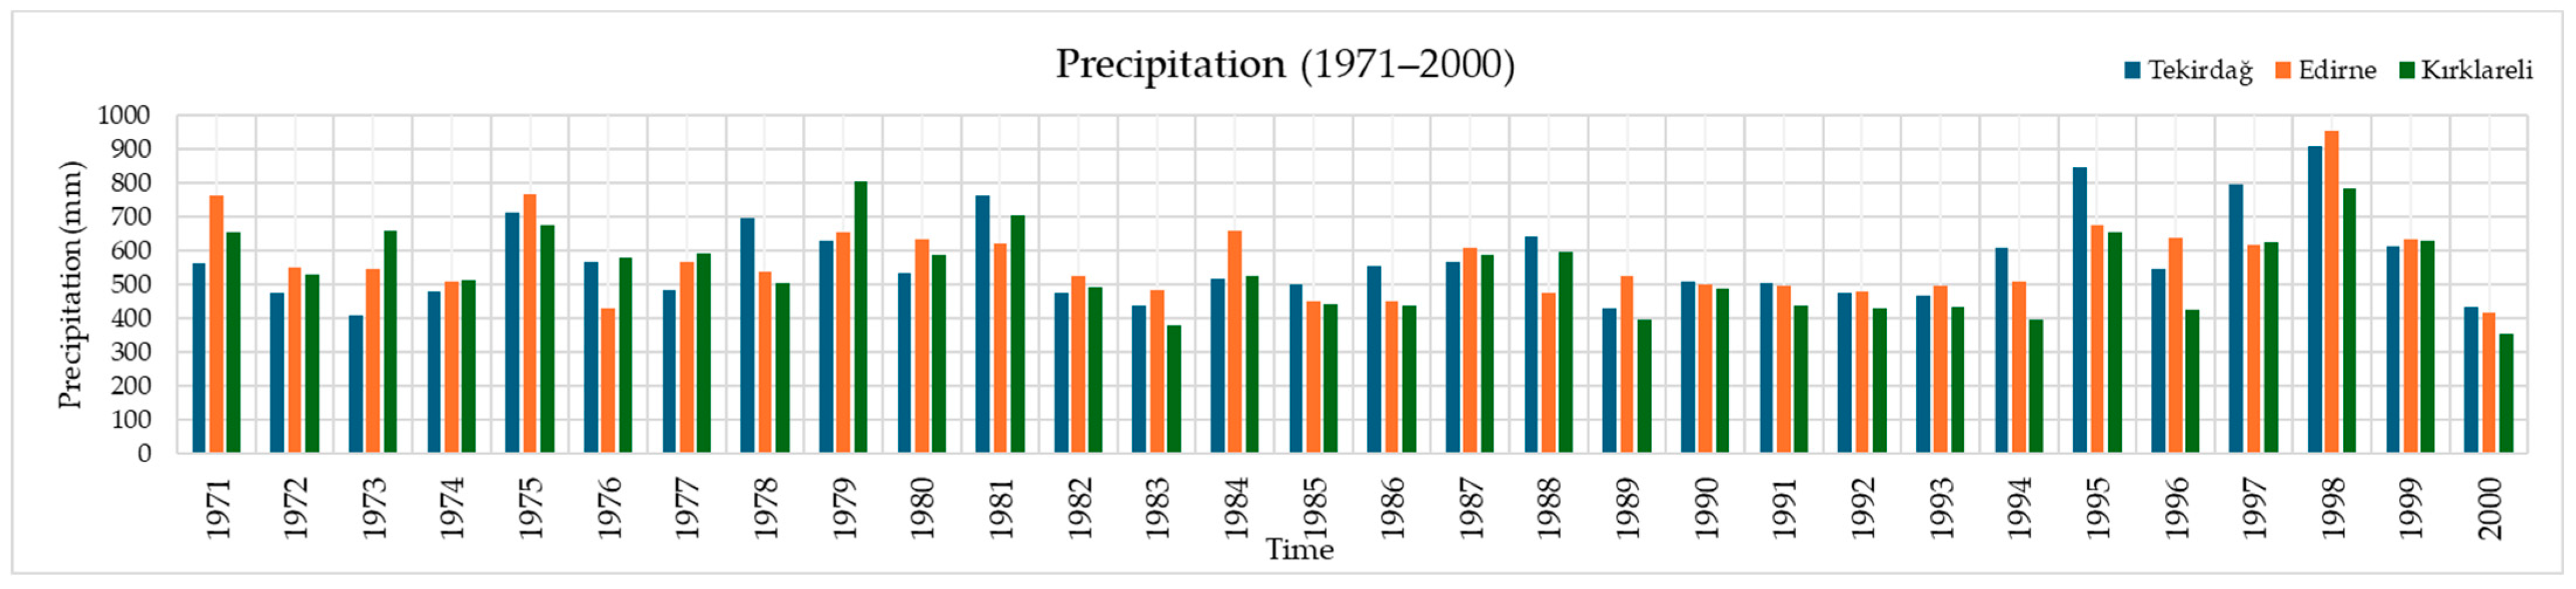
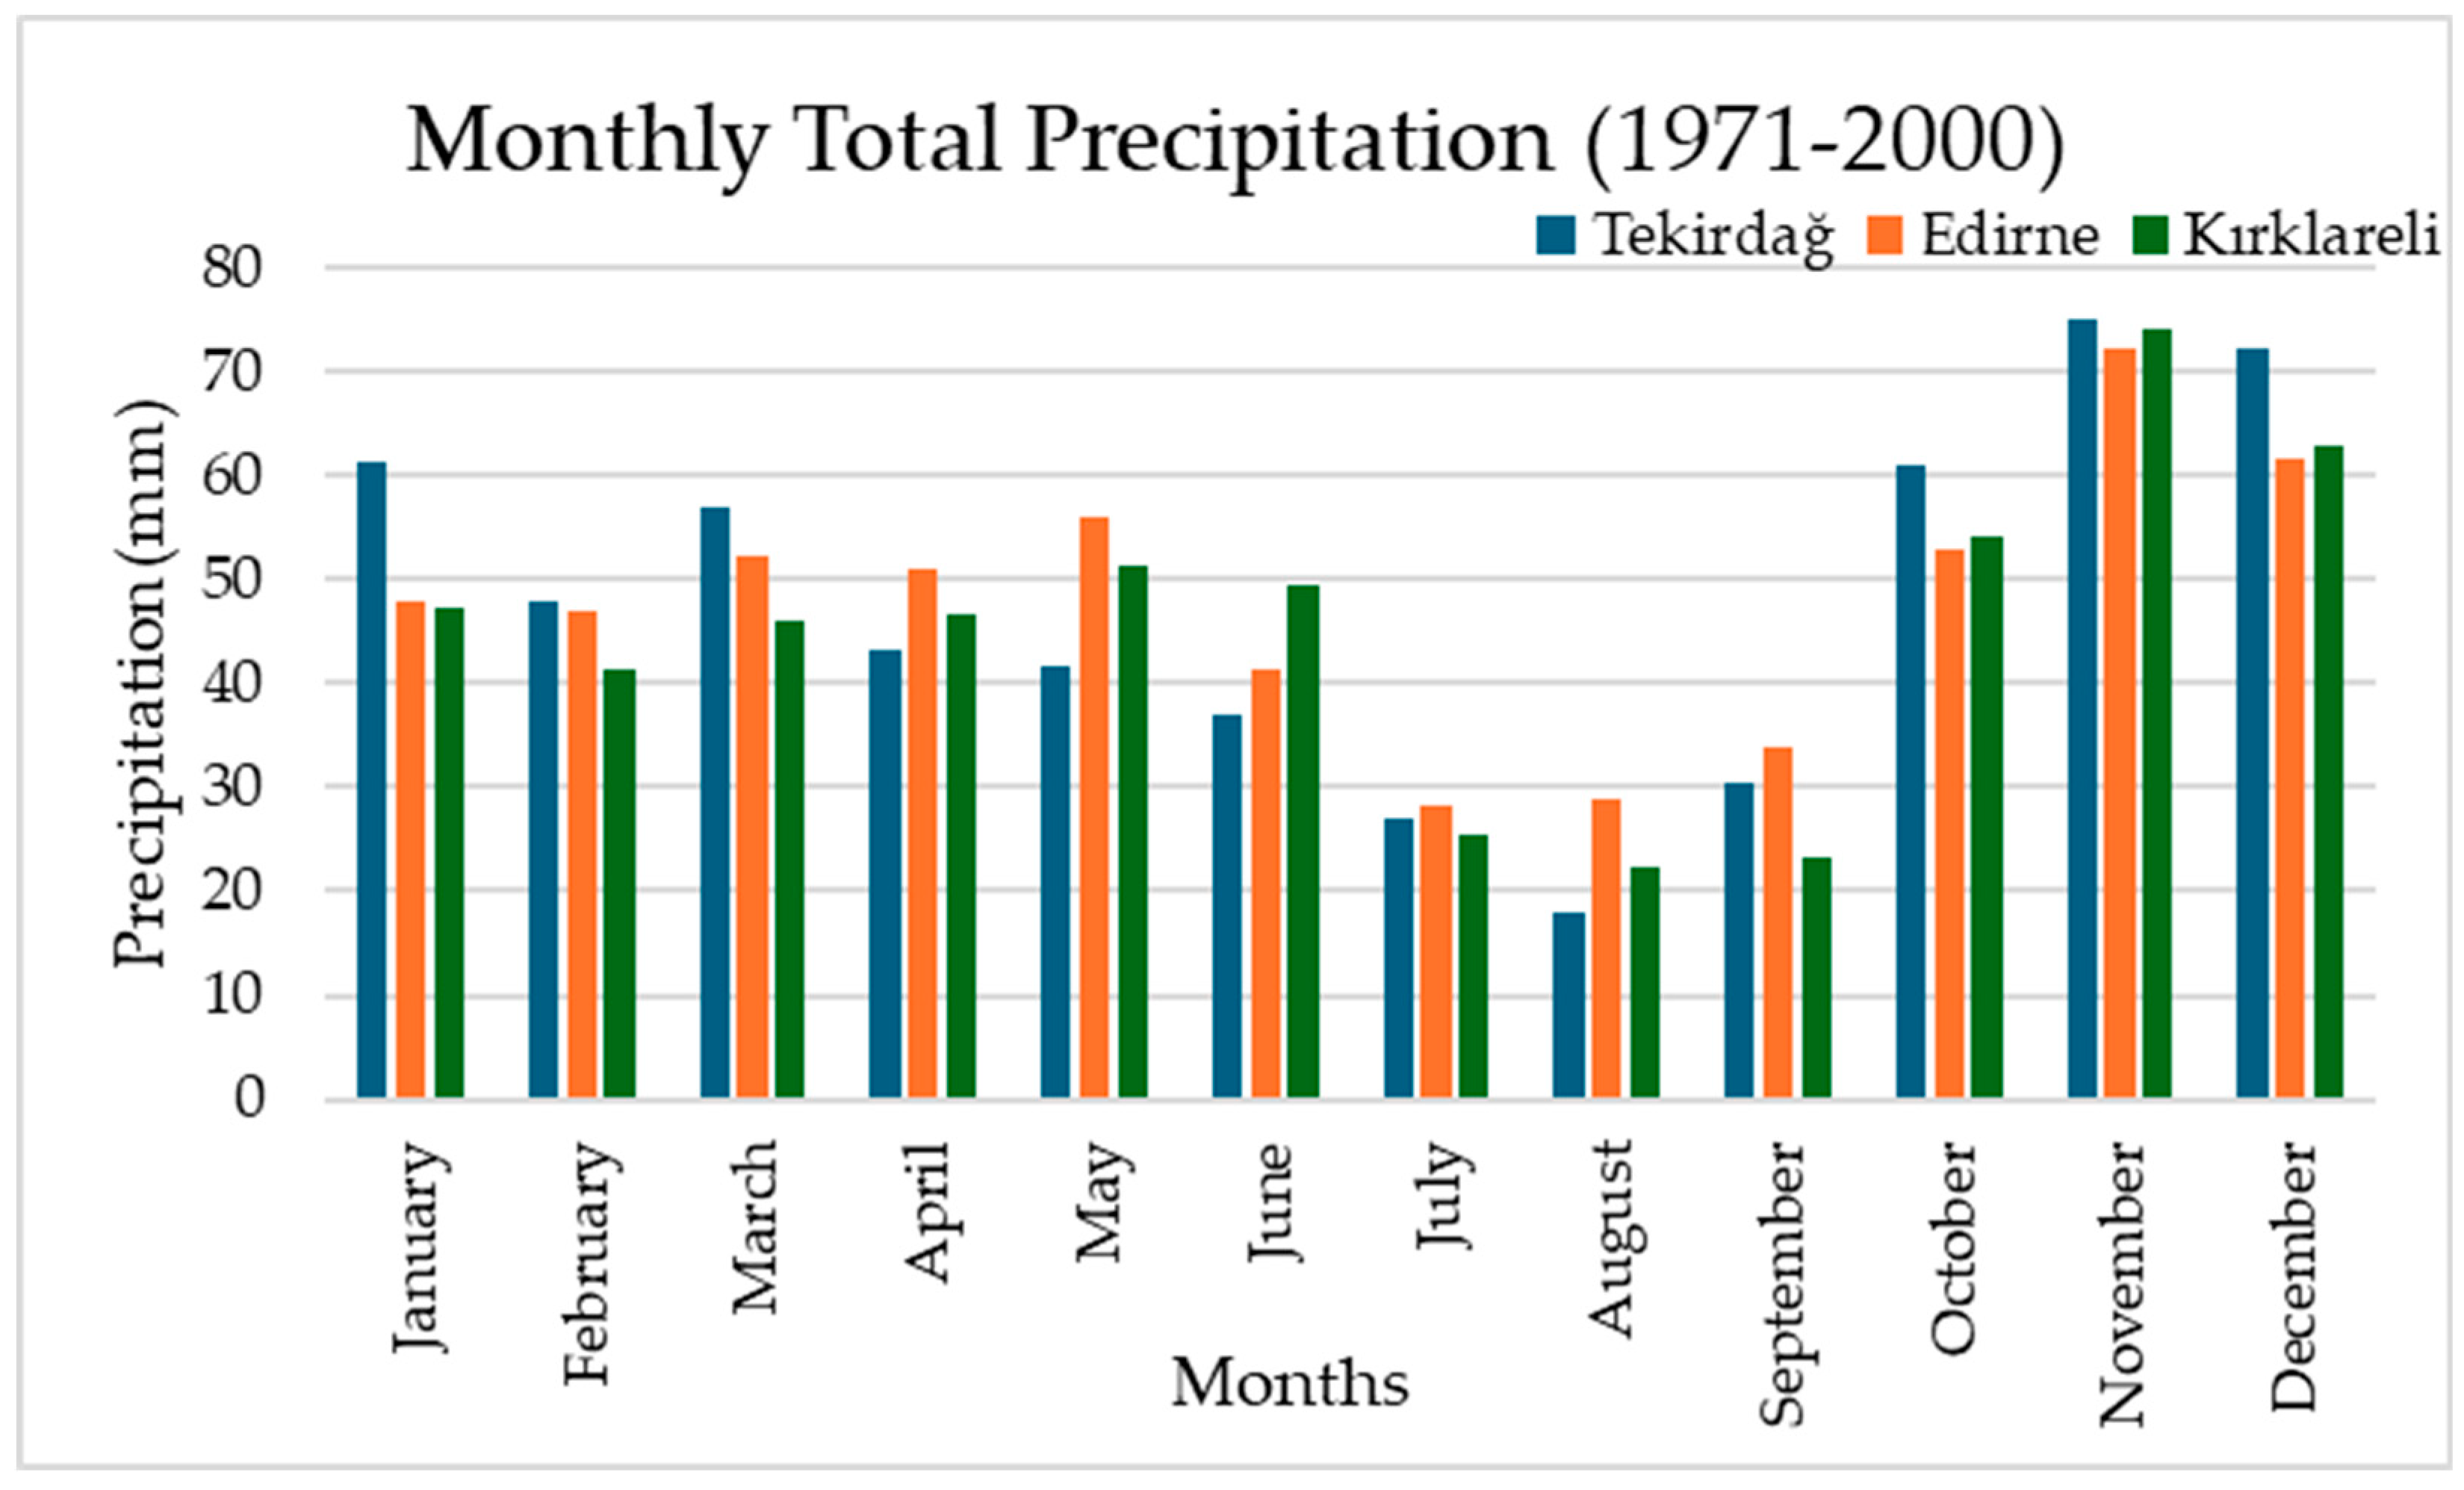
3.1. Changes in Temperature and Precipitation in Tekirdağ, Edirne, and Kırklareli Provinces During the 1971–2000 Period

An analysis of the annual average temperature values for Tekirdağ, Edirne, and Kırklareli provinces during the 1971–2000 period revealed a generally similar trend (Figure 3). Although the annual average temperatures in all three provinces are relatively similar, Tekirdağ consistently exhibits higher temperature values compared to Edirne and Kırklareli for most of the year. Kırklareli had the lowest temperatures in most years. Over the 30-year period, the average temperature is recorded as 13.7 °C in Tekirdağ, 13.2 °C in Edirne, and 13.0 °C in Kırklareli. The graph indicates significant temperature increases in 1990, 1994, and 1999, while decreases are observed in 1976, 1980, 1987, 1991, and 1997. These fluctuations are believed to be associated with seasonal or climatic events. Furthermore, a general warming trend is observed in the region from the 1970s to 2000.
Figure 4 presents the monthly average temperature values for Tekirdağ, Edirne, and Kırklareli provinces during the 1971–2000 period. According to these data, the monthly temperature values exhibit a distinct seasonal pattern, reaching their lowest levels in January and February and peaking in July and August. The hottest months occur during the summer, leading to an increased irrigation demand in agricultural production during these periods. During the summer months, rising temperatures significantly increase plant water consumption (evapotranspiration), which, in turn, raises irrigation water demand. This increase varies depending on soil texture, with distinct impacts observed in light, medium, and heavy textured soils. Additionally, although temperature differences between the provinces are minimal, Edirne exhibits slightly higher temperature values compared to the other provinces during certain summer months.
An analysis of precipitation data for the 1971–2000 period reveals differences in the annual total precipitation amounts among Tekirdağ, Edirne, and Kırklareli provinces (Figure 5). Over the 30-year period, the annual total rainfall averages are 572 mm for Tekirdağ, 574 mm for Edirne, and 545 mm for Kırklareli. In Figure 5, while Tekirdağ, Edirne, and Kırklareli exhibit differing annual precipitation trends, the 30-year average values reveal that Edirne and Tekirdağ have similar precipitation levels, whereas Kırklareli falls behind. Additionally, the graph illustrates significant fluctuations in annual precipitation amounts. Notably, rainfall amounts in all three provinces were above the period average in 1998, while the lowest rainfall amounts were recorded in 2000. This situation is believed to have significant impacts on agricultural areas and water resources. Although no significant increasing or decreasing trend was observed during the 1971–2000 period, fluctuations in annual precipitation data suggest the presence of a variable precipitation regime in the TR21 Thrace Region.
An examination of the monthly total precipitation data for the 1971–2000 period in Tekirdağ, Edirne, and Kırklareli provinces reveals significant seasonal variations in precipitation amounts throughout the year (Figure 6). October, November, and December are the months with the highest recorded rainfall in all three provinces. This indicates that the autumn and winter months in the region are richer in precipitation. A significant reduction in precipitation is observed during the summer months, particularly in July and August. This decrease is below 30 mm in all provinces. Additionally, while differences in precipitation between the provinces are minimal, Tekirdağ exhibits slightly higher precipitation values compared to the other provinces in certain months.

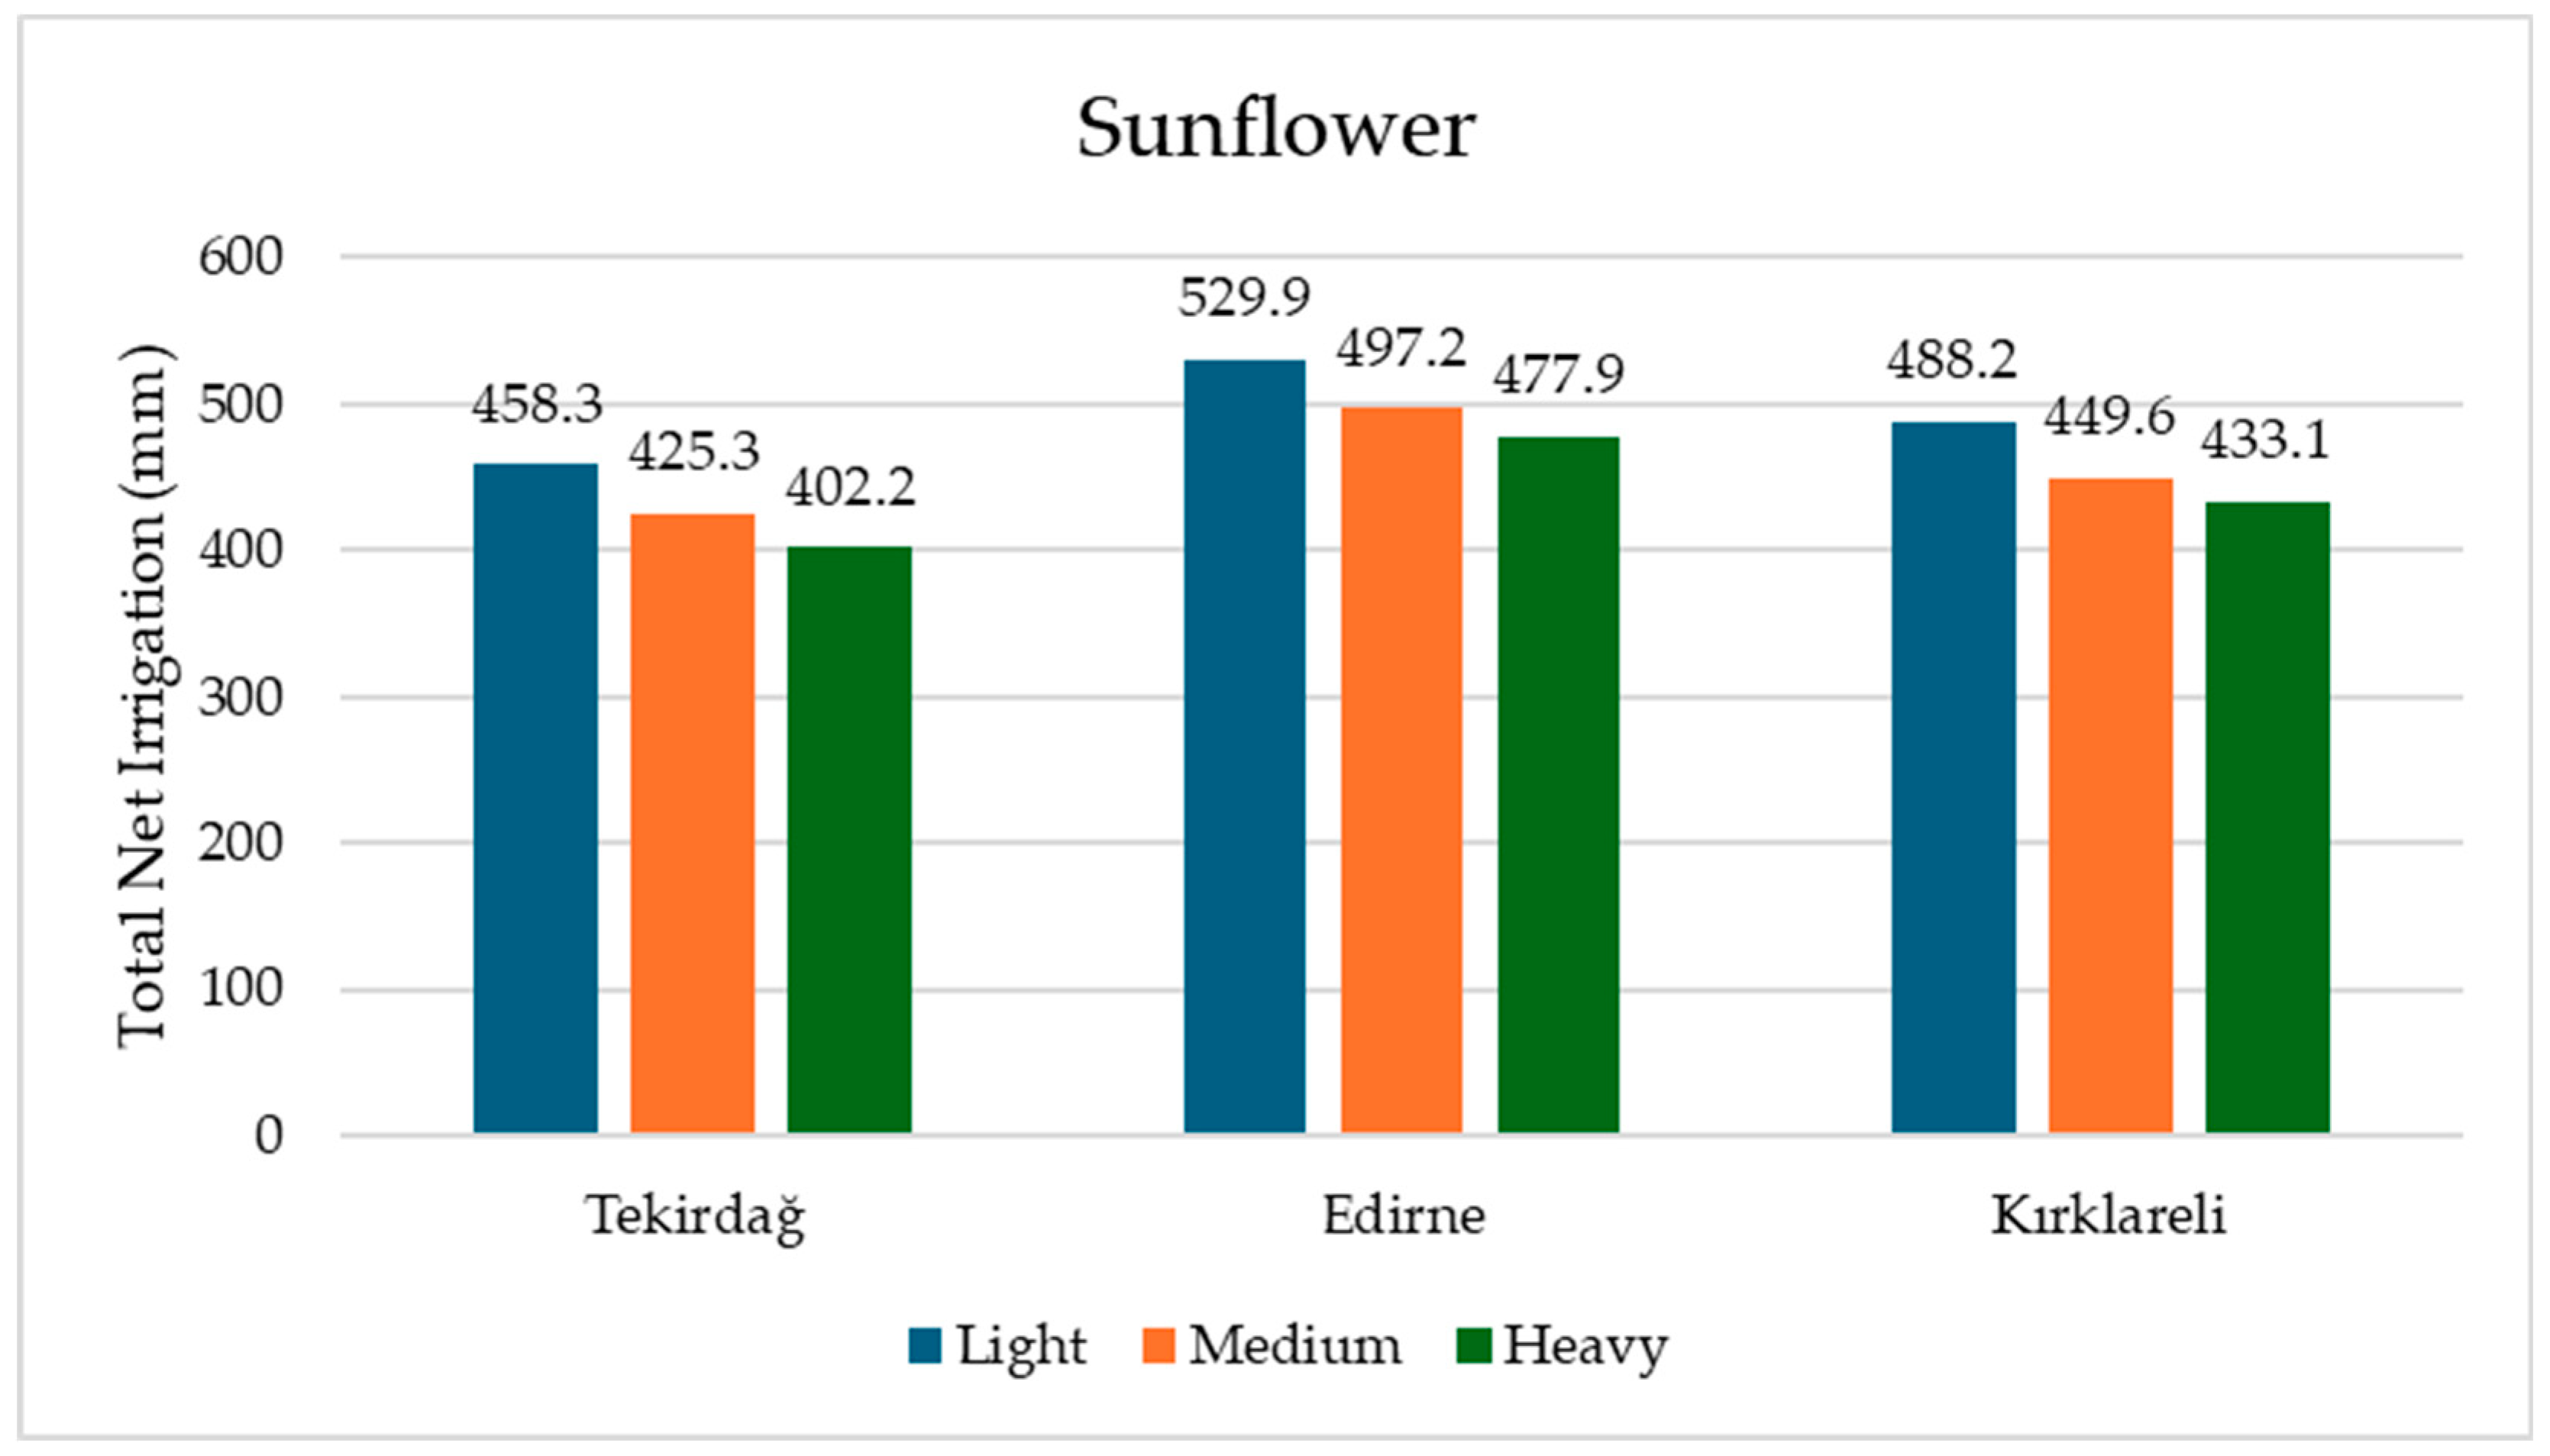
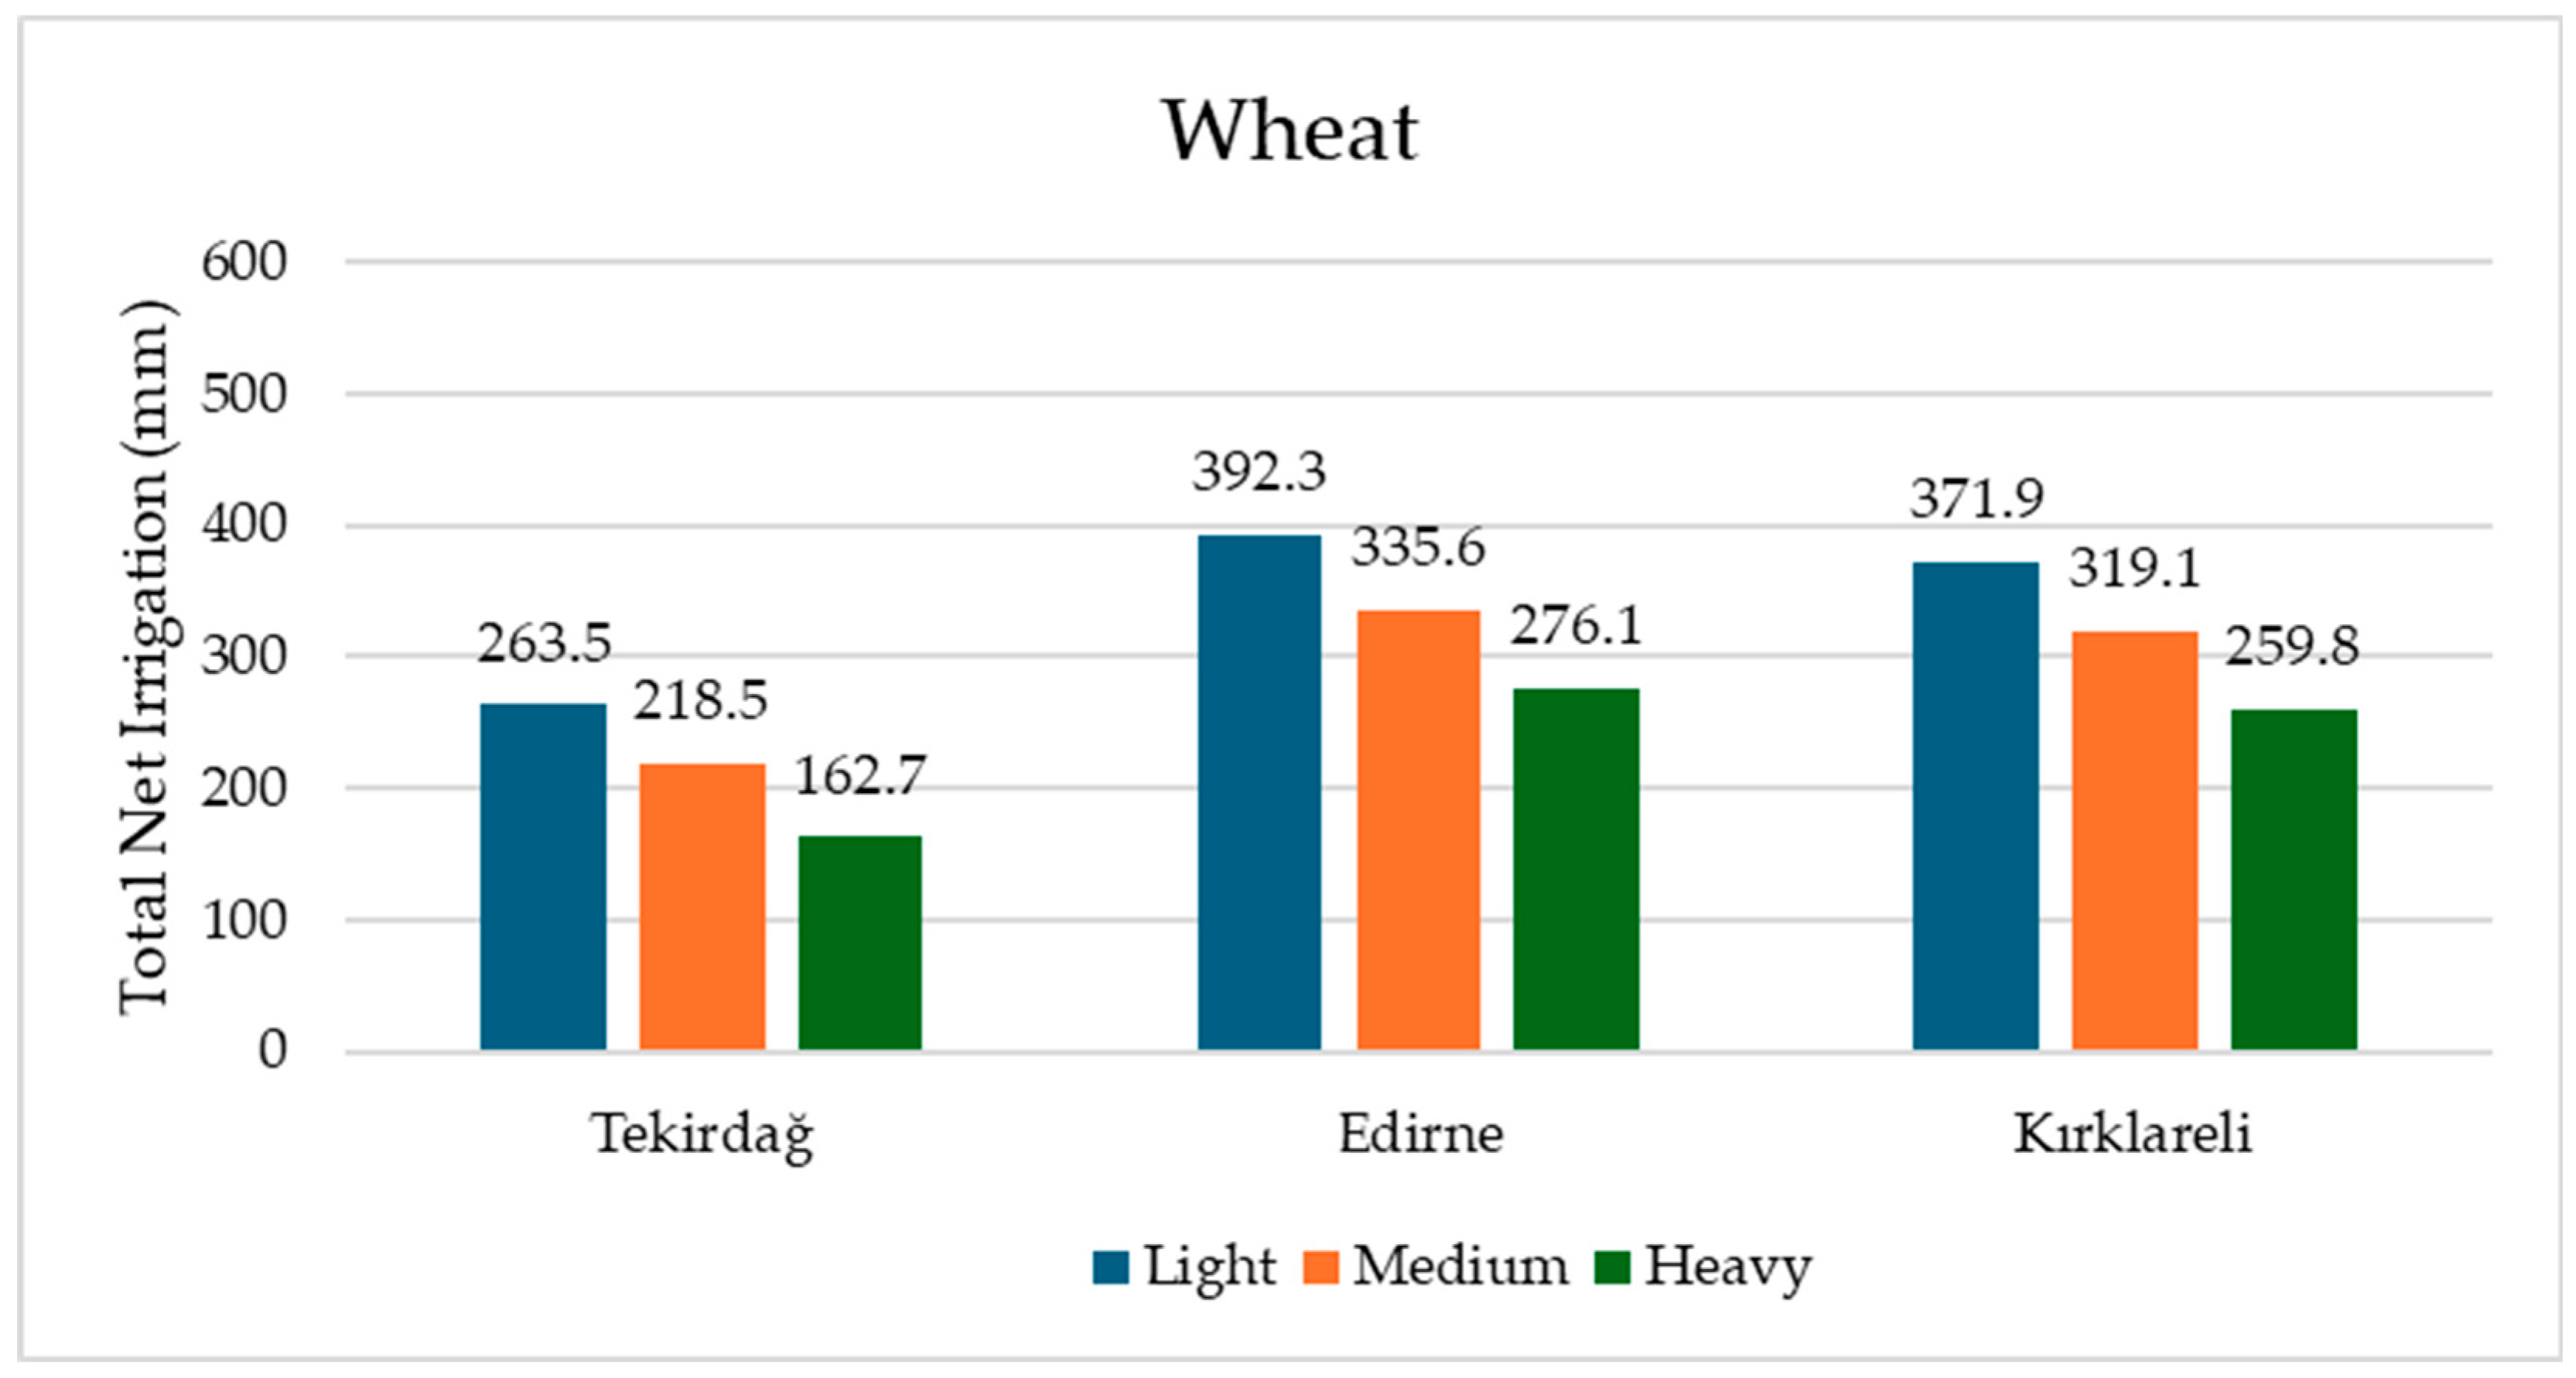
3.2. The Effects of Different Soil Textures on Total Net Irrigation Water Requirements for Sunflower and Wheat Crops in Tekirdağ, Edirne, and Kırklareli During the 1971–2000 Period

The effects of different soil textures (light, medium, and heavy) on the total net irrigation water requirements for sunflower and wheat in Tekirdağ, Edirne, and Kırklareli provinces within the TR21 Thrace Region during the 1971–2000 period are presented in Figure 7 and Figure 8. The figures clearly show that the irrigation water requirements for light, medium, and heavy textured soils in Edirne are higher for both sunflower and wheat compared to Kırklareli and Tekirdağ. Specifically, the irrigation water requirement is highest in Edirne, followed by Kırklareli, and lowest in Tekirdağ. The average total net irrigation water requirement for sunflower is Edirne (501.7 mm) > Kırklareli (456.9 mm) > Tekirdağ (428.6 mm); similarly, for wheat, it is Edirne (334.6 mm) > Kırklareli (316.9 mm) > Tekirdağ (214.9 mm). Overall, the total net irrigation water requirement for sunflower was found to be higher than that for wheat (Figure 7 and Figure 8). In Tekirdağ, Edirne, and Kırklareli provinces, on average, the total net irrigation water requirement for sunflower in three different soil types was 492.1 (light) mm, 457.4 mm (medium), and 437.2 mm (heavy), while for wheat it was 342.5 (light) mm, 291.0 mm (medium), and 232.9 mm (heavy). In both sunflower and wheat, light-textured soils required the highest irrigation water in all three provinces, whereas medium- and heavy-textured soils exhibited lower irrigation requirements (Figure 7 and Figure 8).
Table 6 presents an evaluation of the changes in total net irrigation water requirements for sunflower and wheat across different soil textures in Tekirdağ, Edirne, and Kırklareli. Total net irrigation water requirement for sunflower decreased by 7.1% in medium-textured soils compared to light-textured soils, by 11.1% in heavy-textured soils compared to light-textured soils, and by 4.3% in heavy-textured soils compared to medium-textured soils in Tekirdağ, Edirne, and Kırklareli provinces. For wheat, total net irrigation water requirement decreased by 15.0% in medium-textured soils compared to light-textured soils, by 32.0% in heavy-textured soils compared to light-textured soils, and by 20.0% in heavy-textured soils compared to medium-textured soils (Table 6). The analysis also highlights that soil texture significantly impacts the irrigation water needs of both crops in Tekirdağ, Edirne, and Kırklareli.

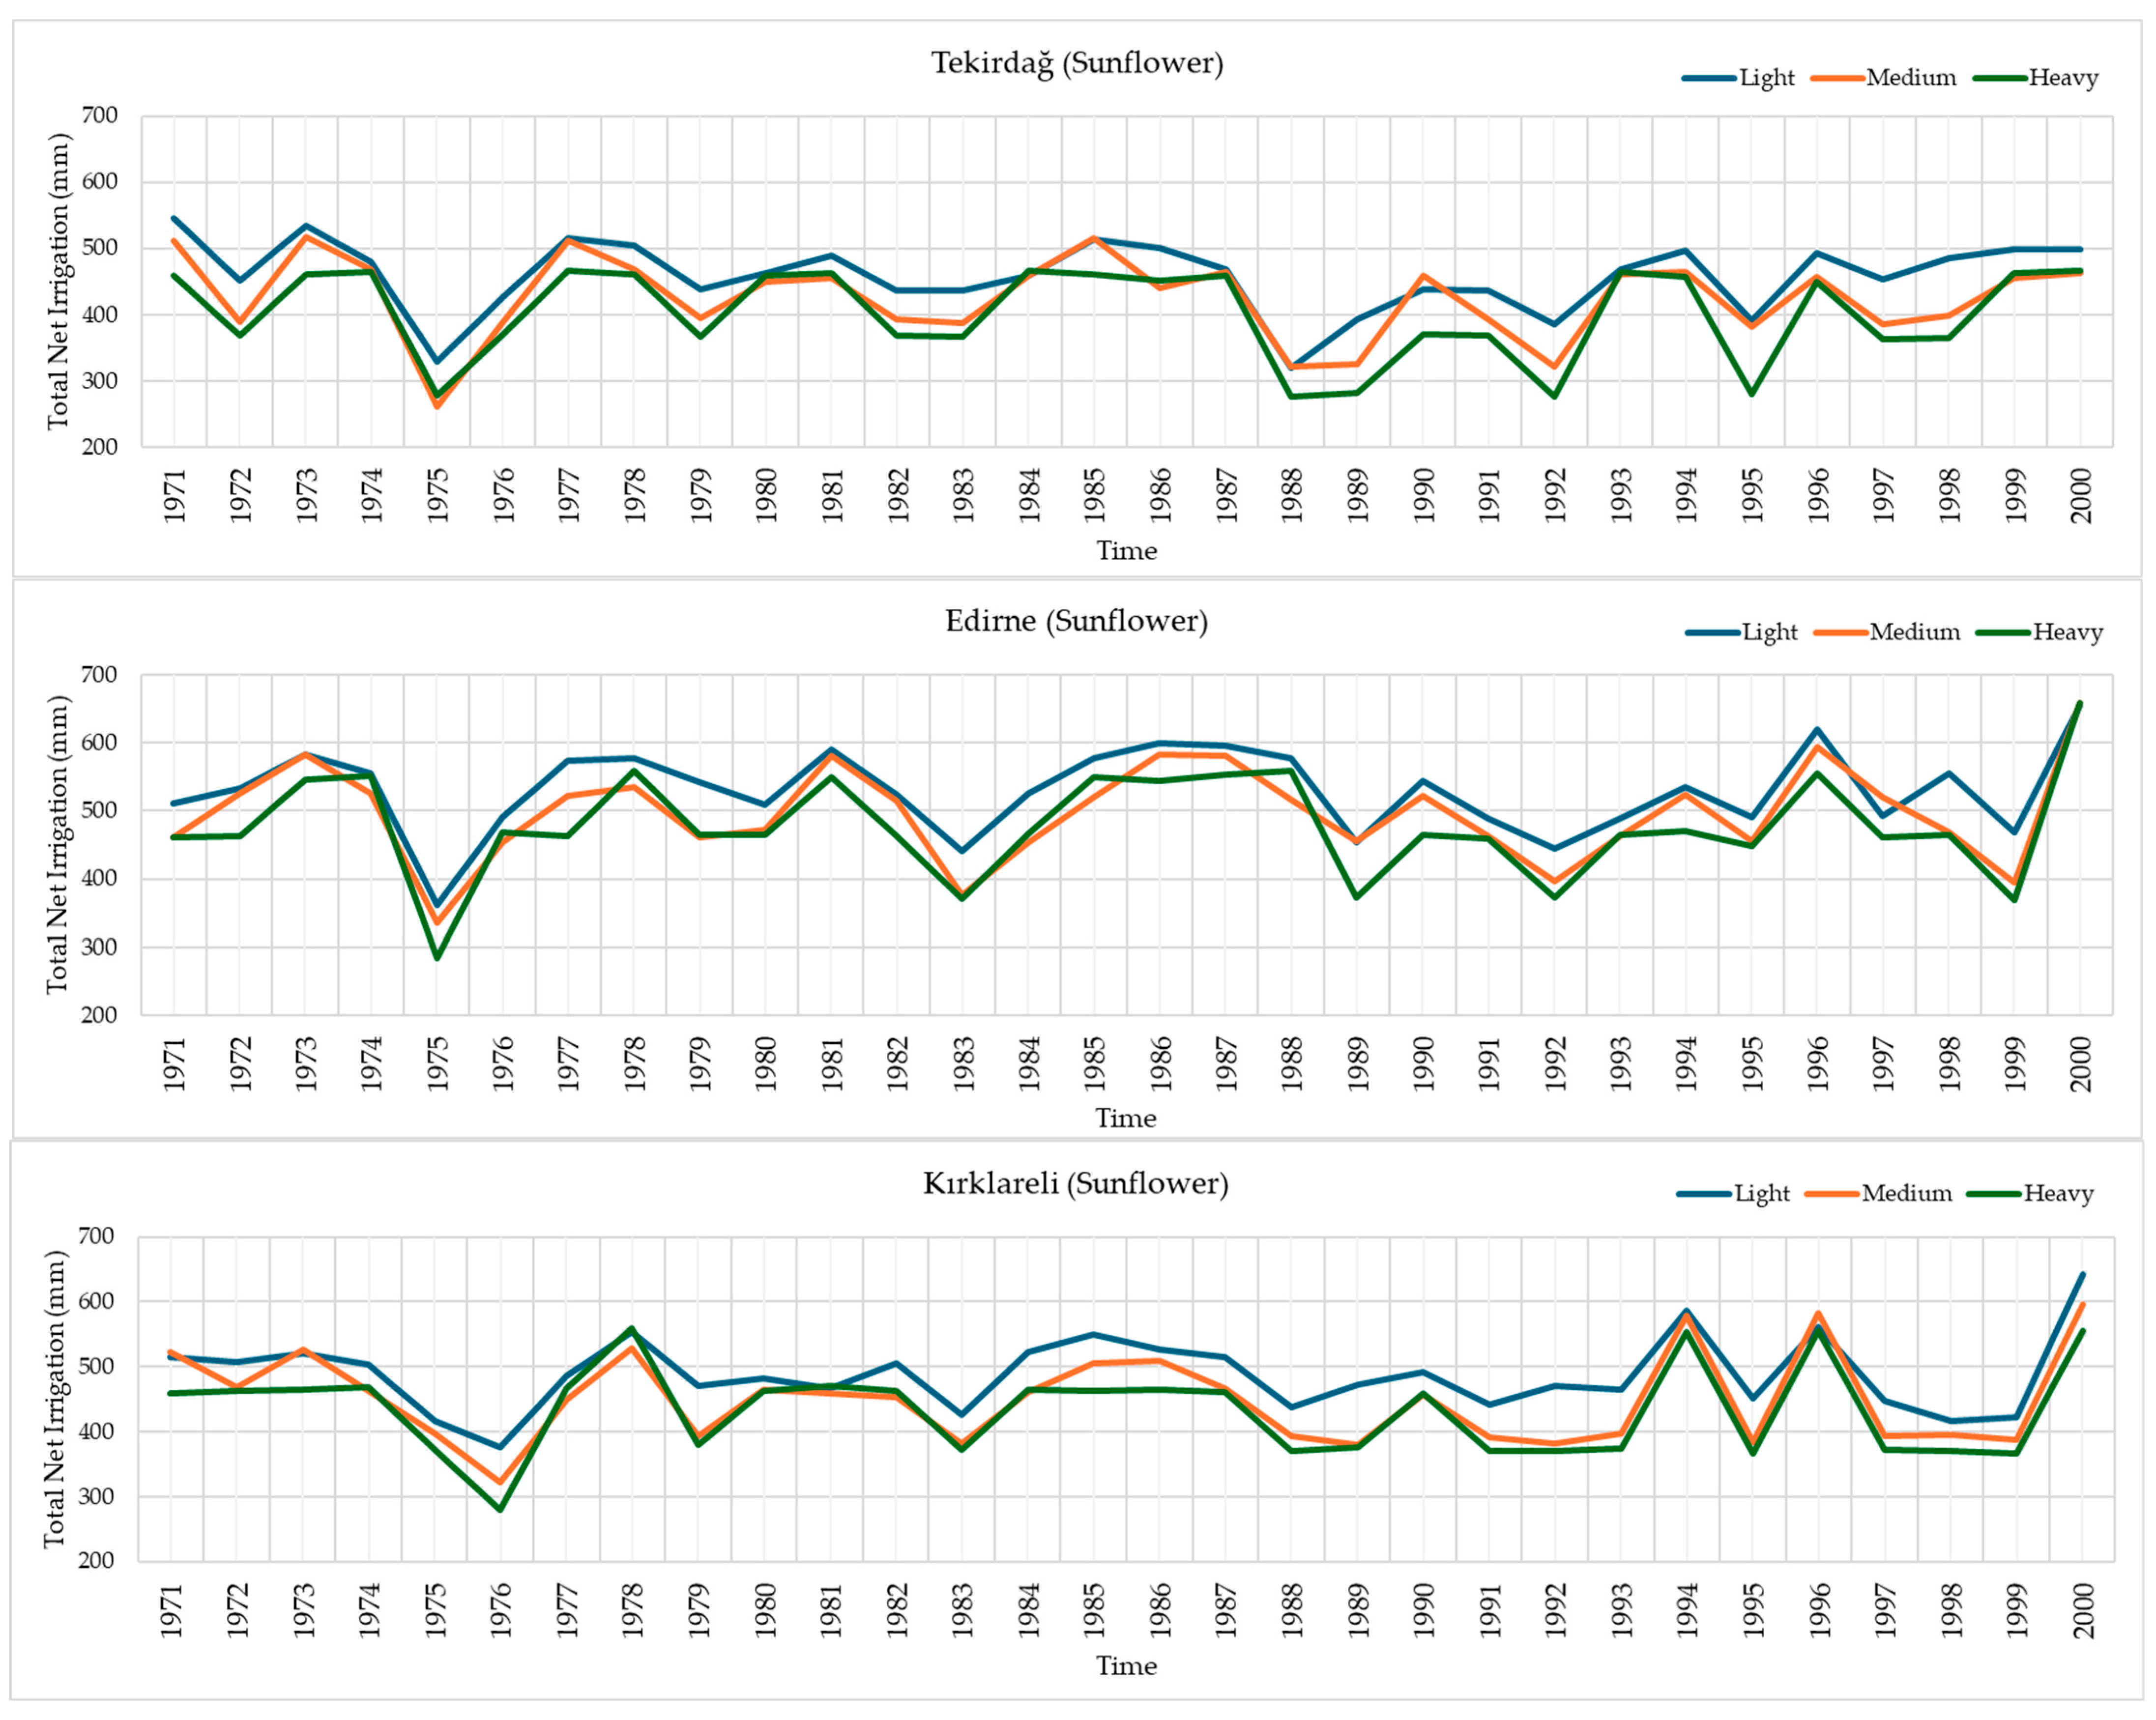
3.3. Temporal Variation of Total Net Irrigation Water Requirements for Different Soil Textures in Sunflower Across Tekirdağ, Edirne, and Kırklareli Provinces (1971–2000)

The changes in net irrigation water requirements of sunflower in different soil textures in Tekirdağ, Edirne, and Kırklareli provinces’ temporal variations between 1971 and 2000 are shown in Figure 9. The total net irrigation water requirement for sunflower varied over the years due to both soil texture and climatic changes. Generally, the irrigation water requirement followed the order of light > medium > heavy soils on an annual basis across all three provinces. However, in some years, this pattern deviated. For instance, heavy-textured soils occasionally required more irrigation water than medium-textured soils, and medium-textured soils surpassed light-textured soils in total net irrigation water demand in certain years. Notably, in 1978, in Kırklareli, heavy-textured soils required more irrigation water than both medium and light-textured soils (Figure 9).
The total net irrigation water requirement for sunflower during the 1971–2000 period ranged from 261.9 to 546.5 mm in Tekirdağ, 283.5 to 658.3 mm in Edirne, and 279.5 to 642.6 mm in Kırklareli (Table 7). While the years corresponding to the minimum and maximum values are clearly identified in Edirne (1975 and 2000) and Kırklareli (1976 and 2000), the years near the minimum and maximum values show greater variability in Tekirdağ.

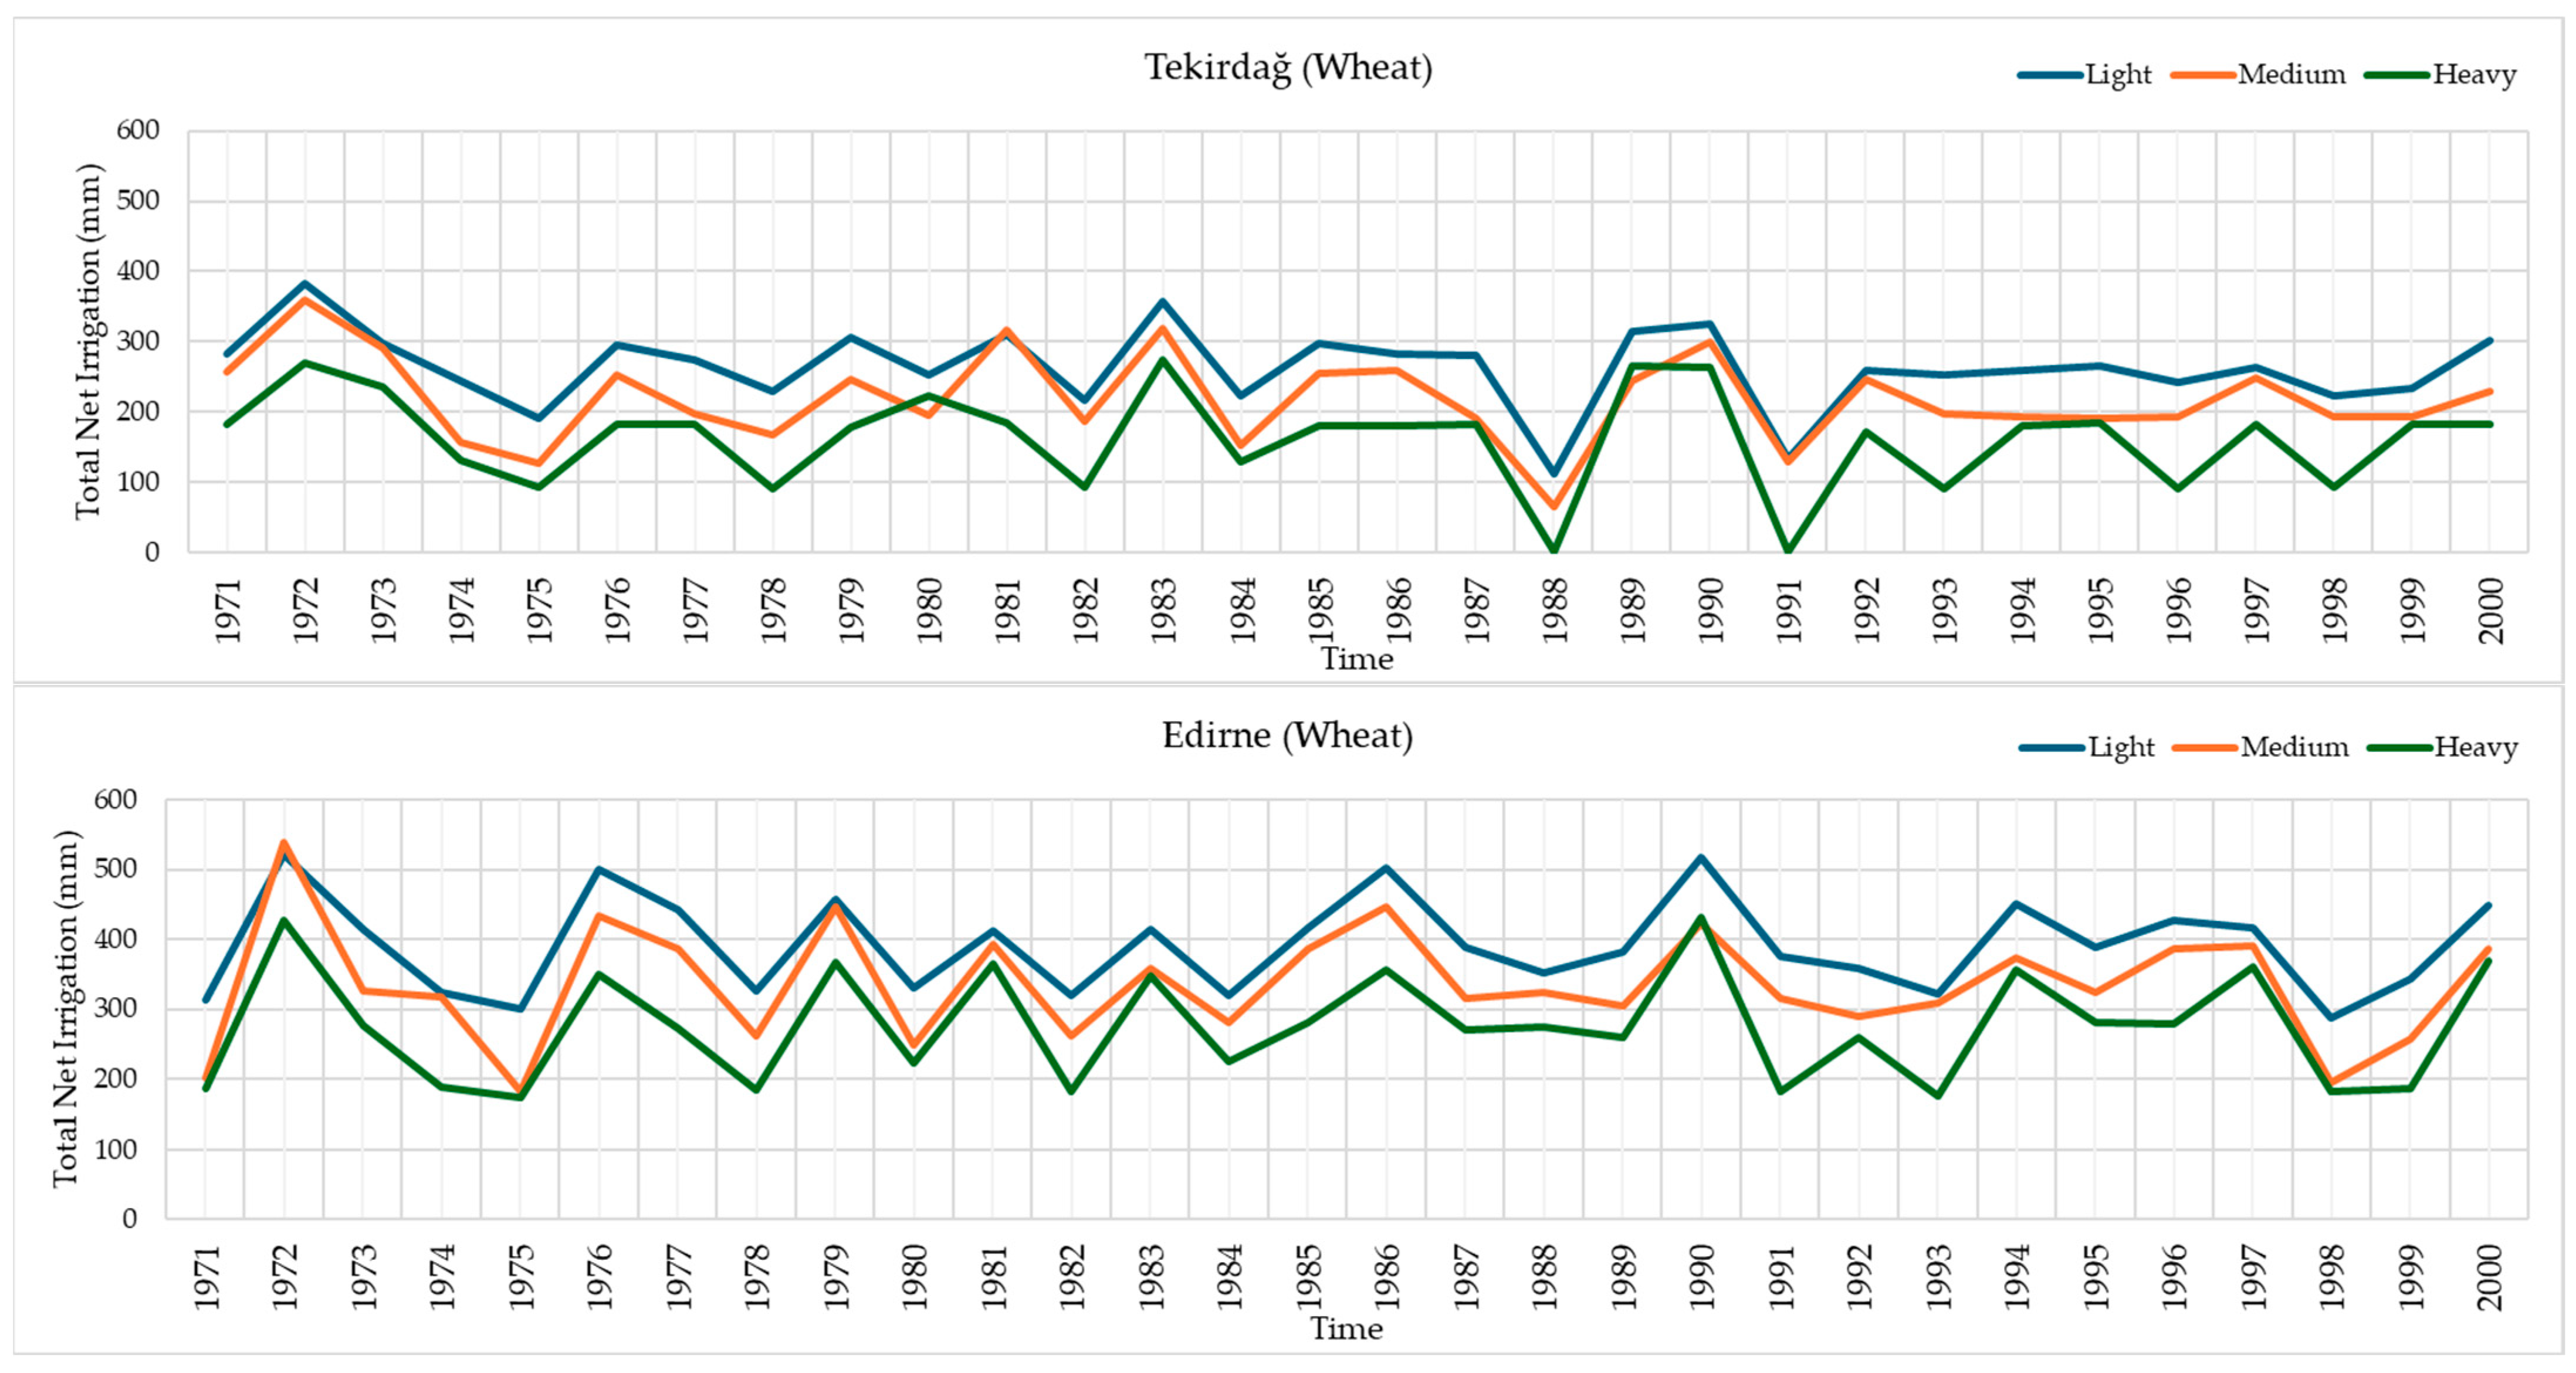
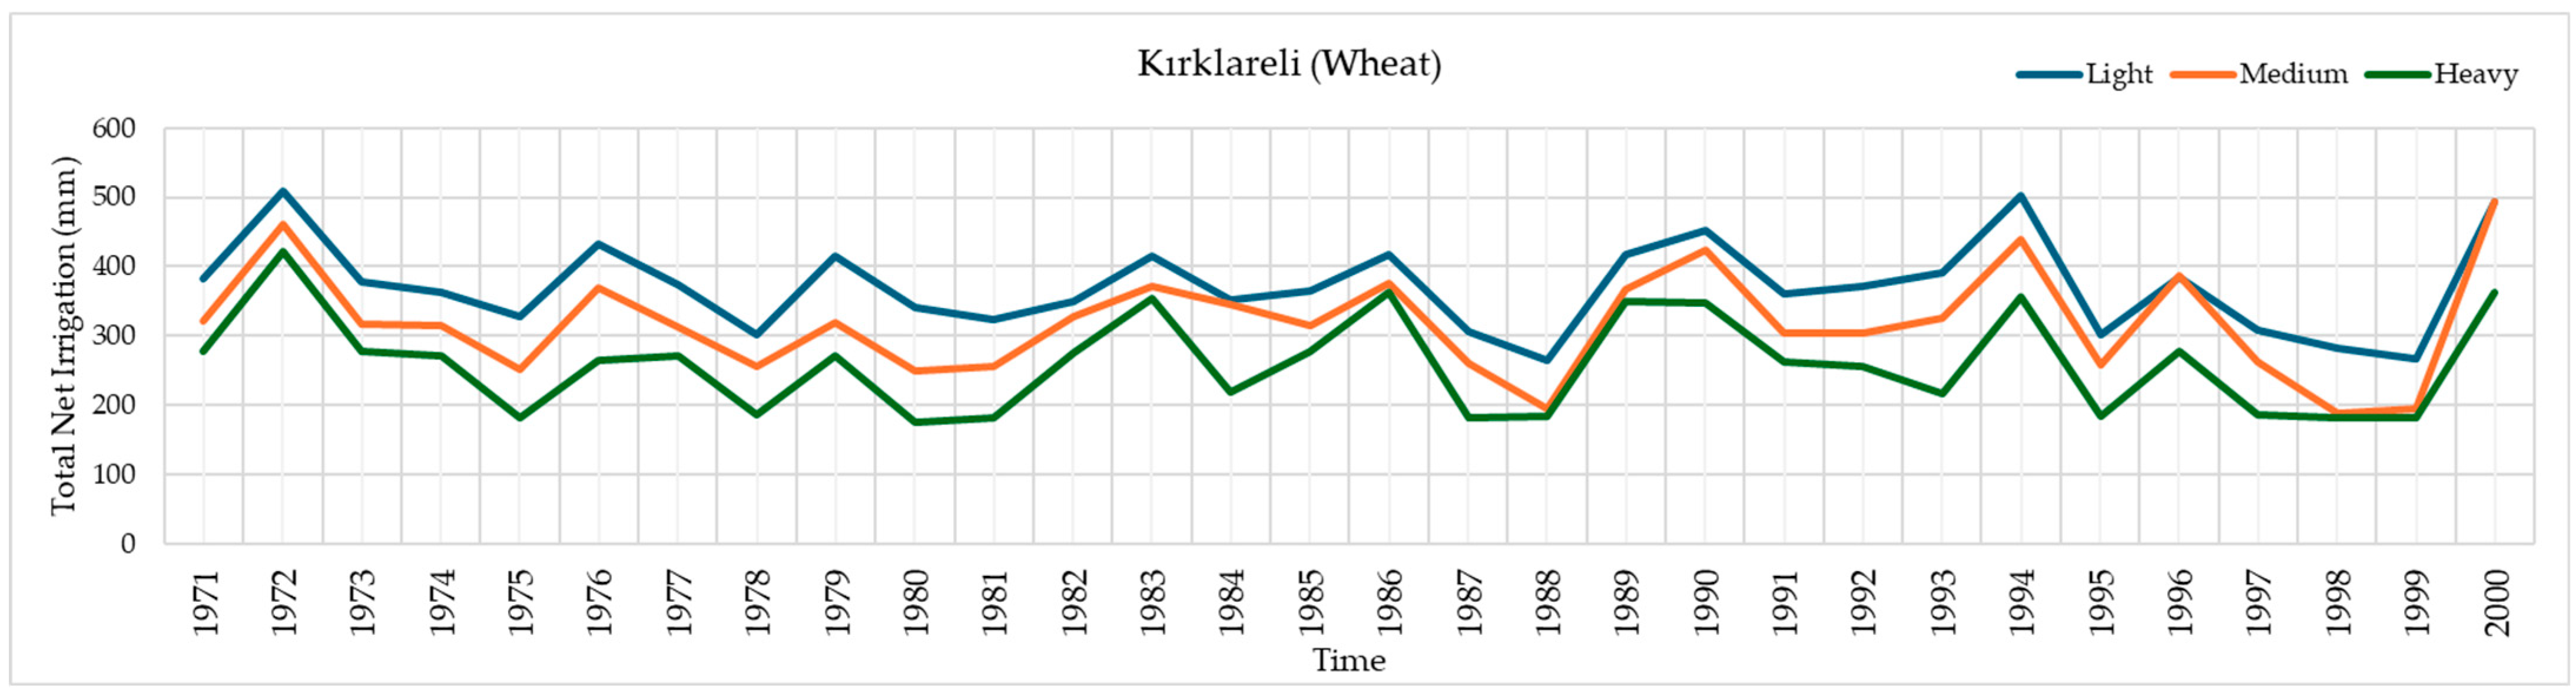
3.4. Temporal Variation of Total Net Irrigation Water Requirements for Wheat Across Different Soil Textures in Tekirdağ, Edirne, and Kırklareli Provinces (1971–2000)

Changes in the net irrigation water requirement of wheat grown in different soil types in Tekirdağ, Edirne, and Kırklareli provinces between 1971 and 2000 showed differences in time (Figure 10). It is possible to attribute the reason for this change to both soil type and climatic fluctuations. Generally, similar to sunflower, the total net irrigation water requirement for wheat across all three provinces followed the order of light > medium > heavy soils on an annual basis. Additionally, in Tekirdağ, no irrigation water was needed for wheat grown in heavy-textured soils in 1988 and 1991 (Figure 10).
The total net irrigation water requirement for wheat during the 1971–2000 period ranged from 0 to 383.8 mm in Tekirdağ, from 174.3 to 538.3 mm in Edirne, and from 175.7 to 508.8 mm in Kırklareli (Table 8). The years corresponding to the minimum and maximum values varied across Edirne, Kırklareli, and Tekirdağ.

4. Discussion

This study investigated the effects of different soil textures on the total net irrigation water requirements of sunflower and wheat crops using the CROPWAT 8.0 model, based on climate data from the 1971–2000 period in the TR21 Thrace Region. The findings emphasize the critical role of accounting for climate change and soil properties in effective agricultural water management.
The climate data for the TR21 Thrace Region reveal significant differences in temperature and precipitation among the provinces of Tekirdağ, Edirne, and Kırklareli. Tekirdağ stands out with higher annual average temperatures compared to the other provinces, whereas Kırklareli generally records lower temperature values. This variation is likely influenced by physical characteristics such as geographical location and altitude. Rainfall during the spring months (March, April, and May) coincides with a critical period for plant growth, serving as a vital water source to support agricultural production. However, the decline in rainfall during the summer months underscores the necessity of irrigation, further emphasizing the importance of effective agricultural water management. Similar trends have been observed in Northwest Italy, where climate change is projected to increase irrigation requirements due to decreased precipitation and increased evapotranspiration, particularly during peak growing months like July and August [44]. This pattern suggests that water scarcity challenges in the TR21 Thrace Region could become more severe in the future, necessitating adaptation strategies.
It was determined that sunflower required more total net irrigation water than wheat in all three provinces (Figure 7 and Figure 8). This was thought to be due to the fact that the growing season of sunflower coincides with the summer months. Since temperatures in the study area tend to increase in all three provinces, it was estimated that sunflower would be more affected by this situation. Debaeke et al. [45] also emphasized that sunflower is more sensitive to climate change. Conversely, crops cultivated during the winter and spring, such as wheat, are expected to be less affected by changing climatic conditions [46]. The Mediterranean region faces a similar trend, where climate change is expected to increase irrigation requirements by 4–18% due to higher temperatures and altered precipitation patterns. However, efficient irrigation systems could potentially save up to 35% of the water, highlighting the need for technological improvements [47]. Deveci and Konukcu [8] concluded that while climate change is unlikely to significantly impact wheat agriculture in the Thrace Region, it is expected to result in a serious water deficit for sunflower production. Additionally, fluctuations in the timing and amount of precipitation caused by climate change may introduce uncertainties in irrigation planning for both crops. Future adaptation strategies should prioritize the selection of more climate-resilient plant species and the implementation of flexible irrigation management approaches [48,49,50].
Soil texture is a key factor influencing irrigation water requirements [18]. The findings of this study underscore the importance of considering soil texture in the irrigation planning of sunflower and wheat crops. Specifically, light-textured soils were found to require more irrigation water than other soil types, primarily due to their lower water-holding capacity. CROPWAT 8.0 model uses these differences as basic parameters in determining plant water stress formation and irrigation intervals by considering the water-holding capacity and water loss dynamics of different soil structures [43]. Therefore, even under the same climatic conditions, changes are observed in irrigation needs and management strategies depending on the soil type. For example, in the modeling results conducted for Tekirdağ province in this study, higher net irrigation water needs were calculated for sunflower plants in light-textured soils, and it was observed that this need gradually decreased in medium- and heavy-textured soils. Similar conclusions have been drawn in studies conducted in the Tecuci Plain, Dobrogea Plateau, and the Gavanu-Burdea Plain, where different soil types require tailored irrigation strategies to optimize water use under current climatic conditions [19]. Understanding local soil and climate conditions is essential for developing targeted adaptation strategies that ensure sustainable water use in agriculture [44,47].
The research revealed that the irrigation water requirements for light-, medium-, and heavy-textured soils in Edirne were higher compared to Kırklareli and Tekirdağ. Over the 30-year period, the annual average temperatures were recorded as 13.7 °C in Tekirdağ, 13.2 °C in Edirne, and 13.0 °C in Kırklareli. Regarding precipitation, Tekirdağ (572 mm) and Edirne (574 mm) had similar values, whereas Kırklareli received less precipitation (545 mm). The higher total net irrigation water requirement in Edirne compared to Tekirdağ becomes more evident when examining the monthly average temperatures. Edirne exhibited higher temperatures than Tekirdağ, particularly during the critical growth stages of sunflower and wheat. This finding suggests that plants may require more irrigation water during their growth phases in regions with higher temperatures. However, although the same soil classes were used in each province, significant differences occurred among the provinces in terms of irrigation water requirements. The main reason for the differences in irrigation water requirements is the variability in climate data among the provinces. Particularly, climate parameters such as ETo, effective precipitation, and monthly temperature values directly affect plant water consumption. In addition, the distribution of this precipitation during the year is as important as the total monthly precipitation used in the effective precipitation calculation. Intense and short-term precipitation causes significant water loss through deep infiltration, especially in light-textured soils, reducing the amount of water that the plant can use. In addition to all these factors, the plant coefficients used in the study were determined according to local production conditions and more accurately reflect the different development periods and plant behaviors according to the climate structure of each province. Therefore, the differences between the provinces in ETc and IWR calculations should be evaluated not only as a combination of soil structure but also precipitation regime, effective precipitation, and local Kc values. These results show the necessity of considering multi-dimensional climatic and crop production data together in irrigation planning.
The high irrigation demand in light-textured soils highlights the critical need for implementing more efficient irrigation techniques in regions with limited water resources. In areas dominated by light-textured soils, methods such as drip irrigation can play a vital role in minimizing water loss during the plant’s growth period by directly delivering water to the root zone. Studies have shown that drip irrigation significantly reduces water loss while maintaining high crop yields, making it an ideal choice for regions with limited water resources [51,52]. While climate change generally increases irrigation requirements due to higher temperatures and altered precipitation patterns, there are scenarios where technological advancements and changes in crop management can mitigate these effects. For example, improved irrigation systems and crop management practices can significantly reduce water use, as seen in the Mediterranean region and Central Europe [47,53]. By adopting such efficient irrigation systems, negative impacts—such as increased pressure on water resources, elevated irrigation costs, risks of soil structure deterioration, and potential productivity losses—can be effectively mitigated. Additionally, these approaches support sustainable water use while maintaining agricultural productivity.
Gürbüz, Kayalı, Bahar, Öz, and Kurşun [24] highlighted that the soils of the Thrace Region exhibit diverse textures based on their parent material, with approximately one-third classified as light-textured, one-fifth as medium-textured, and two-fifths as heavy-textured. This diversity necessitates tailored irrigation practices based on soil structure. Light-textured soils demand more frequent irrigation and higher water use during hot summer months due to significant evaporation and infiltration losses. In contrast, heavy-textured soils, with their high water-holding capacity, may require less frequent irrigation. However, these soils are prone to drainage issues, which can lead to oxygen deficiency in the plant root zone, ultimately reducing yields. Medium-textured soils offer a balanced foundation for optimizing irrigation efficiency by striking a compromise between the characteristics of light and heavy-textured soils.
The findings of this study underscore the importance of developing climate change adaptation strategies in agricultural production. However, it is important to acknowledge that the study is limited to climate data from the 1971–2000 period. Future research should incorporate both current and projected climate data to provide a more comprehensive understanding of irrigation needs under changing climatic conditions. Developing region-specific irrigation plans will not only enhance agricultural production efficiency but also contribute to the sustainable management of water resources.

5. Conclusions

This study examined the effects of different soil textures on total net irrigation water requirements for sunflower and wheat crops in the TR21 Thrace Region, providing significant insights into agricultural water management. The findings indicate that light-textured soils require higher irrigation water compared to other soil types, primarily due to their low water-holding capacity. The results also highlighted that sunflower has a higher irrigation requirement than wheat, driven by rising temperatures and decreasing rainfall during the summer months, making it a priority in irrigation planning. Among the provinces, Edirne stands out with higher irrigation water needs, a situation attributed to its unique temperature and precipitation characteristics.
In conclusion, this study highlights the critical importance of considering soil properties and the impacts of climate change on agricultural production. In regions where light-textured soils are prevalent, adopting modern irrigation methods, particularly drip irrigation, is essential for the efficient use of water resources. Furthermore, developing region-specific irrigation management plans can simultaneously enhance agricultural productivity and safeguard water resources. The use of data from the 1971–2000 period provided valuable insights into the region’s conditions and basic trends. However, incorporating forward-looking climate scenarios in future research could significantly aid in the formulation of long-term strategies and adaptation measures to address the challenges posed by climate change. For instance, advancing the planting dates of summer crops like sunflower can align their growing season with the rainy period, thereby reducing irrigation water demands. Additionally, employing drought-tolerant varieties, implementing mulching practices to retain soil moisture, and applying crop rotation can further contribute to conserving water and improving system resilience. Expected changes in rainfall patterns underscore the importance of modern irrigation techniques, such as drip irrigation, in ensuring the sustainable use of water resources. Such integrated approaches are especially vital for securing agricultural sustainability in water-scarce regions like the TR21 Thrace Region.

Author Contributions

Conceptualization, T.E., H.D. and B.Ö.; methodology, H.D. and B.Ö.; software, B.Ö.; formal analysis, B.Ö. and H.D.; investigation, H.D. and B.Ö.; resources, H.D. and B.Ö.; data curation, H.D.; writing—original draft preparation, H.D. and B.Ö.; writing—review and editing, T.E., H.D. and B.Ö.; visualization, B.Ö. and H.D.; supervision, T.E.; All authors have read and agreed to the published version of the manuscript.

Funding

This research received no external funding.

Data Availability Statement

The data presented in this study are available on request from the corresponding author.

Conflicts of Interest

The authors declare no conflicts of interest.

References

  1. SMDA. Agricultural Research Report. South Marmara Development Agency (SMDA). Türkiye. Available online: https://www.gmka.gov.tr/dokumanlar/yayinlar/Tarim-Arastirma-Raporu.pdf (accessed on 15 November 2024).
  2. TDA. Edirne, Kırklareli, Tekirdağ Agriculture and Rural Development Sector. Thrace Development Agency (TDA), Türkiye. Available online: https://ka.gov.tr/en/pages/trakya-kalkinma-ajansi-tarim-ve-kirsal-kalkinma--29-467 (accessed on 24 November 2024).
  3. TurkStat. Crop Production Statistics. Turkish Statistical Institute. Available online: https://biruni.tuik.gov.tr/medas/?kn=92&locale=tr (accessed on 22 November 2024).
  4. Şen, A.S.; Deveci, H.; Konukcu, F. Modelling the adaptation of some cultural plants produced in Thrace Region to climate change. J. Tekirdag Agric. Fac. 2024, 21, 501–516. [Google Scholar] [CrossRef]
  5. Zheng, H.; Hou, H.; Wu, J.; Tian, D.; Miao, P. Irrigation schedule optimization for wheat and sunflower intercropping under water supply restrictions in Inner Mongolia, China. Atmosphere 2024, 15, 566. [Google Scholar] [CrossRef]
  6. Yeşilköy, S.; Şaylan, L. Yields and water footprints of sunflower and winter wheat under different climate projections. J. Clean. Prod. 2021, 298, 126780. [Google Scholar] [CrossRef]
  7. Gürkan, H. Evaluation of the Impacts of climate change on sunflower with aquacrop model. J. Tekirdag Agric. Fac. 2023, 20, 933–947. [Google Scholar] [CrossRef]
  8. Deveci, H.; Konukcu, F. Modeling the effect of climate change on evapotranspiration in the Thrace Region. Atmosphere 2024, 15, 1188. [Google Scholar] [CrossRef]
  9. Hussein, K.B. A study of climate changes impact on the quantities of water used for irrigation. J. Al-Azhar Univ. Eng. Sect. 2021, 16, 538–552. [Google Scholar] [CrossRef]
  10. Tessema Roba, N.; Kebede Kassa, A.; Yadeta Geleta, D. Modeling climate change impacts on crop water demand, middle Awash River basin, case study of Berehet woreda. Water Pract. Technol. 2021, 16, 864–885. [Google Scholar] [CrossRef]
  11. Groh, J.; Vanderborght, J.; Pütz, T.; Vogel, H.J.; Gründling, R.; Rupp, H.; Rahmati, M.; Sommer, M.; Vereecken, H.; Gerke, H.H. Responses of soil water storage and crop water use efficiency to changing climatic conditions: A lysimeter-based space-for-time approach. Hydrol. Earth Syst. Sci. 2020, 24, 1211–1225. [Google Scholar] [CrossRef]
  12. Irmak, S.; Odhiambo, L.O.; Kranz, W.L.; Eisenhauer, D.E. Irrigation efficiency and uniformity, and crop water use efficiency. Biol. Syst. Eng. Pap. Publ. 2011, 451, 1–8. [Google Scholar]
  13. FAO. Soil Texture. Food and Agriculture Organization (FAO) of the United Nations, Rome, Italy. Available online: https://www.fao.org/fishery/static/FAO_Training/FAO_Training/General/x6706e/x6706e06.htm (accessed on 10 November 2024).
  14. Wankmüller, F.J.P.; Delval, L.; Lehmann, P.; Baur, M.J.; Wolf, S.; Or, D.; Javaux, M.; Carminati, A. Soil Texture Controls the Relative Importance of Vapor Pressure Deficit and Soil Moisture for Ecosystem Water Limitation Globally. In Proceedings of the European Geosciences Union General Assembly 2024 (EGU24), Vienna, Austria, 14–19 April 2024. [Google Scholar] [CrossRef]
  15. Busschaert, L.; de Roos, S.; Thiery, W.; Raes, D.; De Lannoy, G.J.M. Net irrigation requirement under different climate scenarios using AquaCrop over Europe. Hydrol. Earth Syst. Sci. 2022, 26, 3731–3752. [Google Scholar] [CrossRef]
  16. Bakanoğulları, F.; Bahar, E.; Kıvrak, C.; Gür, M. Assessment of Meteorological and Agricultural Drought Analysis in Kırklareli province. Tekirdağ Ziraat Fakültesi Derg. 2022, 19, 756–768. [Google Scholar] [CrossRef]
  17. Deveci, H.; Önler, B.; Erdem, T. Modeling the effects of climate change on the irrigation water requirements of wheat and canola in the TR21 Thrace Region using CROPWAT 8.0. Front. Sustain. Food Syst. 2025, 9, 1563048. [Google Scholar] [CrossRef]
  18. Neamah, I.F. The effects of soil texture on irrigation schedule. Int. J. Civ. Eng. Constr. 2024, 3, 35–43. [Google Scholar]
  19. Niţu, O.A.; Muşat, M.; Ivan, E.Ș.; Burtan, L.; Anghel, A. The determination of the most optimal methods for the irrigation of crops on different soil types. Ann. Univ. Craiova-Agric. Mont. Cadastre Ser. 2024, 53, 367–374. [Google Scholar] [CrossRef]
  20. Deveci, H.; Konukcu, F. Prediction of climate change and its impact on water resources and crop yileds in Ergene River Basin. In Integrated Land-Use Management Modelling of Black Sea Estuaries (ILMM-BSE) Project: Ergene River Basin, 1st ed.; Konukcu, F., Ed.; Soil Offset: Tekirdağ, Türkiye, 2016; pp. 269–290. [Google Scholar]
  21. Hanedar, A.; Ferat, Ç.; Erdem, G.; Konukcu, F.; Altürk, B.; Albut, S. TR21 Region Climate Assessment: Current Situation and Projections. In Effects of Climate Change and Adaptation Strategies in TR21 Thrace Region, 1st ed.; Konukcu, F., Albut, S., Altürk, B., Eds.; Tekirdağ Namık Kemal University: Tekirdağ, Türkiye, 2019; pp. 1–22. [Google Scholar]
  22. TDA. TR21 Thrace Regional Plan Tekirdağ, Edirne, Kırklareli 2010. Thrace Development Agency (TDA), Türkiye. Available online: https://www.trakyaka.org.tr/upload/Node/33265/xfiles/tr21_trakya_2010-2013.pdf (accessed on 24 November 2024).
  23. Özşahin, E.; Öztürk, M. The effect of sea level rise caused by climate change for TR21 Thrace Region (Türkiye). In Proceedings of the Akdeniz 9th International Conference on Applied Sciences, Adana, Türkiye, 1–2 April 2023; pp. 226–234. [Google Scholar]
  24. Gürbüz, M.A.; Kayalı, E.; Bahar, E.; Öz, T.A.; Kurşun, İ. Composing the database of Thrace soils and some soil characteristics. J. Soil. Sci. Plant Nutr. 2019, 7, 28–36. [Google Scholar] [CrossRef]
  25. TSMS. Location of Meteorological Stations, Tekirdağ, Edirne, Kırklareli. Turkish State Meteorological Service (TSMS). Available online: https://www.mgm.gov.tr/kurumsal/istasyonlarimiz.aspx (accessed on 23 July 2024).
  26. Asan, A.; Yarcı, C. Botanical tours in Thrace. Ecol. Environ. J. 1993, 2, 26–30. [Google Scholar]
  27. TSMS. Long-term Monthly Averages Climate Data, Tekirdağ. Turkish State Meteorological Service (TSMS). Available online: https://www.mgm.gov.tr/veridegerlendirme/il-ve-ilceler-istatistik.aspx?m=TEKIRDAG (accessed on 15 May 2024).
  28. TSMS. Long-term Monthly Averages Climate Data, Edirne. Turkish State Meteorological Service (TSMS). Available online: https://www.mgm.gov.tr/veridegerlendirme/il-ve-ilceler-istatistik.aspx?m=EDIRNE (accessed on 15 May 2024).
  29. TSMS. Long-term Monthly Averages Climate Data, Kırklareli. Turkish State Meteorological Service (TSMS). Available online: https://www.mgm.gov.tr/veridegerlendirme/il-ve-ilceler-istatistik.aspx?m=KIRKLARELI (accessed on 15 May 2024).
  30. RTMAFGDARP. Plant Water Consumption of Irrigated Plants in Türkiye, Republic of Türkiye Ministry of Agriculture and Forestry General Directorate of Agricultural Research and Policies (RTMAFGDARP), Ankara, Türkiye. Available online: https://www.tarimorman.gov.tr/TAGEM/Belgeler/yayin/Tu%CC%88rkiyede%20Sulanan%20Bitkilerin%20Bitki%20Su%20Tu%CC%88ketimleri.pdf (accessed on 22 December 2023).
  31. FAO. Wheat. Food and Agriculture Organization (FAO) of the United Nations, Rome, Italy. Available online: https://www.fao.org/land-water/databases-and-software/crop-information/wheat/en/ (accessed on 12 July 2024).
  32. Steduto, P.; Hsiao, T.C.; Fereres, E.; Raes, D. Crop Yield Response to Water; FAO Rome: Rome, Italy, 2012. [Google Scholar]
  33. FAO. Sunflower. Food and Agriculture Organization (FAO) of the United Nations, Rome, Italy. Available online: https://www.fao.org/land-water/databases-and-software/crop-information/sunflower/en/ (accessed on 14 July 2024).
  34. Erdem, T. Evapotranspiration of sunflower for Tekirdağ conditions. J. Agric. Sci. 2001, 7, 62–68. [Google Scholar] [CrossRef]
  35. FAO. CROPWAT. Food and Agriculture Organization (FAO) of the United Nations, Rome, Italy. Available online: https://www.fao.org/land-water/databases-and-software/cropwat/en/ (accessed on 19 August 2024).
  36. Smith, M.; CROPWAT. A computer program for irrigation planning and management. In FAO Irrigation and Drainage Paper No. 46; FAO: Rome, Italy, 1992. [Google Scholar]
  37. Aydın-Kandemir, F.; Yıldız, D. Assessment of crop water requirements by using cropwat for sustainable water resources management in agriculture (Akhisar-Manisa, Turkey). Int. J. Water Manag. Dipl. 2022, 1, 5–20. [Google Scholar]
  38. El-Shafei, A.A.; Mattar, M.A. Irrigation Scheduling and Production of Wheat with Different Water Quantities in Surface and Drip Irrigation: Field Experiments and Modelling Using CROPWAT and SALTMED. Agronomy 2022, 12, 1488. [Google Scholar] [CrossRef]
  39. Ewaid, S.H.; Abed, S.A.; Al-Ansari, N. Crop water requirements and irrigation schedules for some major crops in Southern Iraq. Water 2019, 11, 756. [Google Scholar] [CrossRef]
  40. GDM. Climate Change Projections for Türkiye with New Scenarios. General Directorate of Meteorology (GDM). Available online: https://www.mgm.gov.tr/files/iklim/iklim_degisikligi_projeksiyonlari.pdf (accessed on 21 April 2025).
  41. GDWM. Impact of Climate Change on Water Resources Project Project Final Report. General Directorate of Water Management (GDWM). Available online: https://www.tarimorman.gov.tr/SYGM/Belgeler/iklim%20de%C4%9Fi%C5%9Fikli%C4%9Finin%20su%20kaynaklar%C4%B1na%20etkisi/Iklim_NihaiRapor.pdf (accessed on 12 February 2023).
  42. Demir, İ.; Kılıç, G.; Coşkun, M.; Sümer, U.M. Changes and Trends Observed in Maximum, Minimum and Average Air Temperatures and Precipitation Series in Türkiye. In Proceedings of the TMMOB Climate Change Symposium, Ankara, Türkiye, 13–14 March 2008; pp. 69–84. [Google Scholar]
  43. Allen, R.G.; Pereira, L.S.; Raes, D.; Smith, M. Crop Evapotranspiration-Guidelines for Computing Crop Water Requirements-FAO Irrigation and Drainage Paper 56; Fao: Rome, Italy, 1998; Volume 300, p. D05109. [Google Scholar]
  44. Rolle, M.; Tamea, S.; Claps, P.; Poggi, D. Climate-driven local assessment of future irrigation requirements and available water resources in North-West Italy. In Proceedings of the EGU General Assembly Conference Abstracts, Vienna, Austria, 1 May 2023; p. EGU–14197. [Google Scholar]
  45. Debaeke, P.; Casadebaig, P.; Flénet, F.; Langlade, N. Sunflower crop and climate change: Vulnerability, adaptation, and mitigation potential from case-studies in Europe. OCL-Oilseeds Fats Crops Lipids 2017, 24, D102. [Google Scholar] [CrossRef]
  46. Sultana, H.; Ali, N.; Iqbal, M.M.; Khan, A.M. Vulnerability and adaptability of wheat production in different climatic zones of Pakistan under climate change scenarios. Clim. Change 2009, 94, 123–142. [Google Scholar] [CrossRef]
  47. Fader, M.; Shi, S.; von Bloh, W.; Bondeau, A.; Cramer, W. Mediterranean irrigation under climate change: More efficient irrigation needed to compensate for increases in irrigation water requirements. Hydrol. Earth Syst. Sci. 2016, 20, 953–973. [Google Scholar] [CrossRef]
  48. Iglesias, A.; Garrote, L. Adaptation strategies for agricultural water management under climate change in Europe. Agric. Water Manag. 2015, 155, 113–124. [Google Scholar] [CrossRef]
  49. Lin, B.B. Resilience in agriculture through crop diversification: Adaptive management for environmental change. BioScience 2011, 61, 183–193. [Google Scholar] [CrossRef]
  50. Moniruzzaman, S. Crop choice as climate change adaptation: Evidence from Bangladesh. Ecol. Econ. 2015, 118, 90–98. [Google Scholar] [CrossRef]
  51. Pawar, J.; Khanna, R. More crop per drop: Ways to increase water use efficiency for crop production: A review. Int. J. Chem. Stud. 2018, 6, 3573–3578. [Google Scholar]
  52. Shareef, T.M.E.; Ma, Z.; Zhao, B. Essentials of Drip Irrigation System for Saving Water and Nutrients to Plant Roots: As a Guide for Growers. J. Water Resour. Prot. 2019, 11, 1129–1145. [Google Scholar] [CrossRef]
  53. Heinz, M.; Turek, M.E.; Holzkämper, A.; Schaefli, B.; Raible, C. Exploring the possibilities to reduce irrigation demands through adaptations in soil and crop management. In Proceedings of the EGU General Assembly 2024, Vienna, Austria, 14–19 April 2024; p. EGU24–2081. [Google Scholar]
Figure 1. Location of the research area and meteorological stations [25].
Water 17 01437 g001
Figure 2. Graphical summary of the research methodology.
Water 17 01437 g002
Figure 3. Mean temperature (°C) values in Tekirdağ, Edirne, and Kırklareli provinces between 1971–2000.
Water 17 01437 g003
Figure 4. Monthly average temperature (°C) values in Tekirdağ, Edirne, and Kırklareli provinces between 1971–2000.
Water 17 01437 g004
Figure 5. Total annual precipitation (mm) in Tekirdağ, Edirne, and Kırklareli provinces between 1971 and 2000.
Water 17 01437 g005
Figure 6. Monthly total precipitation (mm) values in Tekirdağ, Edirne, and Kırklareli provinces between 1971 and 2000.
Water 17 01437 g006
Figure 7. Total net irrigation water (mm) values for sunflower in Tekirdağ, Edirne, and Kırklareli provinces for different soil textures (1971–2000).
Water 17 01437 g007
Figure 8. Total net irrigation water (mm) values for wheat in Tekirdağ, Edirne, and Kırklareli provinces for different soil textures.
Water 17 01437 g008
Figure 9. Changes in net irrigation water requirement for sunflower in Tekirdağ, Edirne, and Kırklareli provinces according to different soil textures during the period 1971–2000.
Water 17 01437 g009
Figure 10. Changes in net irrigation water requirement for wheat in Tekirdağ, Edirne, and Kırklareli provinces according to different soil textures during the period 1971–2000.
Water 17 01437 g010aWater 17 01437 g010b
Table 1. Agricultural areas of Türkiye, TR21 Thrace Region, and the provinces in the region in 2023 (excluding meadow and pasture areas) [3].
LocationCereals and Other Plant ProductsVegetable GardensFruit, Beverage, and Spice PlantsOrnamental PlantsTotal
ha%ha%ha%ha%ha%
Tekirdağ401,20696.623870.611,7382.8150.0415,346100
Edirne335,70797.238431.157291.71850.1345,463100
Kırklareli244,70698.114050.633951.400.0249,506100
TR21 Thrace Region981,61897.276350.820,8622.12000.01,010,314100
Türkiye19,558,94281.6712,2643.03,694,25615.457690.023,971,231100
Table 2. Cultivation areas (ha) and production amounts (tons) of the most commonly grown plants in Türkiye, TR21 Thrace Region, and the provinces in the region [3].
Planting Areas and Production QuantitiesPlantsTekirdağEdirneKırklareliTR21 Thrace RegionTürkiye
Planted
Areas
(ha)
Wheat195,973135,181114,097445,2515,569,254
(3.5%)(2.4%)(2.0%)(8.0%)(100%)
Sunflower174,615129,42097,730401,765864,668
(20.2%)(15.0%)(11.3%)(46.5%)(100%)
Paddy105744,553151141,721112,120
(0.9%)(39.7%)(1.3%)(37.2%)(100%)
Barley14,1306572713727,8393,170,272
(0.4%)(0.2%)(0.2%)(0.9%)(100%)
Maize (Silage)47657025829920,088524,861
(0.9%)(1.3%)(1.6%)(3.8%)(100%)
Production Quantities
(tons)
Wheat687,601724,119431,5301,843,25017,700,000
(3.9%)(4.1%)(2.4%)(10.4%)(100%)
Maize (Silage)201,937378,148396,695976,78028,653,531
(0.7%)(1.3%)(1.4%)(3.4%)(100%)
Sunflower201,200257,651190,308649,1591,960,000
(10.3%)(13.1%)(9.7%)(33.1%)(100%)
Paddy8101367,35214,547390,000900,000
(0.9%)(40.8%)(1.6%)(43.3%)(100%)
Sugar beet49,39494,33686,001229,73125,250,213
(0.2%)(0.4%)(0.3%)(0.9%)(100%)
Table 3. Long-term monthly averages climate data, Tekirdağ (1940–2023), Edirne (1930–2023), Kırklareli (1959–2023) [27,28,29].
Climate ParametersLocationJanuaryFebruaryMarchAprilMayJuneJulyAugustSeptemberOctoberNovemberDecemberAvg./Tot.
Avg. Mean Temperature (°C)Tekirdağ4.95.57.311.716.721.123.723.920.315.711.37.314.1
Edirne2.74.47.612.818.022.224.724.520.114.59.24.613.8
Kırklareli2.94.16.912.017.121.423.823.619.414.19.35.113.3
Avg. Max. Temperature (°C)Tekirdağ8.19.011.015.720.625.328.128.324.519.514.810.518.0
Edirne6.79.413.419.324.829.232.032.027.420.814.28.619.8
Kırklareli6.98.612.217.923.528.030.730.726.220.013.98.819.0
Avg. Min. Temperature (°C)Tekirdağ2.02.54.18.112.716.719.119.416.212.18.24.410.5
Edirne−0.50.52.97.111.715.517.417.313.59.35.31.48.5
Kırklareli0.11.03.07.111.615.617.817.814.19.85.92.38.8
Avg. Daily Sunshine (hour)Tekirdağ2.83.44.26.07.48.59.48.46.84.93.22.55.6
Edirne2.43.64.56.28.09.210.39.87.55.23.22.26.0
Kırklareli2.02.53.64.76.36.87.57.55.53.82.71.84.6
Precipitation (mm)Tekirdağ68.054.553.442.137.238.323.815.532.760.274.380.0580.0
Edirne65.052.250.148.752.447.131.723.335.956.767.370.6601.0
Kırklareli65.051.348.745.449.352.627.821.532.851.566.771.1583.7
Table 4. The crop characteristics of wheat and sunflower for Tekirdağ, Edirne, and Kırklareli.
CropCrop Parameters TekirdağEdirneKırklareliReference
WheatCrop Development Period (days)Initial 303030[30]
Development146170170[30]
Mid-Season 474040[30]
Late-Season 303030[30]
Crop Coefficient
(Kc)
Initial0.620.610.56[30]
Mid-Season1.091.121.12[30]
Late-Season0.200.230.23[30]
Rooting Depth
(m)
Initial0.300.300.30[31]
Late-Season0.900.900.90[31]
Sowing Date15 October15 October15 October[30]
Vegetation Duration (days)252270270[30]
Critical Depletion (Fraction)0.50.50.5[32]
Yield Response Factor1.01.0 1.0 [32]
SunflowerCrop Development Period (days)Initial 252525[30]
Development303030[30]
Mid-Season 606060[30]
Late-Season 303030[30]
Crop Coefficient
(Kc)
Initial0.400.380.36[30]
Mid-Season1.111.141.12[30]
Late-Season1.310.340.32[30]
Rooting Depth
(m)
Initial0.300.300.30[33]
Late-Season0.900.900.90[34]
Sowing Date15 April15 April15 April[30]
Vegetation Duration (days)145145145[30]
Critical Depletion (Fraction)0.50.50.5[32]
Yield Response Factor1.01.0 1.0 [32]
Table 5. Soil properties [35].
Soil ParametersSoil Types
Light (Sand)Medium (Loam)Heavy (Clay)
Total available soil moisture (mm m−1)60.0140.0200.0
Maximum rain infiltration rate (mm day−1)4080160
Maximum rooting depth (cm)900900900
Initial soil moisture depletion (%)000
Initial available soil moisture (mm m−1)60.0140.0200.0
Table 6. Total net irrigation water requirement (mm) and changes in total net irrigation water amounts (%) according to different soil structures in Tekirdağ, Edirne, and Kırklareli.
Soil Texture Change SituationTotal Net Irrigation Requirement (mm)
SunflowerWheat
TekirdağEdirneKırklareliAverageTekirdağEdirneKırklareliAverage
Light458.3529.9488.2492.1263.5392.3371.9342.5
Medium425.3497.2449.6457.4218.5335.6319.1291.0
Heavy402.2477.9433.1437.7162.7276.1259.8232.9
Average428.6501.7456.9 214.9334.6316.9
Total Net Irrigation Change (%)
Ligth to Medium−7.2−6.2−7.9−7.1−17.1−14.5−14.2−15.0
Medium to Heavy−5.4−3.9−3.7−4.3−25.5−17.7−18.6−20.0
Light to Heavy−12.2−9.8−11.3−11.1−38.2−29.6−30.1−32.0
Table 7. Minimum and maximum values (mm) of total net irrigation water for sunflower in Tekirdağ, Edirne, and Kırklareli according to soil texture and the years of occurrence.
Soil TextureTotal Net Irrigation Requirement (mm) for Sunflower
TekirdağEdirneKırklareli
Min.
(Year)
Max.
(Year)
AverageMin.
(Year)
Max.
(Year)
AverageMin.
(Year)
Max.
(Year)
Average
Light319.4 (1988)546.5 (1971)458.3360.9 (1975)653.9 (2000)529.9375.4 (1976)642.6 (2000)488.2
Medium261.9 (1975)517.0 (1973)425.3335.9 (1975)658.3 (2000)497.2322.3 (1976)595.8 (2000)449.6
Heavy275.4 (1992)467.4 (1984)402.2283.5 (1975)657.8 (2000)477.9279.5 (1976)558.6 (1978)433.1
Table 8. Minimum and maximum values of total net irrigation water for wheat in Tekirdağ, Edirne, and Kırklareli according to soil texture (mm) and the years of occurrence.
Soil TextureTotal Net Irrigation Requirement (mm) for Wheat
TekirdağEdirneKırklareli
Min.
(Year)
Max.
(Year)
AverageMin.
(Year)
Max.
(Year)
AverageMin.
(Year)
Max.
(Year)
Average
Light111.4
(1988)
383.8 (1972)263.5286.7 (1998)520.8 (1972)392.3264.4 (1988)508.8 (1972)371.9
Medium65.7
(1988)
359.1 (1972)218.5183.4 (1975)538.3 (1972)335.6189.2 (1988)492.9 (2000)319.1
Heavy0.0
(1988)
273.9 (1983)162.7174.3 (1975)432.1 (1990)276.1175.0 (1980)422.0 (1972)259.8
Disclaimer/Publisher’s Note: The statements, opinions and data contained in all publications are solely those of the individual author(s) and contributor(s) and not of MDPI and/or the editor(s). MDPI and/or the editor(s) disclaim responsibility for any injury to people or property resulting from any ideas, methods, instructions or products referred to in the content.

