
Geographic Exposomics of Cardiac Troponin I Reference Intervals in Chinese Adults: Climate-Topography Coupling-Driven Spatial Prediction and Health Risk Assessment


Abstract
1. Introduction
2. Materials and Methods
2.1. Source of Information
2.2. Selection of Geographical Factors
2.3. Analysis of Modeling Approaches
2.3.1. Spatial Autocorrelation Analysis
2.3.2. Analysis of Correlation
2.3.3. Multicollinearity Diagnosis
2.3.4. Analysis of Ridge Regression
2.3.5. Kriging Interpolation
3. Results
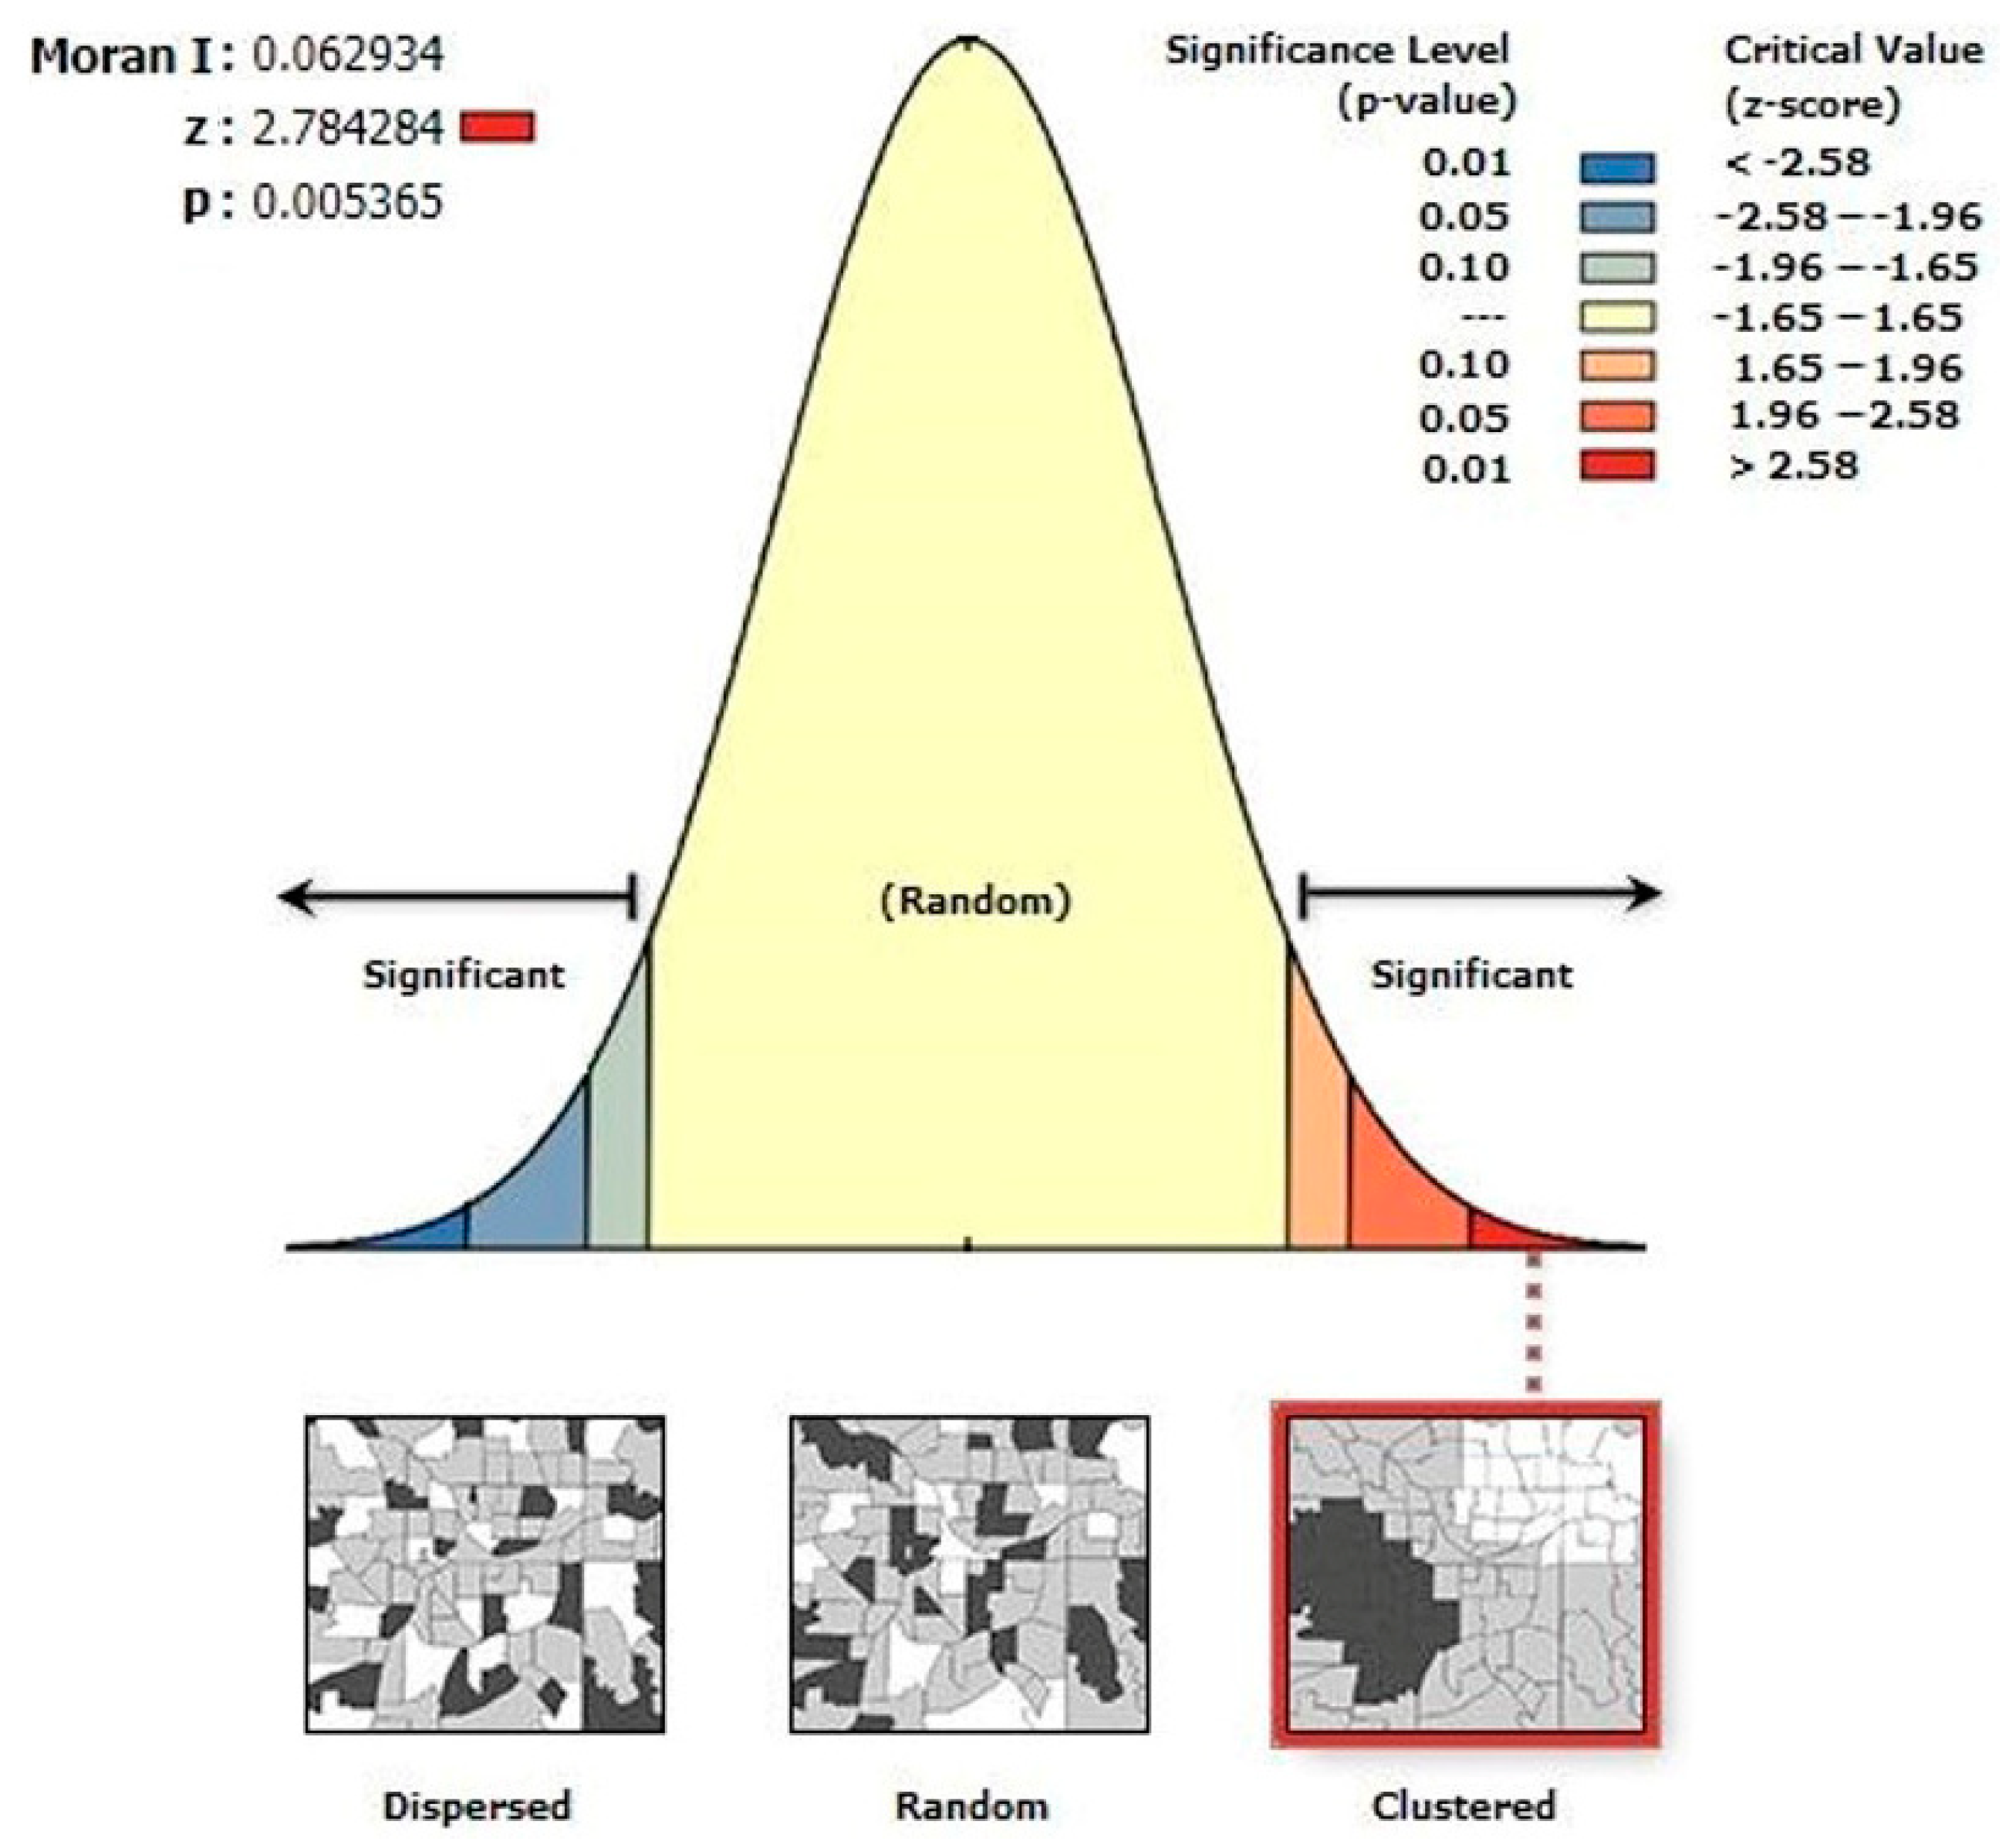
3.1. Analysis of Spatial Autocorrelation
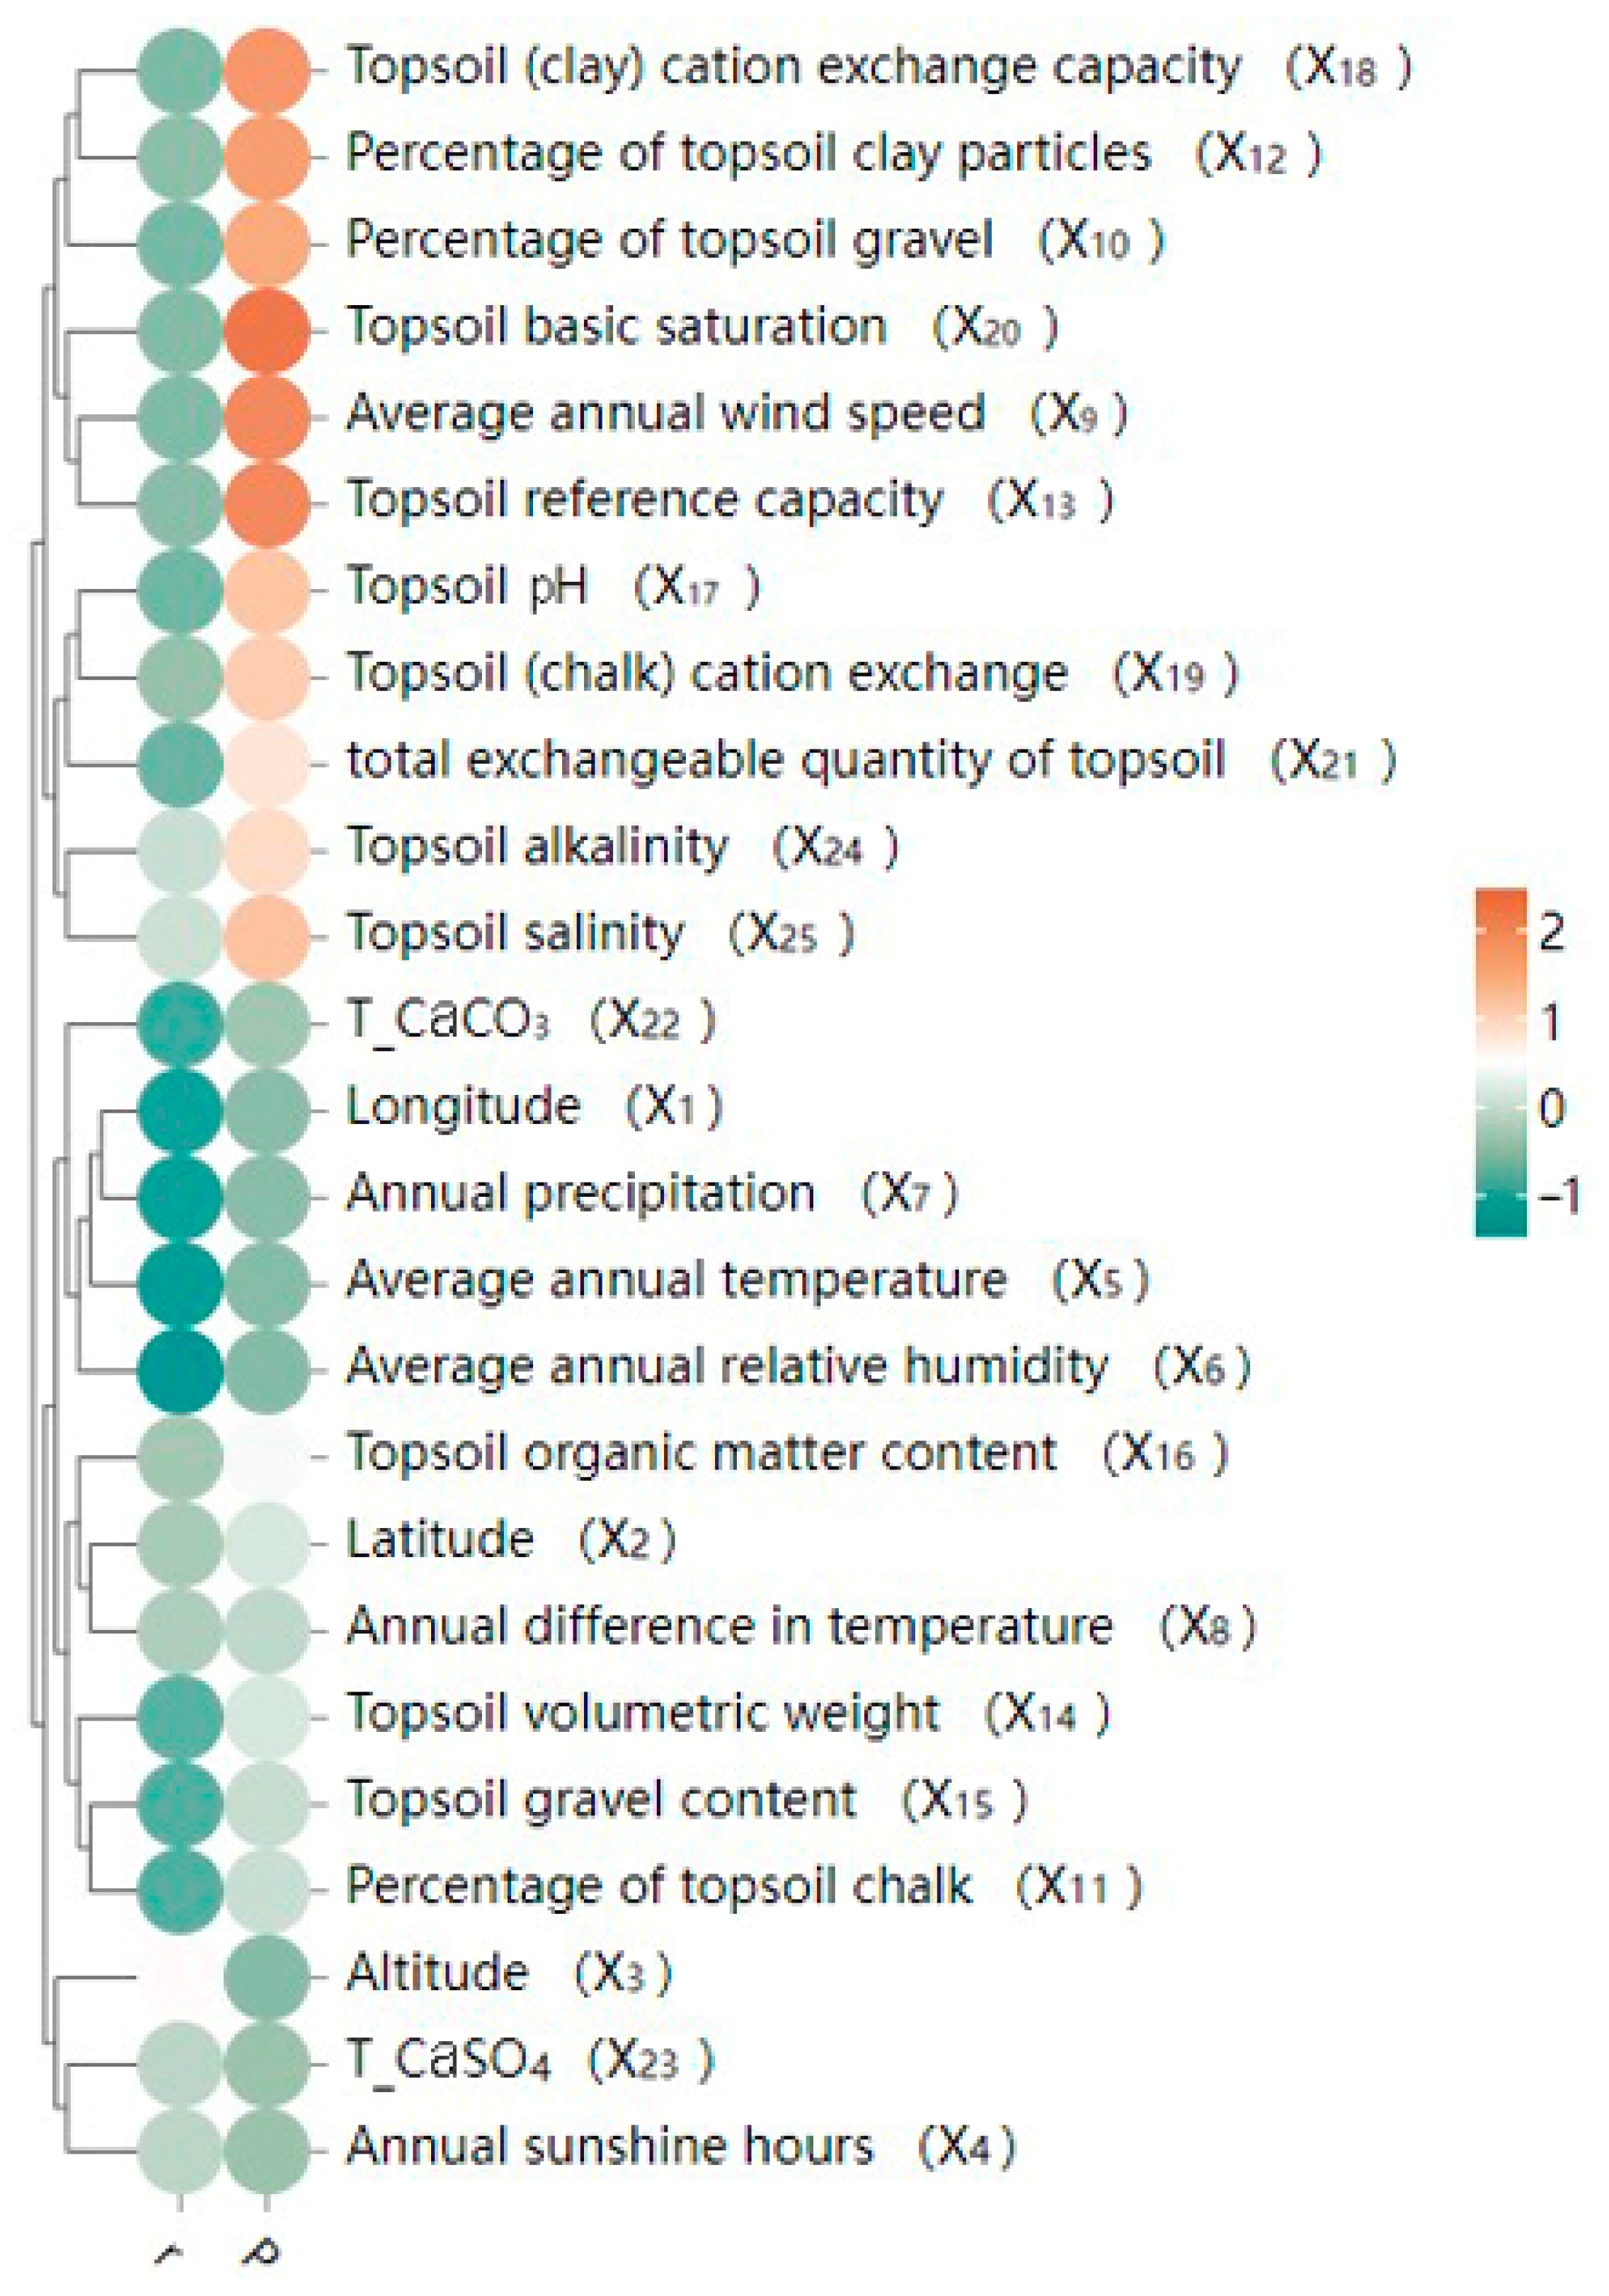
3.2. Analysis of Correlation
3.3. Multicollinearity Diagnostics
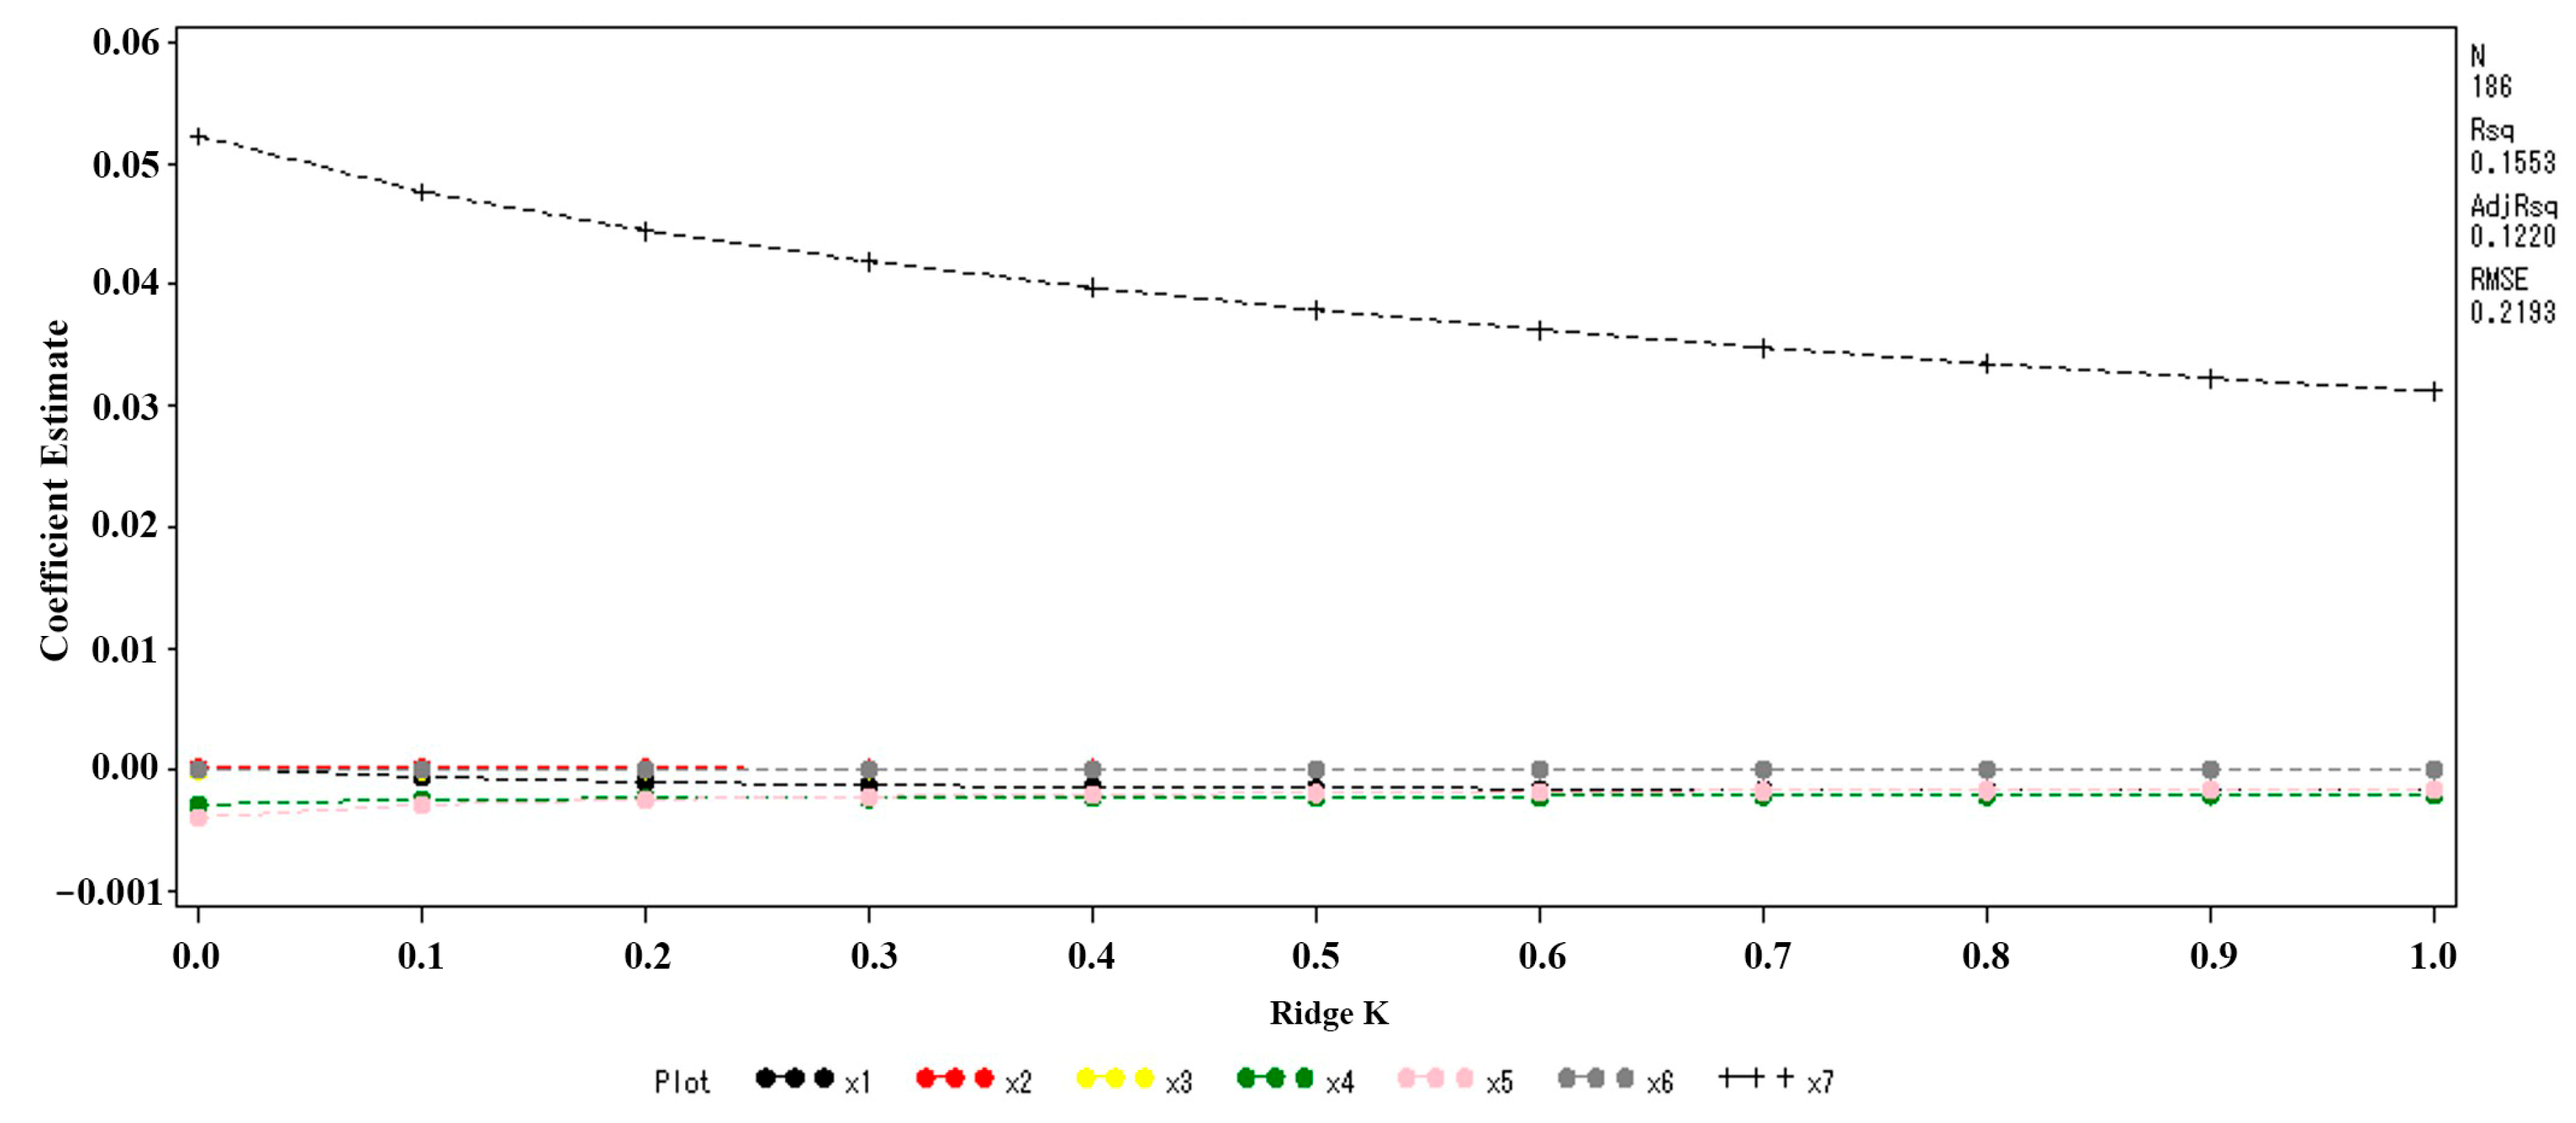
3.4. Ridge Regression Analysis
3.5. Spatial Trend Analysis
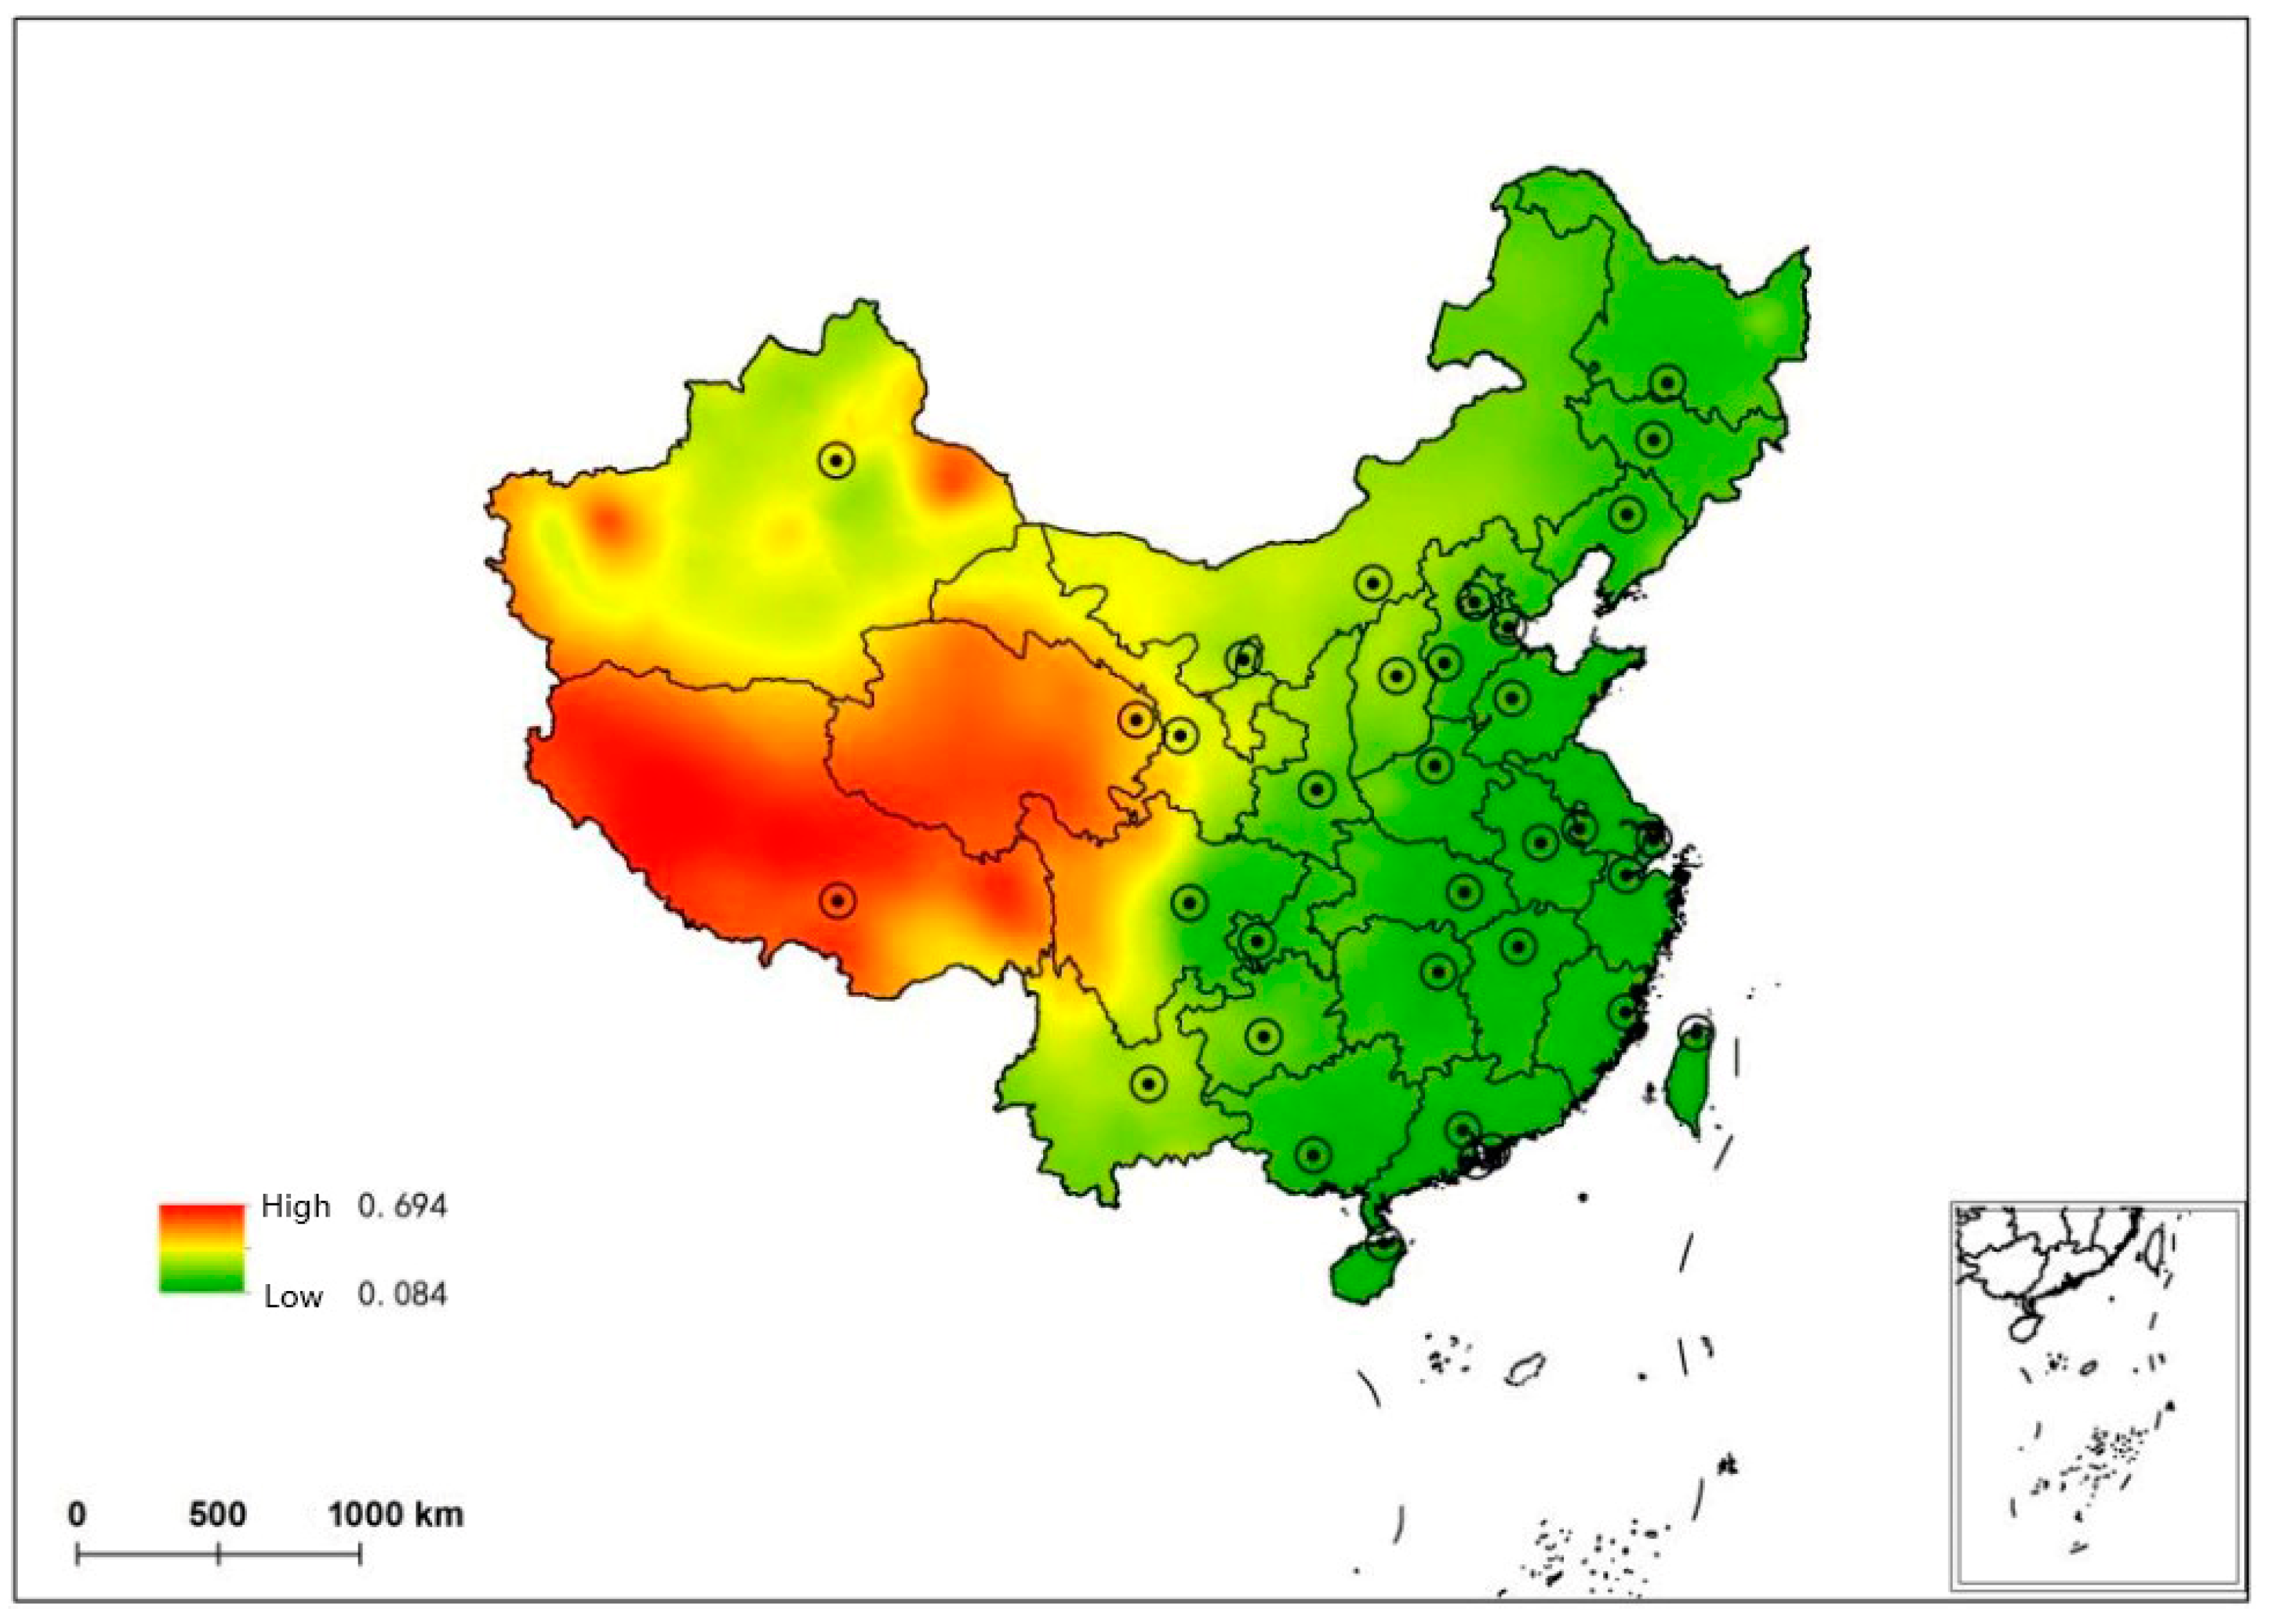
3.6. Kriging Interpolation
4. Discussion
5. Conclusions
Author Contributions
Funding
Institutional Review Board Statement
Informed Consent Statement
Data Availability Statement
Conflicts of Interest
Appendix A

| Geographical Indicators | r | p | Geographical Indicators | r | p |
|---|---|---|---|---|---|
| Longitude (X1) | −0.192 | 0.009 | Topsoil volumetric weight (X14) | −0.088 | 0.233 |
| Latitude (X2) | 0.088 | 0.231 | Topsoil gravel content (X15) | −0.098 | 0.182 |
| Altitude (X3) | 0.377 | 0.001 | Topsoil organic matter content (X16) | 0.071 | 0.336 |
| Annual sunshine hours (X4) | 0.146 | 0.048 | Topsoil pH (X17) | −0.039 | 0.602 |
| Average annual temperature (X5) | −0.230 | 0.002 | Topsoil (clay) cation exchange capacity (X18) | −0.016 | 0.831 |
| Average annual relative humidity (X6) | −0.271 | 0.001 | Topsoil (chalk) cation exchange (X19) | 0.042 | 0.571 |
| Annual precipitation (X7) | −0.200 | 0.006 | Topsoil basic saturation (X20) | 0.000 | 0.998 |
| Annual difference in temperature (X8) | 0.104 | 0.157 | total exchangeable quantity of topsoil (X21) | −0.053 | 0.472 |
| Average annual wind speed (X9) | −0.008 | 0.908 | T_CaCO3 (X22) | −0.135 | 0.067 |
| Percentage of topsoil gravel (X10) | −0.025 | 0.733 | T_CaSO4 (X23) | 0.145 | 0.049 |
| Percentage of topsoil chalk (X11) | −0.097 | 0.190 | Topsoil alkalinity (X24) | 0.191 | 0.513 |
| Percentage of topsoil clay particles (X12) | 0.020 | 0.789 | Topsoil salinity (X25) | 0.196 | 0.611 |
| Topsoil reference capacity (X13) | 0.009 | 0.907 |
References
- Lyngbakken, M.N.; Kimenai, D.M.; Hveem, K.; Dalen, H.; Rosjo, H.; Omland, T. Patterns of Cardiac Troponin I concentrations as risk predictors of cardiovascular disease and death: The trondelag health study. Am. J. Med. 2023, 136, 902–910. [Google Scholar] [CrossRef] [PubMed]
- Jakubiak, G. Cardiac troponin serum concentration measurement is useful not only in the diagnosis of acute cardiovascular events. J. Pers. Med. 2024, 14, 230. [Google Scholar] [CrossRef] [PubMed]
- Welsh, P.; Preiss, D.; Hayward, C.; Shah, A.S.V.; McAllister, D.; Briggs, A.; Boachie, C.; McConnachie, A.; Padmanabhan, S.; Welsh, C.; et al. Cardiac troponin T and troponin I in the general population comparing and contrasting their genetic geterminants and associations with outcomes. Circulation 2019, 139, 2754–2764. [Google Scholar] [CrossRef] [PubMed]
- Zhao, X.; Zhao, M. Research progress of the reference interval of cardiac troponin. Chin. J. Lab. Med. 2020, 43, 5. [Google Scholar] [CrossRef]
- Landmesser, U.; Spiekermann, S.; Preuss, C.; Sorrentino, S.; Fischer, D.; Manes, C.; Mueller, M.; Drexler, H. Angiotensin II induces endothelial xanthine oxidase activation—Role for endothelial dysfunction in patients with coronary disease. Arterioscler. Thromb. Vasc. Biol. 2007, 27, 943–948. [Google Scholar] [CrossRef]
- Klinkenberg, L.J.J.; van Dijk, J.; Tan, F.E.S.; van Loon, L.J.C.; van Dieijen-Visser, M.P.; Meex, S.J.R. Circulating Cardiac Troponin T exhibits a diurnal rhythm. J. Am. Coll. Cardiol. 2014, 63, 1788–1795. [Google Scholar] [CrossRef]
- Sirin, G.; Borlu, F. Is Cardiac Troponin I valuable to detect low-level myocardial damage in congestive heart failure? Sisli Etfal Hastan. Tip Bul. 2019, 53, 172–178. [Google Scholar] [CrossRef]
- Jiang, L.; Shen, W.; Wang, A.; Fang, H.; Wang, Q.; Li, H.; Liu, S.; Shen, Y.; Liu, A. Cardiovascular disease burden attributable to high sodium intake in China: A longitudinal study from 1990 to 2019. Nutrients 2024, 16, 1307. [Google Scholar] [CrossRef]
- Wu, S.; Xu, W.; Guan, C.; Lv, M.; Jiang, S.; Zhang, J. Global burden of cardiovascular disease attributable to metabolic risk factors, 1990-2019: An analysis of observational data from a 2019 Global Burden of Disease study. BMJ Open 2023, 13, e069397. [Google Scholar] [CrossRef]
- Lelieveld, J.; Klingmueller, K.; Pozzer, A.; Poeschl, U.; Fnais, M.; Daiber, A.; Muenzel, T. Cardiovascular disease burden from ambient air pollution in Europe reassessed using novel hazard ratio functions. Eur. Heart J. 2019, 40, 1590–1596. [Google Scholar] [CrossRef]
- Song, C.; He, J.; Wu, L.; Jin, T.; Chen, X.; Li, R.; Ren, P.; Zhang, L.; Mao, H. Health burden attributable to ambient PM2.5 in China. Environ. Pollut. 2017, 223, 575–586. [Google Scholar] [CrossRef] [PubMed]
- Duan, S.; Kaushal, S.S. Salinization alters fluxes of bioreactive elements from stream ecosystems across land use. Biogeosciences 2015, 12, 7331–7347. [Google Scholar] [CrossRef]
- Liu, G.F.; Xu, Z.H.; Yao, Z.L.; Lai, Q. Effects of irrigation on the salt ions in sulfate-type saline-alkali soil. J. Arid Land Resour. Environ. 2019, 33, 6. [Google Scholar] [CrossRef]
- Lv, S.; Kong, F.; Shi, F. Characteristics of variation and geographic distribution of total dissolvedsolids in drinking water in rural areas of Shandong. J. Environ. Health 2018, 35, 813–816. [Google Scholar] [CrossRef]
- Cheng, W.; Liu, N.; Zhang, Y.; Qi, Y.; Yang, J.; Deng, Z.; Xiao, L.; Xiao, X. Exogenous hydrogen sulfide protects against myocardial injury after skeletal muscle ischemia/reperfusion by inhibiting inflammatory cytokines and oxidative stress in rats. J. South. Med. Univ. 2013, 33, 5. [Google Scholar] [CrossRef]
- Zheng, B.; Chu, Y.; Zhao, X.; Gan, Z.; Liang, H. Application and comparison of nanofiltration and reverse osmosis technology in high salinity groundwater. Water Wastewater Eng. 2019, 45, 17–24. [Google Scholar]
- Wang, W.; Zhang, L.; Liu, Q. Distribution and affecting factors of soil cation exchange capacity in watershed of the loess plateau. J. Soil Water Conserv. 2012, 26, 123–127. [Google Scholar] [CrossRef]
- Liu, Y.; Tong, D.; Liu, X. Measuring spatial autocorrelation of vectors. Geogr. Anal. 2015, 47, 300–319. [Google Scholar] [CrossRef]
- Chen, Y. An analytical process of spatial autocorrelation functions based on Moran’s index. PLoS ONE 2021, 16, e0249589. [Google Scholar] [CrossRef]
- Assaf, A.G.; Tsionas, M.; Tasiopoulos, A. Diagnosing and correcting the effects of multicollinearity: Bayesian implications of ridge regression. Tour. Manag. 2019, 71, 1–8. [Google Scholar] [CrossRef]
- Marquardt, D.W.; Snee, R.D. Ridge Regression in Practice. Am. Stat. 1975, 29, 3–20. [Google Scholar] [CrossRef]
- Li, T.; Ge, M.; Li, X.; Lu, X.; Li, J.; Yang, F.; Chai, L.; Wang, C. Male serum bilirubin reference value and geographical factors of ridge regression analysis. J. Jinan Univ. Nat. Sci. Med. Ed. 2018, 39, 324–331. [Google Scholar]
- Oliver, M.A.; Webster, R. Kriging: A method of interpolation for geographical information systems. Int. J. Geogr. Inf. Syst. 1990, 4, 313–332. [Google Scholar] [CrossRef]
- Xu, X.; Xu, Y.; Sun, Q.; Xie, T.; Zhang, H. Comparision study on meteorological spatial interpolation approaches in Kangdian region of China. J. Cent. China Norm. Univ. 2018, 52, 1000–1190. [Google Scholar] [CrossRef]
- Wei, F.; Cao, H.; Xu, X. Application of variograms in analyzing spatial distribution of precipitation field. J. Nanjing Inst. Meteorol. 2002, 25, 795–799. [Google Scholar]
- Abdulmanov, R.; Miftakhov, I.; Ishbulatov, M.; Galeev, E.; Shafeeva, E. Comparison of the effectiveness of GIS-based interpolation methods for estimating the spatial distribution of agrochemical soil properties. Environ. Technol. Innov. 2021, 24, 101970. [Google Scholar] [CrossRef]
- Xu, A.; Hu, L.; Shu, H. Extension and implementation from spatial-only to spatiotemporal Kriging interpolation. J. Comput. Appl. 2011, 31, 273–276. [Google Scholar] [CrossRef]
- Zhao, W.; Yang, M.; Yu, G.; Chen, Z.; Wang, Q. The temporal response of soil respiration to environment differed from that on spatial scale. Agric. For. Meteorol. 2023, 342, 109752. [Google Scholar] [CrossRef]
- Li, T.; Zhao, Y. Soil science with relevance to environment and human beings—A review on “Pedogenesis and Soil Taxonomy”. Ecol. Environ. 2008, 17, 1317–1318. [Google Scholar] [CrossRef]
- Heidari, H.; Mohammadbeigi, A.; Khazaei, S.; Soltanzadeh, A.; Asgarian, A.; Saghafipour, A. The effects of climatic and environmental factors on heat-related illnesses: A systematic review from 2000 to 2020. Urban Clim. 2020, 34, 100720. [Google Scholar] [CrossRef]
- Ge, Q.; Zhu, H. Changes of the physical and human geographical environment in China during the past 2000 years. Acta Geogr. Sin. 2021, 76, 3–14. [Google Scholar] [CrossRef]
- Peng, S.; Zhou, L. Research progress of mechanisms of oxidative stress in septic cardiomyopathy. Zhonghua Wei Zhong Bing Ji Jiu Yi Xue 2022, 34, 1337–1341. [Google Scholar] [CrossRef]
- Wang, W.; Fang, H.; Groom, L.; Cheng, A.; Zhang, W.; Liu, J.; Wang, X.; Li, K.; Han, P.; Zheng, M.; et al. Superoxide flashes in single mitochondria. Cell 2008, 134, 279–290. [Google Scholar] [CrossRef] [PubMed]
- Hu, Y.; Sun, Q.; Li, Z.; Chen, J.; Shen, C.; Song, Y.; Zhong, Q. High basal level of autophagy in high-altitude residents attenuates myocardial ischemia-reperfusion injury. J. Thorac. Cardiovasc. Surg. 2014, 148, 1674–1680. [Google Scholar] [CrossRef] [PubMed]
- Zhao, M.; Wu, Q.; Duanmu, W.; Shen, J.; Yuan, W.; Sun, Y.; Zhang, X.; Zhang, J.; He, S. Clinical analysis of myocardial injury in highlanders with pulmonary hypertension. High Alt. Med. Biol. 2024, 25, 205–211. [Google Scholar] [CrossRef]
- Calmettes, G.; Deschodt-Arsac, V.; Gouspillou, G.; Miraux, S.; Muller, B.; Franconi, J.; Thiaudiere, E.; Diolez, P. Improved energy supply regulation in chronic hypoxic mouse counteracts hypoxia-induced altered cardiac energetics. PLoS ONE 2010, 5, e9306. [Google Scholar] [CrossRef]
- Lalande, S.; Johnson, B.D. Diastolic dysfunction: A link between hypertension and heart failure. Drugs Today 2008, 44, 503–513. [Google Scholar] [CrossRef]
- Celes, M.R.N.; Malvestio, L.M.; Suadicani, S.O.; Prado, C.M.; Figueiredo, M.J.; Campos, E.C.; Freitas, A.C.S.; Spray, D.C.; Tanowitz, H.B.; da Silva, J.S.; et al. Disruption of calcium homeostasis in cardiomyocytes underlies cardiac structural and functional changes in severe sepsis. PLoS ONE 2013, 8, e68809. [Google Scholar] [CrossRef]
- Li, Y. Distribution characteristics of soil base ions in micro topography in xiao bai river area of the yellow river wetland. Geogr. Sci. Res. 2022, 11, 9. [Google Scholar] [CrossRef]
- Kuang, X.; Schenk, F.; Smittenberg, R.; Hallberg, P.; Zhang, Q. Seasonal evolution differences of east Asian summer monsoon precipitation between Bolling-Allerod and younger Dryas periods. Clim. Change 2021, 165, 19. [Google Scholar] [CrossRef]
- Zhang, S.; Hu, Y.; Li, Z. Recent changes and future projection of precipitation in Northwest China. Progress. Inquisitiones De Mutat. Clim. 2022, 18, 683–694. [Google Scholar] [CrossRef]

| Geographical Indicators | Specific Indicators | Units |
|---|---|---|
| Terrain location index | Longitude (X1) | (°) |
| Latitude (X2) | (°) | |
| Altitude (X3) | (m) | |
| Meteorological indicators | Annual sunshine hours (X4) | (h) |
| Average annual temperature (X5) | (°C) | |
| Average annual relative humidity (X6) | (%) | |
| Annual precipitation (X7) | (mm) | |
| Annual difference in temperature (X8) | (°C) | |
| Average annual wind speed (X9) | (m/s) | |
| Soil indicators | Percentage of topsoil gravel (X10) | (%) |
| Percentage of topsoil chalk (X11) | (%) | |
| Percentage of topsoil clay particles (X12) | (%) | |
| Topsoil reference capacity (X13) | (cm3/g) | |
| Topsoil volumetric weight (X14) | (g/cm3) | |
| Topsoil gravel content (X15) | (%) | |
| Topsoil organic matter content (X16) | (%) | |
| Topsoil PH (X17) | / | |
| Topsoil (clay) cation exchange capacity (X18) | (cmol+/kg) | |
| Topsoil (chalk) cation exchange (X19) | (cmol+/kg) | |
| Topsoil basic saturation (X20) | (%) | |
| total exchangeable quantity of topsoil (X21) | (cmol+/kg) | |
| T_CaCO3 (X22) | (g/kg) | |
| T_CaSO4 (X23) | (mg/kg) | |
| Topsoil alkalinity (X24) | (cmol+/kg) | |
| Topsoil salinity (X25) | (%) |
| Geographical Indicators | TOL | VIF |
|---|---|---|
| Longitude (X1) | 0.508 | 1.969 |
| Altitude (X3) | 0.383 | 2.613 |
| Annual sunshine hours (X4) | 0.278 | 3.594 |
| Average annual temperature (X5) | 0.205 | 4.886 |
| Average annual relative humidity (X6) | 0.197 | 5.087 |
| Annual precipitation (X7) | 0.184 | 5.420 |
| T_CaSO4 (X23) | 0.892 | 1.122 |
Disclaimer/Publisher’s Note: The statements, opinions and data contained in all publications are solely those of the individual author(s) and contributor(s) and not of MDPI and/or the editor(s). MDPI and/or the editor(s) disclaim responsibility for any injury to people or property resulting from any ideas, methods, instructions or products referred to in the content. |
© 2025 by the authors. Licensee MDPI, Basel, Switzerland. This article is an open access article distributed under the terms and conditions of the Creative Commons Attribution (CC BY) license (https://creativecommons.org/licenses/by/4.0/).
Share and Cite
Li, T.; Zhang, J.; Zhao, X.; Wu, Z. Geographic Exposomics of Cardiac Troponin I Reference Intervals in Chinese Adults: Climate-Topography Coupling-Driven Spatial Prediction and Health Risk Assessment. Water 2025, 17, 1426. https://doi.org/10.3390/w17101426
Li T, Zhang J, Zhao X, Wu Z. Geographic Exposomics of Cardiac Troponin I Reference Intervals in Chinese Adults: Climate-Topography Coupling-Driven Spatial Prediction and Health Risk Assessment. Water. 2025; 17(10):1426. https://doi.org/10.3390/w17101426
Chicago/Turabian StyleLi, Tianyu, Jiayu Zhang, Xinfeng Zhao, and Zihao Wu. 2025. "Geographic Exposomics of Cardiac Troponin I Reference Intervals in Chinese Adults: Climate-Topography Coupling-Driven Spatial Prediction and Health Risk Assessment" Water 17, no. 10: 1426. https://doi.org/10.3390/w17101426
APA StyleLi, T., Zhang, J., Zhao, X., & Wu, Z. (2025). Geographic Exposomics of Cardiac Troponin I Reference Intervals in Chinese Adults: Climate-Topography Coupling-Driven Spatial Prediction and Health Risk Assessment. Water, 17(10), 1426. https://doi.org/10.3390/w17101426