1. Introduction
In recent years, the problem of water quality has been the subject of numerous studies, as it is closely related to public health risks [
1,
2] and environmental issues [
3]. Several authors have developed and applied innovative methodologies for monitoring the chemical and biological parameters of water quality within water distribution networks (WDNs) and urban drainage systems (UDSs) [
4,
5,
6]. Urban drainage systems can represent strategic tools for analysing parameters entering wastewater treatment plants and contribute to evaluating the efficiency of pollutant removal processes. This scoping review aims to evaluate the current state of technologies for monitoring pollutants in water and sewage networks, focusing on their effectiveness, challenges, and future directions. This work differentiates itself from prior studies by explicitly contrasting the performance and applicability of colorimetric sensors, lab-on-a-chip devices, and Raman spectrometry under a unified framework, thereby highlighting the unique strengths and challenges of each approach.
To monitor the multiple chemical and biological parameters involved in contamination episodes, the scientific literature has examined and developed different technologies and sensors that are mainly applied in WDNs. A review of wastewater monitoring technologies suggests that, from an electronic point of view, sensors operate according to similar standards in both water distribution networks and urban drainage systems. This feature allows the integration of different types of sensors on a single monitoring infrastructure, ensuring greater flexibility and wider availability of devices in the market [
7]. However, from the point of view of water pollution mitigation, recent studies have primarily focused on enhancing wastewater treatment processes and pollutant removal efficiencies [
8,
9,
10], underscoring the need for complementary advances in continuous monitoring solutions to rapidly detect contaminants in distribution and drainage systems.
However, from the perspective of water pollution mitigation, many recent studies have been devoted to improving pollutant removal techniques. For example, advanced sorbent materials have been developed for the efficient uptake of nutrients like phosphate [
11,
12,
13,
14], including versatile bimetallic composites capable of simultaneously removing toxic metals (e.g., Cr(VI)) and phosphate [
15]. Likewise, novel catalytic systems such as nanostructured catalysts for the oxidative degradation of organic contaminants [
16] and zero-valent iron-based reactive membranes [
17,
18] have enhanced performance in breaking down recalcitrant pollutants. These recent advances in treatment efficiency further underscore the need for complementary progress in continuous monitoring solutions to detect contaminants in distribution and drainage systems rapidly.
From the point of view of measurements, differences emerge based on the parameters analysed, acquisition times, and required accuracy. Some parameters, such as temperature and pH, can be determined directly using dedicated technologies, whereas others, such as salinity or the concentration of dissolved matter, are estimated indirectly through measurements of redox potential, conductivity, turbidity, or a combination of these factors [
19].
The evolution of computational algorithms, technological improvements in measuring instruments, and development of reliable and economically sustainable microcontrollers have favoured the implementation of new monitoring strategies. In particular, the transition from discontinuous monitoring based on punctual sampling to continuous and real-time monitoring has marked an important technological advancement. Owing to the development of advanced algorithms, it is now possible to promptly detect contamination episodes within water networks [
20].
A key element that has facilitated this innovation has been the advent of the Internet of Things (IoT), which allows continuous access to sensors and on-demand data collection. The IoT can be defined as the integration of intelligent devices connected to each other via the Internet with the aim of optimising the management of monitored systems [
21]. This discipline has experienced rapid development in recent years, favoured by innovation in the field of low-cost and high-performance hardware. The introduction of microcomputers, such as Raspberry Pi, and microcontrollers, such as Arduino, has allowed the creation of advanced solutions capable of promoting direct interaction between people and electronic devices.
The evolution of the IoT has led to an expansion of its original definition. Today, the term encompasses the set of technologies applied to physical objects to improve their functionality through connectivity to telecommunication networks. This paradigm enhances the capabilities of any device, instrument, or sensor, transforming it into an active node in an intelligent network. Therefore, the goal of the IoT is to simplify interactions with everyday objects, as well as with technologically advanced tools. This approach has proven crucial for achieving the objectives of Industry 4.0, an industrial model characterised by the integration of digital systems that can be easily controlled by devices such as computers, tablets, and smartphones [
22].
In this context, the application of the IoT with novel analytical methodologies offers a strong opportunity to solve some of the problems surrounding the monitoring of contaminants of emerging concern (CEC) by improving the sensitivity and speed of analysis [
23]. These substances include a wide range of chemical and biological compounds such as pharmaceutical residues, pesticides, microplastics, hormones, and industrial chemicals that accumulate in aquatic ecosystems and can seriously affect human health and biodiversity. Various sources of contamination, such as industrial wastewater, agricultural runoff, and sewage released from household chemicals, frequently lead to the introduction of CECs into water bodies.
Integrating digital sensors, IoT systems, and open-source technologies, such as Arduino and Raspberry Pi, has created a paradigm shift by overcoming the limitations of traditional analytical methods, thereby allowing real-time monitoring of CECs in water and sewer networks [
24,
25,
26,
27]. This is a crucial shift for CEC scour management and pollution prevention, which assists in enhancing the water quality and reducing any associated environmental risk. Although IoT technologies offer real-time monitoring capabilities, challenges such as data security and device interoperability remain.
One of the biggest challenges surrounding CECs is the absence of established regulations or consolidated monitoring protocols, despite an increasing number of studies emphasising their impact on human health and ecosystems. Because of their chemical nature and presence in ultra-trace concentrations (ng/L or µg/L), the use of conventional techniques (liquid chromatography–mass spectrometry and mass spectrometry) by their very nature certainly renders the detection of these CECs costly in time and money.
Although laboratory techniques have much greater analytical precision, their high price, the personnel required to operate them, and their too-long timeframes have capped any chance for extended or continuous monitoring. To address these limitations, research has focused on the development of more accessible and in situ-friendly tools capable of ensuring rapid and reliable measurements directly at critical points in the water network [
28,
29].
Therefore, several challenges related to CEC monitoring have emerged, including the high spatial and temporal variability of concentrations, which require continuous monitoring strategies for an accurate assessment of their presence and the difficulty of direct detection, as many substances cannot be measured directly but require indirect analytical methods based on chemical–physical indicators, and the influence of environmental parameters, such as pH and temperature variability, which can affect the chemical stability of contaminants and their interaction with aquatic matrices [
30].
Innovative solutions have been introduced to identify these important issues based on portable devices and miniaturised analytical systems. Recent improvements in Raman spectrometry and laboratory-on-chip systems have opened new avenues for efficient and accurate environmental monitoring.
Raman spectroscopy, which allows the interaction between laser light and chemical species to be examined, has readily emerged as a viable option for the non-destructive determination of contaminants in complex aquatic matrices. This technology allows sufficient scope for the deployment of Raspberry Pi-based portable devices, combined with data acquisition modules for the collection of fast, reliable measurements, and for routine in situ monitoring.
Progress has come with the advent of lab-on-a-chip systems and miniaturised devices that integrate chemical reactions, analytical separations, and sensory detections into a single platform [
31]. Such systems permit rapid and highly sensitive analyses to be conducted directly in the field. Recent studies have focused on enhancing the selectivity and sensitivity of pollutant sensors, and breakthroughs in nanomaterials have offered promising results.
Despite these advancements, the integration of different monitoring technologies and their real-world applications poses challenges. This review identifies these integration challenges and proposes future research directions, outlining recent developments in the use of laboratory-on-chip, Raman spectroscopy, and colorimetric systems for the detection of water pollutants.
The reported results aim to improve the knowledge of the accuracy of water quality detection compared to conventional methods. Furthermore, the main gaps in the literature are reviewed, and possible directions for future research are proposed with a focus on optimising solutions for large-scale monitoring.
It should be noted that this review focuses on monitoring methods for trace and emerging contaminants (including selected heavy metals and organic pollutants as case studies), rather than on standard bulk parameters of water quality such as chemical oxygen demand (COD), biological oxygen demand (BOD), or total organic carbon (TOC). Those conventional indices are typically measured by well-established laboratory techniques and are outside the scope of the present work, which is limited to novel sensor technologies for contaminant-specific detection.
2. Methods
This review was performed using the “Rayyan Research” tool (
https://new.rayyan.ai/ accessed on 22 January 2025) following the PRISMA method [
32]. The search was developed using the electronic databases Scopus, PubMed, and ScienceDirect, without any restriction in reference to publication date or language. To select the documents, six keywords related to the areas of water quality, water distribution network, sewerage, colorimetry, lab-on-a-chip, and Raman spectrometry were considered (
Table 1).
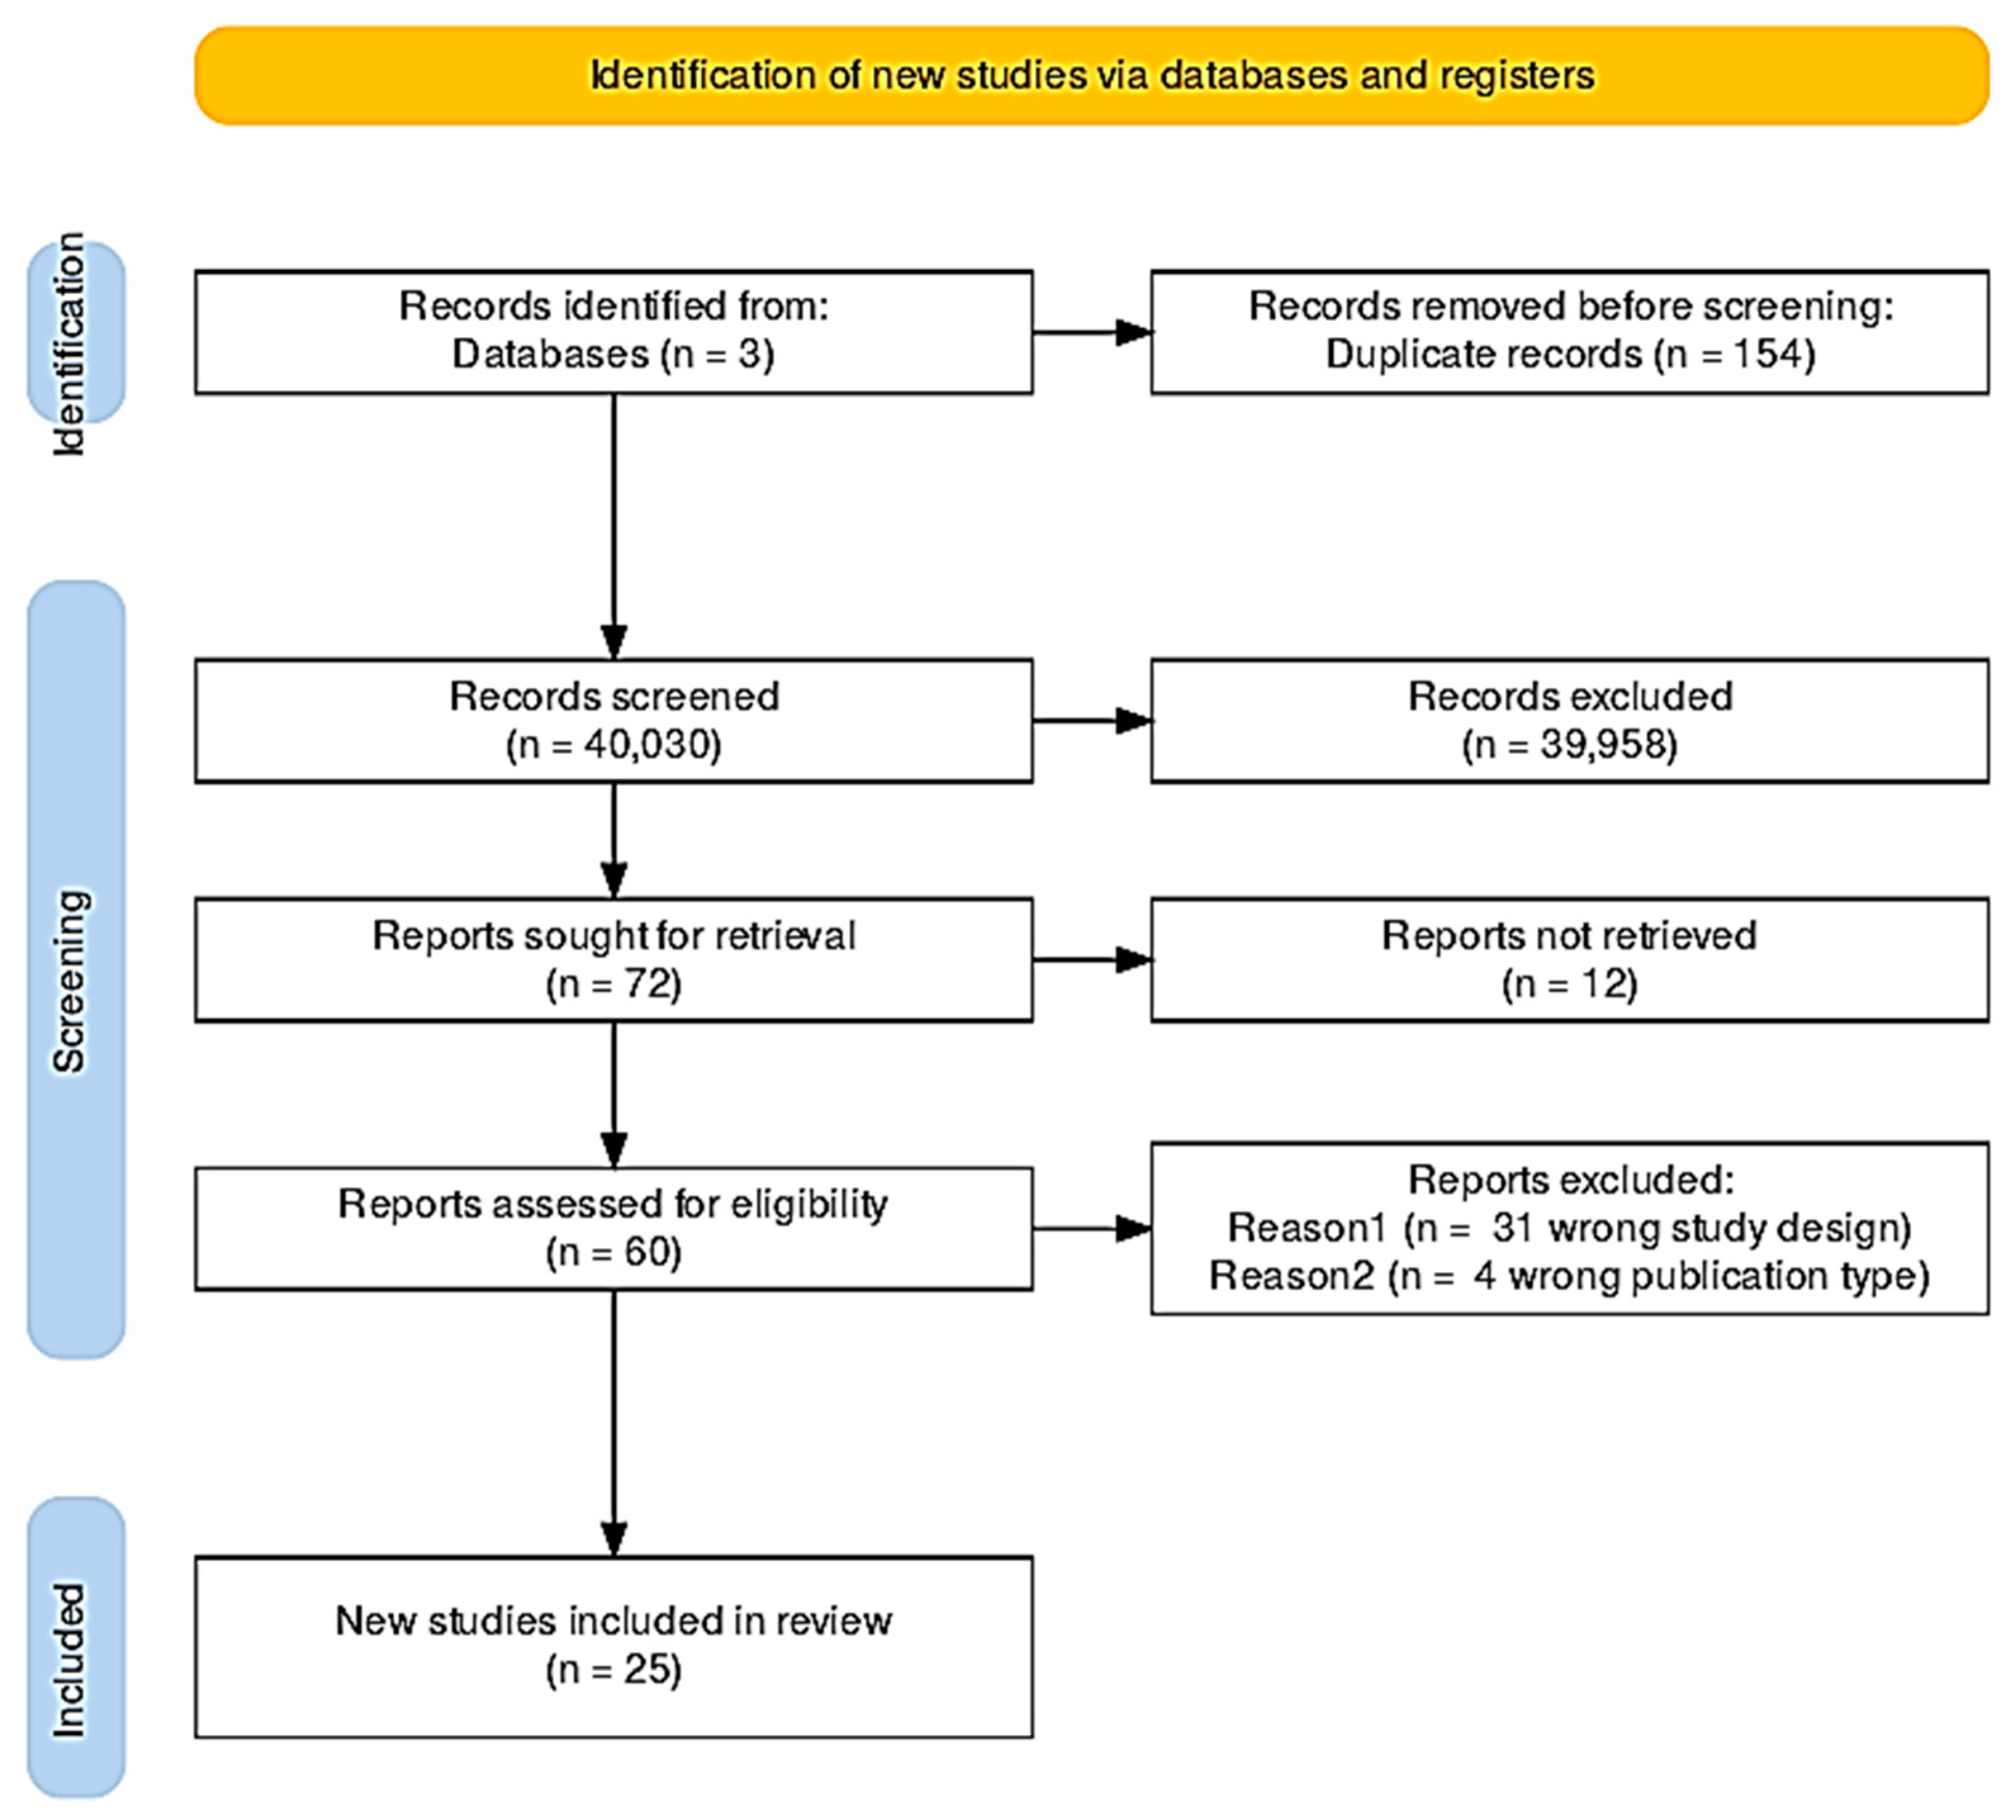
The search produced 40,184 documents, of which 154 duplicates were identified and removed prior to analysis. Using the Rayyan Screening platform, it was possible to examine and evaluate the abstracts and titles of the selected documents for suitability with respect to the review areas. The platform’s machine learning assistance was employed to expedite screening, with AI-suggested inclusion/exclusion decisions being reviewed by the authors for final determination. Rayyan utilises a machine learning algorithm that learns from the inclusion and exclusion decisions made by the reviewers during the initial screening phase. Once a minimum of 50 screening decisions are completed, Rayyan activates its predictive model, assigning a relevance score on a scale from 1 to 5 to each of the remaining undecided references, where a score of 5 denotes the highest likelihood of inclusion.
This predictive scoring system enabled the prioritisation of articles with higher relevance scores for subsequent manual review, thereby streamlining the workflow and focusing reviewer attention on the most pertinent literature. The model continuously refines its accuracy as additional decisions are entered, effectively adapting to the reviewers’ selection criteria.
In the context of this study, the AI-assisted ranking system was used not as a sole decision-making tool but rather as a supportive mechanism to accelerate the screening process while maintaining methodological rigour. This hybrid approach resulted in a substantial reduction in screening time, consistent with findings from previous studies reporting time savings of approximately 40% when using Rayyan compared to manual methods. Furthermore, the platform’s collaborative functionalities allowed multiple reviewers to work concurrently while maintaining transparent decision tracking and consistent application of inclusion criteria.
Based on the aim of this study, 39,958 records were eliminated as irrelevant. This large number of exclusions was due to the broad initial search scope, which captured many general water quality studies outside the specific focus of this review. Full-text screening was performed on 72 retained articles. For 12 of these reports, the full text was not available for screening, but 4 works were still considered in the analysis, as they were considered relevant from the abstract. In addition, 34 other articles were excluded because (i) they presented an incorrect study design (e.g., groundwater, surface water, aquatic field) or (ii) a wrong publication type (e.g., review). Finally, 25 articles were included in the study, corresponding to original studies whose main results are presented in
Table 2 [
33,
34,
35,
36,
37,
38,
39,
40,
41,
42,
43,
44,
45,
46,
47,
48,
49,
50,
51,
52,
53,
54,
55,
56,
57,
58].
3. Results
The 25 retrieved records were divided according to their contents into studies related to colorimetry (
n = 14), lab-on-a-chip technology (
n = 9), and Raman spectrometry (
n = 3). A flowchart of the systematic literature review is shown in
Figure 1.
3.1. Colorimetry for Water Monitoring
Colorimetric methods exploit the chemical reactions or optical properties of nanomaterials, which produce visible colour changes proportional to the concentration of an analyte. Several studies have demonstrated the effectiveness of low-cost colorimetric sensors in monitoring contaminants in water. For example, Ibarlucea et al. (2013) [
33] introduced a polydimethylsiloxane (PDMS)-based chip for heavy metal detection. The device exploits the microfluidic properties of PDMS to facilitate colorimetric reactions, thereby allowing the detection of low concentrations of contaminants. However, the authors highlighted problems with reagent stability over time, suggesting the need for further improvement for long-term applications. Khanfar et al. (2017) [
58] presented a low-cost colorimetric method for the detection of nitrate in water. This system uses readily available reagents and a simple detection platform, making it accessible for applications in resource-limited settings. However, this study highlighted cross-reactivity issues with other compounds present in water, indicating the need for improved selectivity to ensure accurate results. Doğan et al. (2022) [
47] extended similar approaches to nitrite detection by designing pocket-sized colorimetric systems capable of measuring NO
2− in water with a high sampling frequency, suitable, for example, for continuous monitoring in treatment processes. These devices show sufficient sensitivity to detect nitrite increments in the order of tens of μg/L, with negligible chemical interferences due to the high specificity of the Griess reaction towards NO
2−.
In a study by Bonyár et al. (2017), a portable semi-automated device based on a commercial colorimetric kit for arsenic (integrated with a customised microflow) showed a linear response for total arsenic (As(III)+As(V)) in the range of 5–20 ppb (≈5–20 µg/L), with a sensitivity of ~1 ppb (≈1 µg/L) [
55]. This allows for easy distinction of drinking water based on the WHO recommended limit of 10 ppb (≈10 µg/L). The precision of the sensor was good (relative standard deviation ~8% in the linear range), further improving at higher concentrations. The analysis time, determined by colour development kinetics, was on the order of 60 min at room temperature. However, by increasing the sample temperature to 50 °C, the time was reduced to ~25 min, but with a slight worsening of precision (RSD ≈ 16% in the linear range). This sensor, designed for field use by non-specialised personnel, highlights how simplicity and portability are strengths of traditional colorimetric methods [
55].
An important trend is the use of image processing algorithms to improve sensitivity: Sajed et al. (2019) [
54] employed a machine learning model on RGB images produced by a backlit LCD display and acquired via camera to quantify trace amounts of mercury, achieving a detection limit of 0.2 ppb. The use of plasmonic nanoparticles further increases colorimetric sensitivity; for example, gold nanoparticle solutions with Hg
2+-specific aptamers change colour in the presence of mercury (from red to purple upon aggregation), allowing visual or smartphone measurements at sub-ppb concentrations. Similar approaches have been extended to lead; Nguyen et al. (2020) [
53] presented a multiplex nano-colorimetry where coloured sediments specific for Pb
2+ (yellow) and Hg
2+ (red) precipitated on a support and then detected via dark-field imaging. This technique achieved limits of 15 ppb for lead and 2 ppb for mercury, meeting the EPA standards.
Another line of research on colorimetric sensors involves the use of nanomaterials to improve their sensitivity and versatility. Fan et al. (2022) [
46] developed a colorimetric paper assay for silver ions based on black phosphorus quantum dots (BPQDs) with dual optical output: fluorescence and colour. In the absence of Ag+, the BPQD solution appears colourless (under visible light) and emits blue fluorescence; when Ag+ is present, it interacts with the BPQDs, forming P–Ag bonds that quench the fluorescence and simultaneously produce a colour shift towards brown. This dual detection mode (fluorescence quenching and colour appearance) renders the sensor highly sensitive and easy to read visually. The system was transferred onto BPQD-impregnated filter paper strips to realise a portable sensor, and the presence of Ag+ in water produced a colour change visible to the naked eye from transparent to yellow-brown, allowing for easy field screening. The paper sensor demonstrated excellent accuracy for the analysis of real samples. In tests on drinking water spiked with known concentrations of Ag+, the obtained recovery ranged from ~97 to 101%, with relative standard deviations lower than 2.5%. These results are in good agreement with those obtained by reference atomic absorption spectroscopy (AAS), highlighting the reliability of the method. This approach demonstrates how the integration of novel nanomaterials can increase the sensitivity of colorimetric sensors while maintaining simplicity and portability.
Recently, Kaviya et al. (2025) [
42] synthesised a highly selective fluorescent colorimetric receptor (rhodamine derivative) for Cu
2+, integrated on a paper strip with smartphone reading; the colour change from colourless to pink allows semi-quantitative detection by the naked eye, with an LOD of approximately 0.70 ppb (≈11 nM) in ratiometric colorimetric analysis and up to 6.80 ppb (≈107 nM) by direct analysis via smartphone, which is significantly lower than the safety limit of 127.1 ppb (≈2 μM) for Cu
2+. This highlights how the use of appropriate chemical reagents or chromogenic nanomaterials allows high specificity and sensitivity. The designed probes react selectively with the analyte (e.g., mercuric ions, copper, and arsenic), producing an intense colour change proportional to the concentration.
Recent studies have explored digital colorimetry techniques to correlate the apparent colour of water with the presence of pollutants or optically active natural compounds. Zeng et al. (2021) [
49] designed a low-cost digital setup (camera-based) to measure water colour indices and relate them to chemical parameters. Using humic acids and algal pigments as models of natural chromophores (CDOM and chlorophyll), they found that as the concentration of these substances increased, the chromaticity index xy increased monotonically, whereas the measured hue value (Hue) decreased. In other words, variations in water colour (also visually perceptible) were successfully quantified and correlated with the dissolved organic matter content and phytoplankton biomass. This suggests that simple colorimetric sensors that are appropriately calibrated can provide indirect information on the trophic state or the presence of optical contaminants, paving the way for the involvement of citizens and non-specialised operators in environmental monitoring.
Goyal et al. (2024) [
44] described a fully automated, low-cost, real-time, free chlorine monitoring system based on DPD (N,N-diethyl-p-phenylenediamine) reagents and an optical LED-LDR sensor. Their device integrates automatic reagents and sample dispensers and employs multiple regression algorithms (including machine learning) to correlate the sensor response (triplets of RGB values or absorbance) with chlorine concentration. The achieved precision is high (RMSE ~400 ppb (≈0.4 mg/L), over the range 0–10,000 ppb (0–10 mg/L) of Cl
2, with R
2 ~0.98), and the sensitivity is highest in the range 0–4 mg/L, which is crucial for assessing the potability of treated water. The system by Goyal et al. (2024) [
44] operates entirely autonomously with analysis times of <1 min per sample, making it suitable for network deployment for continuous surveillance of disinfectants in aqueducts. In terms of specificity, the use of a selective reagent such as DPD ensures that the colorimetric signal is due almost exclusively to free chlorine (interference from other oxidising substances is possible but mitigated in drinking water). The stability of the instrument is guaranteed by automatic calibration via algorithms and the absence of disposable parts (unlike classic reagent strips). The possibility of extending the same hardware to other analytes (e.g., ammonium and phosphates) simply by changing the reagent highlights the versatility of this approach.
A further advantage of colorimetric methods is their portability and ease of use, which makes them suitable for field applications, even for non-specialised personnel. Many studies have focused on the integration of smartphones and IoT devices to facilitate in situ use. For example, da Silva et al. (2020) [
51] developed a paper-based microfluidic device (μPAD) integrated with a smartphone to calculate an overall water quality index and colorimetrically measured multiple parameters (hardness via Ca
2+/Mg
2+ reagents, total phenols with specific colour reaction, and pH with indicator) and combined the results in a water quality index, demonstrating the possibility of performing multi-analyte analyses in the field with a single portable kit.
Similarly, Hong et al. (2022) [
40] presented an innovative IoT application of colorimetry; instead of detecting a single chemical pollutant, their system monitors the clogging status of filters in condominium water tanks through direct observation of the filter colour (which turns yellow/red due to the accumulation of iron and manganese oxides). Using RGB colour and brightness sensors connected to Arduino, Hong et al. (2022) [
40] obtained real-time indicators of the deterioration of quality (“red” water) due to rust, even managing to distinguish different types of deposits (Fe(OH)
3 vs. Fe
2O
3 vs. MnO
2) based on the detected hue. Specificity, in this case, concerns the ability to visually discriminate PM types of particulate matter. The system demonstrated high accuracy in recognising the ingress of turbid water and correlating the colour change with the increase in turbidity and pressure drop in the filter. Using a four-level alert algorithm, pilot installations provided reliable notifications of filter replacement intervals, confirming the robustness and stability of operation in a real environment for at least 30 continuous days. This unconventional example extends the concept of colorimetry to indirect (particulate) contamination monitoring and demonstrates effective integration with data transmission systems for remote management.
3.2. Lab-on-a-Chip Technology and Microfluidics Devices
Microfluidic lab-on-a-chip (LOC) devices aim to concentrate on a few square centimetres of all the steps of chemical analysis traditionally carried out in the laboratory for real-time pollutant analysis [
50,
57], for example, sample management (sampling, dilution, pre-concentration), reagent addition, reaction, and signal detection. In the context of water quality monitoring, these technologies enable automatic and in situ analysis with high sensitivity, owing to the precise fluid control of microchannels and the possibility of incorporating miniaturised sensors. A significant example is the modular system presented by Giménez-Gómez et al. (2019) for the determination of As in surface waters [
37]. This device integrates a miniaturised electrochemical sensor (a AuNP-modified gold electrode) within an automated microfluidic platform. By means of a programmed sequence of microfluidic operations, the device autonomously performs sensor calibration, sample collection, electrochemical deposition of As(III) on the electrode (pre-concentration via anodic stripping), and finally voltammetric scanning for measurement. The results show a linear response to As(III) from 1 ppb (≈1 µg/L) up to ~150 ppb (≈150 µg/L) with a limit of detection of 0.42 ppb (0.42 µg/L) (3σ), well below the WHO threshold of 10 ppb (≈10 µg/L) for drinking water. The sensor also maintained very good reproducibility: the standard deviation between different chips was <3%, indicating a reliable manufacturing process. Compared to other electrochemical arsenic sensors reported in the literature, the integrated microfluidic approach offers equal or superior performance in both the sensitivity and linear range, with the added benefit of automation. The system was validated on real samples; tap water and groundwater (
Argentine aquifers) artificially contaminated with As(III) were successfully analysed and showed excellent concordance with the expected values. This demonstrates the potential of the lab-on-chip to provide accurate measurements directly in the field, reducing the need for centralised laboratories.
Highly sensitive LOCs have also been developed for the monitoring of organic and biological contaminants. Zhao et al. (2012) [
34] proposed one of the first microfluidic devices for acute toxicity based on bioluminescent bacterial cells (
Vibrio fischeri) trapped on a chip. In this system, the reduction in the light emitted by the bacteria acts as an early warning signal for the presence of generic toxicants in water (heavy metals, phenols, etc.). Although not specific to a single pollutant, the device by Zhao et al. (2012) [
34] operates continuously and in real time and integrates micromixers and a droplet generator that ensures oxygenation of the cells and constant exposure to the water flow. Tests have shown that high concentrations of Cu
2+, Zn
2+, dichromate, or 3,5-dichlorophenol produce rapid decreases in the bioluminescent signal, highlighting the toxicity of the sample [
34]. Sensitivity, in terms of EC50, depends on the bacterial strain and toxicant, but the approach allows non-specific detection of harmful contamination even when the exact composition is unknown—a clear advantage as an early warning system. However, the portability of such a system requires attention to the viability of the bacterial biosensor, considering its potential risks to public health. For practical use, the unit would need to include a stable culture or replaceable cartridge of microorganisms, which represents technical complexity. Furthermore, long-term signal stability may be affected by biological factors (bacterial adaptation or loss of luminescence). Zhao and Dong (2013) [
35] analysed the performance of the device for personal health monitoring, indicating the need for frequent calibrations of the luminescence background and the use of genetically modified strains for greater resilience [
35]. Despite these limitations, this pioneering study demonstrated the feasibility of autonomous LOCs for continuous monitoring, paving the way for subsequent systems with reporter organisms or on-chip enzymatic assays.
In the field of specific microbiological detection, recent lab-on-a-chip technologies have achieved important milestones in terms of speed and specificity. Gagliardi et al. (2023) [
39] developed a surface acoustic wave (SAW)-based LOC sensor for the rapid detection of Legionella pneumophila in water. The device uses an ultra-high-frequency piezoelectric crystal functionalised with anti-Legionella antibodies: when the target bacteria bind to the surface, they alter the propagation of the acoustic wave, causing a measurable phase/frequency shift. This immuno-sensor approach showed high specificity, distinguishing Legionella from other bacterial species, and an extremely short response time (on the order of minutes) compared to the days required by a traditional culture. The declared sensitivity was sufficient to detect dangerous concentrations of Legionella (on the order of 10
2–10
3 CFU/L), allowing timely interventions to prevent outbreaks of legionellosis. From the point of view of portability, an SAW sensor requires a small electronic module for excitation and readout but can be miniaturised, and the authors have conceived the system as a compact and robust device, potentially installable directly at critical points (e.g., water circuits of buildings) for online monitoring. A typical challenge of these sensors is their long-term stability and matrix interference: the presence of suspended solids or biofilms can alter the acoustic signal or occlude the sensitive surface. Gagliardi et al. (2023) [
39] address the issue with antifouling surfaces and possibly foreseeing pre-filtration modules; preliminary results indicate that the sensor maintains functionality in the short term in real water, but longer studies will be necessary to validate them in the field. Nonetheless, this acoustic wave LOC represents a significant step forward towards field-based sensing of aquatic pathogens, combining the precision of an immunoassay with the speed and compactness of a physical device.
Another trend in water LOCs is the direct integration of molecular (gene) analysis methods on a chip. Thio et al. (2022) [
57] introduced the lab-on-smartphone concept, combining digital microfluidics with optoelectrowetting and isothermal amplification (LAMP) to detect faecal contamination (for example
E. coli) in a portable manner. In this platform, the smartphone acts as both the controller (user interface and light power source) and the optical detector, while the microdroplets containing the sample are moved on the chip through light-controlled electrodes. The device automatically performs bacterial DNA amplification and colorimetric/fluorescent detection of the product, all in less than an hour. Sensitivity and specificity are excellent: thanks to the LAMP primers, the system specifically recognises pathogenic
E. coli sequences, with a limit of a few genomes per reaction (corresponding to a few colony-forming units in 100 mL of water), competing with laboratory PCR methods. Portability and autonomy are total; it is a device designed to operate in a field powered by a smartphone, and tests show resilience to non-ideal environmental conditions, a sign of good operational stability [
57]. The trade-off is a certain construction complexity (integrating microfluidic, optical, and biological components), but this example illustrates how advanced LOCs can provide laboratory-level analytical capabilities (e.g., molecular diagnostics) directly in the field, drastically reducing the response times.
Many LOCs with environmental objectives also incorporate multichannel or multi-analyte capabilities. For example, Kremers et al. (2020) [
38] presented PortaDrop, a portable microfluidic digital platform on Raspberry Pi that allows the performance of various types of chemical and electrochemical tests on electronically manipulated droplets. This platform, although in the prototype phase, is designed to be versatile; the authors showed the possibility of combining sample preparation steps (mixing and dilution) with integrated electrochemical sensors, for example, for heavy metal detection via voltammetry or reconfigurable potentiometric sensors. Although not focused on a single contaminant, PortaDrop represents a modular approach in which a single device can be programmed for different water quality analyses (e.g., lead, copper, and cadmium control sequentially) by simply varying the sequence of microfluidic actions and the type of sensor inserted. In terms of performance, the individual methods implemented on PortaDrop show detection limits comparable to those obtained on fixed platforms (e.g., for Pb
2+, on the order of a few ppb with voltammetric stripping sensors), demonstrating that miniaturisation does not penalise sensitivity. Portability is inherent in the compact design (approximately 75 mm × 30 mm × 10 mm for the chip, controlled by a single-board computer), and stability comes from the absence of mechanical parts (fluid movement occurs by electroadhesion without external pumps). However, a limitation to consider is the interference of complex matrices with digital microfluidics: water with high conductivity or containing particulates may alter the effectiveness of optoelectronics in manipulating drops. This may require pretreatments (e.g., filtration and dilution) before on-chip analysis, partly reducing operational simplicity. Nevertheless, the approach of Kremers et al. (2020) [
38] highlights the growing maturity of LOCs in managing multiple environmental analyses flexibly.
Another area of application of LOC devices is the monitoring of nutrients and other standard chemical parameters. Colorimetric lab-on-chips were developed for the in situ measurement of nitrites using the Griess assay (which forms a red azo complex in the presence of nitrite). In a recent study, a microfluidic chip coupled with a miniaturised optical system was used to quantify NO
2− in water in the range of 100–15,000 ppb (0.1–15 mg/L) [
48]. The device integrates colour microcameras or photodiodes with filters, allowing absorbance and colour variation within a reaction microcell to be read. Calibration showed an excellent correlation between signal and concentration, with the red and green channels of detection providing overlapping and strongly non-linear (Michaelis–Menten-type) responses saturating over ~10,000 ppb (10 mg/L). The sensitivity of the system, expressed as the minimum distinguishable concentration (MDC), is approximately 100 ppb (0.1 mg/L) nitrite using the red/green channels. This LOD value is comparable to that obtainable with benchtop spectrophotometric methods for Griess and is suitable for the control of nitrites in drinking water (the EU regulatory limit is 500 ppb (0.5 mg/L) as NO
2−). In addition, because of miniaturisation, reagent consumption is drastically reduced, and measurements can be repeated quickly on small sample volumes (a few microlitres), opening the possibility of near-real-time monitoring.
3.3. Raman Spectrometry for Contaminant Detection
Raman spectroscopy and particularly its amplified variant SERS (Surface-Enhanced Raman Scattering) are gaining interest in the monitoring of aquatic contaminants due to their extremely high sensitivity and molecular specificity. These methods are based on the analysis of the spectral fingerprints of molecules: the Raman signal—the inelastic scattering of laser light due to molecular vibrations—provides a unique “fingerprint” of each chemical species. In the SERS version, the intensity of the Raman signal is greatly amplified (even 106–108 times) by placing the molecules in proximity to nanostructured metal surfaces (typically silver or gold) that generate plasmonic “hot spots”. This allows the detection of ultra-trace concentrations down to the level of a single molecule in ideal cases, making SERS a powerful tool for the detection of pollutants at low concentrations.
A notable example of the application of SERS in water monitoring concerns the detection of metal ions using nanoplasmonic aggregation assays (such as colorimetric assays but read via Raman spectroscopy). Guo et al. (2020) [
52] developed a dual colorimetric + SERS system for Cu (Cu
2+) detection based on Ag-Au core-satellite nanostructures. Two types of functionalised nanoparticles (AgNP coated with mercaptobenzoic acid and AuNP coated with mercaptopyridine) are mixed in the sample: in the presence of Cu
2+, these form an Ag–Cu–Au “satellite” aggregate mediated by the specific binding of Cu
2+ with the functional groups on the NPs. The aggregation induces both a visible colour change (from brown to purple) and the appearance of intense Raman bands characteristic of ligands joined to the Ag-Au clusters. Spectroscopic measurement provides impressive results: the simple colorimetric method (UV-Vis absorbance) detects Cu
2+ linearly between 6.36 and 12,710 ppb (≈0.1 to 200 μM) with an LOD of 2.03 ppb (≈0.032 μM), while the SERS method extends linearity from 0.06 to 6355 ppb (≈1 to 100,000 nM) with an LOD of 0.04 ppb (≈0.6 nM). The latter value is approximately seven orders of magnitude below the 1270 ppb (≈1.27 mg/L) limit set by the U.S. EPA for Cu in drinking water.
Owing to Raman amplification, the system can detect quantities of Cu2+ million times smaller than the level considered dangerous. In addition to extreme sensitivity, the method maintained excellent accuracy on real matrices, and the authors applied the dual sensor to different samples of natural water (and soil), which is in excellent agreement with those obtained with standard instrumental analyses (for example, ICP-MS), confirming the validity of the method even in the presence of possible matrix interferences. In addition, the potential multi-analytical nature of the platform is highlighted, and by appropriately modulating the ligands on the nanoparticles, it is theoretically possible to develop multiplex SERS sensors capable of simultaneously detecting multiple contaminants via their respective spectral signatures.
Classical Raman spectroscopy, although with lower sensitivity than SERS, still offers selectivity advantages and does not require reagents. For example, as early as the 1990s, it was proposed for the direct determination of nutrients, such as nitrates and nitrites. Furuya et al. (1980) [
56] applied resonant Raman to measure NO
3− and NO
2− in water, obtaining signals strong enough (due to the resonant enhancement of a coloured complex formed with nitrite) to allow monitoring in wastewater. In that study, it was demonstrated that the sensitivity achieved was adequate for optimal control of water treatment processes and that the technique exhibited excellent intrinsic selectivity due to high spectral resolution. The authors succeeded in simultaneously discriminating and quantifying nitrite and nitrate in the same sample by analysing two overlapping Raman bands, underlining the unique ability of vibrational spectroscopy to resolve multiple species in complex mixtures. In their conclusions, they suggested that Raman spectroscopy could become “one of the most powerful techniques” for the analysis of water pollutants, having solved many of the methodological challenges for application to real samples. Although SERS has attracted much attention, these pioneering results show the potential of conventional Raman spectroscopy for routine applications (especially today, with the existence of compact portable Raman spectrometers).
A key advantage of Raman spectrometry is its high spectral specificity: each molecule has a Raman fingerprint; therefore, in theory, it is possible to simultaneously detect multiple substances in a sample by analysing different bands. For example, Franca et al. (2021) employed inline Raman spectroscopy to monitor a biological nutrient removal process, managing to follow the trend of compounds such as nitrates and sulphates directly through their characteristic Raman peaks in solution [
41]. In this study, an immersed optical probe provided continuous measurements of the phototrophic reactor status without sampling, demonstrating the stability and speed of the real-time Raman-based control. The sensitivity obtained was sufficient to detect concentration variations on the order of a few mg/L of nitrate, thanks to the strong Raman band ν(NO
3−) around 1045 cm
−1 and background subtraction techniques to eliminate the contribution of water. This allows the biological process to be promptly regulated, highlighting how Raman can act as an effective online sensor. An important aspect is that the Raman response is immediate, and there is no drift due to the depletion or contamination of the reactants. Long-term stability depends solely on instrument calibration (minimal laser drift possibly corrected with internal standards). In addition, the absence of chemical contact avoids fouling problems; laser light passes through a window or optical fibre, which can be easily cleaned, reducing maintenance compared to immersed electrochemical sensors.
For contaminants present at much lower concentrations (ppb or less), simple traditional Raman spectroscopy is often insufficient; however, the use of SERS substrates allows the signal to be increased by orders of magnitude. Guo et al. (2020) [
52] used SERS combined with machine learning algorithms for the quantitative analysis of polycyclic aromatic hydrocarbons (PAHs) in water. In this study, traces of PAHs (benzo[a]pyrene, naphthalene, etc., considered emerging contaminants) were enriched on nanostructured silver surfaces: the interaction with plasmonic plasma “hot spots” amplified the weak Raman bands of these pollutants to the point of making them measurable even at concentrations of a few ng/L. Using advanced regression models (random forest) trained on spectra, Guo et al. (2020) [
52] decomposed the contribution of different species present together and quantified them with good accuracy. The specificity remained very high, as each compound generated a distinct Raman pattern. The use of machine learning has made it possible to manage any spectral interference (e.g., overlapping peaks of multiple PAHs) and intensity variations due to uncertainties in the SERS substrate, thereby improving reliability. In terms of sensitivity, this approach achieved lower ppb limits for various PAHs, a remarkable achievement without resorting to separation techniques. Despite these significant advantages, the practical application of SERS-based sensors in environmental monitoring still faces important challenges, particularly concerning the reproducibility and long-term stability of the enhancing substrates. Addressing these limitations is crucial to fully unlocking the potential of SERS as a reliable, field-deployable technology for water quality assessment. The following section discusses in greater depth the current issues surrounding substrate reproducibility and the strategies being pursued to overcome them. A critical limitation hindering the widespread application of SERS (Surface-Enhanced Raman Scattering) in environmental monitoring is the reproducibility of the substrates used for signal enhancement. SERS relies on the presence of localised plasmonic “hot spots”—regions of highly concentrated electromagnetic fields—formed at nanoscale gaps between metallic nanostructures, typically made of silver or gold. The intensity of the Raman signal enhancement is extremely sensitive to the size, shape, interparticle spacing, and surface uniformity of these nanostructures. Small variations in nanoparticle morphology, aggregation state, or surface distribution between different batches of substrates—or even across different areas of the same substrate—can result in significant signal variability, thereby compromising quantitative reliability.
Further challenges arise from external factors: contamination with organic materials, changes in humidity, oxidation of metallic surfaces, and temperature fluctuations can all degrade the SERS substrate’s performance over time. While various fabrication techniques have been explored to improve reproducibility, such as electron beam lithography, nanosphere lithography, template-assisted nanoparticle assembly, and self-assembled monolayer deposition, each method presents trade-offs between scalability, cost, and uniformity. Highly ordered lithographic substrates offer excellent reproducibility but are expensive and limited in production scale, while chemical methods produce cheaper substrates but often exhibit greater heterogeneity.
In the context of water quality monitoring, where field deployment demands robust and reliable sensors, the challenge of SERS substrate reproducibility becomes particularly critical. Ensuring batch-to-batch uniformity and stability under varying environmental conditions is essential for developing practical SERS-based analytical devices. Recent research efforts have focused on engineering stable, reproducible SERS platforms by using protective coatings (e.g., silica shells) to enhance substrate longevity and by integrating SERS substrates within microfluidic devices to control analyte–substrate interactions more precisely. Nonetheless, achieving reproducibility levels comparable to conventional analytical techniques remains a key frontier for advancing SERS from laboratory demonstrations to routine field applications.
It should be noted that the reproducibility of SERS substrates is a challenge; small nanostructural differences can lead to different enhancement factors. Guo et al. (2020) [
52] mitigated this effect by including calibration data in the algorithm and using a large number of mediated spectra, but stable and possibly low-cost disposable SERS substrates are needed for field applications.
Raman spectroscopy in general shows excellent resistance to matrix chemical interference: unlike optical absorbance/emission methods, where turbidity or colour of the sample can mask the signal, in Raman, the main interferences are the fluorescence of the matrix or other components (which superimposes a background on the Raman signal) and the self-absorption of the laser in highly coloured samples. Often, by choosing the wavelength of the excitatory laser, fluorescence is minimised (e.g., near-infrared laser for organic samples), and natural waters with the presence of moderate humic organic matter can also be analysed. Coupling with extraction methods can help in the treatment of very complex waters. For example, the extraction of target species on a SERS substrate not only concentrates the analyte but also leaves most of the interfering substances in the solution. In other cases, a filter can be used that retains particulate matter and fluoresces when the analyte passes, and Raman or SERS can be detected downstream [
41,
52]. Therefore, from the point of view of chemical interference, Raman spectroscopy is robust, especially in configurations optimised for environmental samples.
While lab-on-a-chip technologies offer promising advancements in pollutant monitoring, Raman spectrometry further extends the capabilities of researchers, especially in identifying and quantifying specific contaminants.
4. Discussion
Colorimetric sensors have the advantages of being simple, cost-effective, and easily deployed in portable kits or citizen-science platforms. Many contaminants (heavy metals, nutrients, etc.) can be detected using specific chromogenic reactions (for example, Griess reagent for nitrites or colorimetric reagents for arsenic and other metals) with sufficient sensitivity to the legal limits. Current performance varies depending on the analyte and the type of optical transduction used. In general, the detection limits of pure colorimetric methods are on the order of a few ppb and are, therefore, adequate for drinking water standards for many pollutants (for example, As, Hg, and NO2−) but lower than those of advanced spectroscopic techniques (such as SERS).
Lab-on-a-chip and microfluidic devices offer laboratory-like analytical performance (LODs in the sub-ppb range for heavy metals, high accuracy, and repeatability), with portability and automation. Compared with simple colorimetric sensors, they typically exhibit higher sensitivities (owing to preconcentration strategies or more refined electrochemical/optical detection) and the ability to handle more complex analyses (multi-step or multi-analyte). In addition, by reducing the scale and volume, they speed up the reaction times and minimise the reagents required, making near-continuous monitoring possible. The trade-off is increased complexity: these systems require additional components (micropumps, valves, and control circuits) and a sophisticated manufacturing step. Problems of clogging microchannels or fouling of sensor surfaces can arise when analysing turbid or multiparticle natural waters. The use of appropriate materials and modular designs can mitigate these effects. LOC platforms represent an advanced compromise: they are more robust and perform better than simple colorimetric kits, but slightly less immediate to use, although the ultimate goal is to make them plug-and-play devices for field workers. The current evolution shows a trend towards increasingly integrated and user-friendly systems, for example, those combined with portable electronics or smartphones for data management and transmission.
Raman and SERS-based spectroscopic methods offer an unrivalled level of sensitivity and specificity. In the case of SERS, the sensitivity often far exceeds regulatory requirements, allowing detection of infinitesimal contaminant traces. They also provide direct molecular recognition: unlike colorimetric or electrochemical sensors that measure a proxy signal, Raman spectroscopy identifies compounds by their spectral signatures, reducing the risk of false positives. Moreover, by analysing different bands in a spectrum, multiple substances can potentially be detected simultaneously in scenarios of complex contamination. However, Raman techniques require specialised instrumentation (lasers, spectrometers), which, although available in portable formats, remain expensive and demand careful use (optical alignment, calibration). In particular, SERS sensors require specially prepared nanostructured substrates, and the reproducibility of these substrates and the stability of the signal over time are still open challenges. For example, in the Cu2+ SERS sensor discussed earlier, the standard deviation between spectra collected at different points on a substrate was ~14–17%, indicating fairly good but still improvable consistency.
In addition, real environmental matrices may contain substances that generate background fluorescence or compete for sites on the substrate, degrading the performance. Often, minimal pretreatment (filtration and acidification) is required to obtain the best SERS results. Despite these limitations, progress is continuous; new, more uniform, and reusable nanoplasmonic substrates, perhaps coupled with microfluidic systems, are increasing reliability and facilitating use in the field. The combination of portable instruments (e.g., handheld Raman spectrometers) with ready-to-use SERS cartridges could provide rapid analysis kits for priority contaminants (toxic metals, pesticides, and organic compounds) directly at the sampling site. In conclusion, Raman/SERS spectroscopic techniques represent a pinnacle in terms of analytical performance, and their practical use in routine water monitoring is still being consolidated, but experimental evidence clearly indicates that they offer unique detection and identification capabilities, complementary to the colorimetric approaches and portable sensors described so far.
The literature indicates that there is now a large arsenal of water quality sensors that can cover needs ranging from the cost-effective monitoring of conventional parameters (e.g., portable colorimetric kits) to the search for traces of emerging contaminants with sophisticated instruments (e.g., bioanalytical SERS or LOC systems). This critical comparative analysis highlights that no technology is intrinsically superior in absolute terms, but each has an optimal performance profile for certain applications, balancing sensitivity, specificity, robustness, and operational feasibility in the field. Synergistic combinations and further miniaturisation/automation will be the key to filling the remaining gaps and ensuring the increasingly widespread and reliable monitoring of water resources.
To better compare the three main sensing technologies evaluated (colorimetric methods, lab-on-a-chip systems, and Raman/SERS spectroscopy),
Table 3 and
Figure 2 summarise their key characteristics in terms of sensitivity, cost, portability, and limitations.
From a practical standpoint, implementing these monitoring technologies into existing water management systems requires consideration of factors beyond technical performance: cost, regional adaptability, and user training are paramount. Simpler colorimetric kits have a clear advantage in low-cost deployment and can be introduced even in resource-limited regions or community citizen-science programs with minimal training. Lab-on-a-chip devices, while offering superior analytical performance, often involve higher initial investment and may require operators with some technical background; however, their automation and potential for remote operation can reduce long-term labour costs and human error. Advanced Raman systems entail significant capital expenditure and specialised expertise, which currently limits their routine use to centralised labs or pilot installations—although ongoing miniaturisation and cost reduction efforts could make portable spectrometers more accessible in the future. Ensuring adaptability to regional conditions means that these sensors must be validated across different water matrices (varying in hardness, organic content, etc.) and under varying environmental conditions (temperature, humidity). Maintenance and calibration protocols must also be established (for example, periodic replacement of reagents or SERS substrates, or recalibration of optical sensors) to sustain performance over time. Additionally, comprehensive training programs for end-users and water utility personnel are essential so that data from these novel sensors can be correctly interpreted and acted upon. Economically, a phased integration strategy may be prudent: for instance, utilities might start by augmenting existing monitoring with low-cost colorimetric or electrochemical sensors at many sites and then deploy the more expensive LOC or Raman units at critical control points or as confirmatory tools. Such a multi-tier monitoring network—supported by IoT connectivity for real-time data aggregation—could leverage the strengths of each approach: inexpensive broad coverage from basic sensors, with high-precision confirmation and multi-analyte detection from advanced devices where needed. Ultimately, demonstrating a clear cost–benefit advantage (e.g., preventing costly contamination incidents through early detection) will drive broader adoption of these technologies. With appropriate user training and stakeholder buy-in, these sensing technologies can be integrated into smart water management frameworks, greatly enhancing our capacity to safeguard water quality through continuous, real-time surveillance across diverse regions.
5. Conclusions
The advancement of IoT-enabled sensors has opened new frontiers in water quality monitoring. In this scoping review, three emerging technological approaches—colorimetric sensors, lab-on-a-chip microfluidic devices, and Raman/SERS spectroscopic methods—were examined and compared. Colorimetric methods stand out for their simplicity and low cost, delivering sufficiently low detection limits (often in the ppb range) for many regulated contaminants and allowing deployment in field kits or distributed sensor networks. Lab-on-a-chip devices provide a bridge between field portability and laboratory-level performance, achieving sub-ppb sensitivity and automation in detecting contaminants, though they introduce complexity and higher initial costs. Raman-based techniques, particularly with SERS enhancement, offer ultra-trace detection capabilities and exceptional molecular specificity, highlighting them as powerful tools for identifying contaminants at concentrations far below conventional method thresholds. Each technology comes with trade-offs: for instance, colorimetry may suffer from interference and limited specificity, LOC devices require intricate design and maintenance, and Raman instruments demand technical expertise and still face reproducibility challenges for SERS substrates. However, rather than a one-size-fits-all solution, these approaches are best seen as complementary. A modern water quality monitoring strategy can integrate all three: inexpensive colorimetric or electrochemical sensors for widespread coverage and real-time alerts, LOC systems for targeted monitoring of critical points or specific emerging contaminants, and Raman/SERS units for comprehensive analysis and confirmation of trace pollutants.
Importantly, the successful deployment of these technologies will depend on practical considerations such as cost-effectiveness, ease of use, and adaptability. Ongoing improvements in sensor design—like robust, uniform SERS substrates or more user-friendly plug-and-play LOC kits—are expected to enhance reliability and user adoption. Future development trends likely include further miniaturisation of optical sensors, increased use of machine learning for signal processing and interference compensation, and greater integration with wireless data networks and cloud-based analysis platforms. These trends align with the concept of “smart” water networks, where real-time data from an array of sensors can be analysed holistically to provide early warnings of contamination events and optimise treatment processes. Additionally, a broader scope of monitoring may evolve; while this review focused on trace chemical contaminants (including selected heavy metals and CECs), future systems might incorporate biological sensors for pathogens or sensors for aggregate parameters (like COD or toxicity) to provide a more complete picture of water quality.
Ultimately, ensuring water safety in the coming decades will rely on a combination of advanced treatment solutions and the vigilant monitoring provided by technologies such as those reviewed here. Recent environmental assessments continue to highlight the prevalence of legacy pollutants and emerging contaminants in various water bodies, as well as novel remediation efforts such as encapsulating pollutants in waste matrices. These findings underscore that effective pollution management must pair remediation with robust monitoring. By leveraging the complementarity of colorimetry, lab-on-a-chip, and Raman/SERS techniques, water authorities and researchers can create a layered defence for water quality—one that catches everyday fluctuations and extreme events alike. This integrated approach, supported by IoT connectivity and data analytics, promises to significantly improve our ability to protect both public health and the environment through early detection and rapid response to water contamination.


