Abstract
The accurate estimation of Manning’s roughness coefficient (n) is critical for hydraulic modeling in open channels. In fish passes designed as close-to-nature structures, this coefficient has a strong influence on the overall design and operation. This study evaluates n for the Veľké Kozmálovce fish pass using high-resolution drone imagery and image analysis techniques to determine riverbed surface characteristics and extract a grain size distribution curve. Various empirical equations based on Strickler’s formula were applied to specific grain sizes, yielding average n values of 0.036 and 0.037. Cowan’s method, which considers surface material, irregularities, vegetation, obstructions, and meandering, provided an upper-bound estimate of 0.040. However, this method is known to overestimate roughness in some cases. The Step-by-Step method, applied with hydraulic field measurements, resulted in a narrower range of n from 0.027 to 0.037. Overall, estimated values across all methods ranged between 0.023 and 0.040, reflecting the structural complexity of the fish pass, which includes boulders embedded in concrete and coarse gravel infill. These findings highlight the limitations of using generalized tabulated values for artificial channels and demonstrate that drone-based photogrammetry combined with empirical and analytical approaches can effectively capture spatial variability in hydraulic roughness.
1. Introduction
Manning’s roughness coefficient (n) is a basic parameter in hydraulic calculation and modeling, representing the resistance to flow due to the riverbed material used and surface irregularities. As has been described in many studies [1,2,3], the dependence of this coefficient on the vegetation, the period of the year, water stages, longitudinal slope, etc., is obvious. Therefore, its estimation in the preliminary design of riverbed modifications is very complicated and mostly based only on the standard roughness tables [4,5].
Fish passes mitigate the barrier effects of hydraulic structures such as dams and weirs, and preserve aquatic biodiversity [6]. Close-to-nature solutions have become increasingly preferred in modern fish pass design [7,8]. These designs aim to replicate natural riverbed conditions by incorporating roughness elements such as single stones [9], perturbation boulders [10], and sills [11] to create heterogeneous hydraulic conditions that support diverse fish species and life stages. Therefore, by the nature of fish pass designs, it is necessary to accurately determine Manning’s roughness coefficient due to its significant influence on hydraulic calculations and, consequently, fish passage efficiency. Furthermore, small-scale turbulence, secondary currents, and flow resistance associated with submerged structures are specifically important for fish passes, because they introduce further uncertainties in roughness estimation.
Existing empirical formulas that have been developed by many authors [12,13], which are basically derived from the Strickler formula, have their own limits and are based on the grain size distribution curve or characteristic diameter. These approaches could be used only at fish passes where a known substrate has been used, with specific particles. Therefore, a promising approach to refining roughness estimates is the study of existing, well-functioning fish passes [14]. Observing and analyzing the hydraulic performance of operational fish passes provides valuable insights into the relationships between roughness elements, flow regimes, and fish behavior. By collecting data on flow velocities, water depths, and turbulence characteristics, researchers can better calibrate hydraulic models [15] and optimize design parameters for future proposals for fish passes [16]. However, the systematic and precise documentation of topographic and granulometric conditions is necessary and possible only during the time of fish pass maintenance.
Traditional geodetic surveys of fish pass topography using a theodolite or GPS (Global Positioning System) can now be effectively replaced by drone-based aerial surveying. A key prerequisite for this method is that the fish pass must be dewatered, i.e., empty. This modern measurement method, drone-based photogrammetry, enables high-resolution three-dimensional mapping of fish pass surfaces. Photogrammetry involves capturing multiple overlapping images from different angles and processing them into detailed digital elevation models (DEMs) using structure-from-motion algorithms [17]. This technique enables accurate modeling of the topography of the fish pass channel, analyzing the granulometry of the bed material, and mapping hydraulic structures in high resolution.
Compared with conventional surveying methods, photogrammetry is a non-invasive, cost-effective technique that captures complex morphologies with high precision. Studies have demonstrated that drone-based photogrammetry provides reliable roughness estimates, which can be integrated into computational fluid dynamics models [18,19,20,21]. The primary advantages of drone-based surveying include high measurement speed and the level of detail achieved. However, limitations include the need for additional data acquisition in vertical or obstructed areas (e.g., beneath bridges) using ground-based photogrammetry, as well as the challenge of processing the vast dataset of surveyed points for numerical modeling applications.
This study aims to investigate the potential of drone-based photogrammetry for estimating Manning’s roughness coefficient in fish passes. The ability to accurately determine roughness coefficients through photogrammetric surveys presents new opportunities for optimizing fish pass construction. By applying findings from existing structures to newly planned fish passes, designers can improve roughness coefficient estimation, leading to better prediction of hydraulic conditions for fish migration, more efficient energy dissipation within the fish pass, and enhanced adaptability to different fish species and environmental conditions.
The correct estimation of Manning’s roughness coefficient will lead to more realistic flow simulations in hydrodynamic modeling software (e.g., HEC-RAS 6.4) [22], allowing engineers to test multiple design alternatives before construction with more precise results, without the need to rebuild or alter the internal environment of the fish pass after its construction. By combining hydraulic engineering and remote sensing, this research aims to improve fish pass modeling techniques, contributing to more effective and sustainable river connectivity solutions.
2. Materials and Methods
2.1. Fish Pass of Veľké Kozmálovce
The study area is located along the Hron River at river kilometer 73.400 in Slovakia, where the Veľké Kozmálovce Water Structure is situated (N 48°16′7.633″, E 18°31′41.195″) (Figure 1). This section of the river is classified by ichthyologists as a barbel zone, falling within the middle course (Epipotamal Zone) [23]. High summer water temperatures, slow flow, mixed substrates with muddy deposits, and the potential for oxygen depletion characterize the area. These environmental factors support typical species such as pike (Esox Lucius), zander (Sander Lucioperca), perch (Perca Fluviatilis), and eel (Anguilla).
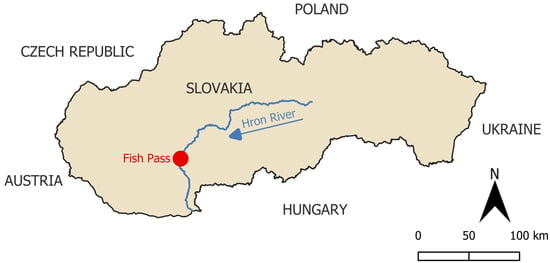
Figure 1.
Location of the fish pass on the Hron River.
The fish pass was designed as a barrier-free open channel (Figure 2), offering a more natural habitat than traditional technical, barrier-type structures. Its bowl-shaped cross-section includes a riverbed made of river stones embedded in concrete and overlaid with gravel, designed to replicate the natural environment of the Hron River’s riverbed. The 5 m wide channel maintains varying depths and velocities at the prescribed controlled discharge of 1.0 to 1.5 m3∙s−1. This design concentrates the main current in deeper areas, while shallow sections provide lower depths and reduced flow velocities [24].
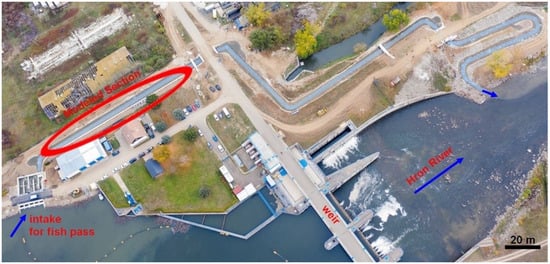
Figure 2.
Fish pass of the Veľké Kozmálovce Water Structure.
A photogrammetric survey of the whole fish pass was conducted using a DJI Mavic 3 drone (manufactured by SZ DJI Technology Co., Ltd., Shenzhen, China), which was flown at an altitude of 6.0 m above the channel. The weather conditions during the survey were calm and ideal, with no wind, ensuring optimal conditions for accurate data collection. The survey was carried out while the fish pass was drained to allow for the capture of the bedrock surface, as photogrammetric scanning cannot penetrate deeper waters. During the survey, a total of 1068 images were taken, including both oblique and vertical aerial views. The images were processed for 19 h, resulting in a highly detailed point cloud consisting of 268 million pixels, with a ground sampling distance (GSD) of 1.6 mm. This level of detail ensured that the fish pass was accurately represented. After processing, attention was directed to a 100 m section of the fish pass in its upper part (Figure 3), just after the inlet structure, for further analysis. This selected segment contained 46,145,932 points, providing an extremely high level of precision.
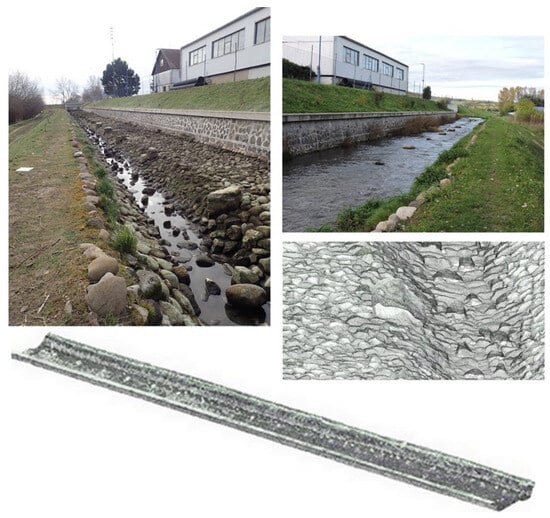
Figure 3.
Fish pass of the Veľké Kozmálovce Water Structure (photos and point cloud of the modeled section).
A one-dimensional numerical model in HEC-RAS 6.4 was developed using terrain data derived from processed point cloud data obtained through photogrammetric scanning, along with in situ measurements conducted by the Water Research Institute (WRI), Bratislava, Slovakia, as the project partner [24]. The roughness coefficient was calibrated to ensure accurate simulation of water levels. The initial roughness coefficient was set to 0.030 [25] based on tabulated values.
Model simulations were performed with the following defined boundary conditions: a measured discharge value of 0.904 m3∙s−1 and a measured water surface elevation of 172.47 m a.s.l. at the end of the modeled fish pass section, provided by the WRI, Bratislava, Slovakia. The simulated water levels were compared to these in situ measurements. Since the initial simulations overestimated water levels, the roughness coefficient was iteratively adjusted and gradually lowered until the best agreement between simulated and observed values was achieved. The final calibrated roughness coefficient was determined to be 0.027. This calibrated roughness coefficient is used as a reference for comparison with roughness values obtained through different methods analyzed in this manuscript.
2.2. Manning’s Roughness Coefficient
The roughness coefficient represents the resistance to flow caused by bed and bank materials, vegetation, and other channel features. Although often treated as constant in modeling, the roughness coefficient varies with multiple elements, including channel morphology, longitudinal slope, and bed roughness [13]. Some methods, such as Cowan’s, account for a broader range of factors influencing roughness, including obstructions, irregular cross-sections, meander sharpness, and vegetation density, which can also significantly alter roughness values [26,27]. However, since fish pass operation requires stable conditions year-round and minimal vegetation, such influences are not considered in this research. The methods of estimation used in this study focus primarily on geometric parameters or the channel’s material properties.
In Slovakia, Manning’s roughness coefficient is widely applied in hydraulic calculations for open channels [28]. Accurately determining Manning’s roughness coefficient is a complex task because the individual approach of each researcher is involved in the hydraulic modeling of the river channel. Various equations, modifications, and classification tables have been developed to estimate roughness based on hydrometric and granulometric measurements or material-based selection from empirical tables [29]. Roughness values are crucial variables in numerical modeling and, afterward, strongly influence results that serve for assessing flood resistance in channels and floodplains and for ensuring suitable flow conditions in biocorridors, particularly for aquatic habitats [30].
2.3. Tabulated and Visual Approaches to Estimating Roughness
The methods for determining Manning’s roughness coefficient can be categorized into three main approaches. One approach involves using tabulated values, photographic catalogs, and Cowan’s method, which offer a quick and accessible way to estimate roughness coefficients based on surface-type classifications. While Cowan’s method refines roughness estimation by assigning sub-coefficients to specific channel characteristics, it often results in higher roughness values compared with tabular data and photographic catalogs [31,32].
Tabulated roughness values, provided by various authors and included in the HEC-RAS manual, classify channel materials and present a range of minimum, average, and maximum roughness coefficients for each material type, making them useful for hydraulic modeling. Notably, the roughness values in the HEC-RAS manual are derived from Ven Te Chow’s table of Manning’s n values [25], which is widely used in hydraulic modeling to estimate flow resistance in open channels. This table categorizes different surface types and channel conditions, including natural and constructed channels, as well as various vegetation types, assisting engineers and hydrologists in selecting appropriate roughness coefficients for different environments.
Cowan (1956) introduced a method for estimating Manning’s roughness coefficient by systematically accounting for factors that influence flow resistance. The method starts with a baseline n value for an idealized channel—straight, uniform, and smooth—composed of natural bed and bank materials. Additional adjustments are then applied based on specific channel characteristics (Table 1), including bed and bank composition, material size, and overall channel geometry. This approach, which relies on the subjective evaluation of six key riverbed parameters (Figure 4) was derived from observations of small-to-medium drainage channels and natural streams with a hydraulic radius (R) of less than 4.5 m [33]. The value of n [34] is calculated as follows:
where

Table 1.
Adjustment values for factors that affect the roughness of the channel [12].

Figure 4.
Visualization of the distinct impact of each parameter from Equation (1) [34].
- n0—a base value of n for a straight, uniform, smooth channel in natural materials;
- n1—a correction factor for the effect of surface irregularities;
- n2—a value for variations in shape and size of the channel cross-section;
- n3—a value for obstructions;
- n4—a value for vegetation and flow conditions;
- m5—a correction factor for meandering of the channel.
2.4. Step-by-Step Method
The second approach, the Step-by-Step Method, involves calculating the roughness coefficient for different sections of the channel individually, accounting for variations in bed material, vegetation, and flow conditions. This method allows for a more precise estimation by considering localized differences within a river reach [35]. The values of the roughness coefficient n can then be derived from this method, using data from in situ measurements, including cross-sectional area, wetted perimeter, hydraulic radius, water level at cross-sections, and discharge and distance between neighboring profiles [36].
The standard open-channel hydraulics equation was rearranged (Equation (2)) to solve for the roughness coefficient, allowing for its calculation between cross-sections along the studied reach [37]:
where
- ∆y—water level difference between two profiles (m);
- Q—measured discharge (m3·s−1);
- α—coefficient evaluating the uneven distribution of profile velocity (α = 1.1) (−);
- g—gravitational acceleration (m·s−2);
- A1, A2—flow area of downstream and upstream profile (m2);
- L—length of section between two profiles (m);
- Aaverage—mean value of flow area (m2);
- Raverage—mean value of hydraulic radius (m).
2.5. Empirical Equations from Different Authors
The third approach, empirical equations based on grain size distribution, estimates the roughness coefficient using the grain size distribution of the riverbed material. These formulas are derived from the analysis of sediment characteristics, providing a more data-driven and accurate approach by utilizing measurable properties such as particle size distribution. Some empirical equations come with specific conditions for use, as they are based on measurements from which the equations were derived. These conditions can be expressed verbally (e.g., mountain streams, gravel bed, wide channel) or numerically (e.g., R/d50 < 2) [13]. In this context, R refers to the hydraulic radius (the ratio of the cross-sectional area of flow to the wetted perimeter), and d50 is the characteristic grain size at which 50% of the sediment in a sample is finer.
For this study, the focus is on modified versions of Strickler’s formula, selected for their structural consistency, shared theoretical foundation, and relevance to the fish pass segment. Strickler’s original formula, developed for gravel-bed rivers where roughness is mainly influenced by grain size, is particularly suitable for this study as the fish pass shares these characteristics and lacks significant influences from meandering or vegetation. Although some regionally focused formulas do not explicitly define their applicability limits, their structural similarities to well-known equations suggest they are valid for similar conditions, such as uniform gravel-bed channels with moderate slopes.
Using multiple modifications of Strickler’s formula allowed for a comparative analysis, improving the reliability of Manning’s n estimation. This approach emphasizes the variability inherent in roughness estimation and the need to interpret these values within the specific context of the channel. While no single empirical equation can be universally applied due to variations in channel conditions, using a range of formulas provides valuable insight into the potential roughness values for the study area.
Empirical equations based on the grain size distribution curve define the relationship between sediment grain size and the roughness of river channel beds (Table 2), offering a method for estimating Manning’s roughness coefficient. Many of these equations are derived from Strickler’s formula (Equation (3)), with variations introduced through constants (a), grain diameter (d), and exponents (x) [28]:
where

Table 2.
Strickler equation parameters modified by different authors [28].
- a—constant (−);
- d—characteristic grain diameter (m);
- x—exponent (−).
2.6. Data Acquisition and Processing for Granulometric Analysis
This study introduces a novel approach to granulometric analysis by leveraging high-resolution photogrammetric data instead of traditional handheld photography. While conventional methods rely on single images to derive grain size distribution curves, the use of a three-dimensional point cloud allows for a more precise and comprehensive assessment of surface grain characteristics. This method was particularly suitable given the specific surface characteristics of the fish pass, where stones are embedded in concrete, preventing the influence of underlying materials on granulometric analysis. In contrast to conventional field investigations, which require sample excavation and sieve analysis to determine grain size distribution, UAV (Unmanned Aerial Vehicle)-based photogrammetry offers a non-intrusive, high-resolution assessment of surface sediment properties.
The granulometric analysis of the fish pass was conducted using photogrammetric data derived from aerial imagery. A drone survey was performed along a predefined flight path, capturing high-resolution overlapping images of the study area. The generated point cloud was analyzed using CloudCompare 2.13.2, a specialized software for handling and processing three-dimensional point cloud data. From the 100 m long section of the fish pass captured in the point cloud, four rectangular segments were selected for detailed analysis. The selection criteria prioritized areas where the bed material was visible and perturbation stones (boulders intentionally placed to modify flow conditions) were absent, ensuring an undisturbed representation of the substrate (homogeneous sample) (Figure 5a). To facilitate this analysis, selected segments of the point cloud were rasterized using a grid cell size of 1 mm, ensuring an exceptionally high level of detail. While applying this resolution to the entire dataset would be computationally demanding, it is feasible for smaller, targeted areas, enabling a more refined evaluation of substrate composition. The rasterized data were further processed into hillshade layers, enhancing surface texture visibility and aiding in the interpretation of granulometric patterns. To facilitate further granulometric assessment, hillshade images were created to enhance the visualization of surface features (Figure 5b). These layers were then exported as grayscale images, offering a clear and detailed visualization of the riverbed material for further analysis.
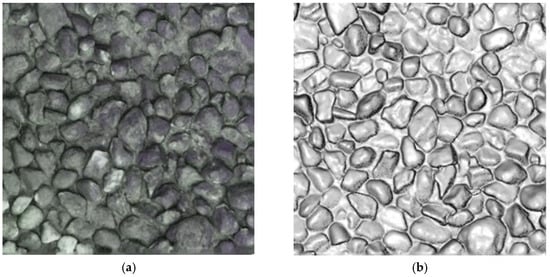
Figure 5.
(a) Point cloud of the selected segment. (b) Hillshade image of the selected segment.
2.7. Grain Size Analysis
To accurately assess sediment composition, image analysis techniques were applied to extract grain size data. ImageJ 1.46r, an open-source image processing software developed by the National Institutes of Health (NIH), was used for this purpose [38]. This software enables granulometric analysis by facilitating particle segmentation, size measurement, and statistical evaluation of grain size distribution. Spatial calibration ensures accurate real-world measurements in units such as millimeters [39,40].
Two approaches were employed in ImageJ to analyze grain size data. The first method represented individual stones as ellipses (Figure 6a), allowing for the measurement of key parameters such as area, major axis, and minor axis. This approach was chosen because ellipses closely approximate the natural shape of gravel grains, making them a reliable representation for granulometric analysis. The second method involved outlining each grain with polygons (Figure 6b), which provided only the area measurement. While polygons offer a more precise depiction of irregularly shaped stones, they are less commonly used in granulometric analysis compared with ellipses.
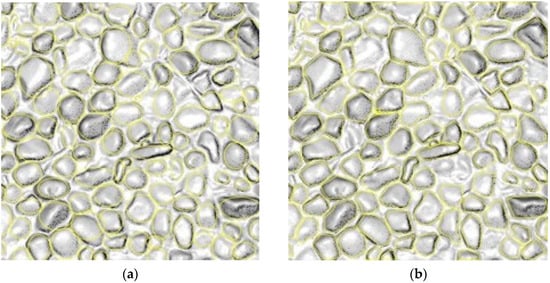
Figure 6.
(a) Elliptical representation of grains. (b) Polygonal representation of grains.
To ensure accurate measurements, the imported images were scaled so that one pixel corresponded to one meter, based on the known width of the image in meters. Measurement settings in ImageJ were adjusted to capture the necessary data, including an area for both ellipses and polygons, while also recording the major and minor axis lengths specifically for ellipses. This dual approach provided a broader dataset for analysis, incorporating both elliptical and polygonal representations of individual stones to capture various aspects of grain size distribution.
3. Results
3.1. Tabular Values
As discussed in the previous chapter, the roughness values presented here are derived from Ven Te Chow’s table, which provides Manning’s roughness coefficients for both natural and constructed channels based on their respective characteristics. While this method can be somewhat subjective, verifying these values through additional analysis is recommended. However, when a designer has prior experience with a construction type closely resembling the one under consideration, it is generally acceptable to use these values as a reference. This is particularly relevant for fish passes with riverbeds composed of embedded stones in concrete, where the material is specific and not influenced by smaller grains. Table 3 presents an excerpt from Ven Te Chow’s table for constructed channels, with the most likely value of Manning’s roughness coefficient, which is highlighted in red by the evaluation of the channel bed and bank materials.

Table 3.
Section of Manning’s n for channels—Chow, 1959 [24].
3.2. Cowan’s Method
The initial roughness coefficient (n0), which characterizes the channel solely based on its material properties without accounting for other factors, was determined by selecting coarse gravel. This choice was considered the most appropriate for representing the nature of the channel, a constructed fish pass, created by embedding river stones in concrete filled with gravel.
When the width-to-depth ratio is low, significant adjustments to roughness are required to account for features such as eroded and scalloped banks, exposed tree roots, and projecting points. Gradual changes in cross-sectional shape and size have little effect on roughness, but sharp bends, alternating sections, and channel shifts can increase roughness. Obstructions such as logs, boulders, and debris disrupt flow, increasing roughness. Vegetation affects roughness based on factors such as flow depth, coverage, density, and alignment with the flow. In narrow channels, the adjustment values in Table 1 are applicable, while the impact is minimal in wide channels (with a maximum adjustment of 0.005). Meandering is characterized by the ratio of the channel’s meandering length to its straight length. According to Cowan’s method and Table 1, the coefficient values were determined as follows:
- Material: coarse gravel, n0 = 0.028;
- Irregularity: smooth, n1 = 0.000;
- Variation in channel cross-section: gradual, n2 = 0.000;
- Effect of obstructions: minor, n3 = 0.010;
- Vegetation: small, n4 = 0.002;
- Meandering: minor, m5 = 1.00.
The coefficient was calculated using Equation (1):
3.3. Results of the Step-by-Step Method
Two 5 m long sections from characteristic cross-sections (CSs) were selected based on the results of the 1D numerical model (Figure 7). In this study, the necessary parameters of the fish pass were derived from a 1D numerical model of the fish pass section, set up using highly accurate data, and calibrated with WRI measurements. The corresponding water levels, flow areas, wetted perimeters, hydraulic radii, and velocities for these sections were extracted from the model (Table 4). The discharge value used in the calculations was obtained from in situ measurements conducted by the Water Research Institute, Bratislava, Slovakia, in November 2023. Manning’s roughness coefficient for each section was then determined using Equation (2).
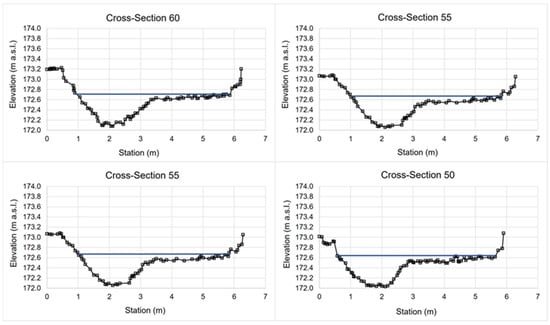
Figure 7.
Cross-section measurements of the Veľké Kozmálovce fish pass.

Table 4.
Measured cross-sectional data of the fish pass and calculated Manning’s roughness coefficient (single parameters: Q—discharge, v—velocity, A—flow area, R—hydraulic radius, L—length, y—water level difference, i—slope, Aaverag—mean value of flow area, Raverage—mean value of hydraulic radius).
3.4. Grain Size Distribution Curve
The grain sizes obtained from ImageJ were exported into an Excel worksheet, where the parameters for ellipses and polygons representing individual grains were recorded. For ellipses, the minor axis was used as the diameter of the grain, while for grains represented by polygons, the diameter was calculated by assuming a circular shape and deriving it from the area of every polygon. The next step involved determining the percentage each grain contributed to the total dataset. This was achieved by sorting the grains in ascending order of size and comparing the area of each grain to the total area, which was the sum of all individual grain areas. The percentage for each successive grain was calculated by cumulatively adding the percentage of the smaller grains preceding it, ultimately reaching 100% for the largest grain. This method facilitated the creation of a grain size distribution curve, plotted on a logarithmic scale, which provided the necessary data for subsequent roughness coefficient calculations using empirical equations.
Although four segments were selected for this analysis, the data from each segment were averaged to generate a single representative grain size distribution curve. To enable a comparative evaluation, two separate curves were constructed: one derived from ellipse-based data and the other from polygon-based data (Figure 8). This approach allowed for an assessment of the differences between the two methods in characterizing the grain size distribution within the fish pass.
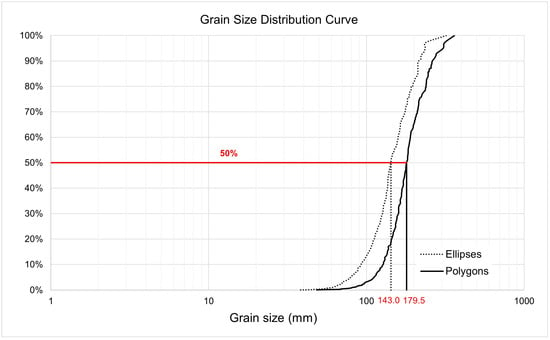
Figure 8.
Grain size distribution curves for elliptical and polygonal grains.
The following graphs (Figure 9 and Figure 10) compare Manning’s roughness coefficient n calculated using various modifications of Strickler’s formula (Table 5), with each graph derived from a different grain size distribution curve. These curves were generated from distinct input datasets, leading to slight variations. The red dashed line in each graph represents the average roughness coefficient across all calculated values, providing a reference for comparison.
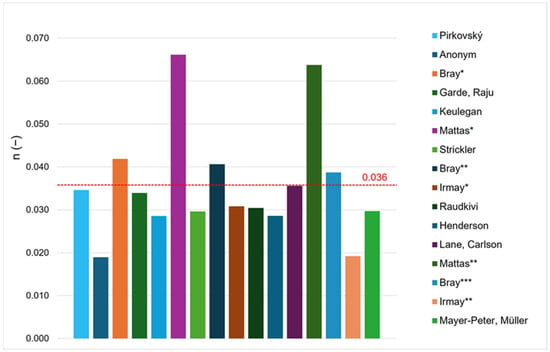
Figure 9.
Graphical representation of the results obtained for Manning’s roughness coefficient, based on photogrammetric granulometry (ellipses), as shown in Table 5. */**/*** indicate that the same author proposed multiple roughness equations, each using different values of the empirical constant a and/or particle diameter d.
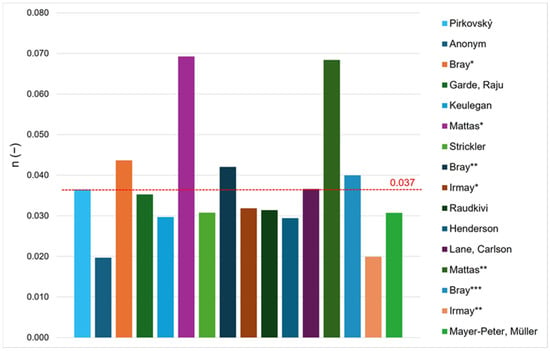
Figure 10.
Graphical representation of the results obtained for Manning’s roughness coefficient, based on photogrammetric granulometry (polygons), as shown in Table 5. */**/*** indicate that the same author proposed multiple roughness equations, each using different values of the empirical constant a and/or particle diameter d.

Table 5.
Manning’s roughness coefficient calculated by different authors.
3.5. Overview of Results
To assess the accuracy of the estimated roughness values in comparison to the calibrated value (Figure 11), several statistical performance metrics were used. These include the Mean Absolute Error (MAE), Root Mean Square Error (RMSE), Mean Bias Error (MBE), Percentage Bias (PBIAS), and Willmott’s Index of Agreement (d-index). Each metric offers a unique perspective on the reliability and behavior of the estimation methods. Before introducing the formulas, the following notations are used throughout:
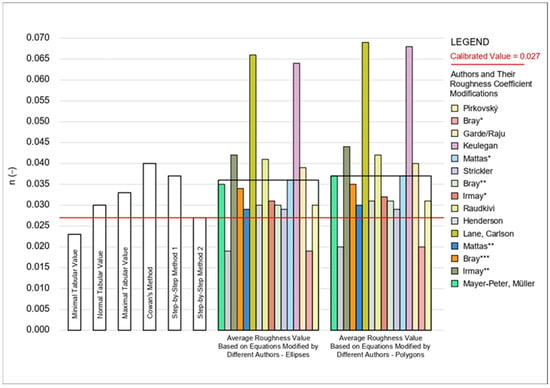
Figure 11.
Comparison of estimated roughness values through different methods to the calibrated Manning’s roughness coefficient. */**/*** indicate that the same author proposed multiple roughness equations, each using different values of the empirical constant a and/or particle diameter d.
- N: the total number of data points;
- ni: the estimated roughness value for the i-th estimation method;
- n: the calibrated roughness value.
MAE quantifies the average magnitude of the errors between the estimated and calibrated values without considering the direction of the errors (i.e., whether the estimates are over or under the actual values). It is calculated as
RMSE quantifies the spread of the errors by measuring the square root of the average squared differences between estimated and calibrated values. Unlike MAE, RMSE gives more weight to larger errors, making it more sensitive to significant deviations. It is calculated as
MBE helps to identify if the methods tend to overestimate or underestimate the roughness value. A positive MBE indicates overestimation, while a negative value suggests underestimation. It is given by
PBIAS shows the average tendency of the estimated values to be larger or smaller than the calibrated values in percentage terms. It is calculated as
The d-index is a standardized measure of the degree of prediction accuracy, ranging from 0 (no agreement) to 1 (perfect agreement). It is computed as
The results from the statistical calculations reveal several important insights into the accuracy of the estimation methods. The MAE of 0.006 and the RMSE of 0.0014 suggest that the estimation methods generally produce reliable results, with relatively small errors in the magnitude of the estimates. The low RMSE value, while smaller than the MAE, also highlights that larger discrepancies exist for specific estimation method results, as RMSE penalizes larger errors more heavily than MAE.
The Mean Bias Error (MBE) of +0.009 indicates that, on average, the estimated roughness values tend to overestimate the calibrated values. This is further confirmed by the Percentage Bias (PBIAS), which shows a substantial overestimation with a value of 32.5%. This means that, on average, the estimated roughness values are about 30% higher than the calibrated reference values, indicating a systematic overestimation across the methods. Despite this positive bias, Willmott’s Index of Agreement (d-index) of 0.75 suggests that there is moderate-to-good overall agreement between the estimated and calibrated values. This means that while the methods overestimate the roughness values, they generally follow the same trend as the calibrated values, capturing the pattern of roughness relatively accurately, even if the magnitude is slightly off.
Table 6 presents the Absolute Error (AE) and Relative Error (RE) for each estimation method. The AE indicates the magnitude of the deviation between the estimated and calibrated values, while the RE shows the percentage deviation relative to the calibrated values [41]. These errors provide a direct view of how the estimations differ from the reference values in both absolute terms and relative to their size, offering valuable insight into the performance of each estimation method [41]:

Table 6.
Comparison of estimated roughness values to the calibrated value of n.
4. Discussion
The estimation of Manning’s roughness coefficient for the Veľké Kozmálovce fish pass varies between 0.023 and 0.040, depending on the applied methodology. A common approach in fish pass design is to initially select roughness values from tabulated references, such as Ven Te Chow’s table [25], which offers generalized coefficients based on typical channel conditions. A numerical model is used to adjust these values, improving their representation of site-specific hydraulic behavior. However, when applied to complex, artificially constructed structures such as fish passes, tabulated values alone may not sufficiently capture the variability introduced by localized geometry, substrate, and hydraulic controls.
Given the artificial nature of the Veľké Kozmálovce fish pass—constructed with river boulders embedded in concrete and filled with coarse gravel [24]—generalized values must be validated or supplemented by empirical analysis and high-resolution surveying. In similar hydrotechnical structures, including nature-like bypass channels, roughness estimation is frequently approached using a combination of field calibration, numerical simulations, and empirical methods.
In this study, a photogrammetric scan provided detailed three-dimensional data on the channel geometry, including cross-sectional profiles, longitudinal slope, and structural elements. In areas where drone access was obstructed—particularly beneath bridges—additional photographs taken from the riverbank were necessary to supplement the dataset. These measurements were essential for understanding flow behavior and directly contributed to roughness estimation. The scan also supported a grain size distribution analysis using ImageJ, in which particle diameters were extracted by segmenting grains into ellipses and polygons. These values were used to create granulometric curves and subsequently in empirical formulas, yielding average Manning’s coefficients of 0.036 and 0.037, depending on the source.
Cowan’s method, which considers multiple influencing factors—such as surface material, irregularities, vegetation, obstructions, and alignment [32]—resulted in a coefficient of 0.040. While comprehensive, it is known to overestimate roughness, offering conservative values suitable for safety margins but possibly diverging from actual hydraulic conditions [1,13]. The Step-by-Step method, applied to characteristic cross-sections, produced a narrower range (0.027–0.037) based on site-specific hydraulic parameters such as wetted perimeter, hydraulic radius, and channel slope [6].
Several empirical methods based on sediment grain size were also evaluated. In similar cases, such as stepped rock ramps or boulder-lined bypass channels, empirical methods using d84 or d90 are often preferred over d50, as they better reflect flow resistance caused by larger particles [19]. These approaches helped highlight the limitations of some formulas. For instance, Mattas’ formula produced overestimated values, while methods from Anonym and Irmay underestimated roughness [31]. This variability demonstrates the importance of selecting a method that aligns with the physical characteristics of the specific site [8].
Among the evaluated methods, Keulegan’s and Henderson’s formulas produced the most consistent and realistic results, closely matching roughness coefficients calibrated through 1D numerical modeling. Keulegan’s formula is well-suited for channels with coarse-grained, non-cohesive beds such as gravel and cobbles but may underestimate total resistance in the presence of form roughness (e.g., ripples or dunes) [42]. Henderson’s approach, similarly grounded in coarse-bed hydraulics [43], proved effective due to the similarities between its assumptions and the actual geometry of the Veľké Kozmálovce fish pass.
Given the composition and design of the fish pass—featuring stable, immobile substrate and structured flow control—the best results were achieved using methods that emphasize grain roughness with minimal form or vegetation effects. For such conditions, the formulas by Keulegan and Henderson appear most appropriate, offering a balance between empirical simplicity and site-specific applicability. They are particularly recommended for similar fish passes with armored beds and predictable geometry, especially when used in conjunction with subsequent calibration via hydraulic modeling [14].
Finally, the statistical evaluation supports this conclusion. The Mean Absolute Error (MAE) and Root Mean Square Error (RMSE) showed generally low deviation from calibrated values [41]. Mean Bias Error (MBE) and Percentage Bias (PBIAS) confirmed a tendency toward overestimation, averaging around 30%. However, Willmott’s Index of Agreement (d-index) of 0.75 indicates a moderate-to-good match between estimated and modeled values. Together with the absolute and relative error metrics, these findings confirm that while some bias exists, the applied methods provide a reliable representation of the channel’s hydraulic roughness.
Although this research focuses on a single fish pass in Slovakia, the growing implementation of close-to-nature designs in the region suggests that many such structures share comparable hydraulic and structural characteristics. This increases the potential for applying the presented methodology to other sites with similar conditions. The innovative aspect of this study lies in the use of high-precision terrain data derived from photogrammetric scanning to refine Manning’s roughness estimation—an approach that remains relatively underexplored in the current literature.
This methodology not only fills a gap in the understanding of roughness estimation for fish passes but also offers a practical tool for enhancing future hydraulic modeling and design. Nonetheless, it is important to acknowledge the limitations of this work, particularly its focus on a single case study and the potential variability in results when applied to different environmental or structural contexts. For broader applicability, future research should include fish passes with more diverse geometries, substrates, and flow regimes to validate and generalize the approach presented here.
5. Conclusions
This study highlights the importance of selecting an appropriate methodology for estimating Manning’s roughness coefficient in fish passes. The comparison of different approaches demonstrates that no single method provides an absolute value, but rather that a combination of techniques is necessary for accurate hydraulic modeling. While tabulated values serve as a useful reference, they require validation through numerical modeling or empirical analysis to account for site-specific conditions. While empirical equations used to estimate roughness are typically derived under the assumption of uniform flow, such conditions are rarely present in natural environments. However, in the context of a nature-like fish pass, as examined in this study, many of these influences are either absent or significantly modified.
In the case of the Veľké Kozmálovce fish pass, the structure is designed to mimic natural morphology, but certain simplifying conditions apply. Irregularities typically found in natural channels are minimal in this artificial setting. As a result, the dominant contributors to hydraulic resistance are surface roughness caused by coarse materials (e.g., pebbles embedded in concrete) and the presence of isolated boulders that act as discrete flow obstructions. The resulting flow regime can be characterized as steady and non-uniform.
This study applied a combination of high-resolution drone-based photogrammetry, grain size distribution analysis using ImageJ software, and multiple empirical and analytical approaches to estimate roughness in the Veľké Kozmálovce fish pass (a structure characterized by complex geometry and heterogeneous bed material, including boulders and coarse gravel embedded in concrete).
The roughness coefficient is often subjectively adjusted to meet specified depth and velocity criteria in fish passes, which can sometimes lead to overestimation to achieve the desired conditions. Balancing a natural appearance with functional hydraulic parameters frequently requires structural elements such as single stones, perturbation boulders, or cross walls with slots. These interventions increase the complexity of the hydraulic environment, emphasizing the need for detailed modeling approaches for accurate roughness coefficient determination.
From a practical standpoint, these findings can contribute to better-informed hydraulic modeling and more effective fish pass design. They highlight the importance of detailed site-specific assessments, especially for close-to-nature solutions where design details directly affect hydraulic conditions in the internal environment of the fish pass. Further research should aim to integrate unsteady flow modeling and validate roughness estimates against long-term field data, especially under varying discharge conditions, to refine the estimation process and improve design guidelines for future nature-like fish passes.
Author Contributions
Conceptualization, A.R., L.Č., and A.V.; methodology, L.Č. and J.R.; software, A.R.; validation, A.R., L.Č., and J.R.; formal analysis, A.V. and P.D.; investigation, A.R., L.Č., and J.R.; resources, A.V.; data curation, P.D.; writing—original draft preparation, A.R. and L.Č.; writing—review and editing, A.R., L.Č., J.R., and A.V.; visualization, A.V.; supervision, L.Č. and J.R.; project administration, L.Č. All authors have read and agreed to the published version of the manuscript.
Funding
This research received no external funding.
Data Availability Statement
The data are not publicly available due to institutional property rights.
Acknowledgments
This contribution was developed within the framework and based on the financial support of the APVV-20-0023 and APVV-23-0447 projects.
Conflicts of Interest
The authors declare no conflicts of interest.
References
- Schügerl, R.; Velísková, Y. Change of the Manning’s Coefficient in Small Stream Influenced by Vegetation. Acta Hydrol. Slovaca 2023, 24, 134–140. [Google Scholar] [CrossRef]
- Čubanová, L.; Rumann, J.; Dušička, P.; Vidová, A. Impact of Different Methods on the Variability of the Manning’s Roughness Coefficient in Artificial Channel. Acta Hydrol. Slovaca 2024, 25, 250–259. [Google Scholar] [CrossRef]
- Hassanpour, N.; Hosseinzadeh Dalir, A.; Farsadizadeh, D.; Gualtieri, C. An Experimental Study of Hydraulic Jump in a Gradually Expanding Rectangular Stilling Basin with Roughened Bed. Water 2017, 9, 945. [Google Scholar] [CrossRef]
- Chow, V.T. Open-Channel Hydraulics, 1st ed.; McGraw-Hill: New York, NY, USA, 1959; ISBN 07-010776-9. [Google Scholar]
- Chanson, H. The Hydraulics of Open Channel Flow: An Introduction Basic Principles, Sediment Motion, Hydraulic Modelling, Design of Hydraulic Structures, 2nd ed.; Butterworth-Heinemann: Oxford, UK, 2004. [Google Scholar]
- Čubanová, L.; Rumann, J.; Vidová, A.; Almikaeel, W.; Rebenda, F. Verification of Hydraulic Parameters of Nature-like Fish Pass. Water 2023, 15, 2478. [Google Scholar] [CrossRef]
- Armstrong, G.S.; Aprahamian, M.W.; Fewings, G.A.; Gough, P.J.; Reader, N.A.; Varallo, P.V. Guidance Notes on The Legislation, Selection and Approval of Fish Passes in England and Wales; Environment Agency: Bristol, UK, 2010.
- Dumitran, G.E.; Vuţă, L.I. Design of Rock Ramps for Ensuring Fish Migration. Sci. Bull. Univ. Politeh. Buchar. 2017, 79, 240–243. [Google Scholar]
- Čubanová, L. Guidebook: Data, Methodology, Examples, 1st ed.; Scholar’s Press: Saarbrücken, Germany, 2014. [Google Scholar]
- DWA-M 509-Fischaufstiegsanlagen und Fischpassierbare Bauwerke-Gestaltung, Bemessung, Qualitätssicherung; Deutsche Vereinigung für Wasserwirtschaft, Abwasser und Abfall: Hennef, Germany, 2014.
- Gilja, G.; Ocvirk, E.; Fliszar, R. Experimental Investigation of the Reynolds Shear Stress Exceedance Rate for the Injury and Disorientation Biocriteria Boundary in the Pool-Orifice and Vertical Slot Type Fishways. Appl. Sci. 2021, 11, 7708. [Google Scholar] [CrossRef]
- Coon, W.F. Estimation of Roughness Coefficients for Natural Stream Channels with Vegetated Banks; U.S. Geological Survey: Denver, CO, USA, 1998.
- Smelík, L. Proposal of a Methodology for Determining the Roughness Coefficient of Open Channels (In Czech: Návrh metodiky stanovení součinitele drsnosti otevřených koryt). Ph.D. Thesis, Faculty of Civil Engineering, Brno University of Technology, Brno, Czech Republic, 2015. [Google Scholar]
- Kubrak, M.; Smoliński, B.; Riha, J.; Kodura, A.; Popielski, P.; Jabłoński, K. The Application of a Minimum Specific Energy Concept for a Fish Ladder Design. Arch. Civ. Eng. 2022, 68, 555–568. [Google Scholar] [CrossRef]
- Duchan, D.; Kotaška, S.; Pospíšilík, Š.; Dráb, A. Sensitivity Analysis of Selected Input Parameters of the Numerical Model HEC-RAS in Floodplain Flow Calculations (In Czech: Citlivostní Analýza Vybraných Vstupních Parametrů Numerického Modelu HEC-RAS Při Hydraulických Výpočtech Proudění Vody v Korytech Toků a Záplavových Územích). Vodohospodářské Tech.-Ekon. Inf. 2021, 63, 42–47. [Google Scholar]
- Čubanová, L.; Vidová, A.; Dušička, P.; Polák, V. A Physical and Hydraulic Model of a Technical Fish Pass. Slovak J. Civ. Eng. 2025, 33, 1–9. [Google Scholar] [CrossRef]
- Liu, L. Drone-Based Photogrammetry for Riverbed Characteristics Extraction and Flood Discharge Modeling in Taiwan’s Mountainous Rivers. Measurement 2023, 220, 113386. [Google Scholar] [CrossRef]
- Purinton, B.; Bookhagen, B. Introducing PebbleCounts: A Grain-Sizing Tool for Photo Surveys of Dynamic Gravel-Bed Rivers. Earth Surf. Dyn. 2019, 7, 859–877. [Google Scholar] [CrossRef]
- Bunte, K.; Abt, S.R. Sampling Surface and Subsurface Particle-Size Distributions in Wadable Gravel-and Cobble-Bed Streams for Analyses in Sediment Transport, Hydraulics, and Streambed Monitoring; U.S. Department of Agriculture: Fort Collins, CO, USA, 2001.
- Marcus, W.A.; Fonstad, M.A. Optical Remote Mapping of Rivers at Sub-meter Resolutions and Watershed Extents. Earth Surf. Process. Landf. 2008, 33, 4–24. [Google Scholar] [CrossRef]
- Raplík, M.; Macura, V. Analysis of the Granulometry of Gravel-Sand Riverbeds Using Photographic Methods (In Slovak: Analýza Granulometrie Štrkopieskových Korýt Fotografickou Metódou). In Proceedings of the Specialist Seminar: Surface Water Flow and Its Effects on the Environment, Proceedings of Papers, Tatranská Štrba, Slovakia, 1983; pp. 31–38. [Google Scholar]
- Fošumpaur, P.; Králík, M.; Zukal, M. Physical and Numerical Modelling in the Research of Hydraulic Structures. In Proceedings of the International Conference on Modelling and Simulation 2010, Prague, Czech Republic, 22–25 June 2010. [Google Scholar]
- Kazancı, N.; Ekingen, P.; Dügel, M.; Türkmen, G. Hirudinea (Annelida) Species and Their Ecological Preferences in Some Running Waters and Lakes. Int. J. Environ. Sci. Technol. 2015, 12, 1087–1096. [Google Scholar] [CrossRef]
- Rutzká, A. Fish-Pass-Flow Modelling Utilizing Detailed Geometric Data Obtained by Photogrammetric Scanning (In Slovak: Modelovanie Prúdenia v Rybovode s Využitím Detailných Geometrických Údajov Získaných Fotogrametrickým Skenovaním). Master’s Thesis, Faculty of Civil Engineering, Slovak University of Technology in Bratislava, Bratislava, Slovakia, 2024. [Google Scholar]
- Manning’s n Values. Available online: https://www.fsl.orst.edu/geowater/FX3/help/8_Hydraulic_Reference/Mannings_n_Tables.htm (accessed on 18 March 2025).
- HEC-RAS River Analysis System, User’s Manual, Version 6.4. Available online: https://www.hec.usace.army.mil/confluence/rasdocs/r2dum/6.4/developing-a-terrain-model-and-geospatial-layers/creating-land-cover-mannings-n-values-and-impervious-layers (accessed on 18 March 2025).
- Phillips, J.V.; Tadayon, S. Selection of Manning’s Roughness Coefficient for Natural and Constructed Vegetated and Non-Vegetated Channels, and Vegetation Maintenance Plan Guidelines for Vegetated Channels in Central Arizona; U.S. Geological Survey: Reston, VI, USA, 2007. [Google Scholar]
- Mäsiar, E.; Kamenský, J. Hydraulics (In Slovak: Hydraulika), 3rd ed.; Slovak University of Technology: Bratislava, Slovakia, 2001.
- Maňák, P. Manning’s Roughness Coefficients. Seminar Thesis, Subject Morphology and River Engineering, Czech Technical University, Prague, Czech Republic, 2017. [Google Scholar]
- Arcement, G.J.; Schneider, V.R. Guide for Selecting Manning’s Roughness Coefficients for Natural Channels and Flood Plains; U.S. Geological Survey: Reston, VI, USA, 1989.
- Čubanová, L.; Rumann, J.; Dušička, P. Effect of Different Methods on the Manning’s Roughness Coefficient Determination for the Close to Nature Fish Pass. In Proceedings of the 18th International Symposium Water Management & Hydraulic Engineering WHME 2024, Štrbské Pleso, Slovakia, 10–14 September 2024; pp. 21–30. [Google Scholar]
- Boulomytis, V.T.G.; Zuffo, A.C.; Dalfré Filho, J.G.; Imteaz, M.A. Estimation and Calibration of Manning’s Roughness Coefficients for Ungauged Watersheds on Coastal Floodplains. Int. J. River Basin Manag. 2017, 15, 199–206. [Google Scholar] [CrossRef]
- Jaworowski, A. Manning’s Roughness Coefficient in Small Scale Nature-like Fish Passages. Master’s Thesis, Lund University, Lund, Sweden, 2022. [Google Scholar]
- Laiho, D. Session A6- Mannings “n” Roughness Characteristic Occurring in Semi- Smooth Turbulent Flow of Nature-like Fishways. In Proceedings of the International Conference on Engineering and Ecohydrology for Fish Passage, Corvallis, OR, USA, 28 June 2011. [Google Scholar]
- Sokáč, M.; Velísková, Y.; Gualtieri, C. Application of Asymmetrical Statistical Distributions for 1D Simulation of Solute Transport in Streams. Water 2019, 11, 2145. [Google Scholar] [CrossRef]
- Dušička, P.; Květon, R. Canal Hydropower Plants–Hydraulic Research Diversion Channel Operations (In Slovak: Kanálové Vodné Elektrárne–Hydraulický Výskum Prevádzky Derivačných Kanálov), 1st ed.; Spektrum STU: Bratislava, Slovakia, 2015. [Google Scholar]
- Schügerl, R.; Velísková, Y.; Sočuvka, V.; Dulovičová, R. Effect of Aquatic Vegetation on Manning’s Roughness Coefficient Value–Case Study at the Šúrsky Channel. Acta Hydrol. Slovaca 2020, 21, 123–129. [Google Scholar] [CrossRef]
- Ferreira, T.; Rasband, W. ImageJ User Guide. 2012. Available online: https://imagej.net/ij/docs/guide/146.html (accessed on 7 May 2025).
- Mateas, M. ImageJ for Windows. Available online: https://imagej.en.softonic.com/ (accessed on 18 March 2025).
- Schroeder, A.B.; Dobson, E.T.A.; Rueden, C.T.; Tomancak, P.; Jug, F.; Eliceiri, K.W. The ImageJ Ecosystem: Open-Source Software for Image Visualization, Processing, and Analysis. Protein Sci. 2021, 30, 234–249. [Google Scholar] [CrossRef] [PubMed]
- Daneshfaraz, R.; Norouzi, R.; Ebadzadeh, P. Experimental and numerical study of sluice gate flow pattern with non-suppressed sill and its effect on discharge coefficient in free-flow conditions. J. Hydraul. Struct. 2022, 8, 1–20. [Google Scholar]
- Henderson, F.M. Open Channel Flow. J. Fluid Mech. 1967, 29, 414–415. [Google Scholar]
- Keulegan, G.H. Laws of Turbulent Flow in Open Channels. J. Res. Natl. Bur. Stand. 1938, 21, 707–774. [Google Scholar] [CrossRef]
Disclaimer/Publisher’s Note: The statements, opinions and data contained in all publications are solely those of the individual author(s) and contributor(s) and not of MDPI and/or the editor(s). MDPI and/or the editor(s) disclaim responsibility for any injury to people or property resulting from any ideas, methods, instructions or products referred to in the content. |
© 2025 by the authors. Licensee MDPI, Basel, Switzerland. This article is an open access article distributed under the terms and conditions of the Creative Commons Attribution (CC BY) license (https://creativecommons.org/licenses/by/4.0/).