
Hydrochemical Characteristics and Quality Assessment of Groundwater in the Yangtze River Basin: A Comparative Study of the Hexian Area, China

Abstract
1. Introduction
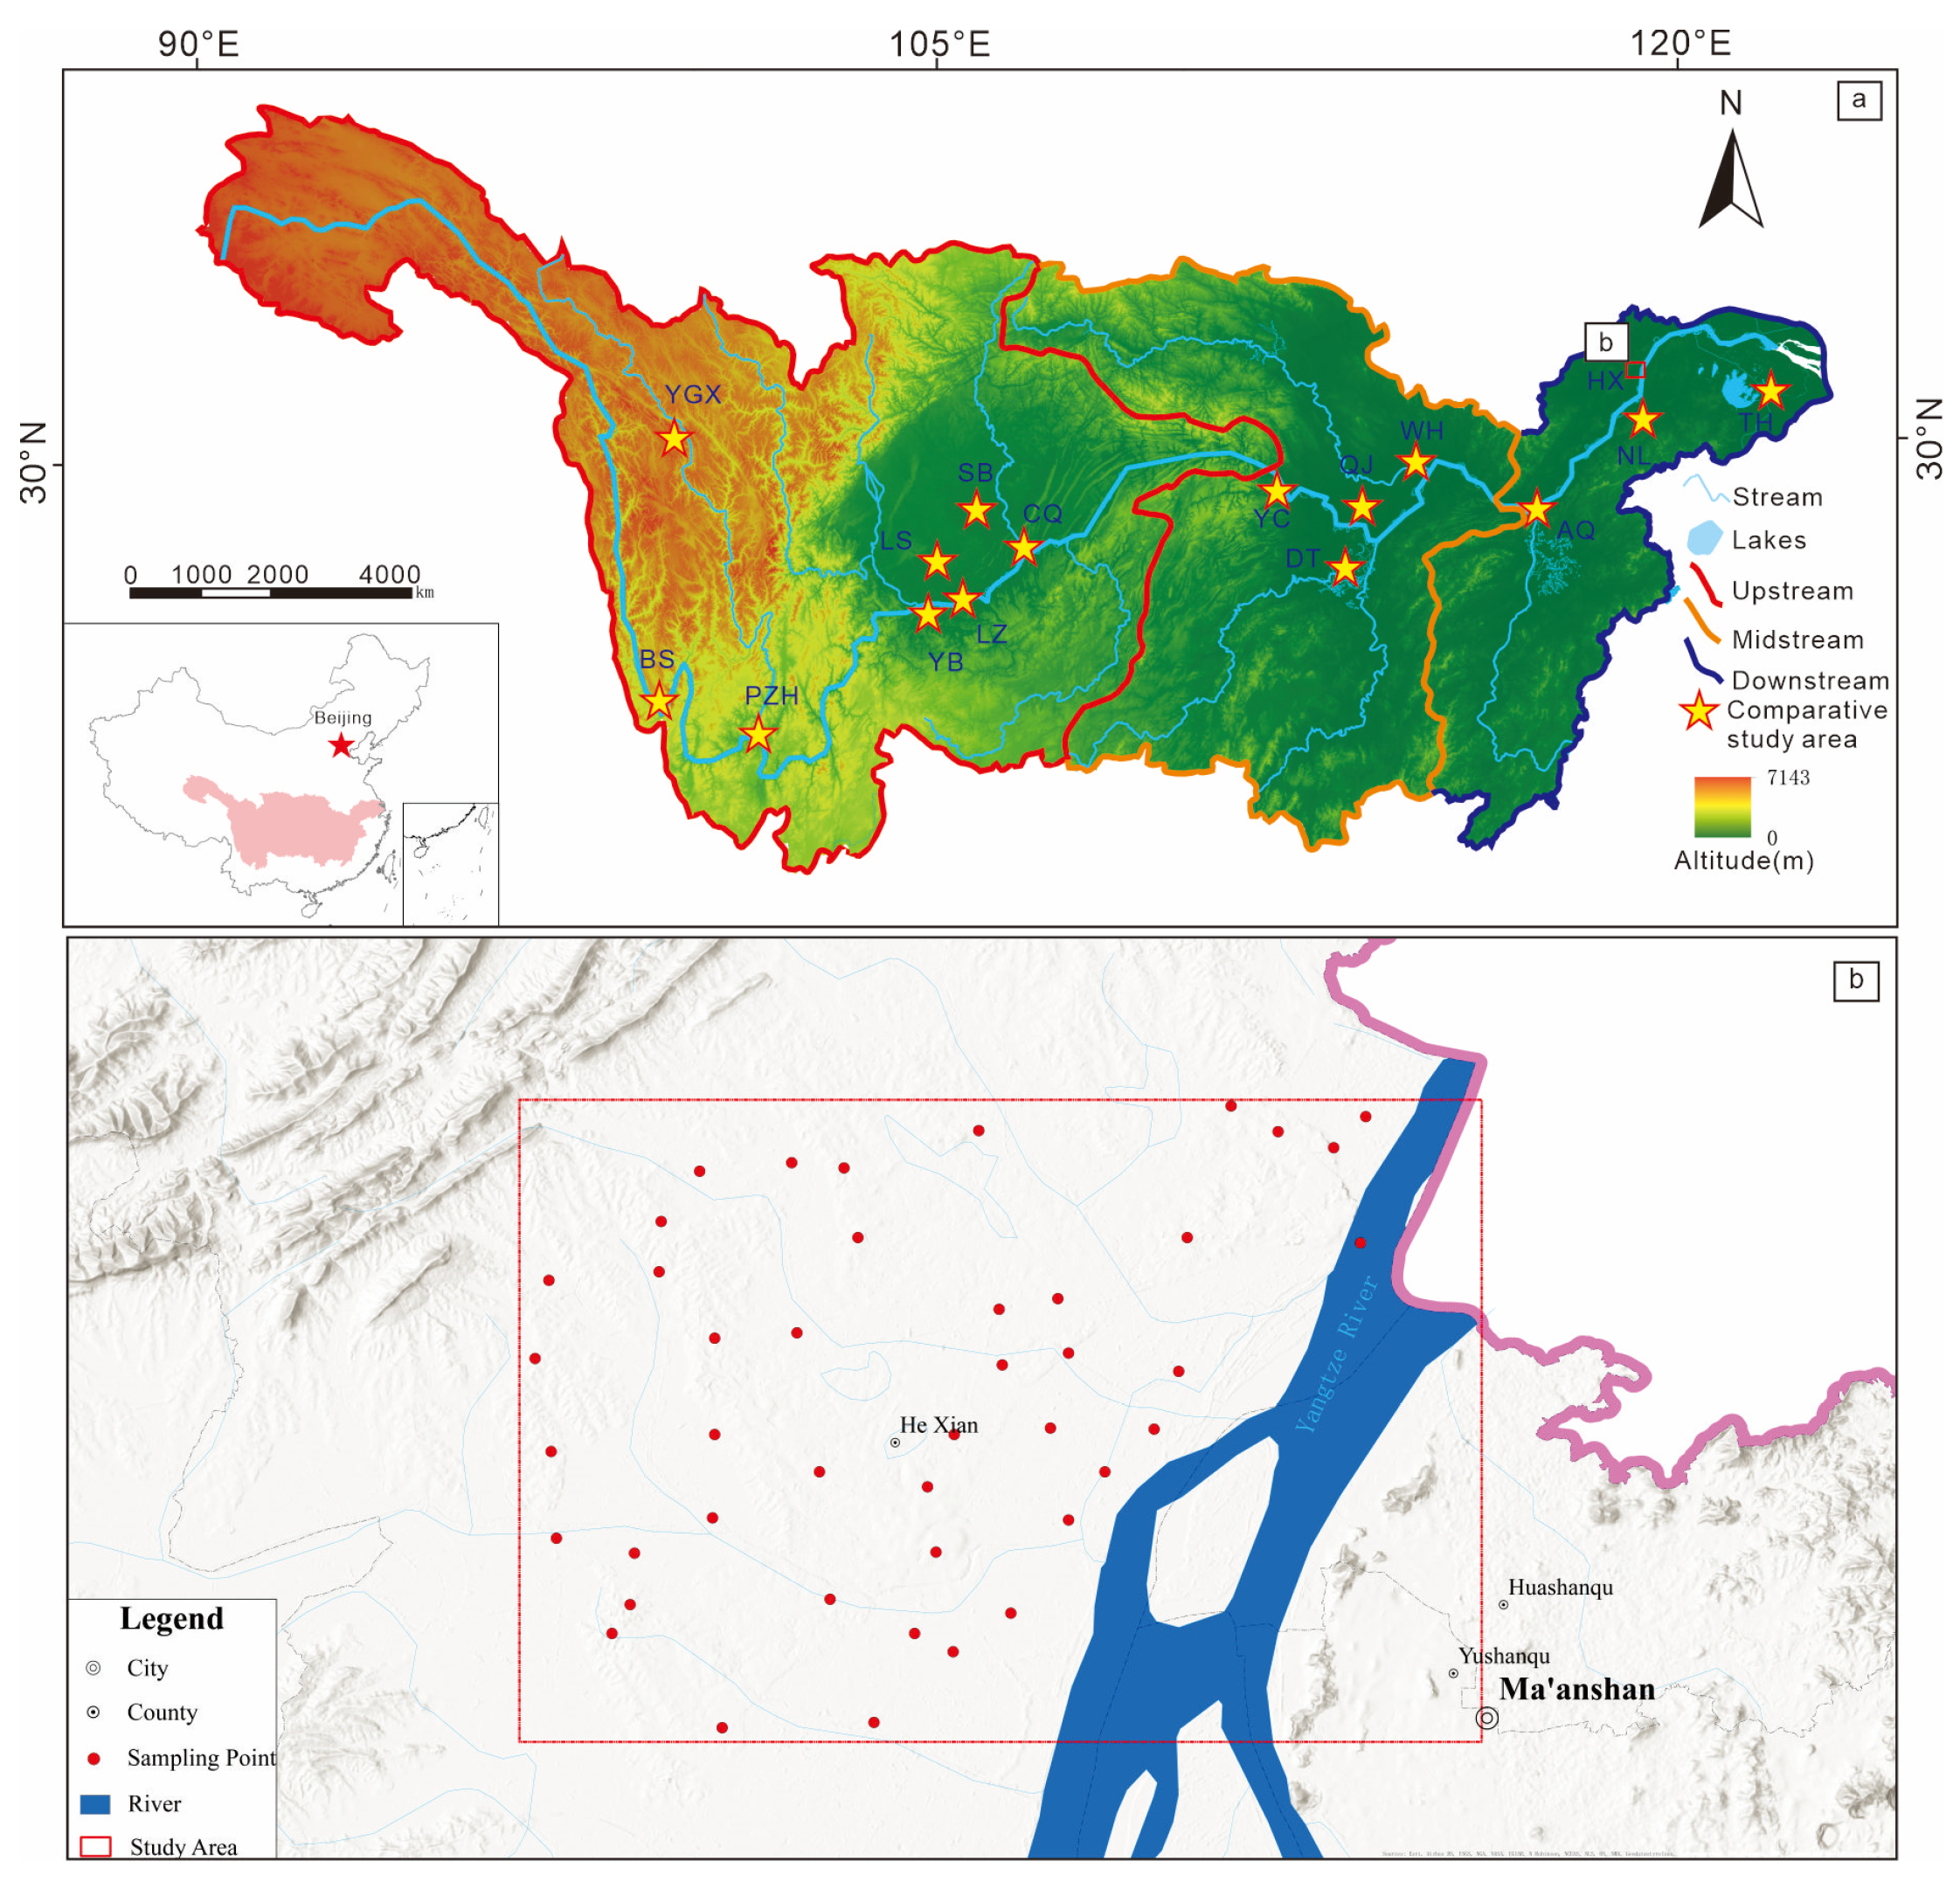
2. Study Area
3. Materials and Methods
4. Results and Discussion
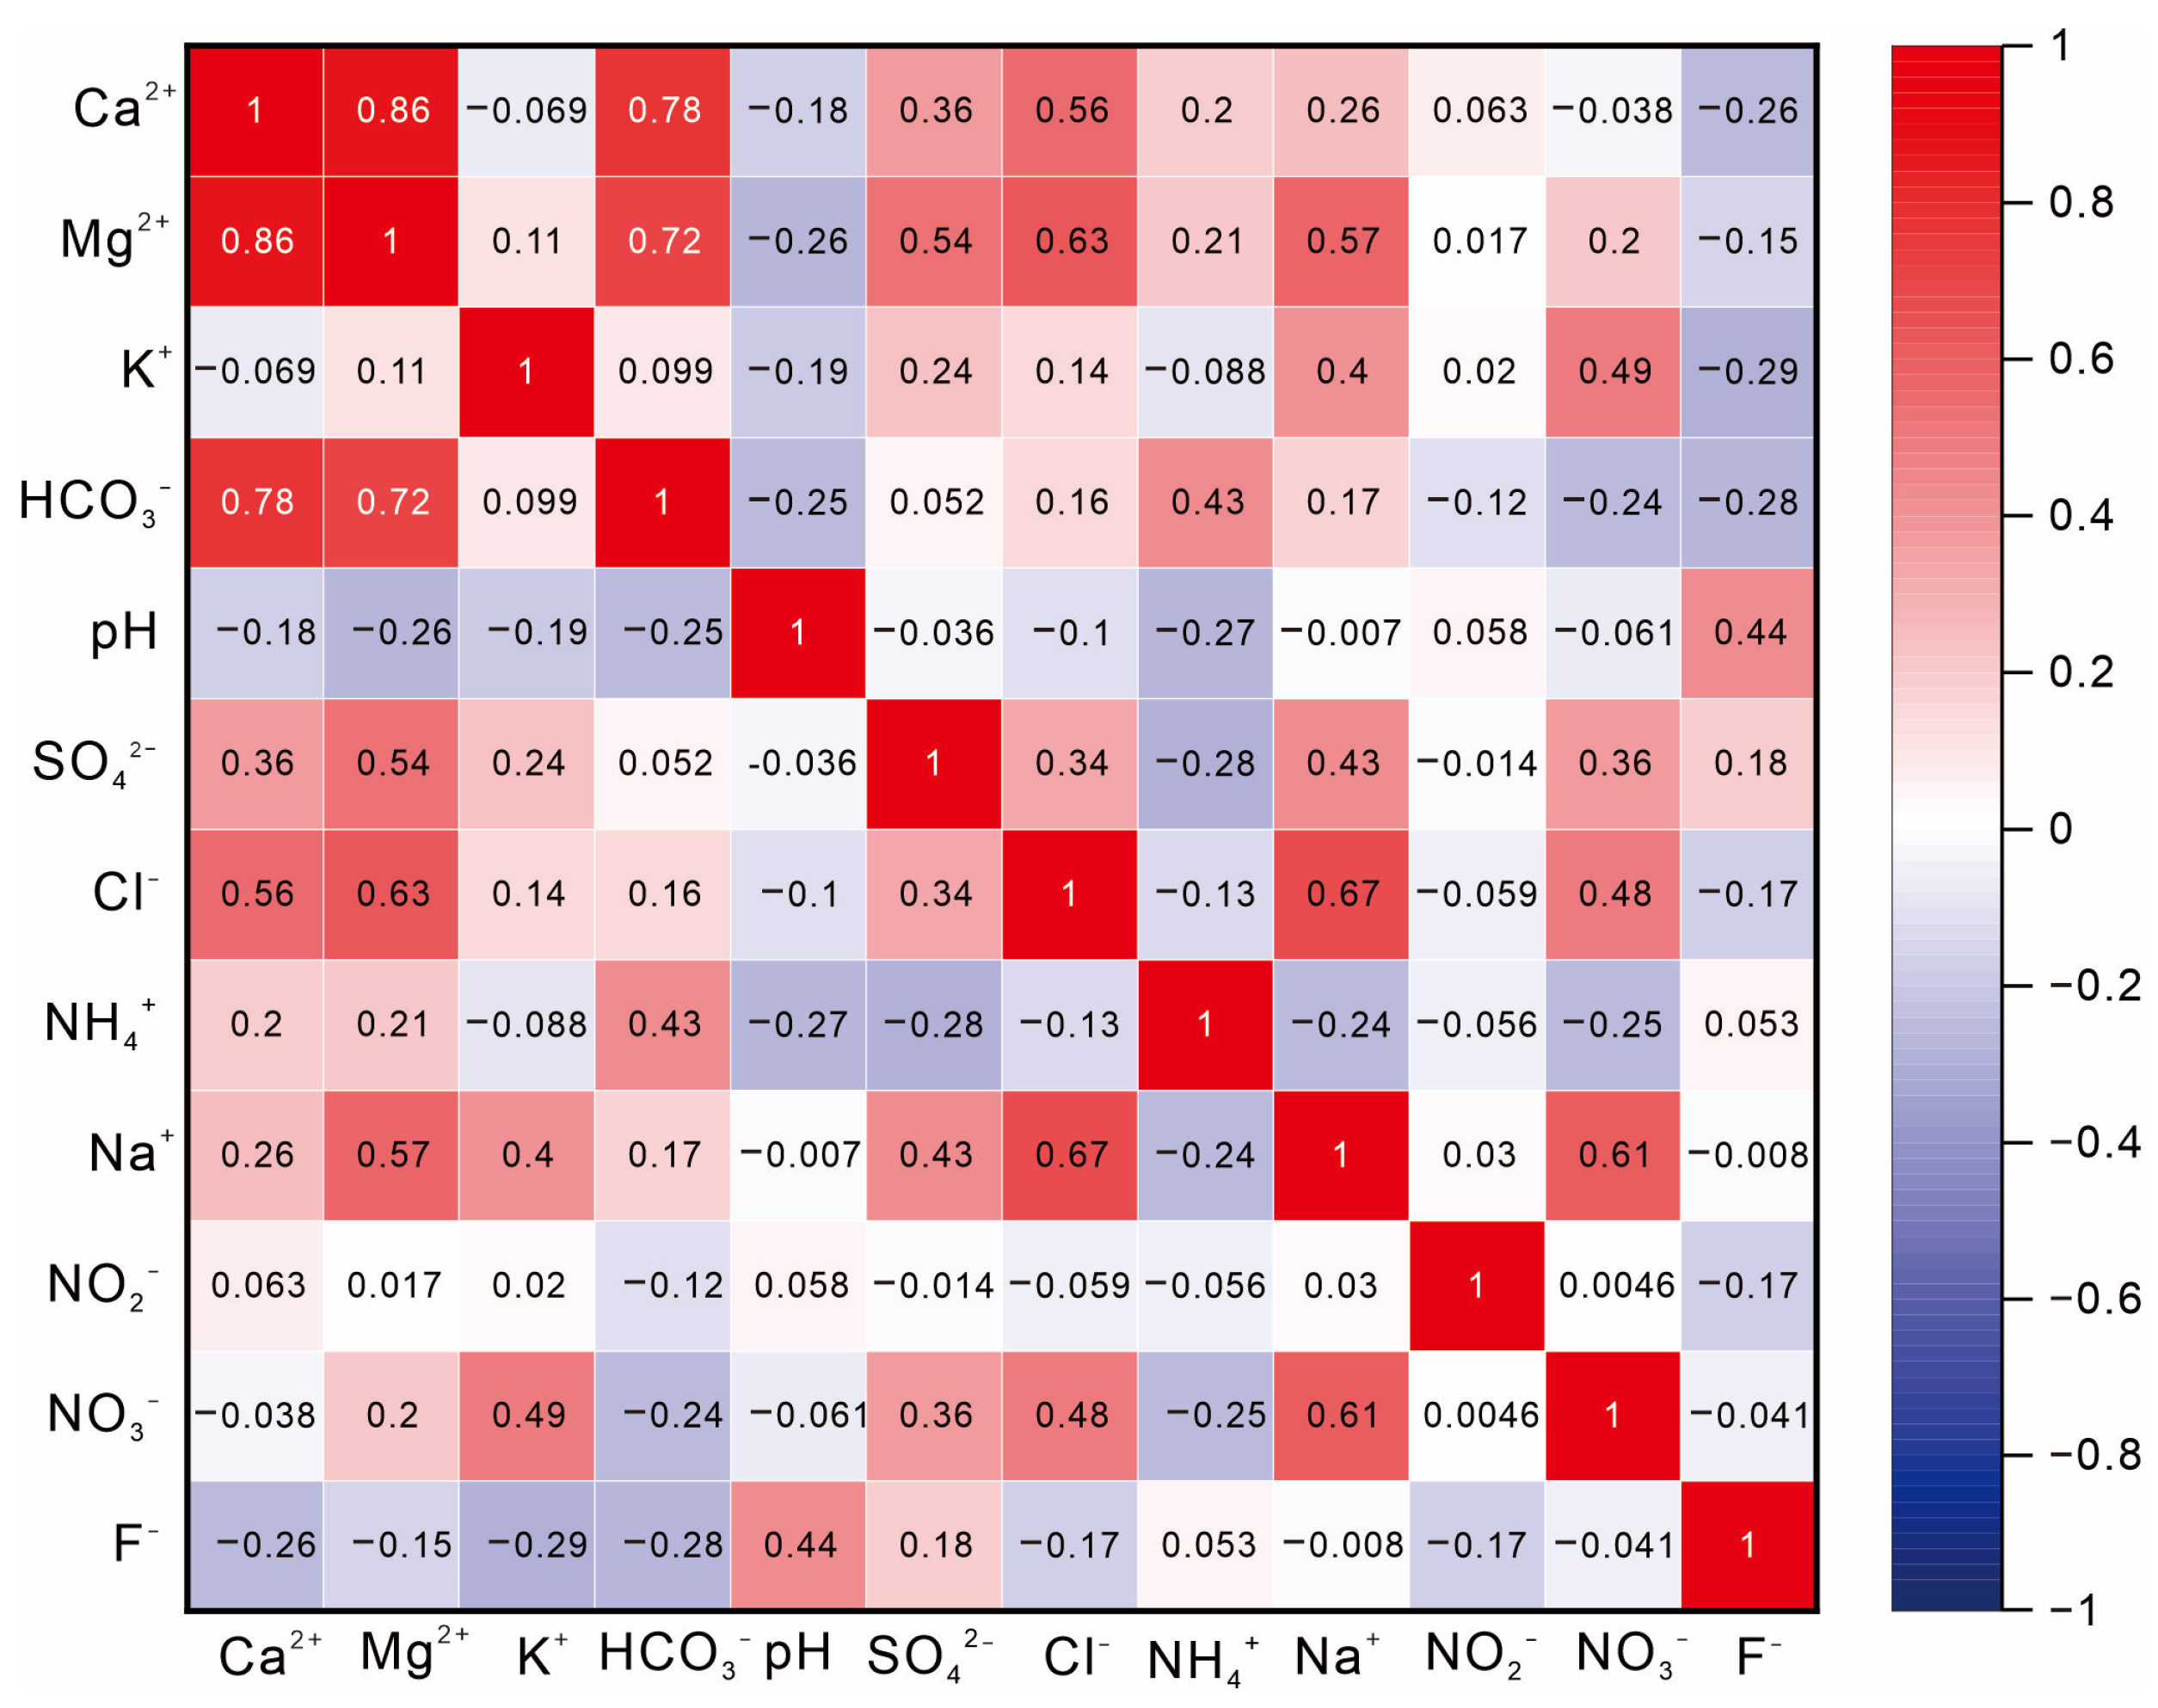
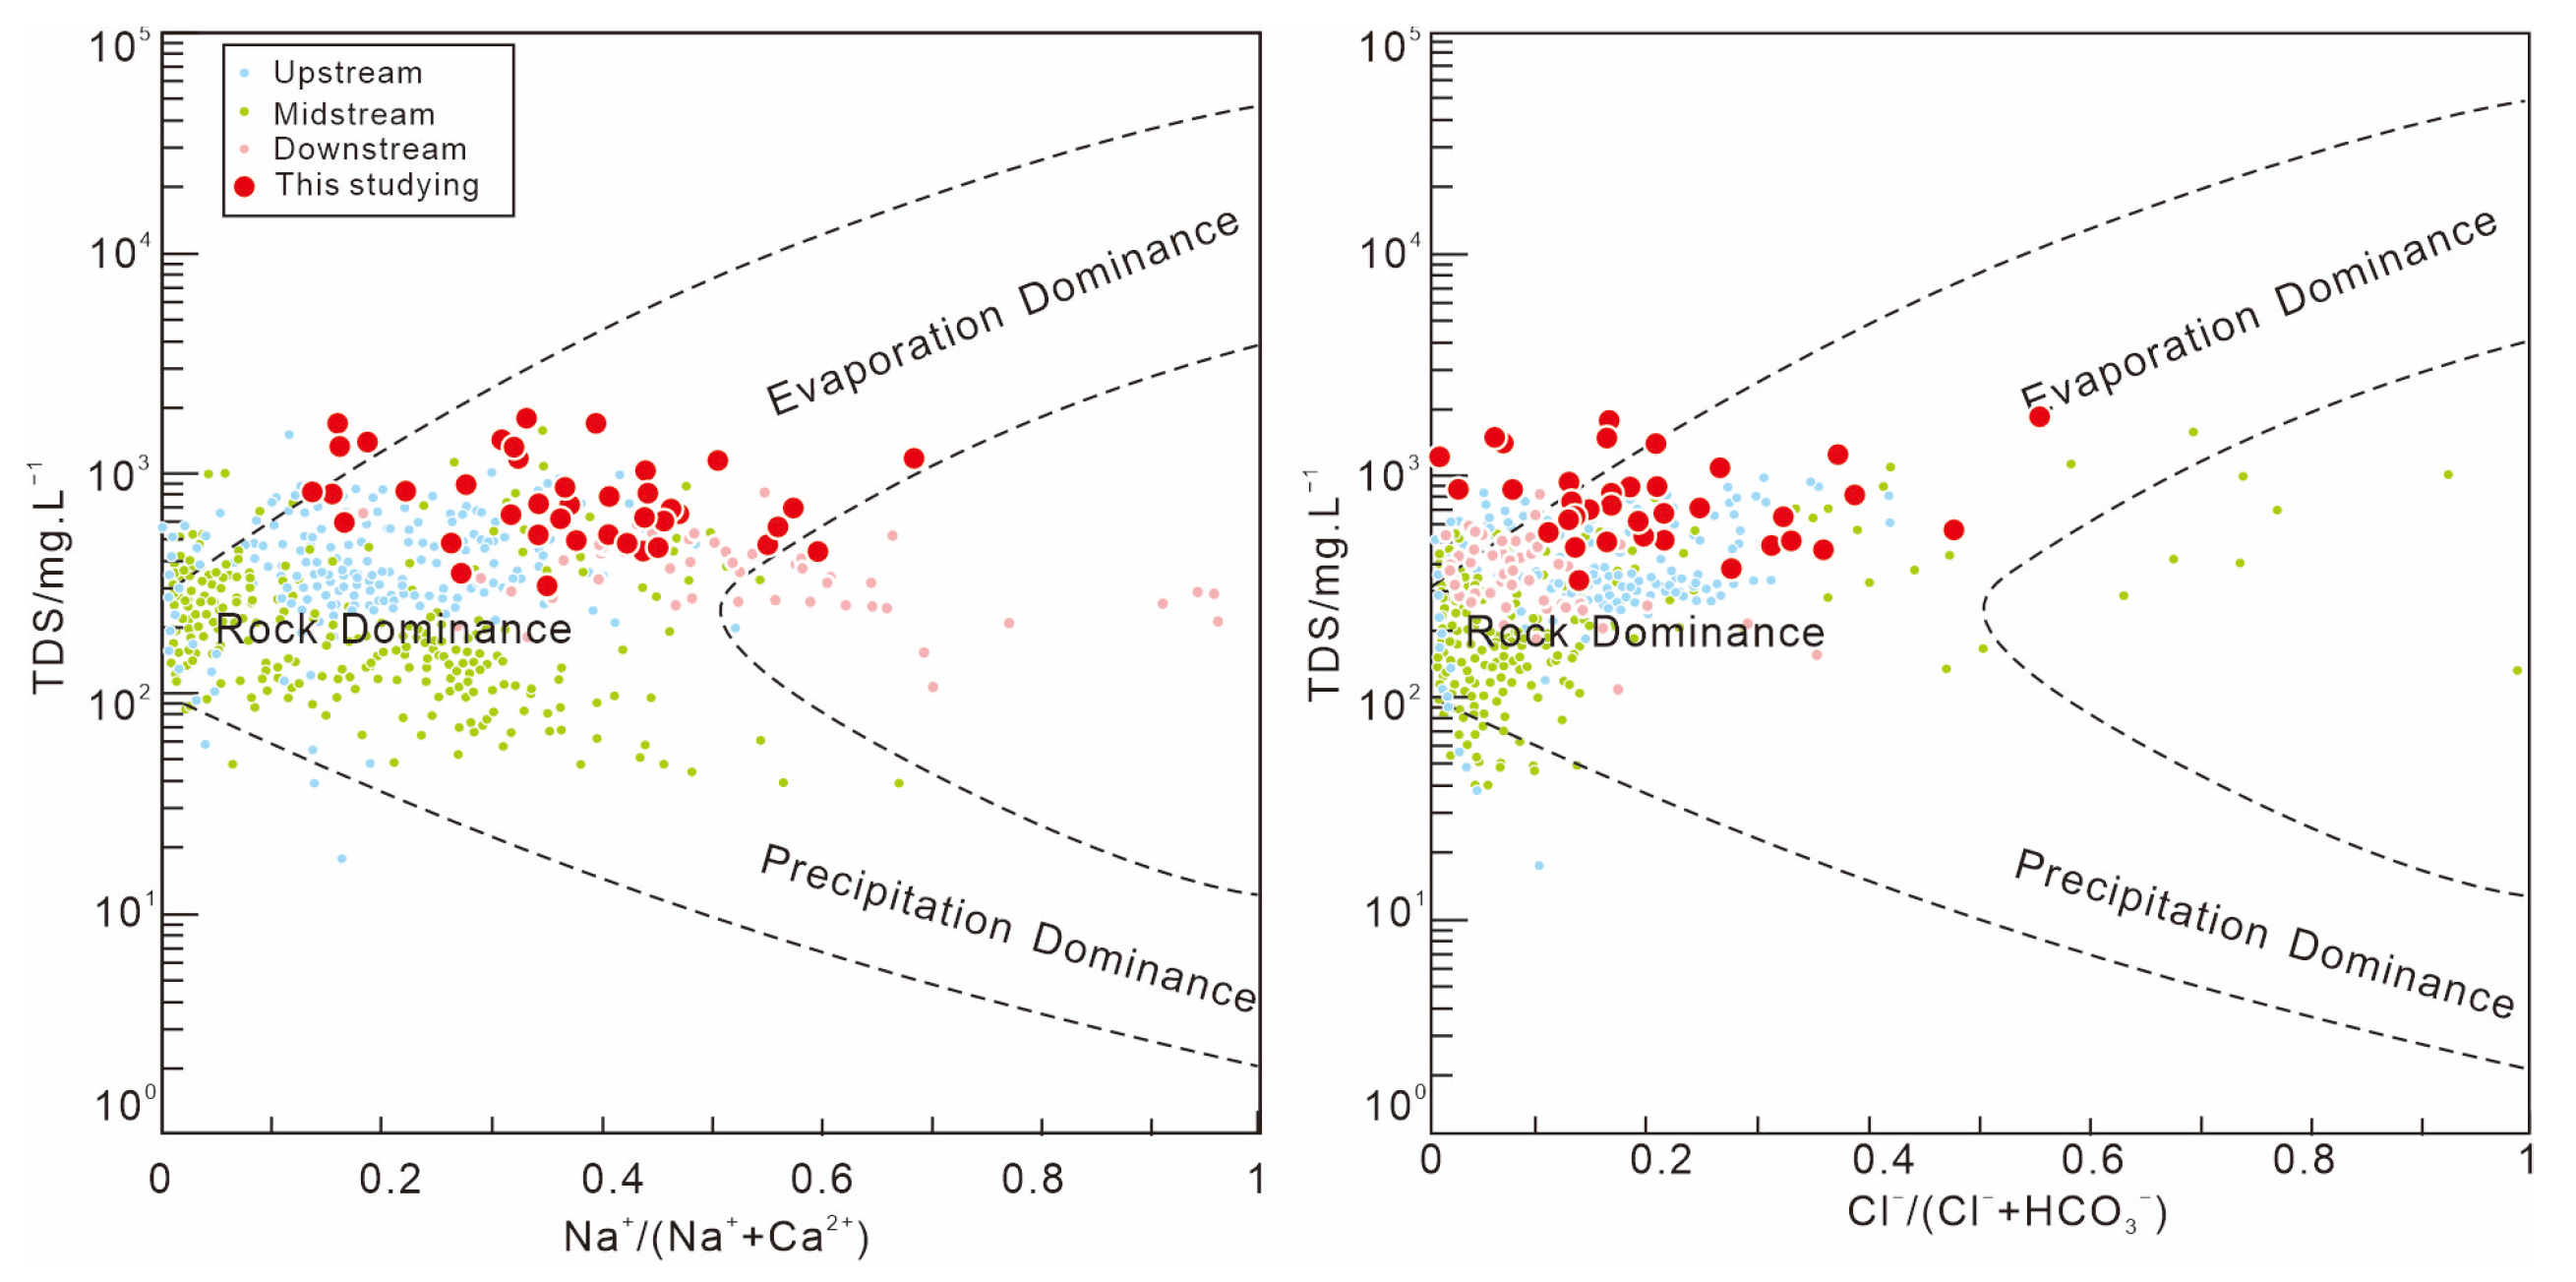
4.1. Characteristics and Control Factors of Groundwater Chemistry
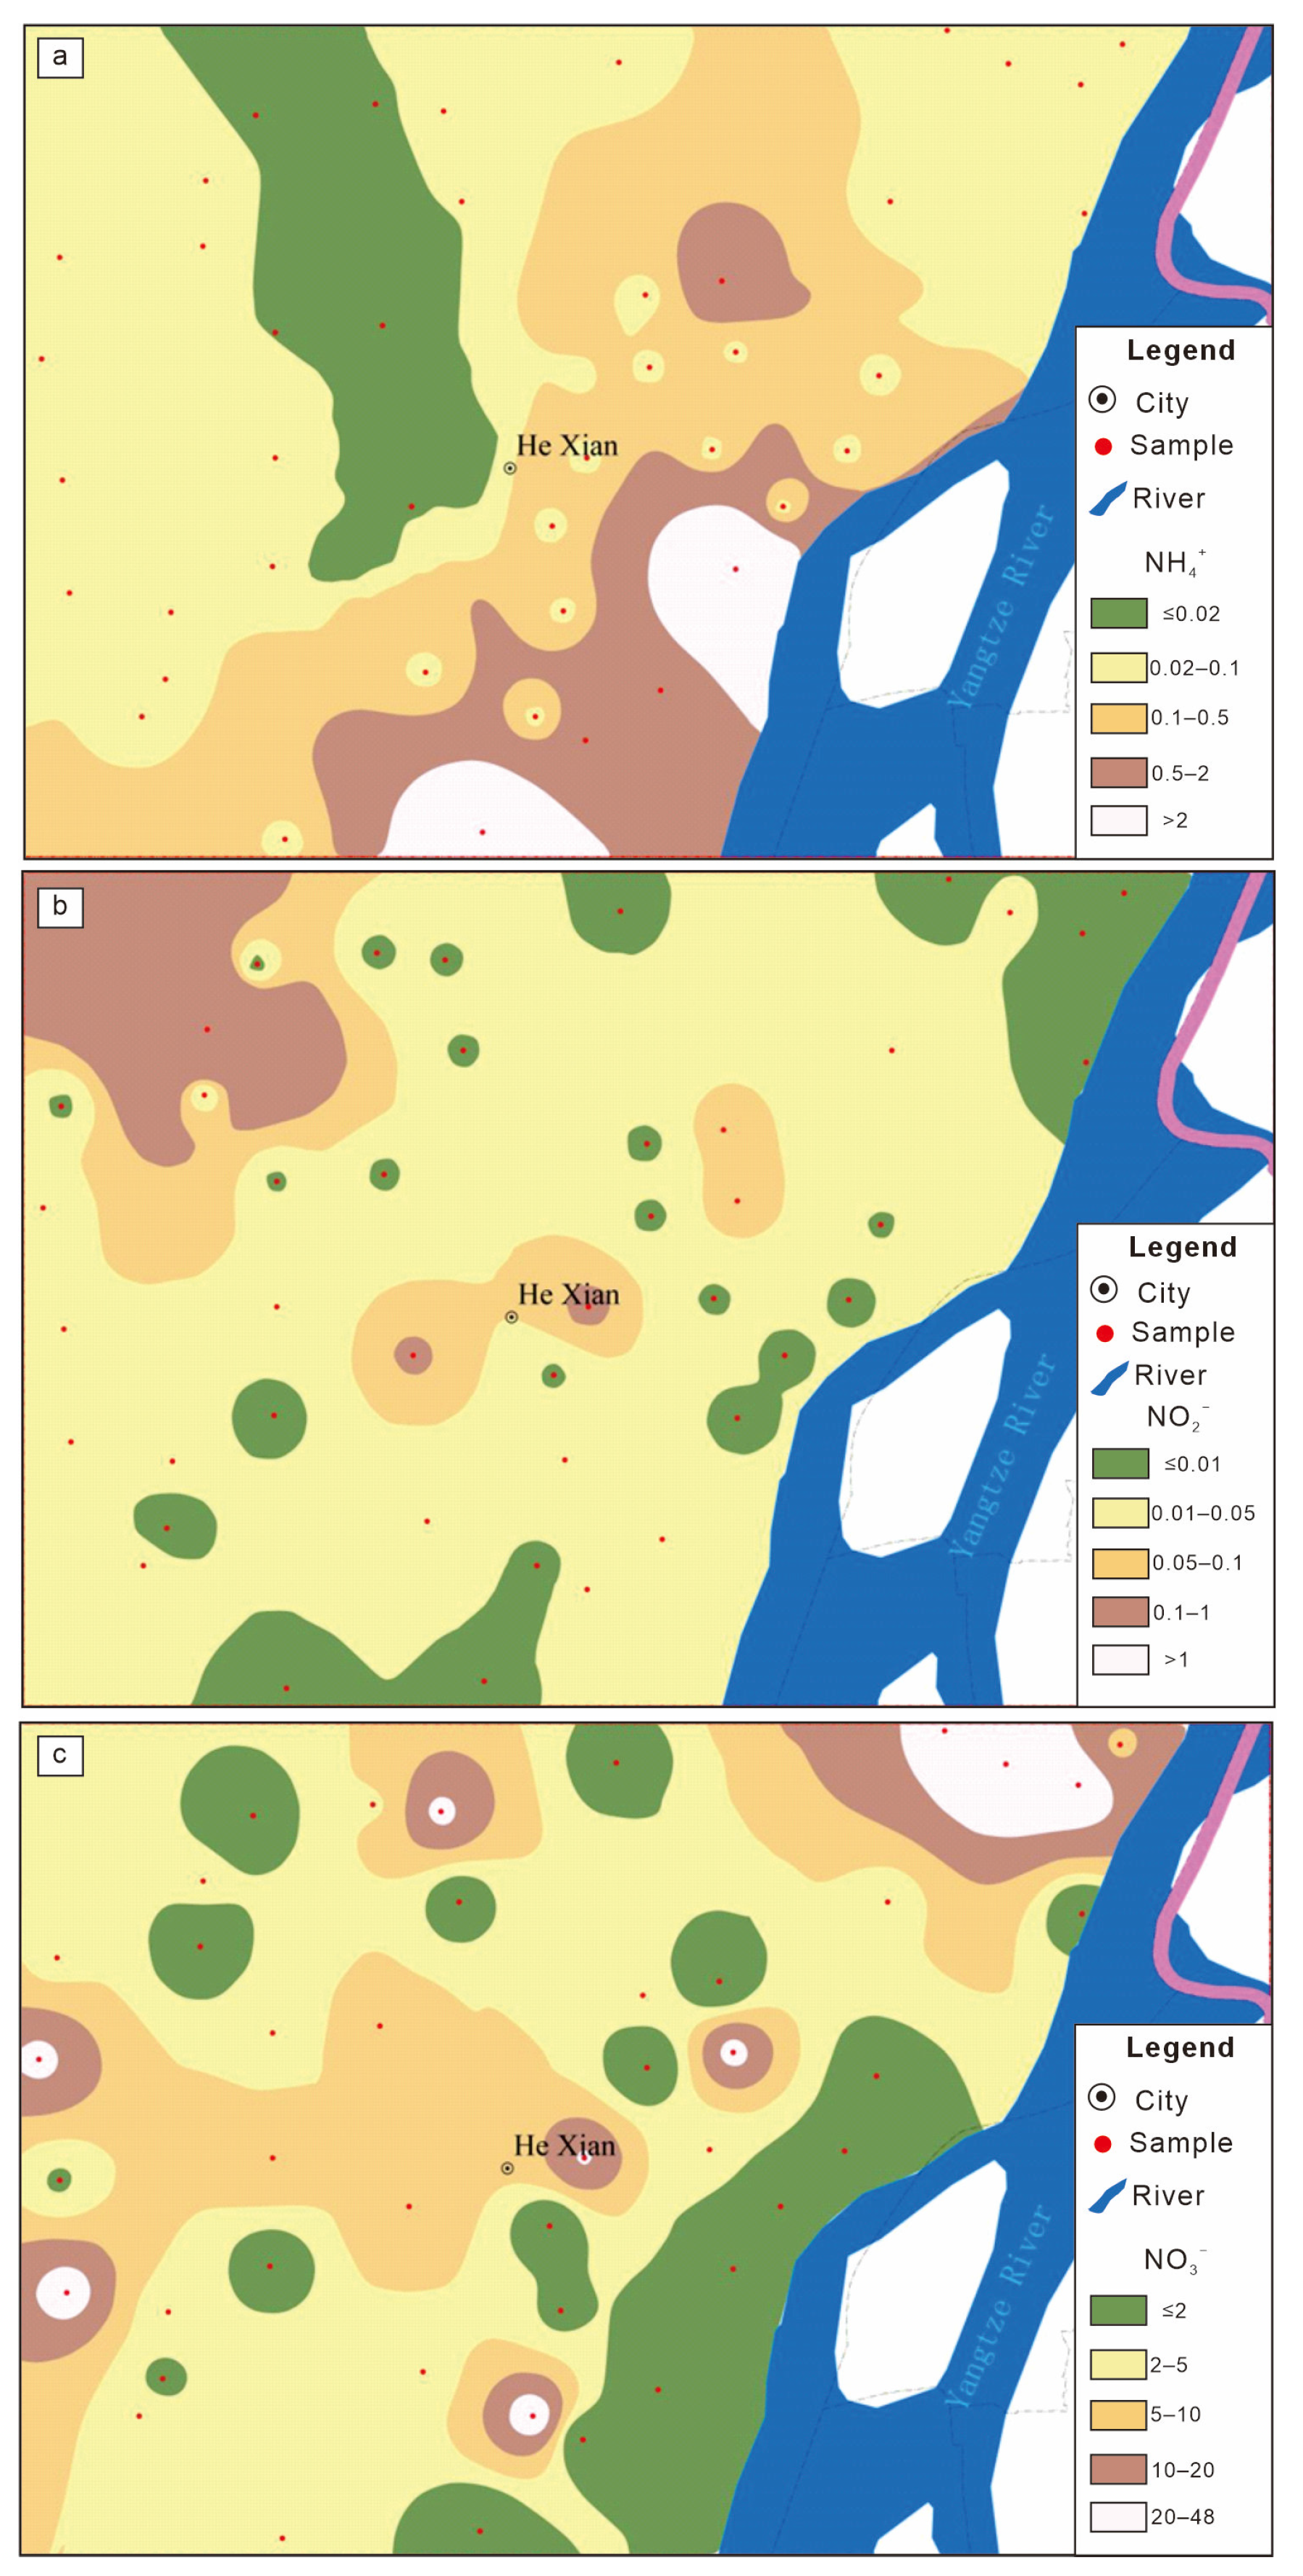
4.2. Distribution Characteristics of Nitrogen in Groundwater
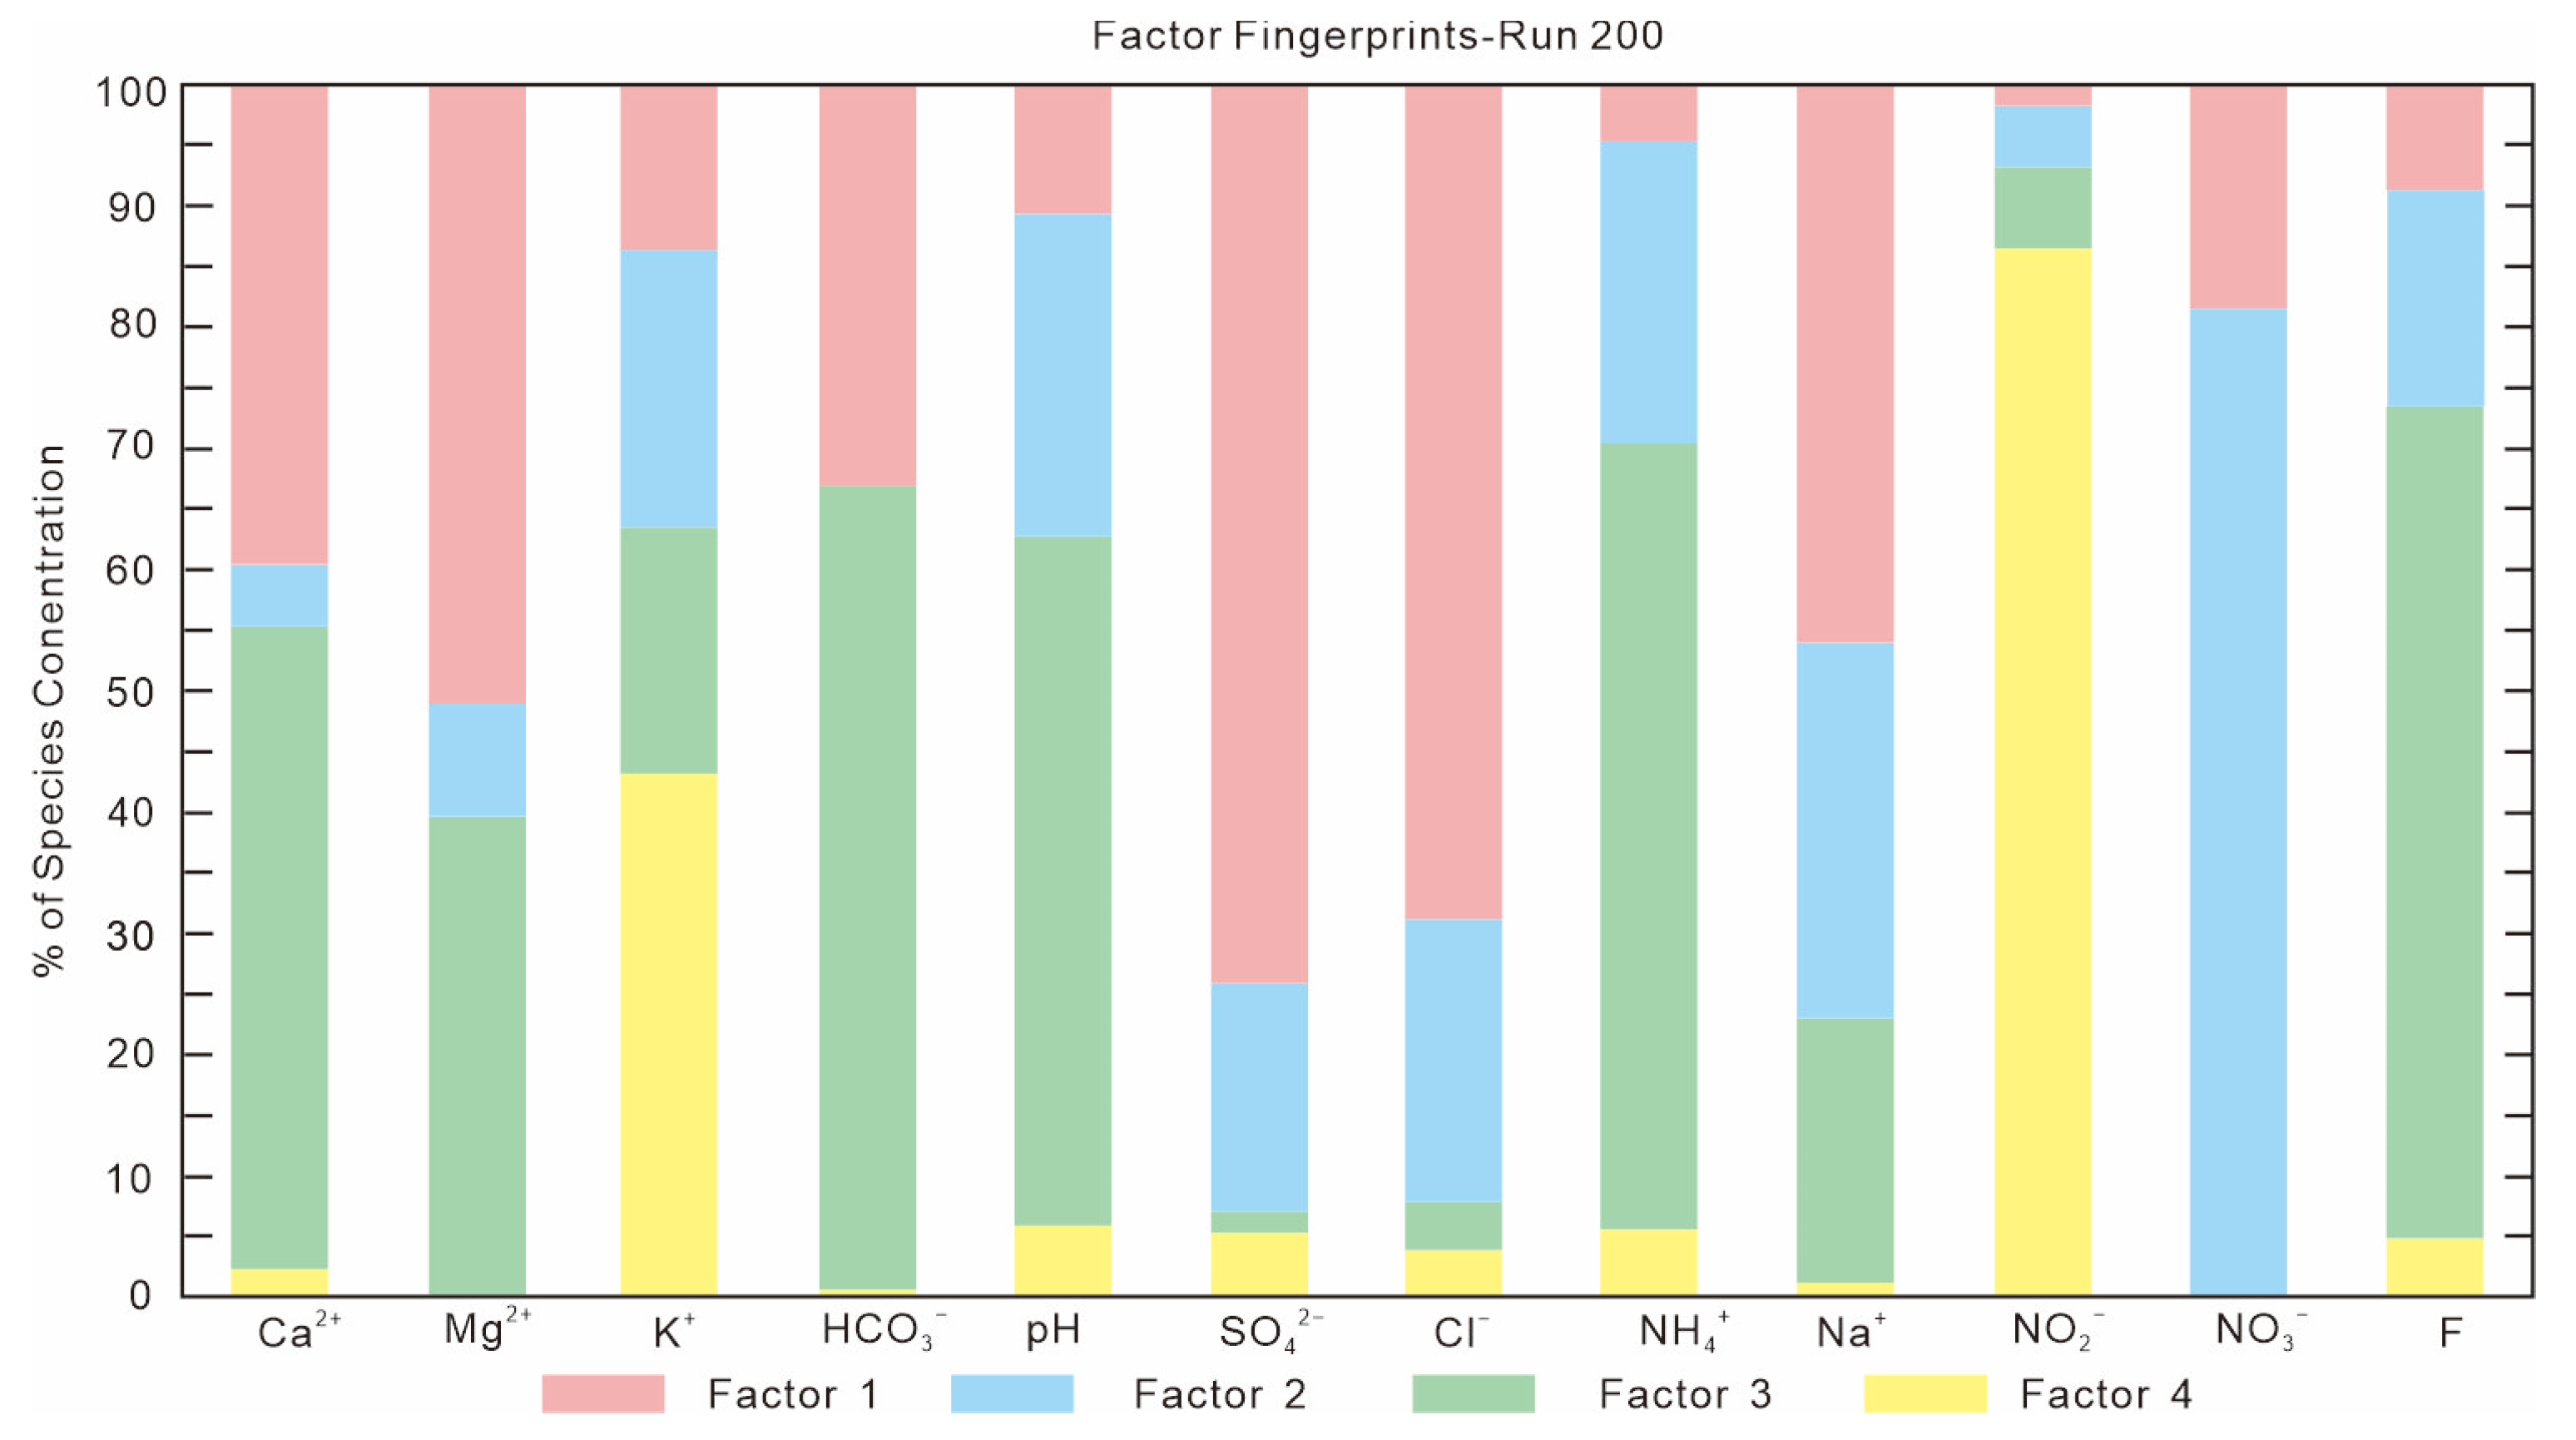
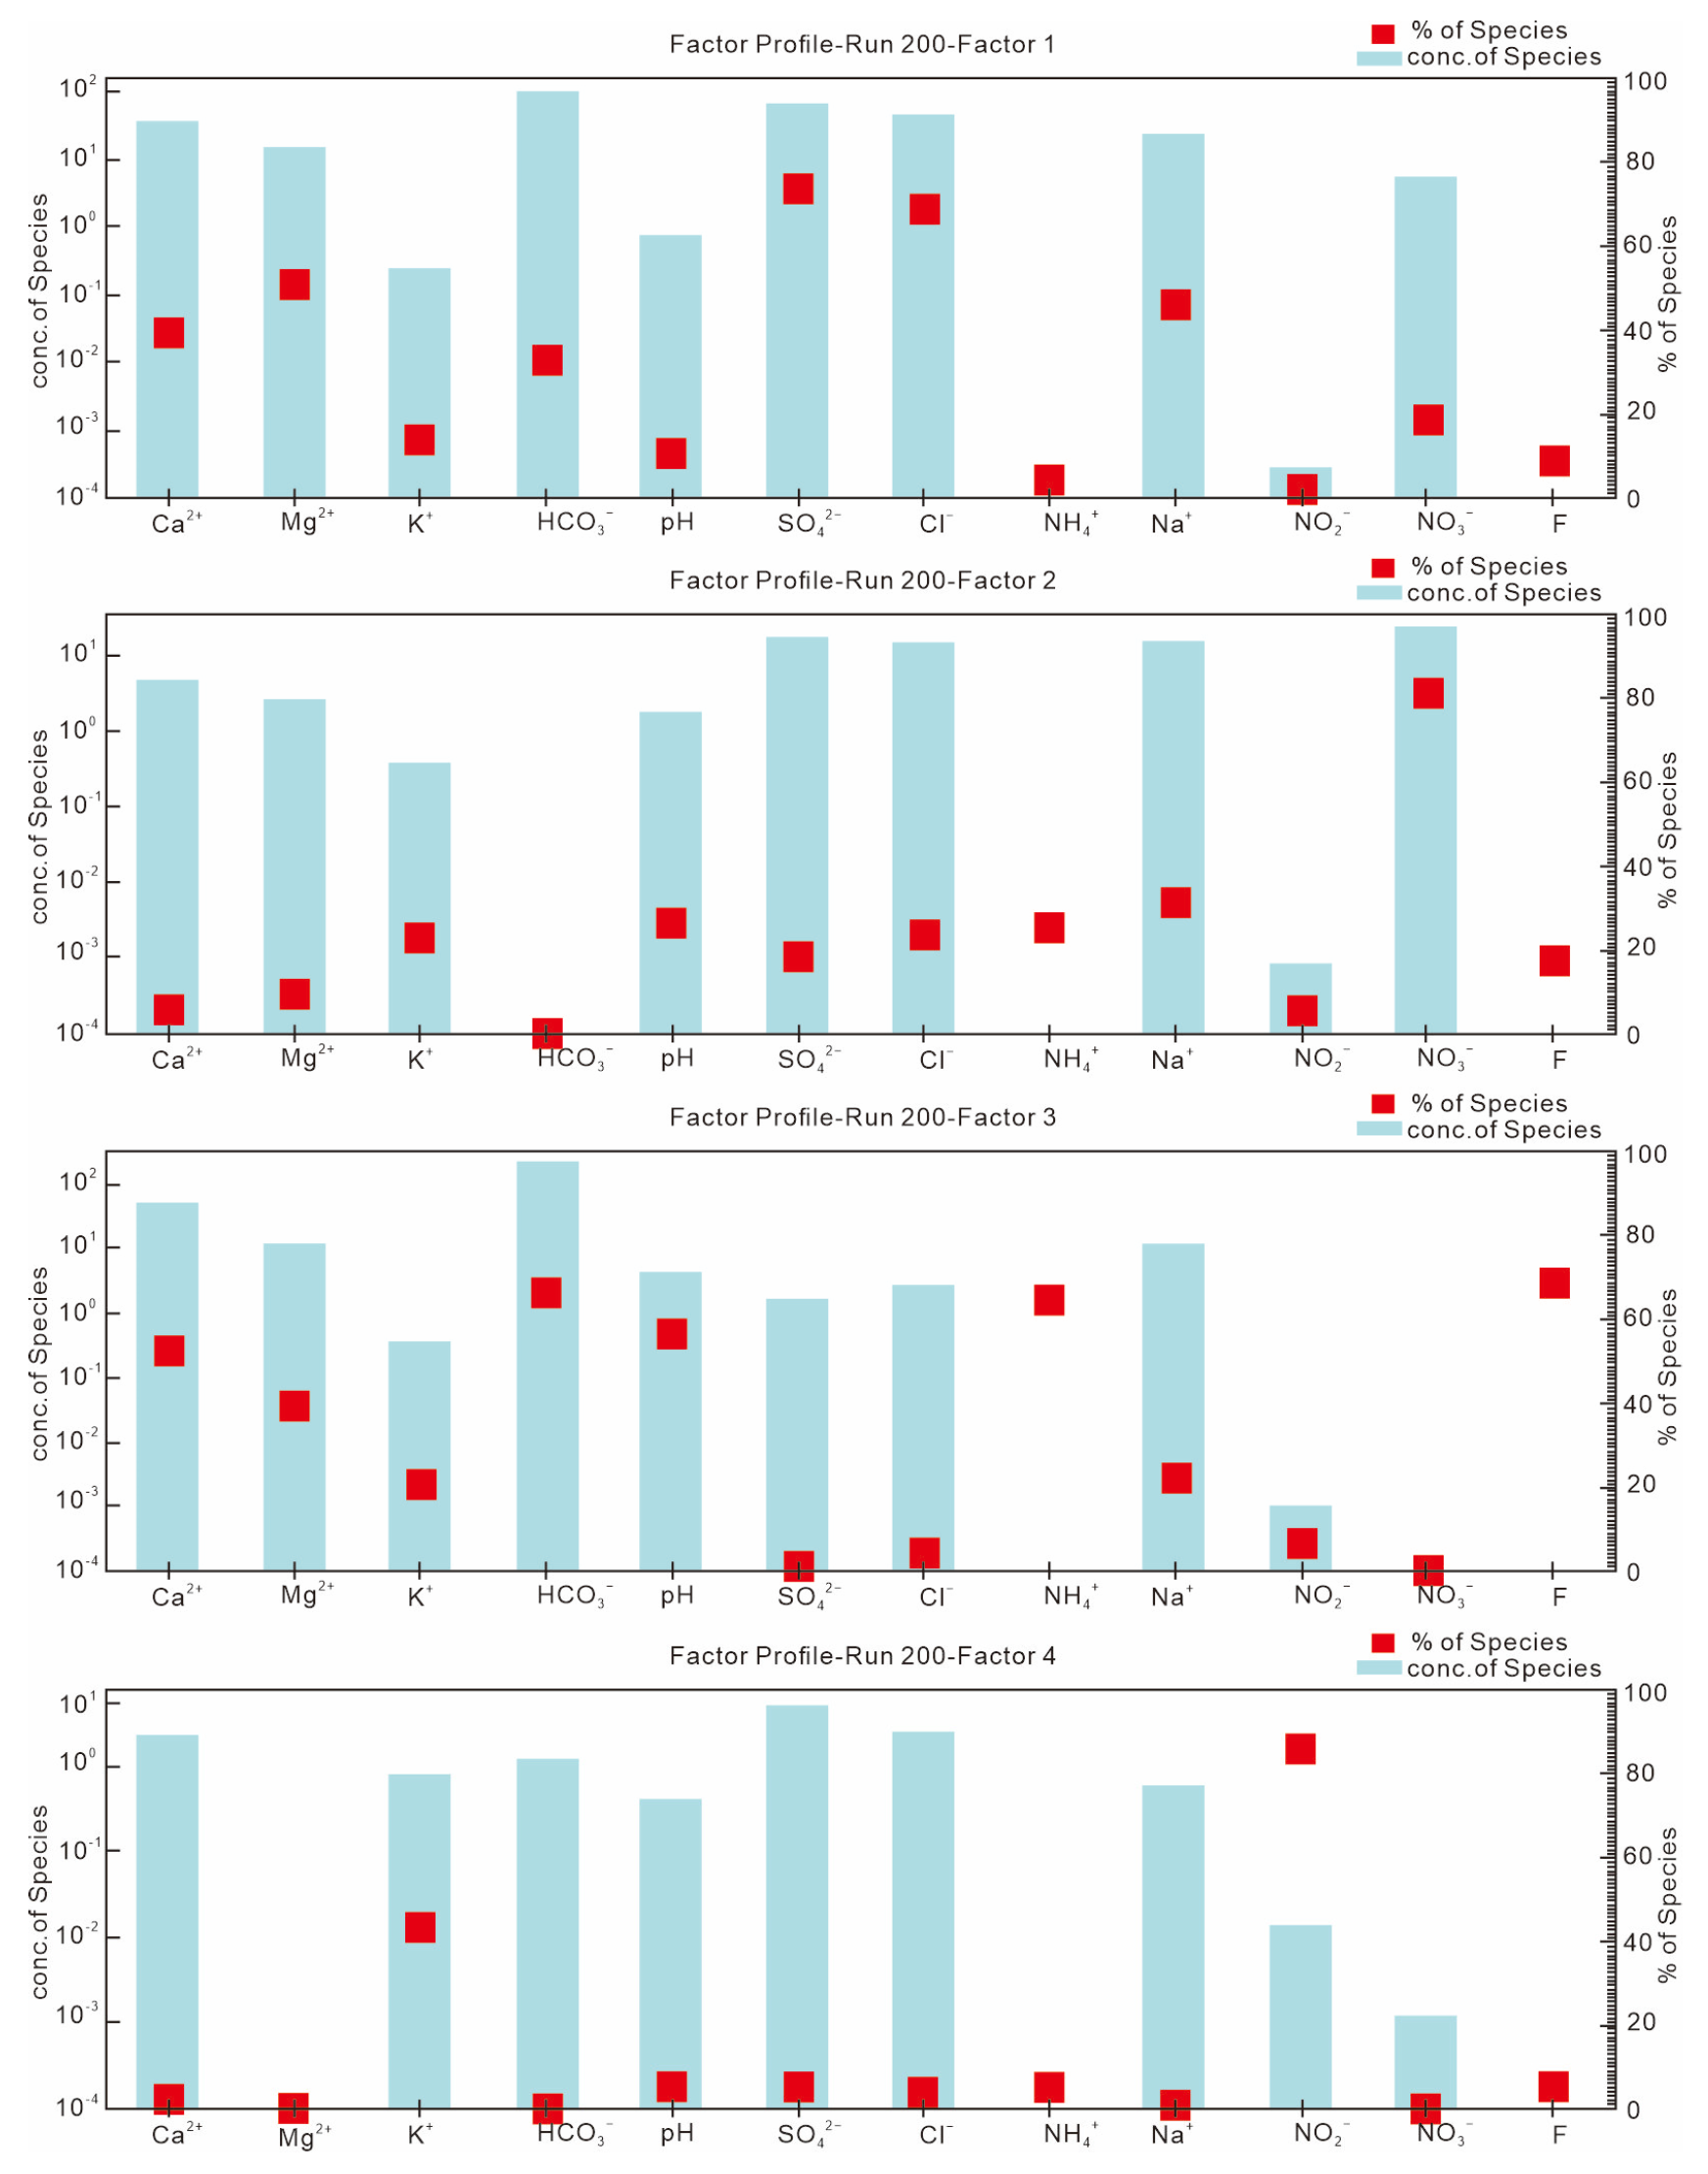
4.3. Source of Nitrogen in Groundwater
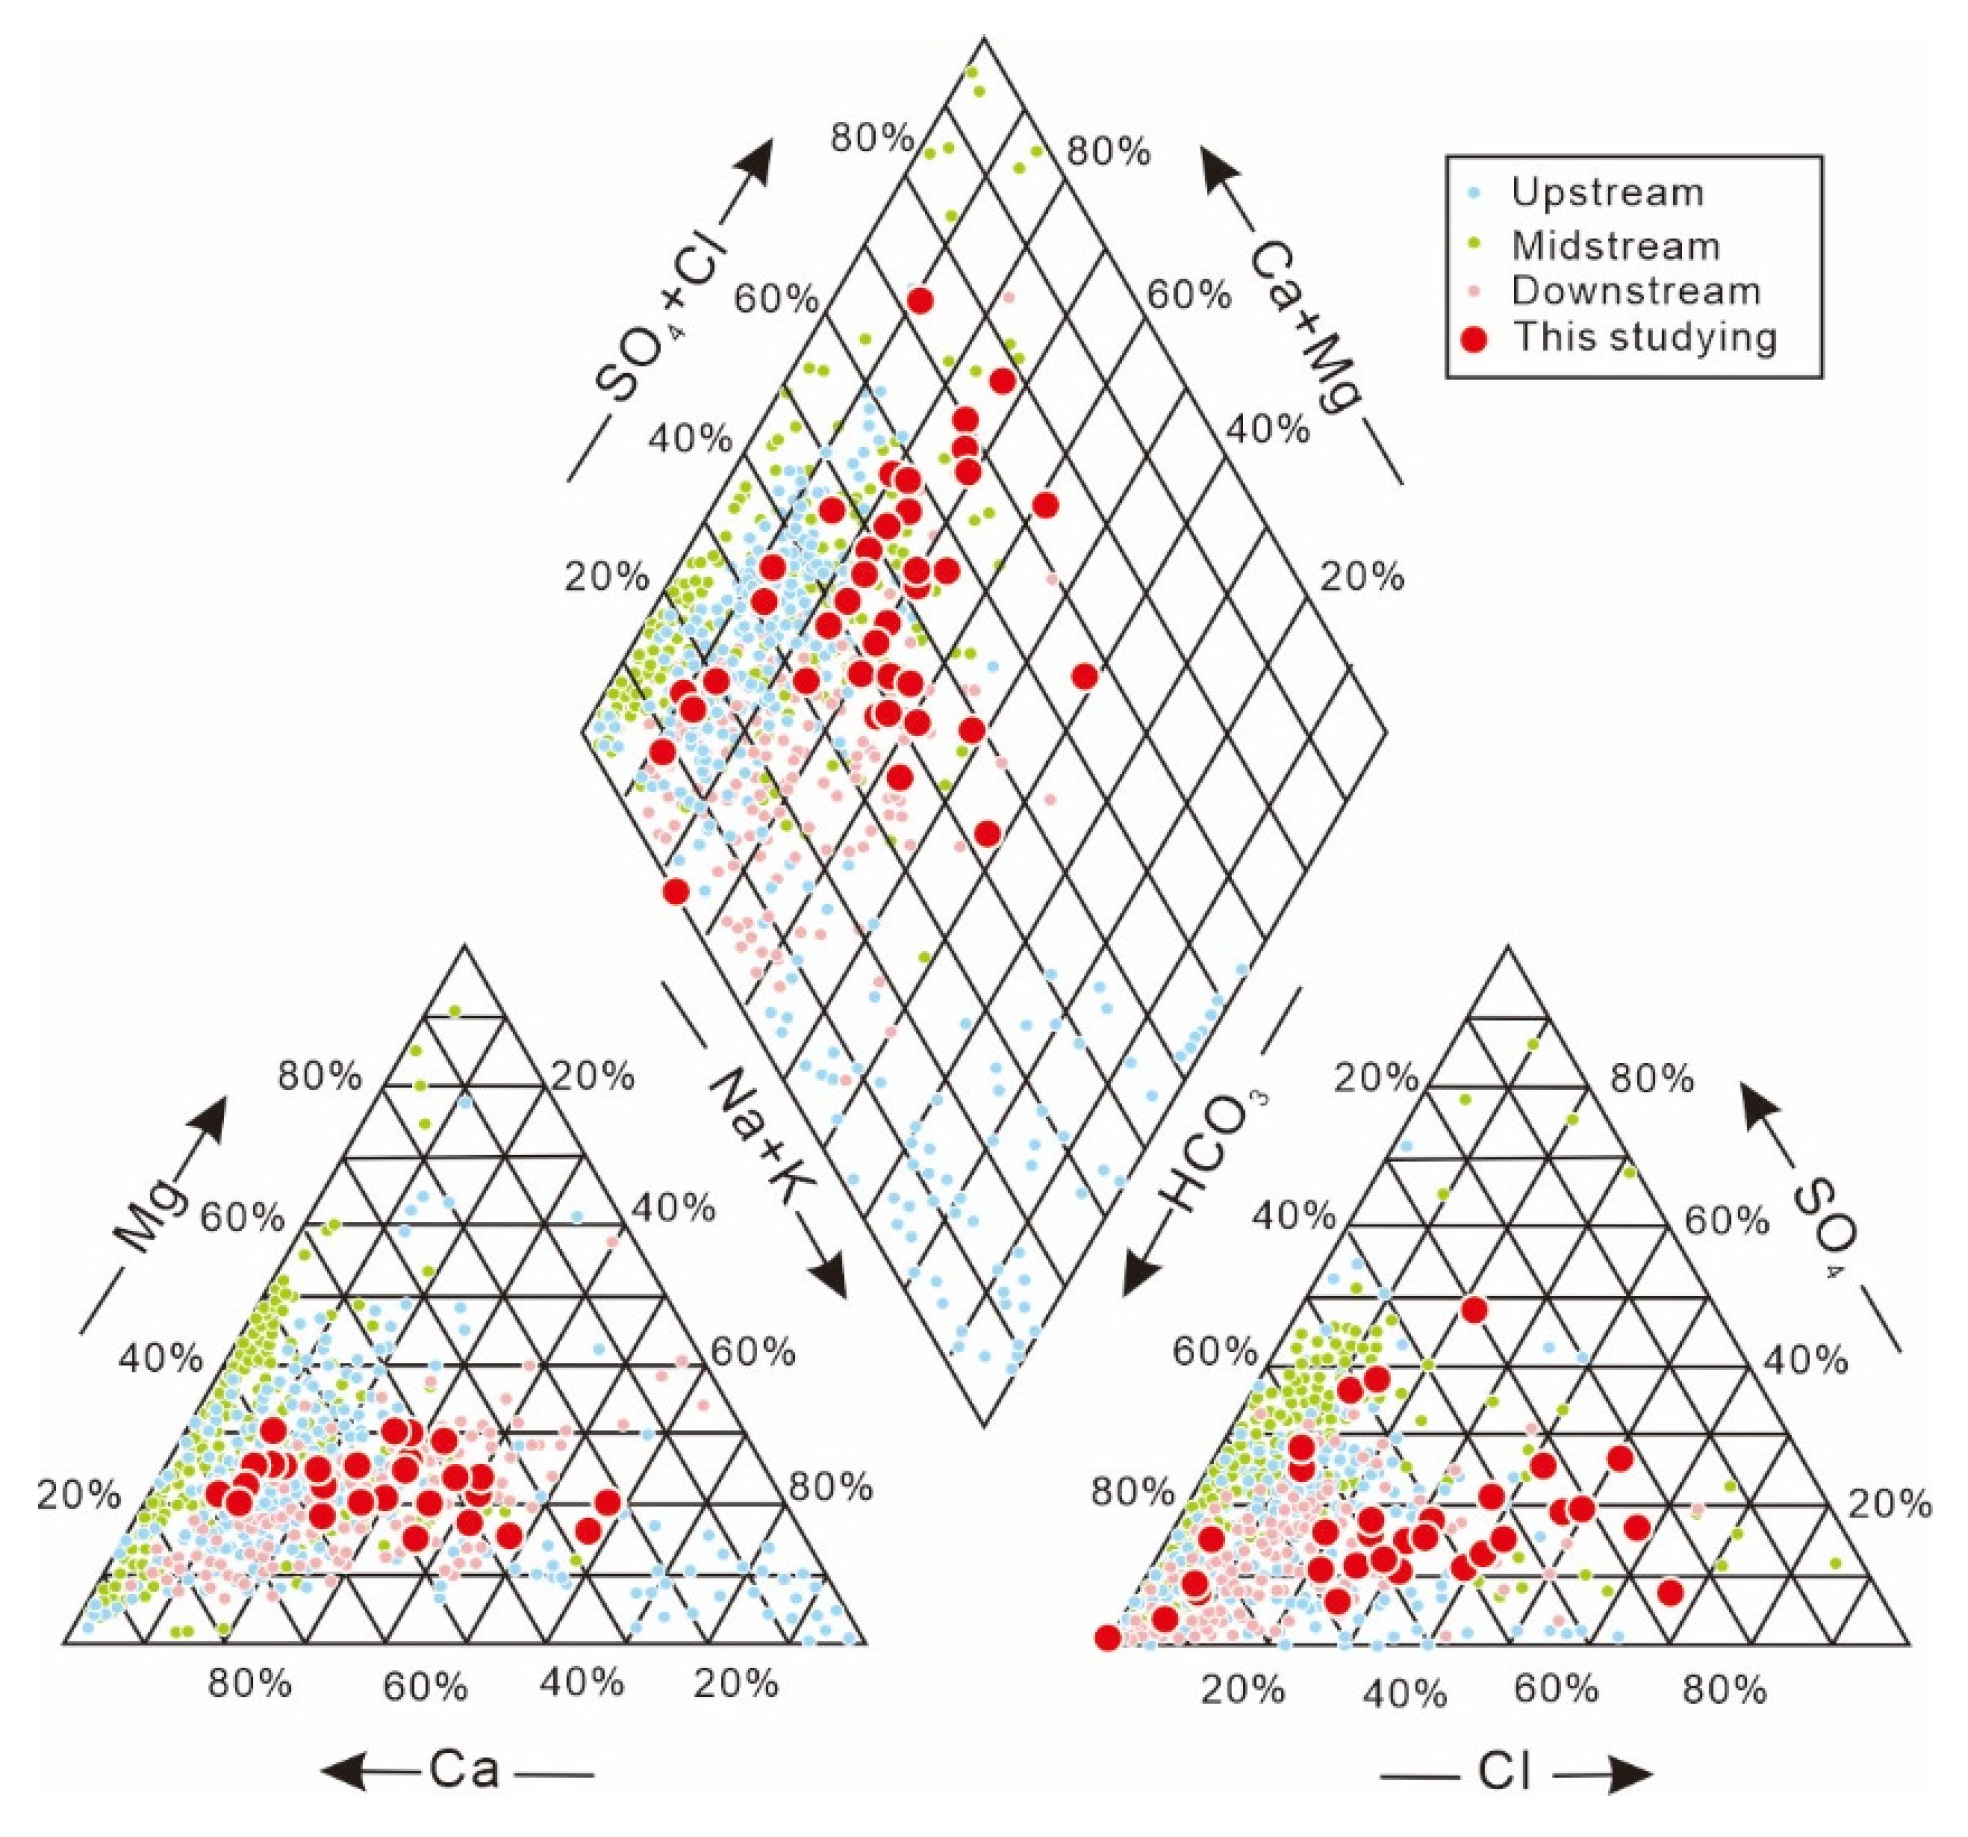
4.4. Hydrochemical Characterization of theYangtze River Basin
5. Conclusions
Supplementary Materials
Author Contributions
Funding
Data Availability Statement
Acknowledgments
Conflicts of Interest
References
- Gleeson, T.; Wada, Y.; Bierkens, M.F.P.; van Beek, L.P.H. Water balance of global aquifers revealed by groundwater footprint. Nature 2012, 488, 197–200. [Google Scholar] [CrossRef] [PubMed]
- Luo, W.T.; Gao, X.B.; Zhang, X. Geochemical processes controlling the groundwater chemistry and fluoride contamination in the Yuncheng Basin, China—An area with complex hydrogeochemical conditions. PLoS ONE 2018, 13, e0199082. [Google Scholar] [CrossRef] [PubMed]
- Michael, I.; Rizzo, L.; McArdell, C.S.; Manaia, C.M.; Merlin, C.; Schwartz, T.; Dagot, C.; Fatta-Kassinos, D. Urban wastewater treatment plants as hotspots for the release of antibiotics in the environment: A review. Water Res. 2013, 47, 957–995. [Google Scholar] [CrossRef] [PubMed]
- Xue, D.M.; Botte, J.; Baets, B.D. Present limitations and future prospects of stable isotope methods for nitrate source identification in surface- and groundwater. Water Res. 2009, 43, 1159–1170. [Google Scholar] [CrossRef]
- Liu, J.W.; Qiao, S.; Zhao, S.L.; Chen, H.; Wu, Y.; Li, D.H.; Liu, P.; Li, L. Quantifying the sources and health risks of groundwater nitrate via dual N-O isotopes and Monte Carlo sim-ulations in a developed planting-breeding area. Ecotoxicol. Environ. Saf. 2025, 290, 117778. [Google Scholar] [CrossRef]
- Kumar, R.; Raza, M.B.; Lenka, S.; Borah, S.; Yadav, A.K.; Yadav, D.K.; Jena, R.K.; Sarkar, D.J.; Singh, D.; Lenka, N.K.; et al. Chemometric Assessment of Anthropogenically Impacted Ancient Artificial Wetland, Bhojtal, India, for its Drinking Water Suitability and Hydrogeochemical Classification. Water Air Soil Pollut. 2025, 236, 139. [Google Scholar] [CrossRef]
- Cai, P.J.; Cai, G.Q.; Yang, J.S.; Li, X.J.; Lin, J.; Li, S.; Zhao, L. Distribution, risk assessment, and quantitative source apportionment of heavy metals in surface sediments from the shelf of the northern South China Sea. Mar. Pollut. Bull. 2023, 187, 114589. [Google Scholar] [CrossRef]
- Ding, H.Z.; Liu, J.W.; Liu, Q.; Guo, L.P.; Hang, Q.Y.; Zhang, Y.; Jia, J.R.; Tao, T.T.; Liu, Q.; Ding, C. Risk assessment and source tracing of heavy metals in major rice-producing provinces of Yangtze River Basin. J. Hazard. Mater. 2024, 480, 136206. [Google Scholar] [CrossRef]
- Chai, L.F.; Wei, L.; Cai, P.J.; Kang, J.; Zhang, Z. Risk assessment of land subsidence based on GIS in the Yongqiao area, Suzhou City, China. Sci. Rep. 2024, 14, 11377. [Google Scholar] [CrossRef]
- Zhang, X.; Ji, D.M.; Zhang, Y.; Ge, L.R.; Xu, S.W.; Peng, Y.Z.; Chen, X.Y.; Ni, J.P.; Wang, G.S.; Ma, Y.B.; et al. Effects of environmental temperature extremes exposure on sperm quality—Evidence from a prospective cohort study in Anhui Province, China. Environ. Res. 2024, 258, 119462. [Google Scholar] [CrossRef]
- Hu, M.Y.; Zhou, P.J.; Chen, C.Q. Hydro-geochemical evolution of groundwater in the central Yangtze River Basin, China. Carbonates Evaporites 2023, 38, 28. [Google Scholar] [CrossRef]
- Xiong, Y.J.; Du, Y.; Deng, Y.M.; Ma, T.; Li, D.; Sun, X.L.; Liu, G.N.; Wang, Y.X. Contrasting sources and fate of nitrogen compounds in different groundwater systems in the Central Yangtze River Basin. Environ. Pollut. 2021, 290, 118119. [Google Scholar] [CrossRef] [PubMed]
- Zhang, Q.Y.; Xu, P.P.; Qian, H. Groundwater Quality Assessment Using Improved Water Quality Index (WQI) and Human Health Risk (HHR) Evaluation in a Semi-arid Region of Northwest China. Expo. Health 2020, 12, 487–500. [Google Scholar] [CrossRef]
- Qian, J.Z.; Wang, X.X.; Ma, L.; Wang, L.P.; Liu, J.K.; Yang, Z.X. Simulation of denitrification in groundwater from Chaohu Lake Catchment, China. Water Sci. Eng. 2018, 11, 114–119. [Google Scholar] [CrossRef]
- Norris, G.; Duvall, R.; Brown, S.; Bai, S. EPA Positive Matrix Factorization (PMF) 5.0 Fundamentals and User Guide; U.S. Environmental Protection Agency: Washington, DC, USA, 2014. [Google Scholar]
- Liao, H.W.; Jiang, Z.C.; Zhou, H.; Qin, X.Q.; Huang, Q. Isotope-Based Study on Nitrate Sources in a Karst Wetland Water, Southwest China. Water 2022, 14, 1533. [Google Scholar] [CrossRef]
- Gaagai, A.; Aouissi, H.A.; Bencedira, S.; Hinge, G.; Athamena, A.; Heddam, S.; Gad, M.; Elsherbiny, O.; Elsayed, S.; Eid, M.H.; et al. Application of Water Quality Indices, Machine Learning Approaches, and GIS to Identify Groundwater Quality for Irrigation Purposes: A Case Study of Sahara Aquifer, Doucen Plain, Algeria. Water 2023, 15, 289. [Google Scholar] [CrossRef]
- Iqbal, J.; Su, C.L.; Rashid, A.; Yang, N.; Baloch, M.Y.J.; Talpur, S.A.; Ullah, Z.; Rahman, G.; Rahman, N.U.; Earjh. Hydrogeochemical Assessment of Groundwater and Suitability Analysis for Domestic and Agricultural Utility in Southern Punjab, Pakistan. Water 2021, 13, 3589. [Google Scholar] [CrossRef]
- Vasanthavigar, M.; Srinivasamoorthy, K.; Vijayaragavan, K.; Ganthi, R.R.; Chidambaram, S.; Anandhan, P.; Manivannan, R.; Vasudevan, S. Application of water quality index for groundwater quality assessment: Thirumanimuttar sub-basin, Tamilnadu, India. Environ. Monit. Assess. 2010, 171, 595–609. [Google Scholar] [CrossRef]
- Cui, R.Y.; Zhang, D.; Hu, W.L.; Zhao, X.M.; Yan, H.; Liu, G.C.; Chen, A.Q. Nitrogen in soil, manure and sewage has become a major challenge in controlling nitrate pollution in groundwater around plateau lakes, Southwest China. J. Hydrol. 2023, 620, 129541. [Google Scholar] [CrossRef]
- Guan, Q.Y.; Wang, F.F.; Xu, C.Q.; Pan, N.H.; Lin, J.K.; Zhao, R.; Yang, Y.Y.; Luo, H.P. Source apportionment of heavy metals in agricultural soil based on PMF: A case study in Hexi Corridor, northwest China. Chemosphere 2018, 193, 189–197. [Google Scholar] [CrossRef]
- Li, T.; Sun, G.H.; Yang, C.P.; Liang, K.; Ma, S.Z.; Huang, L.; Luo, W.D. Source apportionment and source-to-sink transport of major and trace elements in coastal sediments: Combining positive matrix factorization and sediment trend analysis. Sci. Total Environ. 2019, 651, 344–356. [Google Scholar] [CrossRef] [PubMed]
- Ntanganedzeni, B.; Elumalai, V.; Rajmohan, N. Coastal Aquifer Contamination and Geochemical Processes Evaluation in Tugela Catchment, South AfricaGeochemical and Statistical Approaches. Water 2018, 10, 687. [Google Scholar] [CrossRef]
- Ji, Y.F.; Dong, C.X.; Kong, D.A.; Lu, J.H. New insights into atrazine degradation by cobalt catalyzed peroxymonosulfate oxidation: Kinetics, reaction products and transformation mechanisms. J. Hazard. Mater. 2015, 285, 491–500. [Google Scholar] [CrossRef] [PubMed]
- Gong, X.H.; Zhou, Z.F.; Su, D.; Dong, H.; Yan, L.H.; Ding, S.J.; Wang, X.D.; Zhang, Y. Sulfur-oxygen isotope analysis of SO42− sources in cave dripwater and their influence on the karst carbon cycle. Environ. Res. 2024, 240, 117508. [Google Scholar] [CrossRef]
- Ju, X.T.; Kou, C.L.; Zhang, F.S.; Christie, P. Nitrogen balance and groundwater nitrate contamination: Comparison among three intensive cropping systems on the North China Plain. Environ. Pollut. 2006, 143, 117–125. [Google Scholar] [CrossRef]
- Subramani, T.; Elango, L.; Damodarasamy, S. Groundwater quality and its suitability for drinking and agricultural use in Chithar River Basin, Tamil Nadu, India. Environ. Geol. 2005, 47, 1099–1110. [Google Scholar] [CrossRef]
- Shan, Q.; Tian, X.Z.; Xie, H.; Gong, Z.Q.; Lin, Y.S.; Dang, Z.W.; Li, J.; Zou, S.Z.; Zhu, T.L. Hydrogeochemical characteristics, driving factors, and health risk assessment of karst groundwater in Southwest Hubei Province, China. Water Environ. Res. 2024, 96, E11069. [Google Scholar] [CrossRef]
- Cai, P.J.; Lian, D.Y.; Aitchison, J.C.; Cluzel, D.; Zhou, R.J.; Rui, H.C.; Bo, R.Z.; Ma, H.T.; Yang, J.S.; Masoud, A.E. Geochemical constraints on subduction-related mantle metasomatism of the Tiébaghi ophiolitic lherzolite in New Caledonia. Lithos 2025, 496–497, 107948. [Google Scholar] [CrossRef]
- Cai, P.J.; Ma, X.H. Metallogenic regularity and main research progress of cobalt and nickel deposits in China. J. Geochem. Explor. 2024, 266, 107574. [Google Scholar] [CrossRef]
- Chen, X.; Jiang, S.Y.; Palmer, M.R.; Schertl, H.P.; Cambeses, A.; Hernández-Uribe, D.; Zhao, K.D.; Lin, C.G.; Zheng, Y.Y. Tourmaline chemistry, boron, and strontium isotope systematics trace multiple melt–fluid–rock interaction stages in deeply subducted continental crust. Geochim. Cosmochim. Acta 2023, 340, 120–140. [Google Scholar] [CrossRef]
- Jiang, Y.J.; Wu, Y.X.; Groves, C.; Yuan, D.X.; Kambesis, P. Natural and anthropogenic factors affecting the groundwater quality in the Nandong karst underground river system in Yunan, China. J. Contam. Hydrol. 2009, 109, 49–61. [Google Scholar] [CrossRef] [PubMed]
- Raj, D.; Shaji, E. Fluoride contamination in groundwater resources of Alleppey, southern India. Geosci. Front. 2016, 8, 117–124. [Google Scholar] [CrossRef]
- Istok, J.D.; Senko, J.M.; Krumholz, L.R.; Watson, D.; Bogle, M.A.; Peacock, A.; Chang, Y.J.; White, D.C. In situ bioreduction of technetium and uranium in a nitrate-contaminated aquifer. Environ. Sci. Technol. 2004, 38, 468–475. [Google Scholar] [CrossRef] [PubMed]
- Wu, J.H.; Sun, Z.C. Evaluation of Shallow Groundwater Contamination and Associated Human Health Risk in an Alluvial Plain Impacted by Agricultural and Industrial Activities, Mid-west China. Expo. Health 2016, 8, 311–329. [Google Scholar] [CrossRef]
- Gupta, A.B.; Gupta, S.K. Simultaneous carbon and nitrogen removal from high strength domestic wastewater in an aerobic RBC biofilm. Water Res. 2001, 35, 1714–1722. [Google Scholar] [CrossRef]
- Zhai, Y.Z.; Zhao, X.B.; Teng, Y.G.; Li, X.; Zhang, J.J.; Wu, J.; Zuo, R. Groundwater nitrate pollution and human health risk assessment by using HHRA model in an agricultural area, NE China. Ecotoxicol. Environ. Saf. 2017, 137, 130–142. [Google Scholar] [CrossRef]
- Zhou, T.F.; Fan, Y.; Yuan, F.; Cooke, D.; Zhang, X.; Li, L.J. A preliminary investigation and evaluation of the thallium environmental impacts of the unmined Xiangquan thallium-only deposit in Hexian, China. Environ. Geol. 2007, 54, 131–145. [Google Scholar] [CrossRef]
- Qian, J.Z.; Wang, L.L.; Liu, Y.; Wu, B.R.; Wang, X.M. Distribution of nitrate and its implication for the contaminant source in groundwater of Huaibei Plain, Anhui Province. Geosci. J. 2015, 19, 537–545. [Google Scholar] [CrossRef]
- Wang, D.J.; Qian, J.Z.; Zhao, W.D.; Hou, X.L.; Wang, W.; Ma, L. Distribution characteristics and processes along flow paths of shallow groundwater in the Tan-Lu fault zone in Anhui province, China. Geosci. J. 2022, 26, 529–543. [Google Scholar] [CrossRef]
- Yu, L.; Zheng, T.Y.; Zheng, X.L.; Hao, Y.J.; Yuan, R.Y. Nitrate source apportionment in groundwater using Bayesian isotope mixing model based on nitrogen isotope fractionation. Sci. Total Environ. 2020, 718, 137242. [Google Scholar] [CrossRef]
- Mattern, S.; Sebilo, M.; Vanclooster, M. Identification of the nitrate contamination sources of the Brusselian sands groundwater body (Belgium) using a dual-isotope approach. Isot. Environ. Health Stud. 2011, 47, 297–315. [Google Scholar] [CrossRef] [PubMed]
- Chen, Z.; Zhou, Q.; Lv, J.; Jiang, Y.; Yang, H.; Shen, R. Assessment of Groundwater Quality Using APCS-MLR Model: A Case Study in the Pilot Promoter Region of Yangtze River Delta Integration Demonstration Zone, China. Water 2023, 15, 225. [Google Scholar] [CrossRef]
- Chen, Q.H.; Su, X.S.; Wang, S.X.; Zheng, S.D.; Li, Y.F. Hydrochemical Characteristics and Evolution of Groundwater in the Alluvial Plain (Anqing Section) of the Lower Yangtze River Basin: Multivariate Statistical and Inversion Model Analyses. Water 2021, 13, 2403. [Google Scholar] [CrossRef]
- Yan, M.J.; Wang, L.; Wang, Q.; Liu, Z.P. Hydrochemical Characteristics and Origin Analysis of Groundwater in Nanling County, Anhui Province. Water 2024, 16, 1579. [Google Scholar] [CrossRef]
- Yan, Z.Q.; Zhou, H. Hydrochemical Characteristics of Karst Groundwater Systemon the South Bank of the Yangtze River in Yichang. Saf. Environ. Eng. 2022, 29, 139–148. [Google Scholar]
- Zhang, Y.; Hu, Y.P.; Tao, L.; Zhou, F.; Yang, Q.X.; Liu, L.; Wu, B.; Liao, M.F. Hydrochemical characteristic and formation mechanism in the Yangtze River Demonstration District, Wuhan City. Acta Sci. Circumstantiae 2021, 41, 1022–1030. [Google Scholar]
- Zhou, J.; Du, Y.; Deng, Y.M.; Tao, Y.Q.; Leng, Z.C.; Ma, T.; Wang, Y.X. Source identification of groundwater phosphorus under different geological settings in the central Yangtze River basin. J. Hydrol. 2022, 612, 128169. [Google Scholar] [CrossRef]
- Liang, Y.; Ma, R.; Wang, Y.X.; Wang, S.; Qu, L.; Wei, W.H. Hydrogeological controls on ammonium enrichment in shallow groundwater in the central Yangtze River Basin. Sci. Total Environ. 2020, 741, 140350. [Google Scholar] [CrossRef]
- Qi, T.; Yang, P.H.; Groves, C.; Chen, F.; Xie, G.W.; Zhan, Z.J. Natural and anthropogenic factors affecting geochemistry of the Jialing and Yangtze Rivers in urban Chongqing, SW China. Appl. Geochem. 2018, 98, 448–458. [Google Scholar]
- Duan, X.C.; Sun, Z.G.; Li, S.H.; Jiang, Z.C.; Liao, H.W. Hydrogeochemical Characteristics and Environment Quality Assessment of Karst Groundwater in Mengzi Basin of Yunnan Province, China. Water 2023, 15, 2126. [Google Scholar] [CrossRef]
- Xiao, Y.; Zhang, J.H.; Long, A.H.; Xu, S.G.; Guo, T.T.; Gu, X.C.; Deng, X.Y.; Zhang, P. Hydrochemical Characteristics and Formation Mechanism of Quaternary Groundwater in Baoshan Basin, Western Yunnan, China. Water 2023, 15, 2736. [Google Scholar] [CrossRef]
- Li, X.D.; Masuda, H.; Kusakabe, M.; Yanagiawa, F.; Zeng, H.A. Degradation of groundwater quality due to anthropogenic sulfur and nitrogen contamination in the Sichuan Basin, China. Geochem. J. 2006, 40, 309–332. [Google Scholar] [CrossRef]
- Yao, R.W.; Yan, Y.T.; Wei, C.L.; Luo, M.; Xiao, Y.; Zhang, Y.H. Hydrochemical Characteristics and Groundwater Quality Assessment Using an Integrated Approach of the PCA, SOM, and Fuzzy c-Means Clustering: A Case Study in the Northern Sichuan Basin. Front. Environ. Sci. 2022, 10, 907872. [Google Scholar] [CrossRef]
- Liu, W.; Guan, L.F.; Liu, Y.; Xie, X.G.; Zhang, M.L.; Chen, B.Y.; Xu, S.; Sano, Y. Fluid geochemistry and geothermal anomaly along the Yushu-Ganzi-Xianshuihe fault system, eastern Tibetan Plateau: Implications for regional seismic activity. J. Hydrol. 2022, 607, 127554. [Google Scholar] [CrossRef]
- WHO. Guidelines for Drinking-Water Quality; World Health Organization: Geneva, Switzerland, 2022; p. 614. [Google Scholar]
- Drechsel, P.; Zadeh, S.M.; Pedrero-Salcedo, F.; Alcon, F.; Allende, A.; Amerasinghe, P.; Amoah, P.; Ben-Gal, A.; Benes, S.E.; Bruning, B.; et al. Water Quality in Agriculture: Risks and Risk Mitigation; FAO: Rome, Italy, 2023; 192p. [Google Scholar] [CrossRef]

| Sample (n = 42) | pH | K+ | Na+ | Ca+ | Mg2+ | Cl− | SO42− | HCO3− | NO3− | NO2− | NH4+ | F− |
|---|---|---|---|---|---|---|---|---|---|---|---|---|
| Min | 6.93 | 0.53 | 19.99 | 40.16 | 7.32 | 3.55 | 0.39 | 90.71 | 0.81 | 0.00 | 0.00 | 0.00 |
| Max | 7.84 | 126.10 | 155.38 | 302.25 | 75.75 | 528.21 | 300.1 | 882.06 | 137.35 | 1.00 | 9.60 | 0.52 |
| Mean value | 7.36 | 15.46 | 61.80 | 112.67 | 31.54 | 81.82 | 105.08 | 361.95 | 34.71 | 0.04 | 0.45 | 0.15 |
| Standard deviation | 0.18 | 29.12 | 31.10 | 62.78 | 15.38 | 81.36 | 66.93 | 213.36 | 34.80 | 0.15 | 1.75 | 0.16 |
| Coefficient of variation | 0.03 | 1.88 | 0.50 | 0.56 | 0.49 | 0.99 | 0.64 | 0.59 | 1.00 | 3.79 | 3.85 | 1.07 |
| Location | Sample | pH | K+ | Na+ | Ca+ | Mg2+ | Cl− | SO42− | HCO3− | NO3− | NO2− | NH4+ | F− | TDS | References |
|---|---|---|---|---|---|---|---|---|---|---|---|---|---|---|---|
| Taihu (n = 84) | Min | 6.80 | 1.3 | 6.7 | 27.6 | 3.2 | 1.7 | 2.0 | 0.01 | 0.002 | 0.02 | 40 | [43] | ||
| Max | 8.19 | 90.3 | 174.0 | 148.0 | 75.2 | 170 | 146.0 | 39.29 | 2.413 | 4.19 | 792 | ||||
| Mean value | 7.20 | 20.8 | 56.3 | 70.0 | 20.9 | 47.9 | 41.4 | 4.06 | 0.290 | 0.36 | 383 | ||||
| Anqing (n = 51) | Min | 0.00 | 8.60 | 1.84 | 4.25 | 6.56 | 5.09 | 52.28 | 0.00 | 176.30 | [44] | ||||
| Max | 11.31 | 88.76 | 119.28 | 38.52 | 88.41 | 123.46 | 659.17 | 109.26 | 575.45 | ||||||
| Mean value | 1.82 | 51.25 | 51.27 | 23.72 | 24.65 | 34.21 | 310.32 | 14.67 | 365.422 | ||||||
| Nanling (n = 129) | Min | 6.42 | 0.34 | 2.57 | 10.06 | 2.21 | 2.46 | 0.18 | 60.41 | 126.2 | [45] | ||||
| Max | 8.49 | 101.6 | 100.2 | 136.7 | 45.16 | 246.6 | 139.6 | 462.6 | 843.6 | ||||||
| Mean value | 7.46 | 8.75 | 26.46 | 64.91 | 12.4 | 31.17 | 25.44 | 235.16 | 334.79 | ||||||
| Yichang (n = 272) | Min | 0.61 | 1.89 | 66.92 | 9.95 | 2.38 | 19.14 | 150.85 | 13.21 | 66.70 | [46] | ||||
| Max | 0.98 | 2.51 | 71.39 | 25.34 | 3.35 | 41.62 | 240.55 | 21.51 | 112.24 | ||||||
| Mean value | 0.81 | 2.12 | 69.54 | 15.69 | 2.75 | 26.38 | 193.29 | 16.01 | 326.59 | ||||||
| Wuhan (n = 23) | Min | 7.29 | 0.06 | 1.02 | 31.40 | 9.33 | 0.50 | 0.27 | 91.53 | 0.14 | 0 | 0 | 167.75 | [47] | |
| Max | 8.54 | 7.22 | 68.85 | 120.20 | 35.72 | 155.49 | 69.35 | 505.10 | 125.63 | 12.99 | 4.26 | 702.51 | |||
| Mean value | 7.75 | 0.76 | 6.91 | 69.21 | 19.74 | 21.76 | 23.82 | 241.24 | 12.37 | 0.94 | 0.49 | 327.05 | |||
| Dongting (n = 26) | Min | 6.25 | 0.13 | 4.32 | 8.27 | 4.39 | 0.12 | 0 | 105.04 | 0 | 0.01 | 0 | 89.46 | [48] | |
| Max | 7.89 | 2.89 | 51.48 | 131.13 | 40.49 | 8.62 | 3.5 | 765.31 | 2.00 | 42 | 0.61 | 576.45 | |||
| Mean value | 6.86 | 0.84 | 25.84 | 58.44 | 19.14 | 2.19 | 0.49 | 362.08 | 0.58 | 6.16 | 0.17 | 288.55 | |||
| Qianjiang (n = 84) | Min | 0.49 | 3.73 | 30.77 | 6.11 | 0 | 318.77 | 0 | 0 | 0.09 | [49] | ||||
| Max | 32.09 | 121.23 | 216.50 | 71.59 | 82.74 | 1071.96 | 14.54 | 0.20 | 14.03 | ||||||
| Mean value | 2.03 | 23.03 | 130.37 | 30.97 | 6.60 | 710.73 | 0.12 | 0.01 | 2.85 | ||||||
| Chognqing (n = 144) | Min | 6.62 | 1.77 | 7.54 | 35.63 | 7.67 | 10.38 | 28.67 | 110.0 | 0.22 | 242.33 | [50] | |||
| Max | 8.65 | 3.73 | 18.90 | 56.23 | 14.00 | 30.93 | 58.80 | 169.0 | 11.47 | 344.67 | |||||
| Mean value | 8.02 | 2.55 | 12.30 | 46.07 | 10.30 | 18.07 | 44.10 | 139.0 | 6.55 | 300.67 | |||||
| Pangzhihua (n = 52) | Min | 6.25 | 0.5 | 0.15 | 1.09 | 0.44 | 0.88 | 2.92 | 10.7 | 2.01 | 17.0 | [51] | |||
| Max | 8.16 | 21.1 | 2.5 | 75 | 36.7 | 16.1 | 74.0 | 438 | 91.5 | 616 | |||||
| Mean value | 7.55 | 1.21 | 1.52 | 38.93 | 10.22 | 2.15 | 7.92 | 155.83 | 8.14 | 337.5 | |||||
| Baoshan (n = 35) | Min | 7.01 | 1.47 | 16.50 | 37.63 | 15.47 | 7.27 | 4.47 | 69.03 | 0 | 221 | [52] | |||
| Max | 8.24 | 19.87 | 51.60 | 117.77 | 59.03 | 46.47 | 34.94 | 133.33 | 7.33 | 562.67 | |||||
| Mean value | 7.89 | 8.23 | 26.35 | 68.60 | 29.01 | 26.36 | 17.98 | 108.54 | 1.00 | 373.84 | |||||
| Leshan (n = 84) | Min | 6.07 | 0.41 | 1.65 | 4.83 | 0.88 | 0.99 | 1.80 | 0.50 | 0.02 | [53] | ||||
| Max | 8.29 | 51.00 | 75.20 | 163.00 | 64.50 | 146.00 | 354.00 | 852.00 | 0.52 | ||||||
| Mean value | 7.17 | 3.44 | 14.87 | 93.45 | 15.70 | 20.59 | 68.42 | 17.67 | 0.17 | ||||||
| Luzhou (n = 67) | Min | 6.17 | 0.47 | 6.33 | 30.60 | 3.91 | 6.28 | 19.60 | 0.51 | 0.08 | [53] | ||||
| Max | 8.63 | 14.00 | 191.00 | 387.00 | 55.70 | 261.00 | 1339.00 | 109.00 | 19.00 | ||||||
| Mean value | 7.12 | 2.40 | 32.27 | 111.81 | 16.91 | 42.54 | 120.90 | 11.04 | 0.56 | ||||||
| Yibin (n = 63) | Min | 6.10 | 0.38 | 2.91 | 14.50 | 3.91 | 3.67 | 12.40 | 0.00 | 0.64 | 0.00 | 0.00 | 0.07 | [53] | |
| Max | 9.20 | 68.00 | 88.80 | 298.00 | 44.00 | 313.00 | 337.00 | 0.00 | 24.80 | 0.00 | 0.00 | 15.00 | |||
| Mean value | 7.23 | 3.25 | 23.14 | 99.04 | 17.74 | 36.40 | 109.81 | 0.00 | 6.00 | 0.00 | 0.00 | 0.45 | |||
| Northern Sichuan Basin (n = 203) | Min | 6.6 | 0.4 | 8 | 20.04 | 3.65 | 3.55 | 9.64 | 115.93 | 0.04 | 0.002 | 0.01 | 0.01 | 167.16 | [54] |
| Max | 8.4 | 46 | 121 | 314.63 | 86.34 | 209.91 | 760 | 585.77 | 244 | 13.9 | 18.3 | 7.2 | 1411.40 | ||
| Mean value | 7.38 | 2.88 | 30.53 | 108.62 | 26.86 | 31.16 | 81.56 | 364.72 | 41.22 | 0.17 | 0.3 | 0.33 | 523.19 | ||
| Yushu-Ganzi-Xianshuihe (n = 26) | Min | 0.90 | 7.90 | 1.70 | 0.30 | 1.70 | 27.00 | 0 | [55] | ||||||
| Max | 564.00 | 507.00 | 71.00 | 272.00 | 117.0 | 1791.00 | 2.47 | ||||||||
| Mean value | 206.02 | 66.92 | 22.27 | 28.15 | 23.93 | 805.62 | 0.40 | ||||||||
| Sj (drinking) | 8.00 | 12.00 | 200.00 | 75.00 | 50.00 | 250.00 | 250.00 | 200.00 | [56] | ||||||
| Sj (irrigating) | 8.00 | 12.00 | 200.00 | 400.00 | 60.00 | 350.00 | 1000.00 | 900.00 | [57] |
Disclaimer/Publisher’s Note: The statements, opinions and data contained in all publications are solely those of the individual author(s) and contributor(s) and not of MDPI and/or the editor(s). MDPI and/or the editor(s) disclaim responsibility for any injury to people or property resulting from any ideas, methods, instructions or products referred to in the content. |
© 2025 by the authors. Licensee MDPI, Basel, Switzerland. This article is an open access article distributed under the terms and conditions of the Creative Commons Attribution (CC BY) license (https://creativecommons.org/licenses/by/4.0/).
Share and Cite
Xiao, Y.; Wei, L.; Liu, X.; Yao, D. Hydrochemical Characteristics and Quality Assessment of Groundwater in the Yangtze River Basin: A Comparative Study of the Hexian Area, China. Water 2025, 17, 1410. https://doi.org/10.3390/w17101410
Xiao Y, Wei L, Liu X, Yao D. Hydrochemical Characteristics and Quality Assessment of Groundwater in the Yangtze River Basin: A Comparative Study of the Hexian Area, China. Water. 2025; 17(10):1410. https://doi.org/10.3390/w17101410
Chicago/Turabian StyleXiao, Yonghong, Lu Wei, Xianghong Liu, and Dengkui Yao. 2025. "Hydrochemical Characteristics and Quality Assessment of Groundwater in the Yangtze River Basin: A Comparative Study of the Hexian Area, China" Water 17, no. 10: 1410. https://doi.org/10.3390/w17101410
APA StyleXiao, Y., Wei, L., Liu, X., & Yao, D. (2025). Hydrochemical Characteristics and Quality Assessment of Groundwater in the Yangtze River Basin: A Comparative Study of the Hexian Area, China. Water, 17(10), 1410. https://doi.org/10.3390/w17101410