1. Introduction
The urban heat island effect refers to the phenomenon in which urban areas experience higher temperatures compared to surrounding rural areas [
1,
2,
3]. The causes of this effect are multifaceted, including urban expansion, reductions in vegetation and water bodies, high population density, and increased heat generated by industrial and transportation activities [
4,
5]. The rapid pace of urbanization has continually raised urban surface temperatures, thereby intensifying the impact of the heat island effect on local climates [
6]. Under the combined influence of extreme heat waves and the urban heat island effect, environmental issues such as aerosol pollution and abnormal precipitation patterns have become increasingly severe, posing significant threats to human health and well-being [
7]. Furthermore, elevated temperatures lead to increased water consumption and energy demand in urban areas, exacerbating the issue of water scarcity, with disproportionately significant effects on vulnerable populations, ultimately damaging the urban ecological environment [
8]. Consequently, heat-related environmental issues are not only climate-related concerns but also serve as crucial indicators of urban ecological quality and sustainable development.
Water bodies are a vital component of urban landscape ecosystems, characterized by low heat radiation, evaporation, and heat storage properties. They can effectively absorb solar radiation, thereby creating localized microclimates and improving the urban thermal environment [
9,
10,
11]. In recent years, scholars have extensively studied the role of water bodies in regulating thermal environments using various analytical methods [
12,
13]. Due to the variation in the spatial morphological and origins of water bodies, their impacts on the thermal environment also differ [
14]. Research has shown that attributes such as the area, width, and flow velocity of water bodies significantly influence their cooling effects: larger water bodies exhibit stronger cooling abilities, while faster flow velocities enhance energy exchange and lead to more pronounced cooling effects [
15,
16,
17]. Furthermore, the surrounding landscape configuration also affects the cooling performance of water bodies [
18]. For example, adjacent built-up areas may diminish the cooling capacity of water bodies, while vegetation can help to expand the cooling effect of water bodies [
19].
When the radiative and thermal characteristics of water bodies significantly differ from their surrounding environments, their hydrothermal properties can effectively reduce the temperature of localized areas [
20]. Some studies, from a meteorological perspective, have analyzed the impact of factors such as relative humidity and flow velocity on the thermal regulation of water bodies [
21,
22]. Other research has combined climate parameters with fluid dynamics to explore the influence of water bodies on urban microclimates. These studies have found that water bodies can, to a certain extent, reduce local air temperatures and increase humidity, with faster air flow velocity enhancing the cooling effect [
23]. While water bodies can effectively mitigate the urban heat island effect within a certain range, significant regional variations exist [
24]. For instance, studies have shown that the average buffering distance of water bodies in Nanjing is 300 m, whereas in Dongguan, it is 200 m. This difference is primarily influenced by the scale and layout of urban development [
25,
26]. Analysis of wetland surface temperature inversion results has revealed a significant positive correlation between the average ground temperature in buffer zones and distance from wetlands, with minimal impact on surface temperature beyond 250 m [
27,
28]. These studies, using various perspectives and methods, have examined the cooling effects of urban water bodies, validating their role in thermal regulation and laying a solid foundation for further investigation into the cooling mechanisms of urban water bodies.
Zhejiang Province is facing increasingly severe urban thermal environment issues as it undergoes rapid urbanization [
29]. The rising population and building density have significantly exacerbated the urban heat island effect, leading to localized temperature increases and negatively impacting both residents’ quality of life and the ecological environment [
30]. Despite these challenges, Zhejiang’s abundant water systems, including rivers, lakes, and wetlands, offer substantial potential for mitigating temperature fluctuations and improving the thermal environment [
31].
Analyzing the morphological impacts of urban water bodies on cooling effects is of significant relevance. The morphological characteristics of water bodies, such as shape and spatial distribution, substantially influence the intensity and spatial extent of their cooling effects. Investigating these relationships can provide deeper insights into the thermodynamic interactions between water bodies and their surrounding environments. Furthermore, such analysis offers a scientific basis for urban planning and design, enabling the optimization of water body configurations to improve urban thermal environments and mitigate urban heat island effects. This research also provides theoretical support for policymaking, contributing to the development of more livable and ecologically sustainable urban spaces.
To address this, this study focuses on five cities in Zhejiang Province—Huzhou, Jinhua, Jiaxing, Quzhou, and Shaoxing—which are characterized by well-developed water systems, to explore the impact of urban water bodies on thermal environments. In this study, the single-window algorithm is used to invert the urban land surface temperature, while the random forest classification algorithm is employed to obtain land use data. The morphology indicators of urban water bodies are calculated using Fragstats 4.2 software. Additionally, the Gradient Boosting Decision Tree (GBDT) regression model is applied to analyze the contribution of various water body morphology indicators to the cooling effect, and targeted optimization strategies are proposed for the water bodies of each city.
2. Study Area and Data Sources
2.1. Study Area
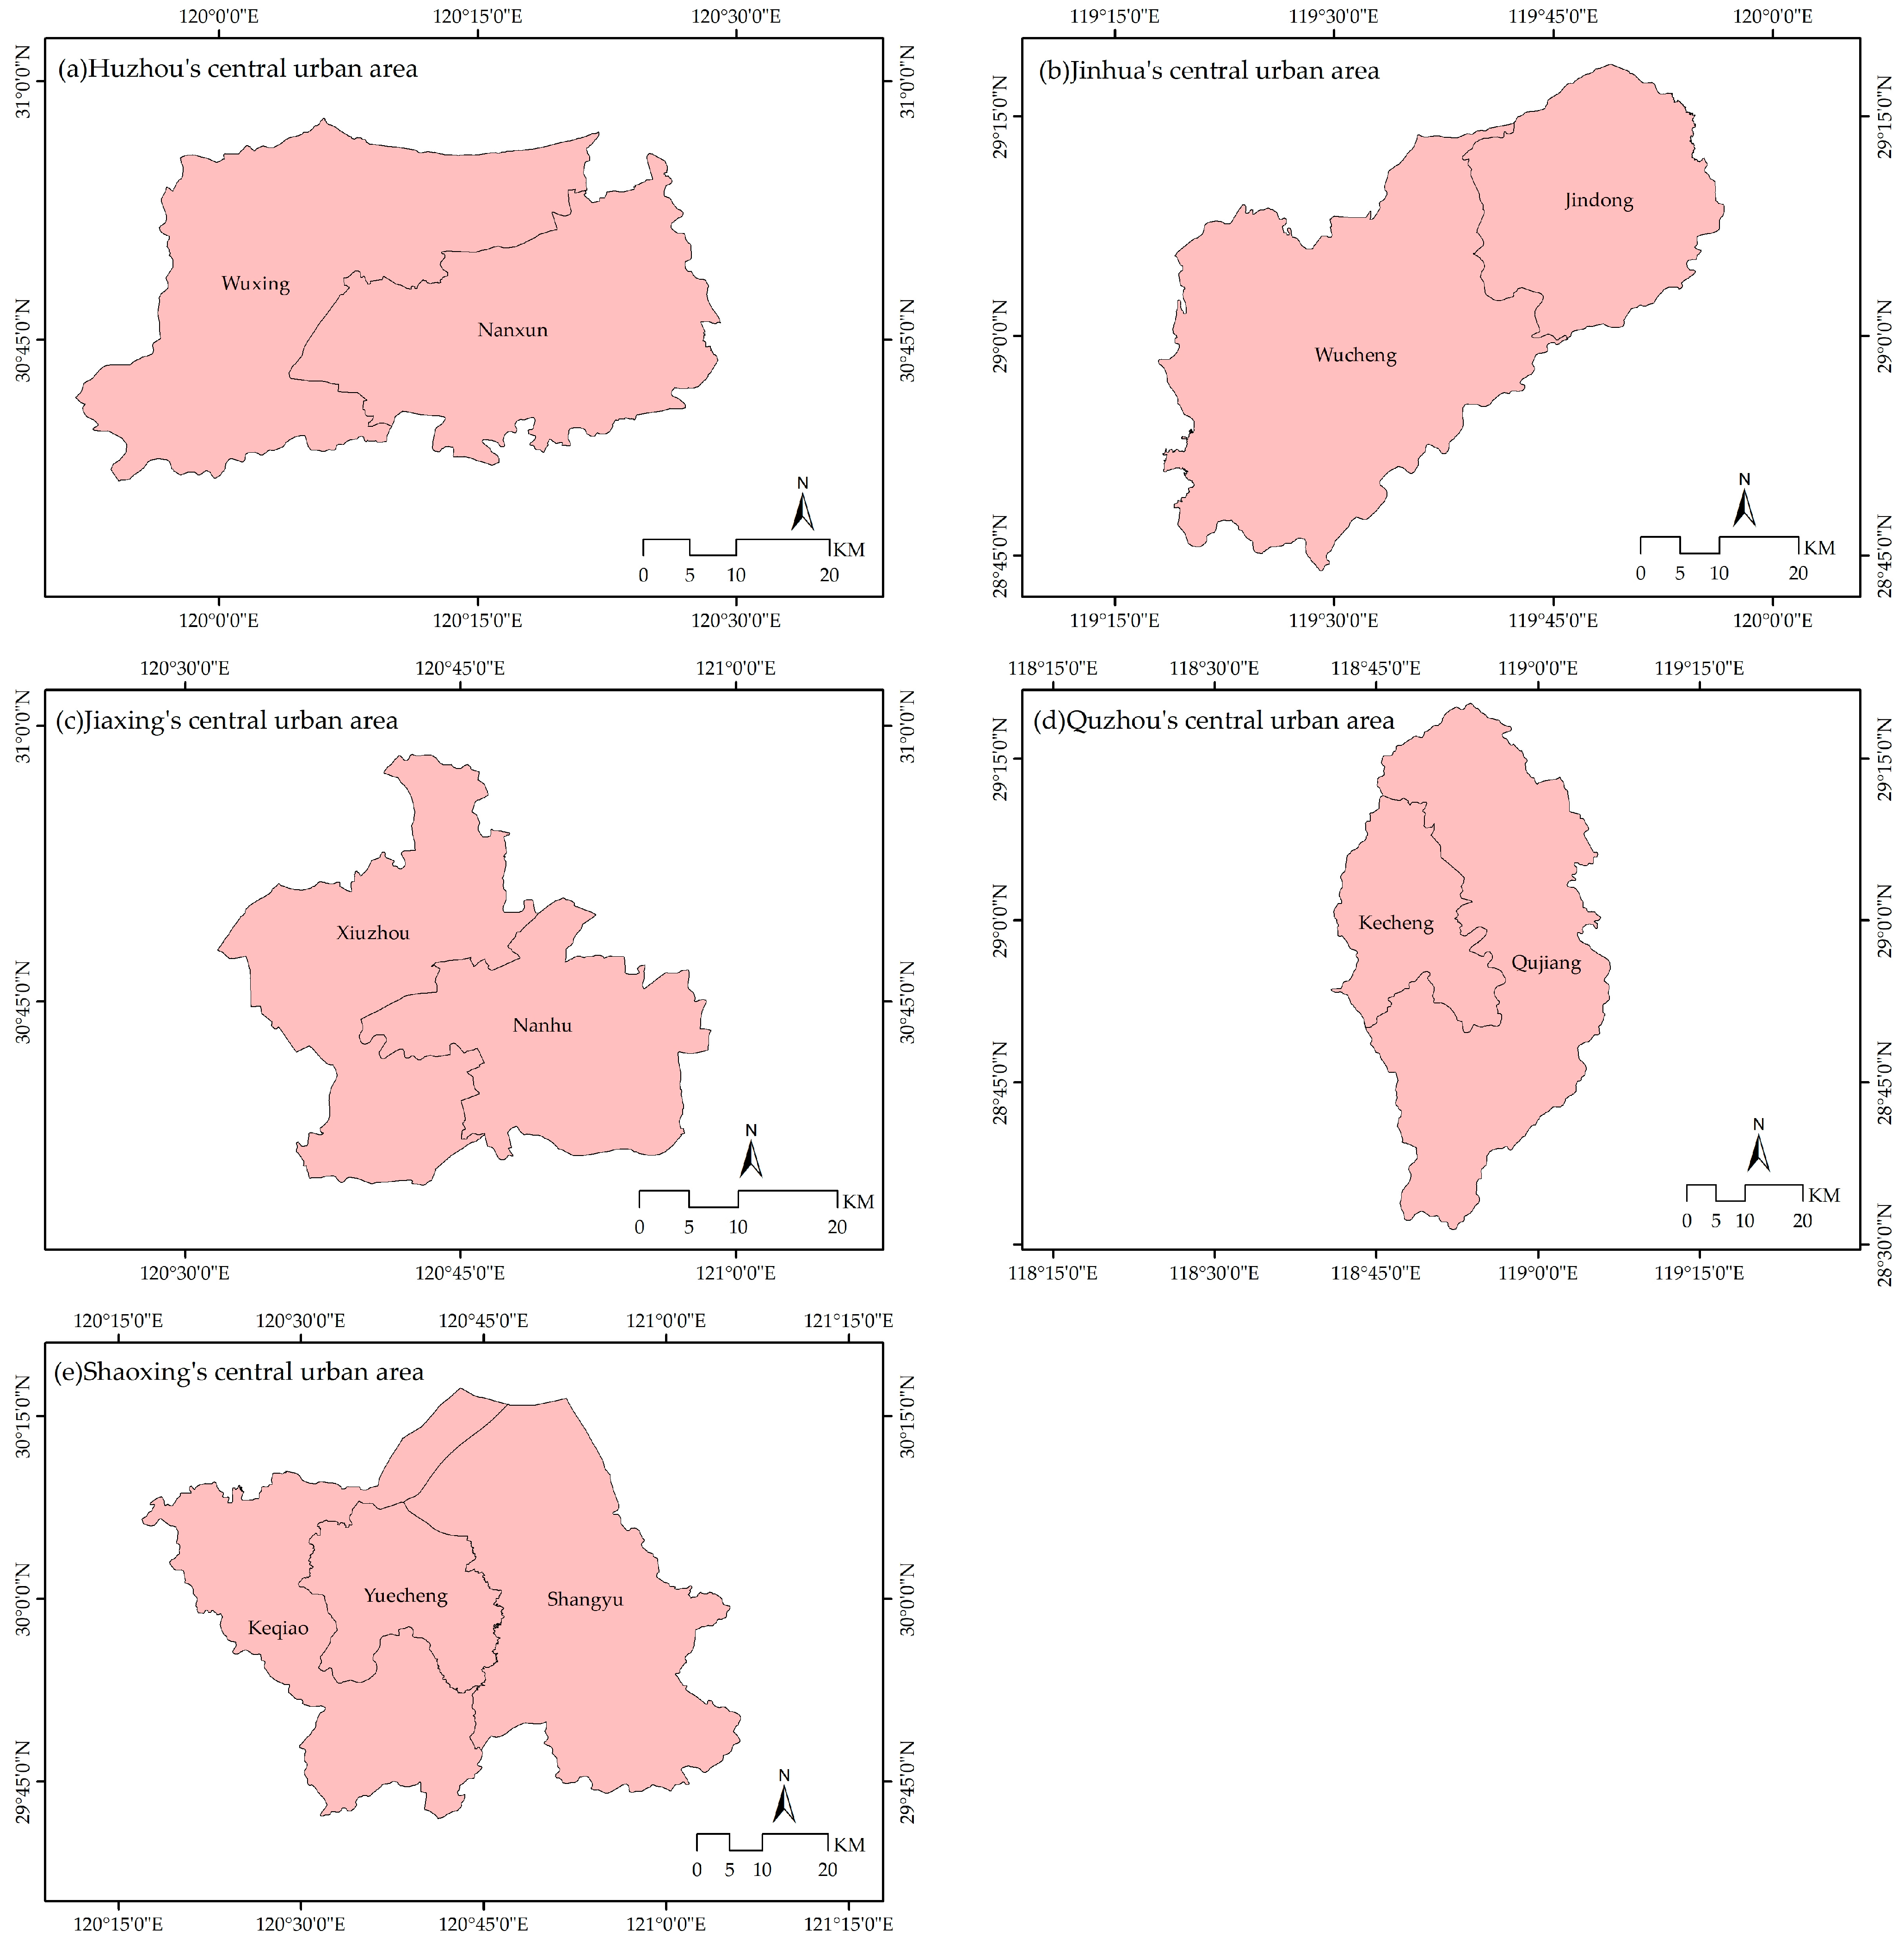
This study focuses on the central urban areas of five cities in Zhejiang Province—Huzhou, Jinhua, Jiaxing, Quzhou, and Shaoxing (
Figure 1). The selection of these cities is based on three key reasons. First, all five cities are situated in Zhejiang Province, an economically dynamic region in eastern China, and serve as representative units of regional economic development, characterized by high levels of economic vitality and industrialization. As prefecture-level cities, they exemplify typical urban development patterns, with the urban heat island effect intensifying and ecological environmental issues becoming more pronounced due to rapid urbanization. Second, the morphological of water systems plays a crucial role in moderating cooling effects [
32]. Each of these cities has a distinct water system: Huzhou’s system is dominated by the Dongtiao and Xitiao Rivers, forming an interwoven, grid-like structure; Jinhua’s water system centers around the Wu, Yiwu, and Wuyi Rivers, with numerous lakes at the confluence of these three rivers; Jiaxing’s water system is characterized by the Grand Canal, Haiyantang, and Pinghutang, forming a radial and networked layout; Quzhou’s system is primarily composed of the Qu, Wuxi, and Jiangshangang Rivers, exhibiting a tree-like distribution; and Shaoxing’s water system is centered around the Cao’e River, forming a radial network. Third, the urban development model has a profound impact on the urban microclimate [
33]. The spatial layouts of these five cities reflect unique development characteristics: Huzhou follows an axis and two wings development pattern; Jinhua employs a central core with multiple development points; Jiaxing adopts a linear belt-and-axis strategy; Quzhou features a multi-point linkage model with the city center as the core; and Shaoxing displays a multi-center, multi-axis development pattern.
Huzhou, as a core city in the Yangtze River Delta, has a central urban area that includes Wuxing and Nanxun districts, covering a total area of 1574 square kilometers, which accounts for 27.04% of the city’s total area. Jinhua, located in central Zhejiang Province, includes the Wucheng and Jindong districts in its central urban area, with a total area of 2029 square kilometers, representing 18.54% of the city’s total area. Jiaxing, an important city within the Shanghai metropolitan area, has a central urban area comprising Xiuzhou and Nanhu districts, covering 987 square kilometers, or 25.21% of the city’s total area. Quzhou, located in the western part of Zhejiang Province, includes the Kecheng and Qujiang districts in its central urban area, spanning 2354 square kilometers, which accounts for 26.61% of the city’s total area. Shaoxing, as a secondary center of the Hangzhou metropolitan area, has a central urban area that encompasses Yuecheng, Keqiao, and Shangyu districts, covering a total area of 2982 square kilometers, or 36.04% of the city’s total area.
This study aims to elucidate the impact of water body morphological structures on cooling effects through a comparative analysis of the five cities under investigation. Based on the distinct urban development models of each city, the study also proposes corresponding water body optimization strategies, offering valuable insights for the scientific planning and development of urban ecological environments.
2.2. Data Sources
The primary data sources for this study include remote sensing data, administrative boundary data, water body data, and road network data.
Google Earth Engine (GEE) is a comprehensive scientific analysis and geospatial data visualization platform developed by Google (
https://earthengine.google.com, accessed on 10 September 2024) [
34,
35]. GEE simplifies the process of acquiring remote sensing data and processing imagery, thereby enhancing the efficiency of researchers and data analysts. The platform provides access to a wide array of publicly available geospatial datasets, including satellite imagery, climate products, land surface temperature, land use, and nighttime lighting data. Among these, remote sensing imagery from the Landsat satellite series is one of the commonly used datasets for land surface temperature inversion, offering long temporal coverage and high spatial resolution [
36,
37]. This study utilizes GEE to access publicly available Landsat imagery from the LANDSAT/LC08/C01/T1_SR surface reflectance dataset, covering multi-temporal summer remote sensing images of the study area during the summer of 2022. These data are processed using the official Landsat Surface Reflectance Code (LaSRC) atmospheric correction algorithm, making them readily applicable [
38]. Additionally, the administrative boundary data for the study area were obtained from the Guihuayun website (
http://www.guihuayun.com/maps/region.php, accessed on 10 September 2024).
OpenStreetMap (OSM) is an open-source mapping dataset, with data collected by volunteers through various sources such as GPS devices, aerial imagery, topographic maps, and publicly available satellite images [
39,
40]. Users can freely access, edit, and share these data. OSM provides a wealth of geospatial information globally, including details on streets, buildings, rivers, lakes, mountains, and public infrastructure. The water body and road data required for this study were sourced from the OpenStreetMap website (
www.openstreetmap.org, accessed on 10 September 2024). After obtaining the water body data, the major water bodies within the study area were further refined based on reports of key water bodies from local water conservancy bureaus.
3. Methodology
The research methodology (
Figure 2) consists of the following steps: (1) The urban buffer zones are subdivided into multiple block units based on the urban road network, thereby defining the basic analytical units. (2) Using the GEE platform, the single-window algorithm is applied to invert the land surface temperature (LST) from Landsat remote sensing imagery, obtaining the LST data for the central urban areas of the five cities. The LST values are classified using the mean standard deviation method to quantify the intensity of the urban cooling effect and further analyze its spatial distribution at the level of the basic analytical units. (3) On the GEE platform, Landsat satellite imagery and the random forest classification algorithm are used to derive land use classification data, identify water bodies in the study area, and calculate the morphology indicators of water bodies for each city. (4) The contribution rate of the water bodies’ morphology indicators to the urban cooling effect is analyzed using the GBDT regression model, and, based on the results, targeted optimization strategies are proposed for the water bodies in each city.
3.1. Define the Basic Analytical Units
The road network constitutes the primary framework of urban spatial structure, thereby delineating urban blocks. This study establishes buffer zones based on the primary water body data within the study area and selects the roads within these buffer zones. These roads are subsequently divided into multiple block units to define the basic analytical units.
According to the water body reports from local water conservancy bureaus, this study extracts key water body data within the study area, selecting lakes with an area exceeding 0.01 km2. Buffer zones are then defined, with rivers categorized into two types: those with a width between 20 and 70 m, for which the buffer extends 500 m from the riverbank, and those with a width greater than 70 m, for which the buffer extends 1500 m. For lakes, a 500 m buffer zone from the shoreline is established. Additionally, first, second, and third-class roads are selected from the road network data to construct the required transportation network. Using ArcGIS 10.7, functions such as merge, erase, feature to polygon, and clip are employed to delineate the buffer zones into multiple block units based on the road network. Each block unit is subsequently defined as the basic analytical unit.
3.2. Classification of Cooling Effect Intensity Levels
Traditional methods for land surface temperature inversion, such as those using ENVI 5.3 software, are both complex and time-consuming. In contrast, image processing techniques based on the GEE platform effectively address issues such as missing remote sensing data, cloud cover, color discrepancies, and temporal inconsistencies. Moreover, the platform supports the online acquisition and processing of long-term and large-scale remote sensing data, significantly reducing image processing time and improving operational efficiency. In this study, the GEE platform is utilized to obtain Landsat imagery for the study area during the summer of 2022. Cloud removal, atmospheric correction, radiometric correction, and image stitching are directly performed on the GEE platform. The single-window algorithm is applied to the thermal infrared band (Band 10) of Landsat 8 to perform land surface temperature inversion, yielding the land surface temperature for the study area during the summer of 2022. The average land surface temperature within urban water body buffer zones is then calculated using the zonal statistics tool in ArcGIS 10.7. Finally, the average land surface temperatures of the buffer zones are classified into five levels using the mean standard deviation method (
Table 1) to represent the cooling effect intensity of the water bodies [
41].
3.3. Calculate the Morphology Indicators of Water Bodies
Land use classification for five cities in 2022 is conducted on the GEE platform using the random forest classifier. The classification process involves several steps, including data preparation, the selection of training samples, model training, classification execution, and accuracy assessment. In this study, artificial training samples are generated using Google Earth imagery, and land use types are categorized into four classes: built-up areas, water bodies, green spaces, and agricultural land.
Based on existing research on the selection of water body morphology indicators [
42], this study adopts representativeness, morphological relevance, and data availability as the criteria for choosing water body morphology indicators. Six water body morphology indicators are selected, covering aspects such as area, density, shape, and edge: the proportion of landscape area occupied by water patches (WPLAND), the largest patch index of water (WLPI), the number of water patches (WNP), the water patch density (WPD), the landscape shape index of water (WLSI), and the edge density of water (WED). These indicators form the basis of the urban water body morphology indicator system.
- (1)
WPLAND
WPLAND represents the relative coverage of water patches within the entire landscape. The formula is as follows:
In the formula,
AW denotes the total area of water patches within the landscape, and
A represents the total landscape area [
43].
- (2)
WLPI
WLPI represents the proportion of the area of the largest water patch relative to the total landscape area. The formula is as follows:
In the formula,
Amax denotes the area of the largest water patch in the landscape, and
A represents the total landscape area [
43].
- (3)
WNP
WNP represents the number of water patches in the landscape. The formula is as follows:
In the formula,
N denotes the number of water patches in the landscape [
43].
- (4)
WPD
WPD represents the number of water patches per unit area, reflecting the spatial distribution and density of water patches within the landscape. The formula is as follows:
In the formula,
N denotes the number of water patches in the landscape, and
A represents the total landscape area [
44].
- (5)
WLSI
WLSI is used to assess the shape complexity of water patches within the entire landscape. The formula is as follows:
In the formula,
E denotes the total length of the boundaries of all water patches in the landscape, and
A represents the total landscape area [
43].
- (6)
WED
WED measures the ratio of the total perimeter length of water patches to the total landscape area. The formula is as follows:
In the formula,
P denotes the total perimeter length of all water patches in the landscape, and
A represents the total landscape area [
44].
3.4. Analysis of the Contribution Rate of Water Body Morphology Indicators
Currently, studies on the factors contributing to urban heat island (UHI) effects primarily rely on classical multiple linear regression models. While this approach can reveal linear relationships between UHI intensity and various factors, it has limitations in handling complex nonlinear relationships, multicollinearity among variables, and sensitivity to outliers [
45]. Although ridge regression addresses multicollinearity, it remains highly sensitive to outliers, which may lead to biased model fitting [
46]. Given the complexity and variability in data quality in this study, as well as the nonlinear relationships among variables, the GBDT emerges as an ideal choice. This algorithm consists of multiple decision trees, where the final prediction is obtained by aggregating the results of all trees [
47]. Compared to multiple linear regression and ridge regression models, the GBDT regression model exhibits superior nonlinear fitting capabilities and higher predictive accuracy. Its primary advantages include the ability to automatically identify key features, strong adaptability, and robust handling of outliers and diverse feature types [
48]. In comparison to random forests, GBDT employs an additive model with gradient-based optimization, offering improved performance in modeling continuous features while maintaining a more lightweight structure [
49]. Furthermore, compared to XGBoost, GBDT features a relatively simpler implementation with lower computational costs, making it more efficient for small datasets, where rapid iteration and parameter tuning are critical [
50]. Additionally, GBDT regression can handle missing data points effectively and minimize the potential linear interference among water body morphology indicators. The GBDT algorithm is presented below (Algorithm 1).
| Algorithm 1 Gradient Boosting Decision Tree |
- 1.
.
|
- 2.
For m = 1 to M:
|
- (a)
For i = 1,2,⋯,N compute
|
| . |
- (b)
, j = 1,2,⋯,Jm.
|
- (c)
For j = 1,2,⋯,Jm compute
|
| . |
- (d)
.
|
- 3.
.
|
The GBDT model effectively addresses the nonlinear relationship between water body morphology and cooling effects by constructing a series of weak learners, typically decision trees. During this process, GBDT iteratively adjusts the output of each tree to better fit the patterns in the training data. Specifically, the model begins by training an initial base tree to approximate the preliminary relationship between water body morphology and cooling effects. Subsequent trees are then optimized based on the residuals of the preceding tree. This iterative refinement enables GBDT to progressively enhance its predictions of nonlinear relationships, capturing the intricate impacts of water body morphology on cooling effects, including morphological characteristics, spatial distribution patterns, and interactions with surrounding environments. This stepwise optimization process allows GBDT to effectively handle environmental issues characterized by nonlinear features and complex interactions.
SPSSPRO is a data analysis platform based on IBM SPSS v27 software, designed to provide users with efficient and convenient tools for statistical analysis and data mining [
51]. In this study, we use SPSSPRO to construct a training dataset, which includes quantized data on urban heat island cooling effects and water body morphology indicators. The training set is then tested to generate the GBDT model. GBDT calculates feature importance by evaluating the contribution of each feature to the splits across all trees, and this feature importance is used to assess the contribution of urban water body morphology indicators to cooling effects. Based on the results, we propose targeted optimization strategies for water bodies in each city.
The GBDT model calculates feature importance by evaluating the role of each feature within its decision trees [
52]. The primary evaluation metrics include the following: (1) Gain, which measures the improvement in the loss function achieved by splitting on a particular feature; a higher gain indicates greater importance of the feature; (2) Frequency, which counts the number of times a feature is used as a splitting node across all trees, with higher frequencies indicating higher importance; and (3) Coverage, which represents the number of samples affected by a feature’s split, where features with larger coverage are generally deemed more important. By integrating these metrics, GBDT effectively assesses each feature’s contribution to the model’s predictive performance, providing a robust basis for feature selection. In this study, feature importance analysis is employed to quantify the contribution of urban water body morphological indicators to cooling effects.
The calculation of feature importance in the GBDT model can be classified as a form of local sensitivity analysis. Specifically, GBDT evaluates the contribution of each feature incrementally, tree by tree, focusing on the performance of features at various nodes and split points. This approach emphasizes the local behavior of the model, examining the influence of features on predictions at specific split points and within individual tree structures. However, GBDT’s feature importance assessment also incorporates a global perspective by aggregating split information across all trees to evaluate the overall importance of each feature in the model. This dual perspective ensures that, although the contributions of individual trees are assessed at a localized level, the integration of global metrics—such as gain, frequency, and coverage—enables a comprehensive evaluation and ranking of feature importance across the entire model.
The GBDT model parameters are configured as follows: the data split ratio is set to 0.7, and 5-fold cross-validation is employed. The loss function and node-splitting evaluation criterion are defined as friedman_mse. The number of base learners is set to 100, with a learning rate of 0.1. A sampling ratio of 1 is used without replacement. The minimum number of samples required for internal node splitting is set to 2, while the minimum number of samples for leaf nodes is set to 1. Additionally, the minimum sample weight in leaf nodes is set to 0. The maximum tree depth is limited to 10, with a maximum of 50 leaf nodes per tree. The impurity threshold for node splitting is specified as 0.
Seventy percent of the total dataset is allocated for constructing the training set, while the remaining 30% is designated as the test set. After generating the GBDT regression model, the established model is applied to the test datasets. The predictive performance of the GBDT model is evaluated using metrics such as mean squared error (MSE), root mean squared error (RMSE), mean absolute error (MAE), and mean absolute percentage error (MAPE). Notably, for regression models, particularly those utilizing nonlinear algorithms, the coefficient of determination (R2) is not considered an ideal performance metric. Therefore, R2 is not employed as an evaluation criterion in this study.
4. Results
4.1. The Cooling Effect of Water Bodies Within Central Urban Areas
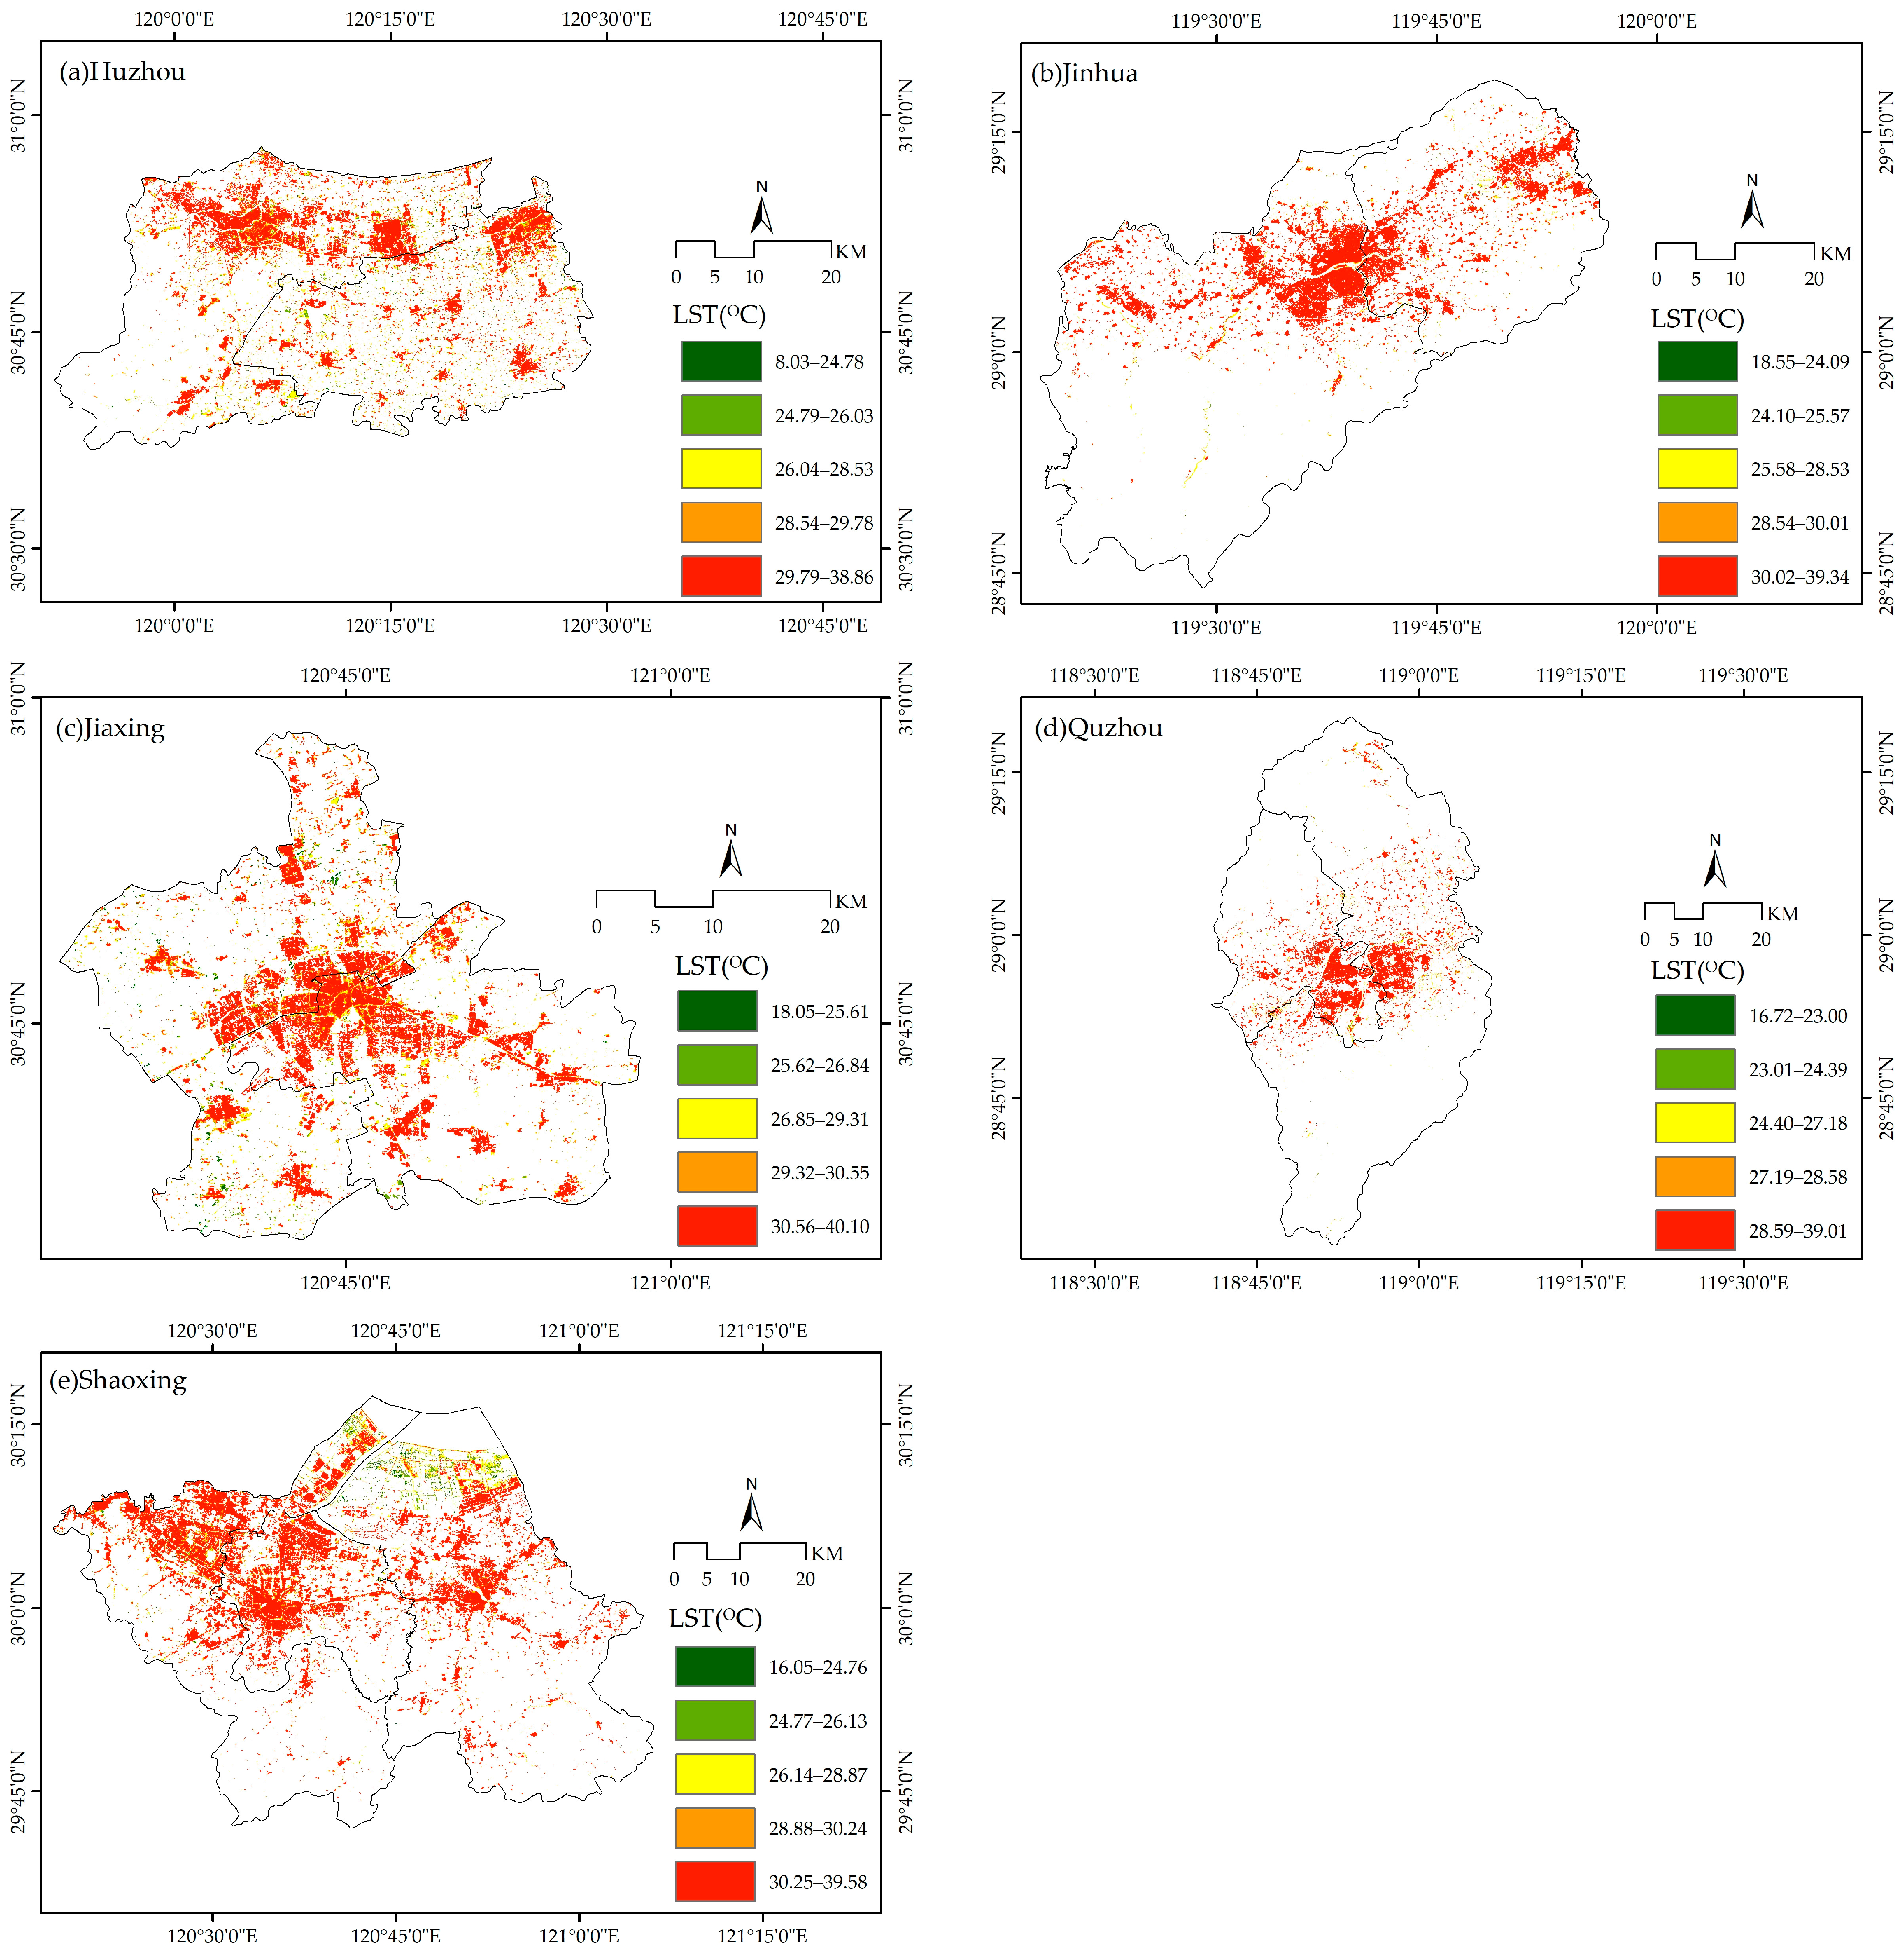
Table 2 presents the maximum and average LST for the central urban areas, built-up areas, and water bodies of the five cities. The land surface temperatures of the central urban areas exhibit distinct spatial distribution patterns.
Firstly, the temperatures in the central urban areas of all five cities are significantly higher than those in the surrounding regions, exhibiting a typical urban heat island effect. Specifically, the maximum LST rank as follows, from highest to lowest: Jiaxing (40.10 °C), Shaoxing (39.58 °C), Jinhua (39.34 °C), Quzhou (39.01 °C), and Huzhou (38.86 °C). In terms of average LST, the ranking from highest to lowest is as follows: Jiaxing (28.08 °C), Shaoxing (27.50 °C), Huzhou (27.28 °C), Jinhua (27.05 °C), and Quzhou (25.79 °C). Notably, Jiaxing and Shaoxing exhibit significantly higher maximum and average LST compared to the other three cities.
Secondly, significant spatial differences in high-temperature zones within the built-up areas of the central urban areas are observed across different cities (
Figure 3). In Huzhou, the high-temperature zones in the built-up areas are primarily concentrated in the northern part, especially along the banks of the Dongtiao, Xitiao, and Ditang Rivers. In Jinhua, high-temperature zones are concentrated around the confluence of the Wu, Yiwu, and Wuyi Rivers, with a circular expansion outward from this center. Jiaxing’s high-temperature zones are mainly located in the central urban area and along the banks of the Grand Canal. In Quzhou, the high-temperature zones are concentrated in the central part of the city, particularly in the hotspot regions along the Qu and Wuxi Rivers. In Shaoxing, the high-temperature zones are primarily distributed along the Cao’e River, Hangzhou-Ningbo Canal, and Xiaocao Canal. These distribution patterns suggest that areas along the major urban rivers are typically high-density zones within the built-up areas, often accompanied by dense commercial, residential, and recreational facilities. The maximum LST in the central urban areas of the five cities correspond to those in the built-up regions, with the average LST in the central urban areas being at least 3.06 °C lower than that in the built-up areas.
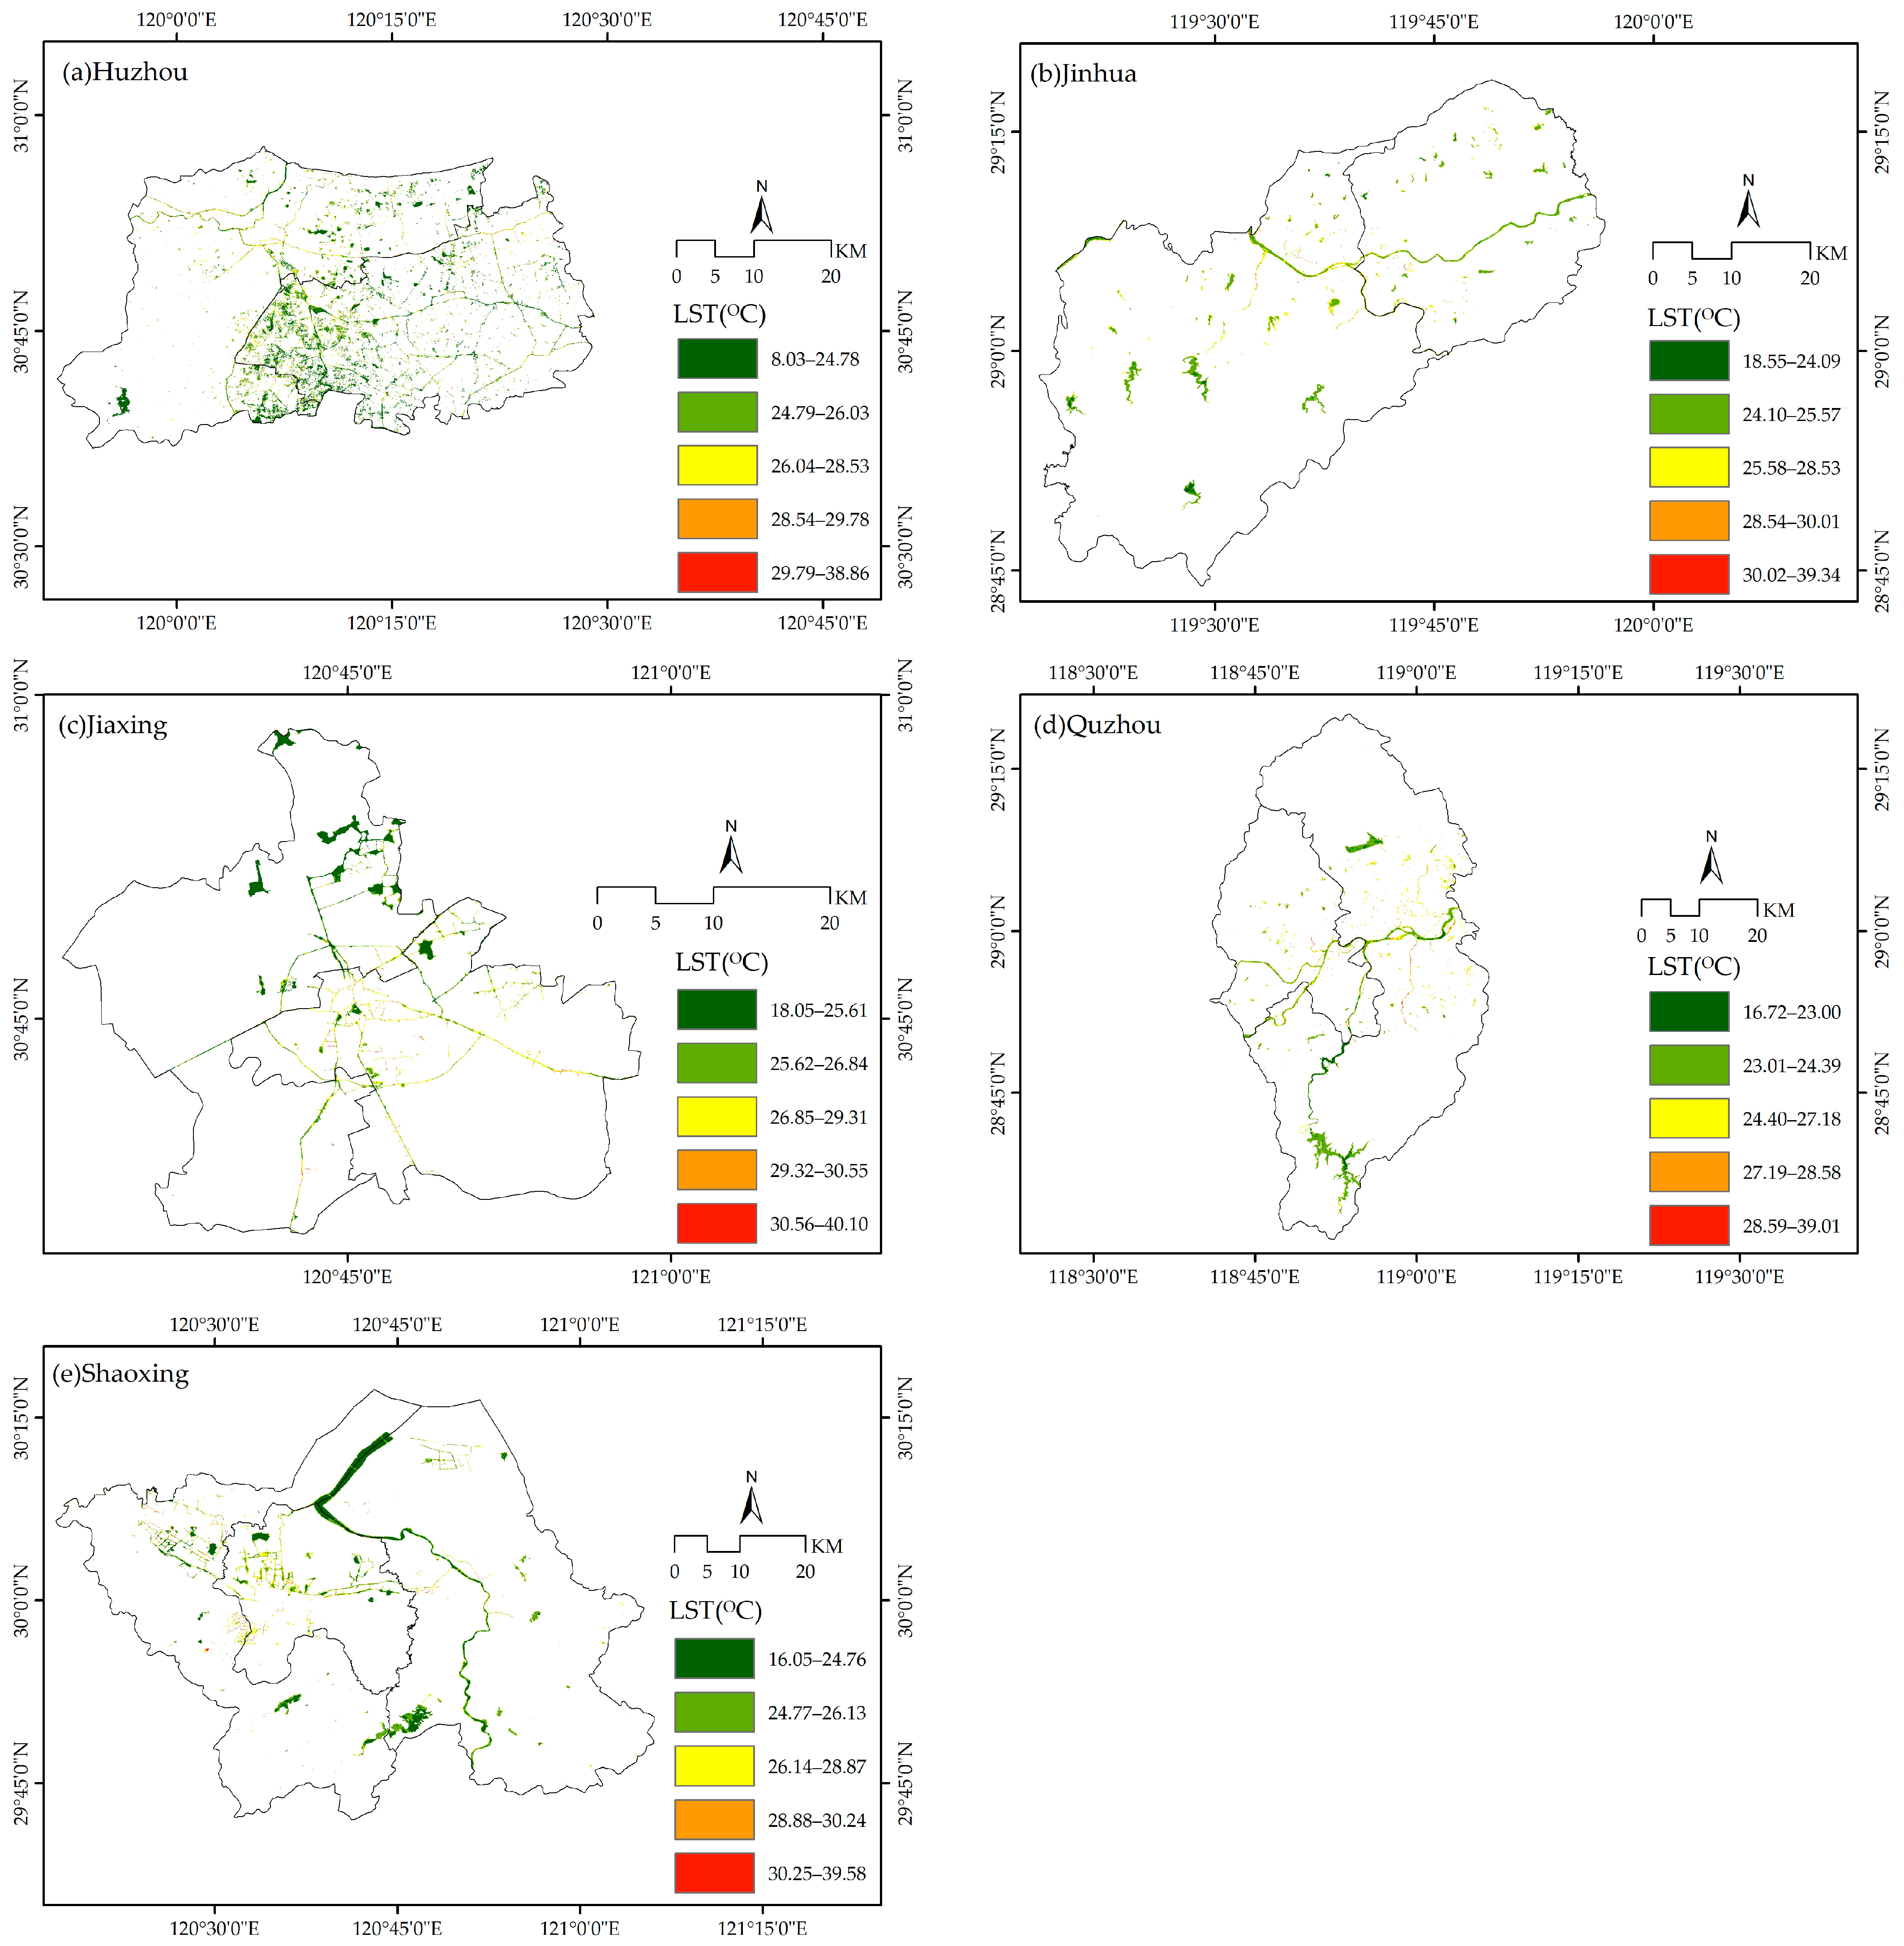
Thirdly, water bodies in the central urban areas of all cities exhibit significant cooling effects (
Figure 4). In terms of reducing the maximum land surface temperature, water bodies in each city achieved a cooling effect exceeding 4.16 °C, with Jiaxing and Quzhou showing particularly notable results, achieving cooling reductions of 6.83 °C and 6.36 °C, respectively. Regarding the average LST, all cities’ water bodies demonstrated a cooling effect greater than 5.13 °C compared to the built-up areas, with Quzhou and Jinhua experiencing the most pronounced cooling, reaching 7.22 °C and 7.17 °C, respectively. Spatially, the land surface temperatures of water bodies in each city are primarily concentrated in the low- and sub-low-temperature zones, indicating that dynamic rivers and large lakes play a key role in mitigating the urban heat island effect.
4.2. The Cooling Effect of Water Bodies Within Urban Buffer Zones
The average LST of the urban buffer zones in the five cities, ranked from highest to lowest, is as follows: Jiaxing (28.80 °C), Jinhua (28.36 °C), Shaoxing (28.26 °C), Huzhou (27.91 °C), and Quzhou (27.06 °C). Moreover, the average LST of the urban buffer zones in these cities is at least 0.63 °C higher than that of their central urban areas, indicating that the thermal environment in the urban buffer zones is more pronounced.
Table 3 provides the total number of units, total area, number of units in the low-temperature zone, proportion of units in the low-temperature zone, and proportion of area in the low-temperature zone for the urban buffer zones.
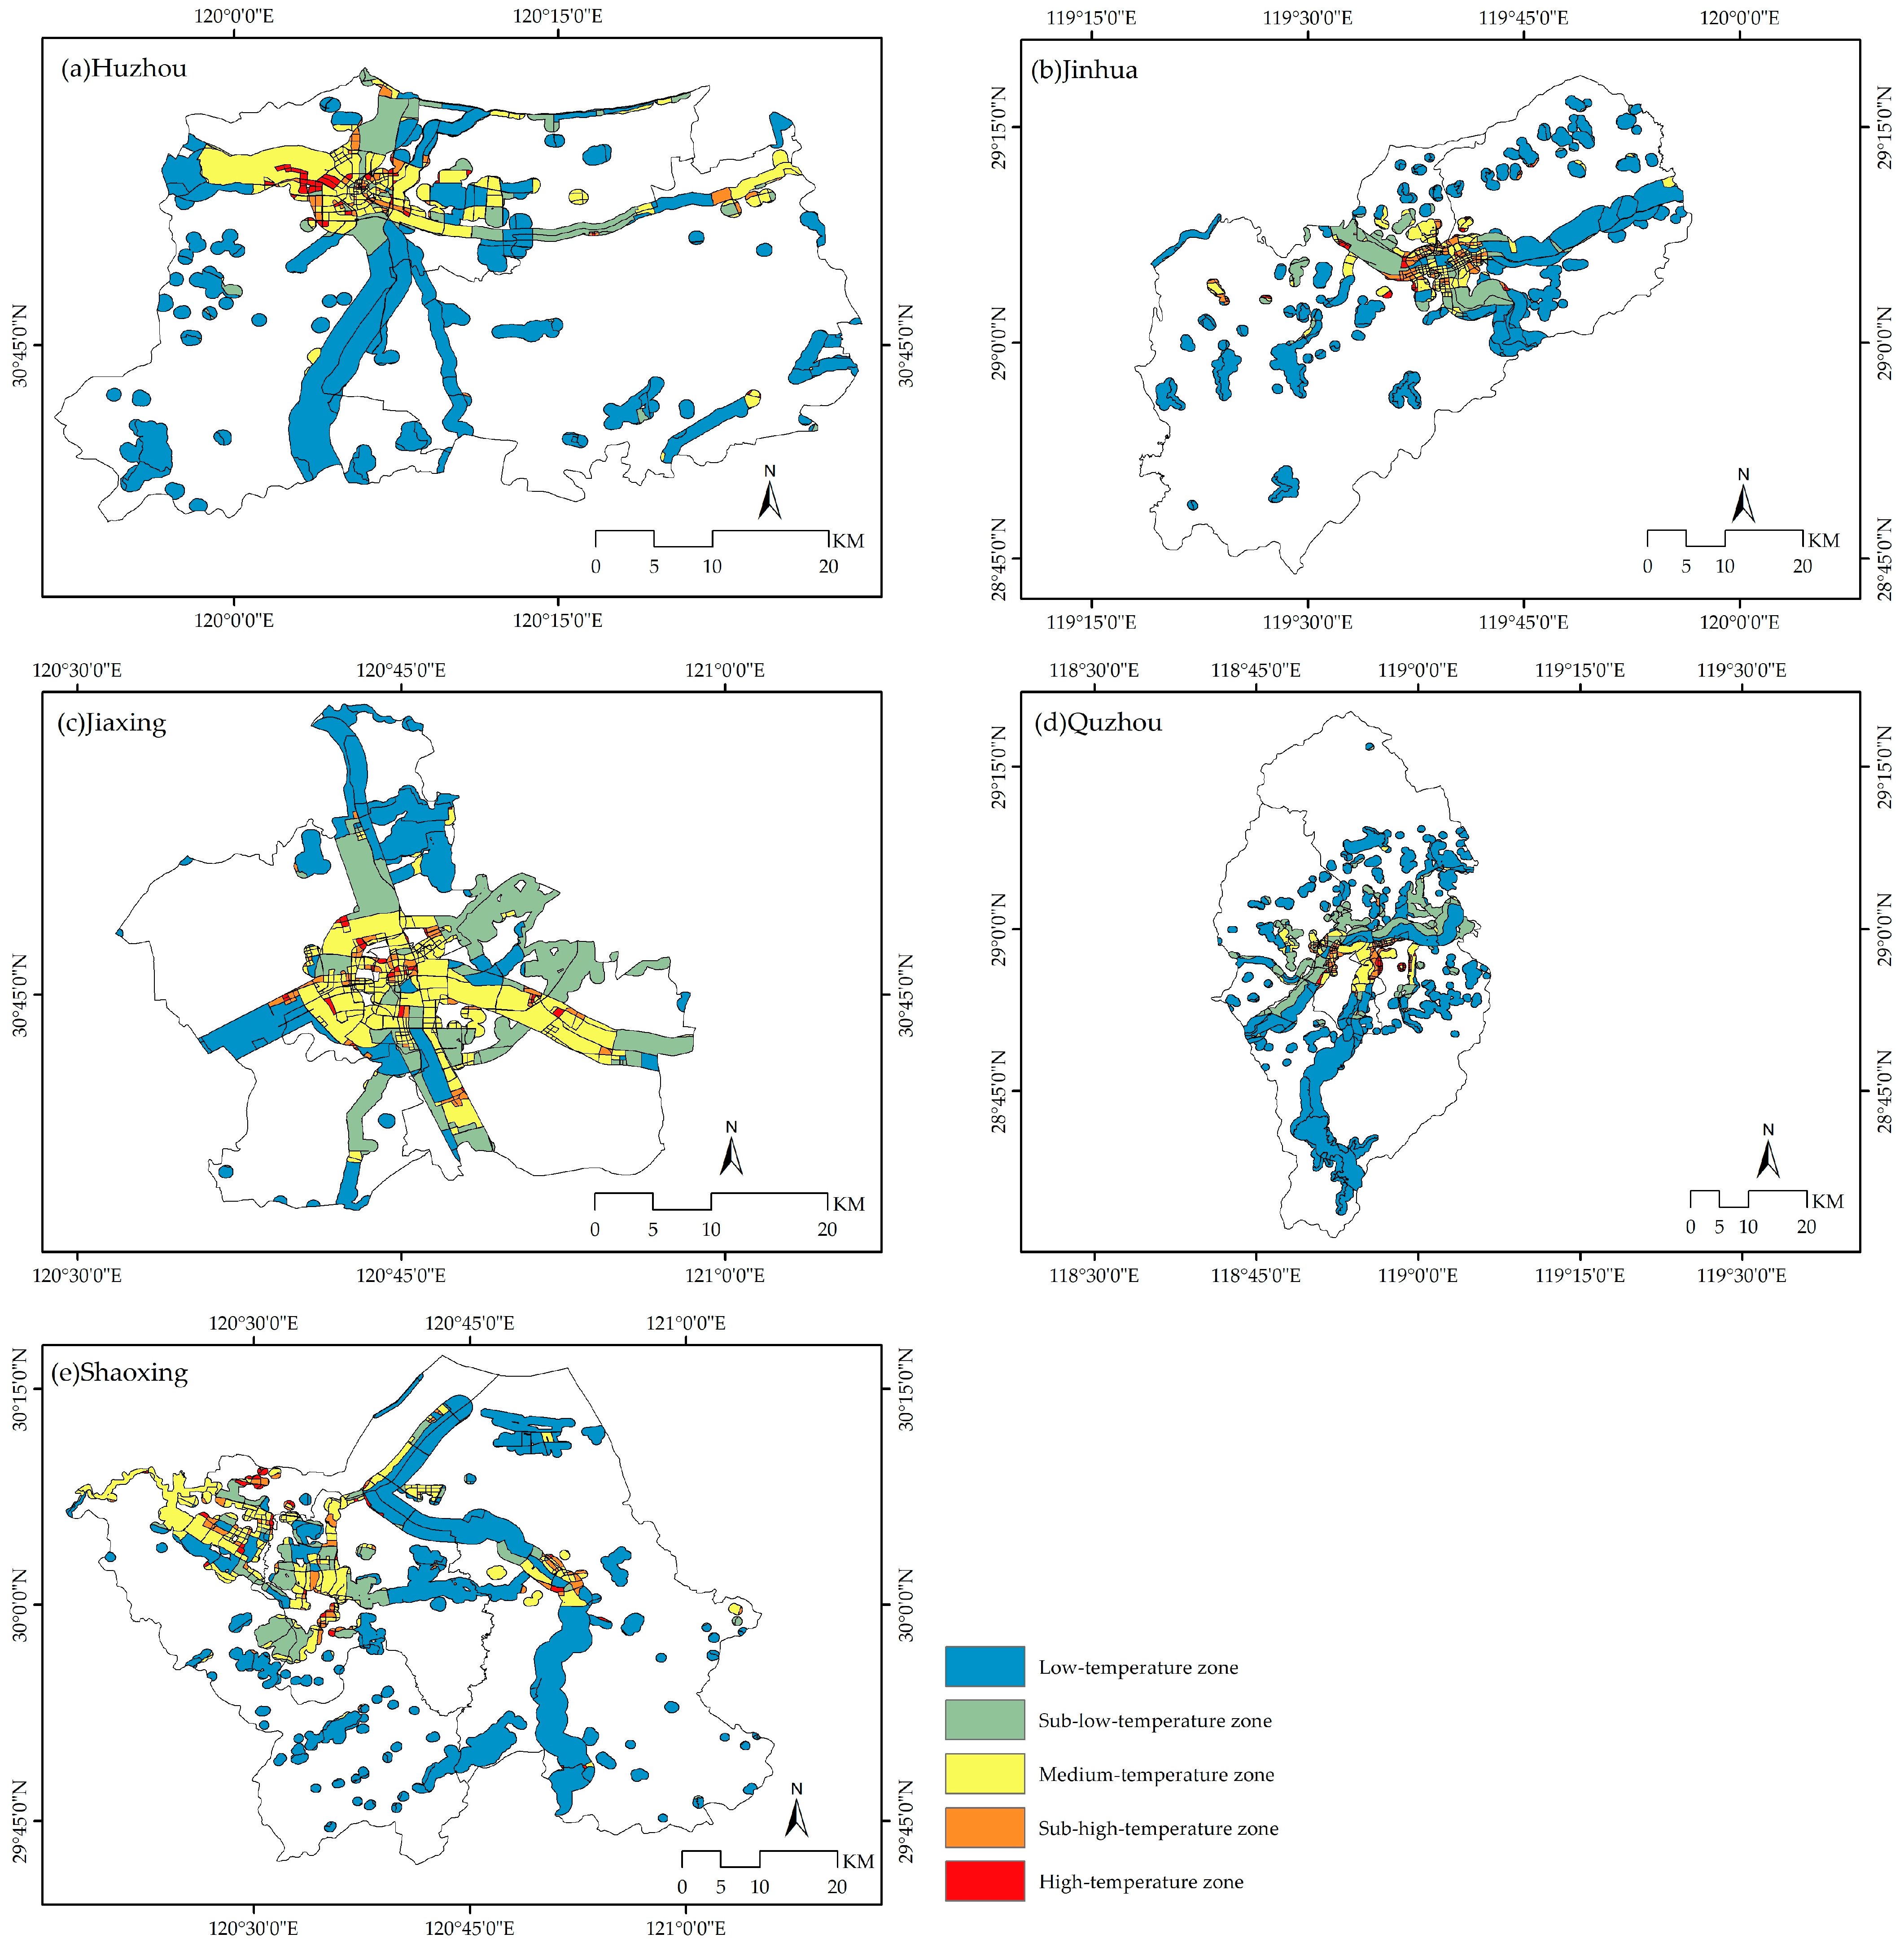
The distribution patterns of high-temperature and low-temperature zones within the buffer zones of the five cities vary by city (
Figure 5). In Huzhou and Jiaxing, the low-temperature zones primarily exhibit a concentrated and contiguous block-like distribution, whereas in Jinhua, Quzhou, and Shaoxing, both point-like and block-like distributions coexist. Additionally, the spatial distribution characteristics of the high-temperature and low-temperature zones differ: in Huzhou and Jiaxing, the high-temperature and low-temperature zones are more concentrated, while in Jinhua, Quzhou, and Shaoxing, the high-temperature and low-temperature zones are interspersed, demonstrating a higher degree of spatial integration.
This study analyzes the spatial distribution and temperature characteristics of the buffer zone areas in five cities in Zhejiang Province. The results are as follows: In Huzhou, the buffer zone area covers 400.66 km2, consisting of 886 basic analysis units, with an average unit area of 0.45 km2. The low-temperature zone accounts for 63.53% of the total buffer zone area, primarily distributed along the southern section of the Laolongxi River. In Jinhua, the buffer zone area is 451.70 km2, including 1062 basic analysis units, with an average unit area of 0.43 km2. The low-temperature zone occupies 68.81% of the area, with its spatial distribution mainly concentrated in the eastern section of the Yiwu River, the southern section of the Wuyi River, and near the Jinlan, Jiufeng, and Andi Reservoirs. In Jiaxing, the buffer zone area is 375.24 km2, composed of 916 basic analysis units, with an average unit area of 0.41 km2. The low-temperature zone covers 65.05% of the total area, primarily distributed in the northern and western sections of the Grand Canal and around the Xiangjiadang area. In Quzhou, the buffer zone area spans 644.57 km2, consisting of 903 basic analysis units, with an average unit area of 0.71 km2. The low-temperature zone constitutes 70.24% of the area, concentrated in the western section of Jiangshangang River, the southern section of the Wuxi River, and around Xianxia and Jiulong Lakes. In Shaoxing, the buffer zone area totals 730.53 km2, with 1076 basic analysis units and an average unit area of 0.68 km2. The low-temperature zone comprises 64.74% of the total area, with a spatial distribution primarily along the Cao’e River and surrounding the Xiaoshun and Pingshui Reservoirs. The above analysis highlights the proportion and spatial distribution of low-temperature zones in the buffer zones of different cities, providing data support for further studies on the cooling effects of water bodies.
4.3. The Contribution Rate of Water Body Morphology Indicators to Cooling Effect
Table 4 presents the evaluation of the predictive effect of the GBDT model across five cities, using quantitative metrics to assess its accuracy. The evaluation metrics include MSE, RMSE, MAE, and MAPE, with lower values indicating higher prediction accuracy. The comparison reveals that Shaoxing exhibits the lowest values across all metrics, indicating the highest prediction accuracy, whereas Jinhua shows relatively higher metric values, reflecting slightly lower accuracy. Overall, the evaluation metrics for the GBDT model remain consistently low across all cities, demonstrating minimal prediction error and high precision.
The contribution rate of urban water body morphology indicators to cooling effects is analyzed for five cities using a GBDT regression model (
Figure 6). The results revealed significant variations in the influence of water body morphology indicators on cooling effects across different urban buffer zones.
In Huzhou, the WED contributed most significantly to cooling effects, accounting for 29.70%, while the WPLAND, WLSI, and WLPI are relatively balanced, each exceeding 17.3%. This indicates that water body edge characteristics are critical to cooling effects in Huzhou. A higher edge density reflects longer and more complex water body boundaries, which increase contact with the surrounding environment, thereby enhancing heat exchange and evaporative cooling.
In Jinhua, WLSI and WED emerge as the primary morphology indicators, collectively contributing 54% to cooling effects. The combined influence of WLSI, WPLAND, and WED reached 70.4%. The dominance of WLSI and WED suggests that Jinhua’s water bodies exhibit complex shapes and relatively long boundaries, enhancing their edge effects. This characteristic highlights the critical role of water bodies in regulating microclimates and delivering essential ecosystem services while also reflecting urban planning priorities that prioritize naturalistic design and the strategic optimization of water resource distribution.
In Jiaxing, WED and WPLAND are the dominant morphology indicators, jointly contributing 61.8% to cooling effects. This finding highlights the extensive distribution and complex morphology of water bodies in Jiaxing, which play a critical role in mitigating urban heat islands.
In Quzhou, WED is the most influential metric, contributing 25.5% to cooling effects, while other metrics have relatively balanced contributions. This suggests that prioritizing increased water body edge complexity could optimize surface temperature regulation and inform urban planning strategies in Quzhou.
In Shaoxing, WLPI and WED are the dominant indicators, accounting for a combined 55% of cooling effects, while the combined influence of WLPI, WED, WPLAND, and WLSI reach 85.3%. This indicates that Shaoxing’s water bodies not only exhibit complex edge characteristics but also include large core patches. Such features enhance both edge effects and heat regulation capabilities, while the presence of large water bodies significantly improves regional microclimate regulation and ecosystem service provision.
In summary, the dominant water body morphology indicators influencing cooling effects vary across different cities. All six water body morphology indicators significantly contribute to the reduction in surface temperatures in urban buffer zones. Among the five cities, WED, WPLAND, WLSI, and WLPI exert a relatively larger impact on cooling effects, whereas WPD and WNP have a comparatively smaller influence. Furthermore, there may be synergistic effects between different morphology indicators, with their combined contribution to cooling effects being substantial. These findings provide scientific evidence for optimizing urban water body planning to effectively mitigate urban heat island effects.
5. Discussion
In studies on urban cooling effects, vegetation is commonly regarded as a typical cooling factor. As a result, most research integrates impervious surfaces or green spaces with thermal environments, utilizing indicators such as vegetation coverage and vegetation indices to explore the relationship between vegetation and thermal conditions. Studies have shown a significant negative correlation between vegetation and thermal environments; however, the cooling effect of vegetation is highly influenced by its growth cycle. In contrast, water bodies exhibit greater stability, and their cooling effects are equally significant. Currently, research on the cooling effects of water bodies primarily focuses on the fields of meteorology and geography.
This study focuses on five representative heat island cities in Zhejiang Province, integrating urban water body buffer zones and road networks to divide the buffer zone into several basic analytical units. This approach offers a new possibility for water environment infrastructure renovation within smaller-scale block units while also highlighting the limitations of existing research that typically uses administrative boundaries or standard grids as units of analysis. At the scale of basic analysis units, we explore in depth the relationship between water body morphological (such as area, boundary complexity, and distribution pattern) and its actual cooling effect.
Urban water bodies have been widely recognized for their significant role in reducing both the maximum and average LST in cities. This study further investigates the cooling effects of water bodies within urban buffer zones. The results indicate that the average land surface temperature in urban buffer zones is at least 0.63 °C higher than that in the central urban areas. This phenomenon is not only related to the size of the buffer zones but is also significantly influenced by the spatial structure and expansion patterns of the urban areas.
Urban buffer zones are typically associated with increased construction activities, particularly in riverine areas, a trend that is particularly evident in the five study cities of Zhejiang Province. For example, in Huzhou, urban development is concentrated on both sides of the Ditang River, forming a distinct linear spatial structure; in Jinhua, the core development area is centered around the confluence of the Wuyi, Yiwu, and Wu Rivers; in Jiaxing, urban expansion is focused along the banks of the Grand Canal, driving economic development; in Quzhou, the urban center is located at the junction of the Qu and Wuxi Rivers; and in Shaoxing, urban development predominantly extends along both sides of the Cao’e River. These river-centered development patterns underscore the significant role of water bodies in the urban expansion process and simultaneously influence the spatial distribution characteristics of their cooling effects.
The selection of water body morphology indicators is crucial for identifying the key factors that contribute to the cooling effects of water bodies. This study selects six representative water body morphology indicators, among which the WLSI, WED, WPLAND, and WLPI are found to have particularly significant impacts on the urban thermal environment. Based on a comparative analysis of the relationship between water body morphological and cooling effects in the urban buffer zones of different cities, targeted optimization strategies are proposed: In Huzhou and Quzhou, emphasis should be placed on optimizing water body morphological and spatial layout, such as increasing boundary length by incorporating curved, irregular shapes, creating branch channels or connecting multiple water bodies to form a network structure, and restoring naturalized riverbanks to replace linear, hardened boundaries. Additionally, wetlands and vegetative buffer zones should be integrated to enhance boundary complexity. In Jinhua, improving the diversity and complexity of water body boundaries, such as designing irregular, curved forms, introducing wetlands, islands, and shoals, and dividing large water bodies into interconnected small polygonal water bodies, would further optimize the water body structure. In Jiaxing, it is recommended to combine wetlands, islands, and vegetative buffer zones along water body edges while designing large, contiguous water bodies or aggregating adjacent water bodies to increase overall area and connectivity. In Shaoxing, aggregating smaller, scattered water bodies into larger water body clusters or constructing a connected water network would enhance the continuity and scale benefits of water bodies. Moreover, all cities should optimize land use around water bodies, such as integrating green spaces and wetlands, expanding the ecological function zones of water bodies, and preserving naturalized boundaries to improve the climate regulation functions of water bodies.
The study also indicates that the high-temperature zones within the urban buffer zones of the five cities are primarily concentrated in commercial and residential districts, which are typically located in the city’s core areas. Based on the administrative boundaries and recommended water body optimization indicators—such as spatial distribution, morphological characteristics, connectivity, and functional requirements—coupled with the basic analytical unit scale, a further refinement of water body layout design and management is possible. This approach can enhance the cooling effects of water bodies within urban buffer zones, providing scientific support for mitigating urban thermal environments.
However, the study has certain limitations. Future research will focus on two key areas of improvement: first, exploring the threshold effects of urban water bodies on temperature reduction; second, employing partial dependence plots to analyze the nonlinear relationship between water body morphology and cooling effects. These enhancements will enable more detailed analyses of urban water bodies’ cooling potential and support the development of optimization strategies under specific threshold conditions.
6. Conclusions
This study, utilizing multi-source remote sensing data and the GEE platform, aims to estimate urban LST and land use classification while selecting six representative water body morphology indicators. Using the GBDT model, the research analyzes the cooling effects of water bodies in five typical UHI cities within Zhejiang Province. Additionally, the study examines the interactions between water body morphology indicators and LST across various urban buffer zones. The key findings are as follows:
- (1)
Water bodies in the central urban areas of all five cities exhibit significant cooling effects, with Jiaxing and Quzhou demonstrating particularly notable reductions in maximum LST by 6.83 °C and 6.36 °C, respectively. In comparison to built-up areas, the average LST reduction in water bodies exceeds 5.13 °C in each city.
- (2)
The average LST in the buffer zones of the five cities is at least 0.63 °C higher than that in the central urban areas.
- (3)
In Huzhou and Jiaxing, high-temperature and low-temperature zones are relatively concentrated, whereas in Jinhua, Quzhou, and Shaoxing, these zones exhibit an interwoven distribution, indicating a higher degree of spatial integration.
- (4)
Among the water body morphology indicators, WLSI, WED, WPLAND, and WLPI have the most pronounced impact on cooling effects, while the WPD and WNP show relatively minor influences.
This study provides a theoretical foundation for understanding the cooling effects of water bodies in five cities in Zhejiang Province and offers valuable insights for the planning of water bodies and the optimization of thermal environments in other similar urban settings. Furthermore, the methodology for analyzing water body morphology indicators using remote sensing data holds broad potential for assessing cooling effects in urban environments across different cities.


