1. Introduction
Ice processes in mountain rivers during the cold season differ significantly from those in flatland rivers. This is primarily due to the gradients of the channels, which exceed 1% in mountain rivers. This leads to high flow velocity and turbulence, which is intensified by the irregularities of the riverbed, composed of cobbles and boulders. In such rivers, a continuous ice cover does not form in winter. Instead, shore ice forms along the edges of the flow near the banks, occupying a significant part of the channel width. When the air temperature falls below 0 °C, and under turbulent conditions, the water becomes supercooled, and frazil ice forms in the water, while anchor ice forms on the riverbed. During prolonged cold spells and at shallow stream depths, anchor ice can rise above the water surface, forming ice weirs and dams. As a result, the water level rises without any increase in discharge. The channel profile becomes stepped, and the flow velocity decreases. Water spills over the banks and floods adjacent floodplain areas. Further development of channel processes can follow two scenarios: (1) the water partially erodes the ice dams, and the accumulated water gradually drains, forming a prolonged, low-height, low-discharge flood downstream; (2) a sudden failure of one of the dams occurs, causing a sequential failure of downstream dams, leading to an avalanche-like increase in flow height and discharge. The water flow becomes saturated with ice debris from destroyed weirs and shore ice. Usually, the first scenario occurs, which disrupts the operation of hydraulic structures. The second scenario is much rarer but far more dangerous, as it destroys structures located in the riverbed and on its banks and can result in human casualties.
The processes of frazil ice, anchor ice, and ice dams formation have been studied both in laboratories and in nature. In [
1], it was established that the greatest supercooling of non-distilled and non-saline water occurs when air temperatures are between −10 and −18 °C. Kerr et al. [
2], studying the processes of anchor ice formation, identified three stages. In [
3,
4], the growth rate of anchor ice was found to be 0.3 to 0.7 cm/h. Barrette [
5] reviewed laboratory studies on frazil and anchor ice formation processes since 1887, summarizing results from 80 publications. The review presents data on the influence of the air temperature, water cooling rate, and flow turbulence on ice processes.
Field studies have significantly improved knowledge about anchor ice formation processes. Hirayama et al. [
6] conducted research on a small gravel stream in Hokkaido, Japan. They showed that the growth of anchor ice increases with the increase in the sum of hourly freezing air temperatures. Stickler and Alfredsen [
7] studied anchor ice in rivers in Canada and Norway. Kempema and Ettema [
8] studied anchor ice on the Laramie River, USA. Dubé et al. [
9] investigated the characteristics of anchor ice and ice dams on the Montmorency River, Canada. Cheng et al. [
10] showed the importance of thermodynamic conditions for ice formation in water flows. They found that the cumulated seven-day average daily air temperature and the minimum air temperature are the most important.
A conceptual model presented in [
11] establishes a relationship between the morphology of a river section and the typical ice processes that can occur along that section. Jasek [
12] studied anchor ice release on the Peace River, Canada. The studies showed that anchor ice release depends more on the hydrodynamic conditions of the flow than on the thermal influence of the sun. Nafziger et al. [
13] found a correlation between the increase in water depth during anchor ice formation and accumulated hourly air temperatures below 0 °C during their studies on rivers in New Brunswick, Canada. The growth rate of anchor ice ranged between 0.02 and 0.05 cm/°C-h.
One of the most comprehensive works on ice-induced floods is [
14]. It describes ice processes occurring in steep rivers with slopes of 1–7% under cool temperate continental climates. These processes differ significantly from those associated with floating ice cover in low-gradient riverbeds. During freeze-up, there is a transition from flat-channel morphology to stepped-pool morphology due to the formation of anchor ice dams. In [
15], the results of studies on ice dams in the Montmorency watershed, Canada are presented. The average buildup rate of an ice dam during freeze-up is about 1 cm/h. The average breaching rate of an ice dam is about 2 cm/h. Study [
16] provides a detailed overview of ice processes occurring in small and steep rivers in temperate regions. The authors classify small and steep rivers as those with a drainage area of 1 to 2000 km
2, a discharge of 1–1000 m
3/s, and a slope greater than 0.1%. In such rivers, anchor ice and ice dam formation are the dominant sources of ice-induced floods. The authors note that the failure of a single ice dam can cause a cascading effect of downstream dam failures and result in a damaging ice run.
Ghobrial et al. [
17,
18] studied the growth and release processes of anchor ice on the North Saskatchewan River in Edmonton, Canada, using an underwater camera. The linear rates of anchor ice growth ranged between 0.05 and 0.12 cm/°C-h. Total anchor ice thicknesses ranged from 6.1 to 15.4 cm, and crystal sizes ranged from 2.8 to 7.7 cm. It was found that ice dams primarily form in places where large boulders protrude from the water. The thickness of anchor ice dams was 2–3 times greater than the thickness of ice on flat sections of the river. It was noted that an increase in air temperature and solar radiation can significantly reduce ice strength. This conclusion is supported by field observations of ice strength, as reported in [
19]. Field measurements indicated that ice strength decreases at a rate of approximately 7% per degree as the temperature increases from −15 to −5 °C, and decreases by approximately 15% per degree within the range from −5 to −1 °C.
Rødtang et al. [
20] noted that traditional ice property measurements at specific points are unrepresentative in steep rivers. Therefore, it is recommended to use drones. Rokaya [
21] and Barrette et al. [
10] studied the impact of climate change on ice processes in rivers. In [
22], it was found that climate warming has reduced the duration of river ice cover by more than 30 days in some places over the past 100 years. By the end of the 21st century, this reduction may range from 7 to 17 days. The study analyzed 16 models of ice-related flood formation processes. All models included air temperature as an input parameter, but only five included precipitation, and only three accounted for solar radiation.
In Kazakhstan, specialized studies on the formation of anchor ice and ice dams on small and steep rivers have not been conducted. Ice phenomena on such rivers are recorded during standard observations at hydrometric stations of the National Hydrometeorological Service of Kazakhstan. These observations include measuring water levels relative to the “0” datum, as well as recording ice phenomena (shore ice, continuous ice cover, anchor ice, slush ice) without quantitative measurements. The formation of anchor ice and ice dams can only be inferred indirectly from sharp rises in water levels during cold spells with steady discharge.
The formation of anchor ice and ice dams attracted the attention of scientists in Kazakhstan after several occurrences of destructive water–ice flows in 1964, 1987, and 2006 [
23,
24,
25]. The first reports of water–ice flows in the Ile Alatau were found in [
26], which described winter floods on the Kishi Almaty River on 26 November 1896, and 23 December 1901, during extreme cold spells. Eyewitnesses of these events reported a high wave of water and ice that destroyed riverside structures and left piles of ice along the banks. In [
27], when describing mudflow events on mountain rivers in Kazakhstan, the possibility of “ice mudflows”, flows of a mixture of ice debris and water similar to debris flows, was noted. Yafyazova [
24] described a water–ice flow on 5 January 2006, on the Uzunkargaly River. The wave height reached 5 m, and the discharge exceeded 200 m
3/s. The volume of displaced ice mass was over 10,000 m
3. The author referred to this phenomenon as a “water-snow-ice flow”, considering it a variety of mudflows.
Stepanov [
25] extensively studied the processes of frazil ice, anchor ice, and ice dam formation on mountain rivers of the Ile Alatau. The processes he described closely resemble those found in studies from Canada, the USA, and Norway [
7,
8,
14,
15,
16]. The author emphasized the distinction between water–ice flows and floods, noting that in floods, the leading wave decreases downstream, while in water–ice flows, it increases. He also highlighted the important role of shore ice in forming water–ice flows. The study [
28] examined the recurrence of water–ice flows in the Ile Alatau from 1994 to 2010.
Thus, a water–ice flow is a short-term, intense flow of concentrated ice debris and water, similar to a mudflow. In the scientific literature, this phenomenon has not yet received a universally accepted name. The International Glossary of Hydrology [
29] does not include a term corresponding to this phenomenon. The glossary contains the term “water-rock flow”, which refers to “a mudflow with a predominance of coarse material in the mass”. Since the mechanism and manifestations of a water–ice flow are very similar to a mudflow in which the solid part is represented by ice, it is logical to refer to such a flow as a “water–ice flow”. V. Perov shares this view, classifying such phenomena as “para-mudflows” or “mudflow-like” events and referring to them as “water–ice flows” in [
30,
31]. Researchers in Kazakhstan [
24,
32] hold the same opinion. Therefore, we use this term in the present study.
The literature analysis shows that there is a lot of information about anchor ice, ice dams, and floods caused by them on the rivers of North America and Norway and very few publications about these phenomena on rivers in temperate mountainous regions. And there is no information about water–ice flows anywhere. The objective of this work is to share data on water–ice flow events in the mountains of Southeastern Kazakhstan, study the conditions of their formation, determine quantitative characteristics, and assess the possibilities of forecasting and early warning. The practical significance of this work lies in substantiating the need to take into account water–ice flows when assessing natural hazards and developing measures to reduce the risks of natural disasters.
2. Study Area
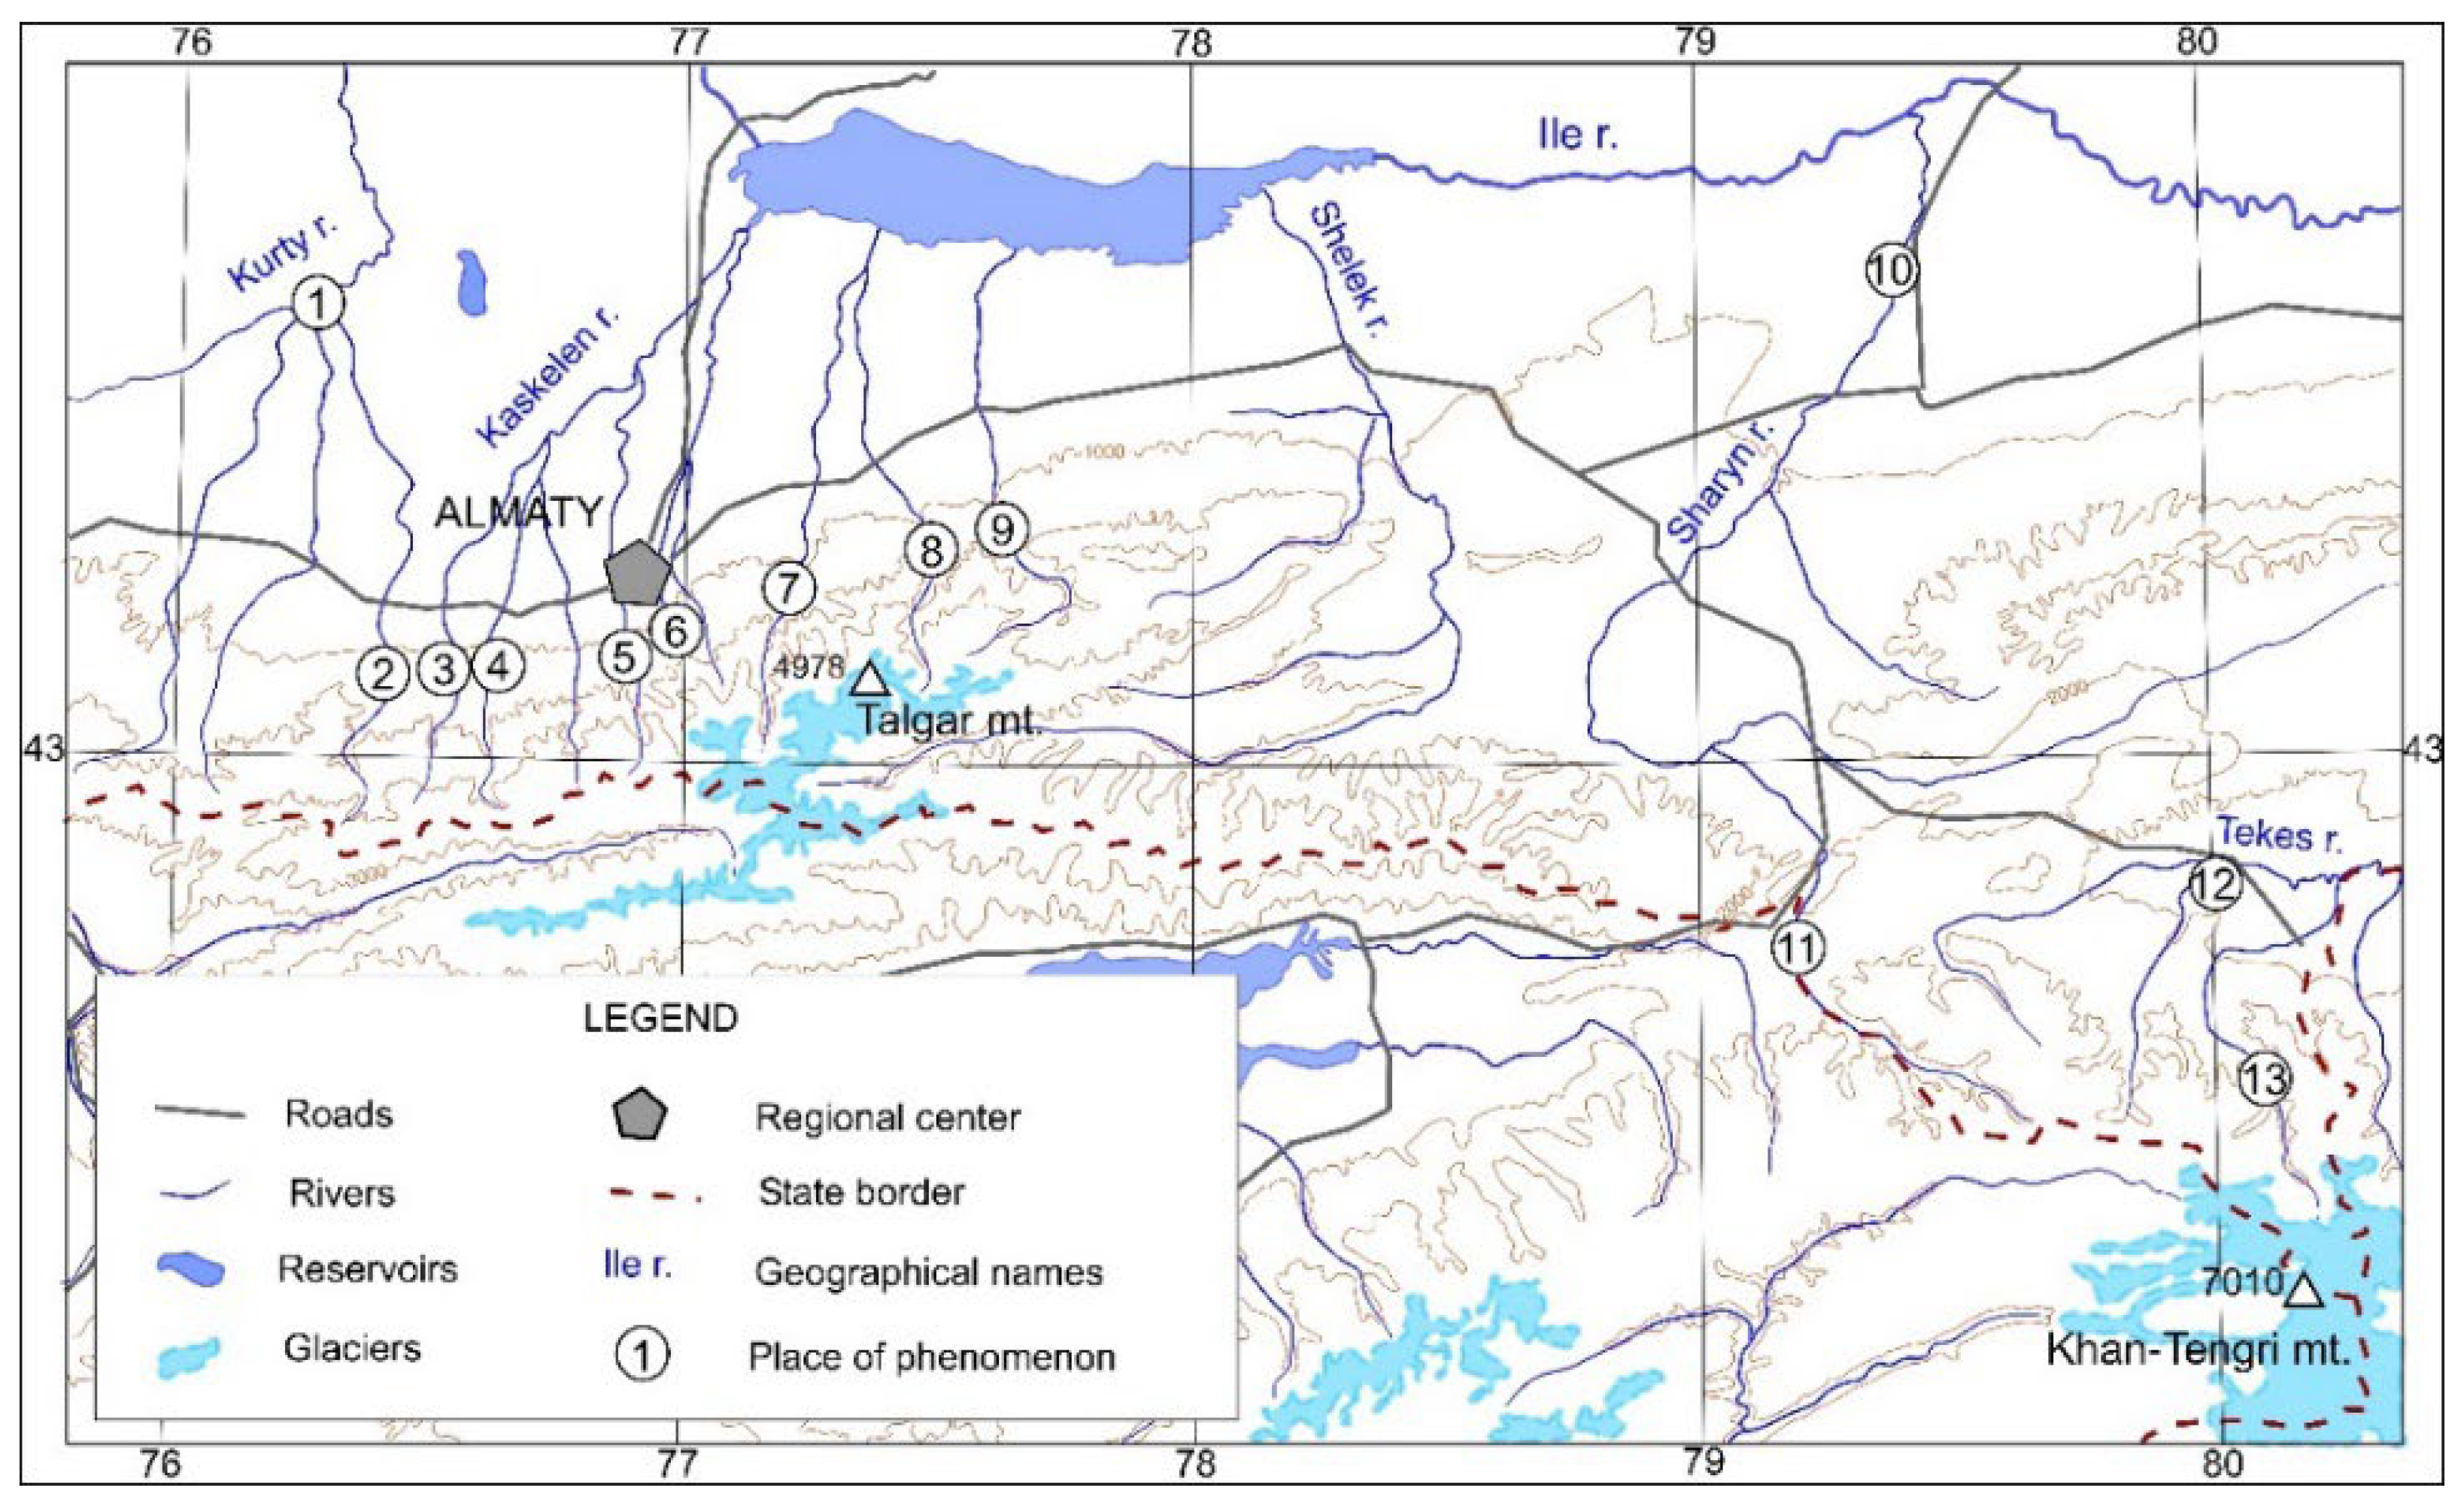
The research area is located in the Southeastern part of the Republic of Kazakhstan, between 76 and 80° E and 42.5 and 43.5° N (
Figure 1). It includes the Ile Alatau, Kungey Alatau, Terskey Alatau, and Ketmen mountain ranges, which are part of the Northern Tien Shan mountain system. Among these ranges, the Ile Alatau is the most studied regarding ice dams and water–ice flows, as the largest urban agglomeration in Kazakhstan, Almaty, with a population of about 3.5 million people, is located in its foothills. The natural conditions of the Ile Alatau are typical for all the ranges of the Northern Tien Shan, making this range representative of all the mountain ranges in Southeastern Kazakhstan.
The Ile Alatau range stretches for 150 km from West to East along 43° N. The height of the watershed is between 4100 and 4300 m, with its highest point being Talgar Peak at 4978 m. From the Northern slope of the range, rivers such as Uzunkargaly, Shamalgan, Kaskelen, Aksai, Ulken Almaty, Kishi Almaty, Talgar, Yesik, and Turgen flow southward. Many of these rivers have hydrological stations where water levels and discharge are measured. The locations of these stations are shown in
Figure 1. Data on water levels and discharges at these stations are available on the National Hydrometeorological Service of Kazakhstan website [
33].
All the rivers in the Ile Alatau fall under the category of small and steep rivers, as defined in [
16]. The catchment areas range from 130 to 640 km
2. The average gradient of the channel in the mountainous part is 7–12%, while in the lower reaches, before exiting the mountains onto the alluvial fan, the gradient is about 5%. The flow velocity of the rivers reaches 4–5 m/s. During the winter–autumn low-flow period, the discharge of most rivers is 1–3 m
3/s, while in summer, during glacier melt, the discharge can reach 20–30 m
3/s.
All the rivers have a mixed rain/glacier/groundwater source. Glaciers are present in the upper reaches of the rivers, with their tongues descending to an altitude of 3600 m. Glacial lakes are present in all valleys, and mudflow activity is observed along the entire length of the rivers. As a result, large boulder accumulations, up to 3 m in size, are typical in the riverbeds. These boulders, combined with steep gradients, create high flow turbulence. Therefore, even during harsh winters, a continuous ice cover is not formed on the rivers. Instead, shore ice forms along the banks, with ice thickness reaching up to 20 cm. During severe cold spells, frazil ice, anchor ice, ice jams, and dams are formed in the riverbeds.
The climate of the Ile Alatau can be described as moderately humid. All meteorological parameters vary significantly with altitude (
Table 1). In the foothills, the minimum air temperature during cold winters can drop below −40 °C, while in the hot summer months, it can rise above 40 °C. During the cold season, a temperature inversion is observed at altitudes between 1000 and 2000 m above sea level. The mean air temperature at 1000 m is 9 °C, while at 3000 m, it is −2 °C. On average, 600 mm of precipitation falls annually in the foothills, 800–900 mm in the mid-mountain zone, and more than 1000 mm in the high-mountain zone. Precipitation is unevenly distributed throughout the year, with the wettest months being March–April and October–November, while the driest season is late summer and early autumn.
The Kishi Almaty River has been the most thoroughly studied in terms of anchor ice dam formation and water–ice flows. It is also considered representative of all rivers on the Northern slope of the Ile Alatau. The river originates from the Tuyuksu Glacier at an altitude of 3450 m and exits the mountains at an altitude of 1140 m. The length of the river’s mountainous section is 18.7 km, with an average gradient of 12.3%. The average multi-year discharge before exiting the mountains in the summer months is 3.4–3.6 m3/s, and in winter, it is 0.9–1.2 m3/s.
At the mountain exit, the Kishi Almaty River splits into two branches. The gradient of the channel at this point is 4.8%. A watershed divide dam is constructed at the point of division. Above the dam, the Dam hydrological station is located, which is representative of the study area.
The right branch retains the name of Kishi Almaty, while the left branch, below the point of division, is called Esentai. Initially, these channels run parallel. Upon exiting the mountains at an altitude of 1060 m, they diverge, flowing, respectively, on the right and left sides of the alluvial–proluvial fan, which is 6.4 km long with an average gradient of 3.7%. In the upper part of the fan, the gradient is 4.5% for 4 km. In the mountainous section, the natural channel of the Esentai River is composed of rounded granite boulders, deposited by mudflows. The size of the boulders ranges from 30 to 80 cm, creating favorable conditions for the formation of anchor ice and ice dams during winter cold spells. After reaching the alluvial fan, the Esentai flows through the territory of the city of Almaty along an artificial channel with a concrete bottom and gabion walls. Then, 4 km from the apex of the fan, the Esentai channel is blocked by a dam designed to control floods. Before the dam, there is a sedimentation basin for solid deposits, measuring 115 by 100 m2.
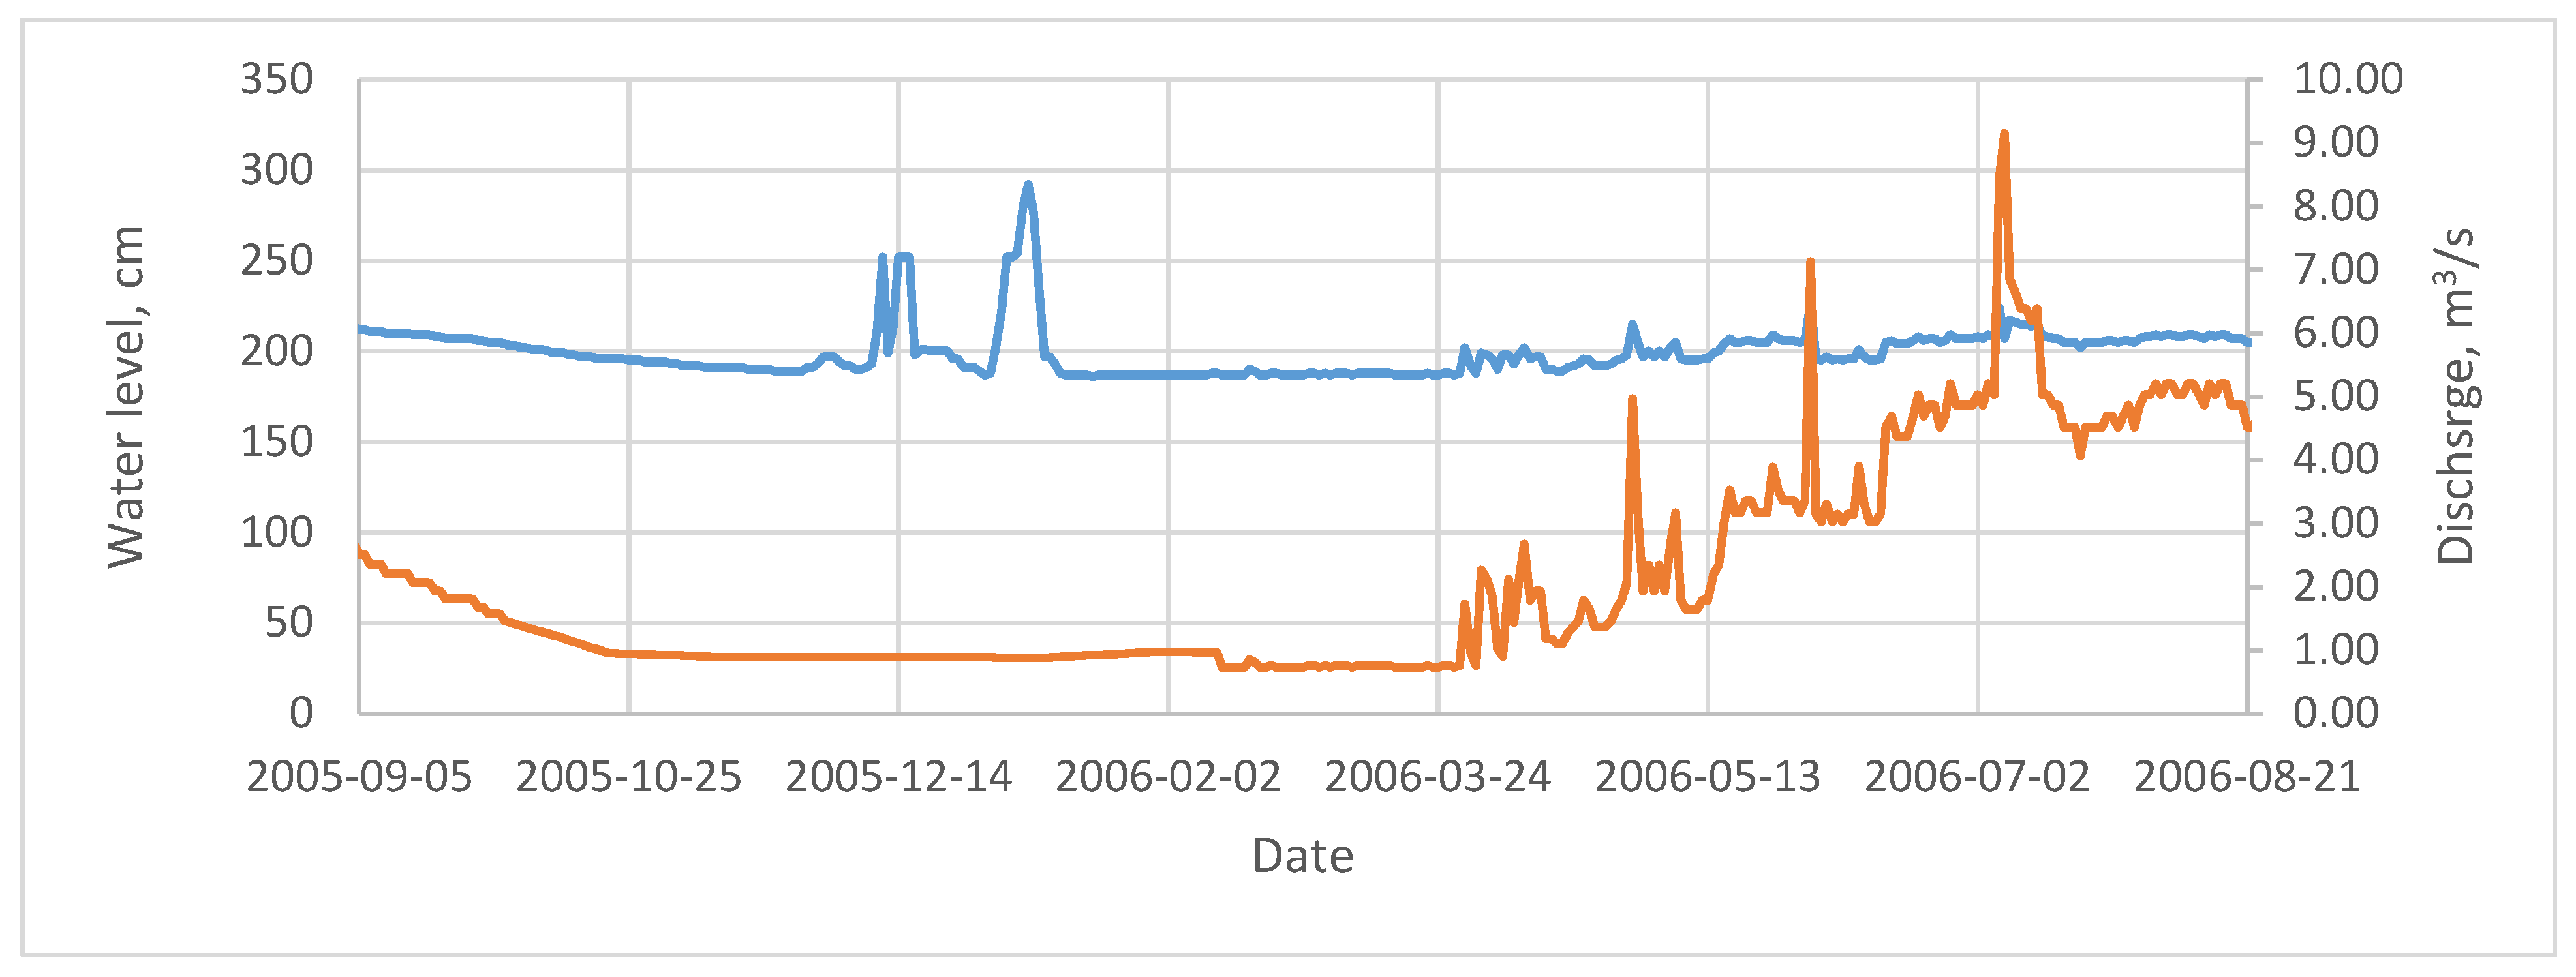
Figure 2 presents the annual hydrograph of the Kishi Almaty River at the Dam hydrological station. The hydrograph is characteristic of rivers where anchor ice dams are formed in winter, causing significant water level rises despite low discharge values. During the autumn–winter low-flow period, the river discharge remains stable at 0.7–0.8 m
3/s. The water level fluctuates around 190 cm from the reference “0” most of the time, with the actual depth of the flow being about 30 cm. During periods of severe cold spells, water levels rise by 60–100 cm, lasting from 7 to 15 days. This is due to the formation and subsequent destruction of anchor ice dams. In summer, discharge increases due to atmospheric precipitation and glacier melt. The average monthly discharge in July–August is approximately 5 m
3/s, with the water level exceeding the winter level by only 20 cm. Summer floods, caused by heavy rain, last for 1–2 days, with discharge reaching 9 m
3/s or more, but the water level rises by no more than 15 cm. Therefore, winter water level rises are more than six times greater than those in the summer.
Severe winter cold spells are associated with the intrusion of cold Arctic air masses, which cover large areas comparable in size to an entire geographic region, such as the Northern Tien Shan. In this region, temperature changes occur almost synchronously. Therefore, air temperature data from the climatological station in Almaty, located on the fan of the Kishi Almaty River, 6 km below the river’s exit from the mountains, are representative of the entire Southeastern Kazakhstan region.
3. Materials and Methods
This study used data on water–ice flows in mountain rivers on the Northern slope of the Ile Alatau range, which were published in scientific articles, available in the archives of Kazhydromet, and obtained by the authors during field research. A total of 34 water–ice flow events were analyzed. Data from the daily water level (H) at the Dam hydrological station (HS) on the Kishi Almaty River at an altitude of 1140 m and daily air temperature (T) at the Almaty meteorological station (MS) at an altitude of 844 m, which serves as the climatological station for the study area, were also used. The stations are located 6.5 km apart.
The Dam hydrological station is representative of the rivers on the Northern slope of the Ile Alatau. This is confirmed by the fact that, during all events of water–ice flows in the rivers of the Ile Alatau, water level rises related to the formation of ice dams were recorded at the Dam HS.
A cooling cycle is defined as a sharp drop in air temperature, followed by an equally sharp rise back to the previous level. The beginning of the cycle is the date on which the continuous decrease in temperature starts. The end of the cycle is the date when the continuous temperature rise ends after reaching its minimum value.
For analysis, all cooling cycles during which water–ice flows occurred, as well as all cases when the water level at the Dam HS rose by more than 10 cm, were selected. In addition, cooling cycles where the air temperature dropped below −10 °C were included.
For each cooling cycle from 1994 to 2024, based on data from the Almaty MS and the Dam HS, the following indicators were determined:
Duration of the entire cycle, days (D);
Deviation of daily air temperature from the multi-year mean, °C (dT);
Minimum daily air temperature, °C (Tmin);
Cumulative daily air temperatures for the entire cycle, °C (ΣT);
Mean air temperature for the cycle, °C (Tm);
Minimum cumulative daily air temperatures over 5 consecutive days, °C (ΣT5);
Maximum daily temperature drop, °C/day (Δ − Tmax);
Daily air temperature at which the water level began to rise, °C (Tr);
Cumulative daily air temperatures during the water level rise, °C (ΣTr);
Duration of the water level rise period, days (Dr);
Total water level rise, cm (Σ + ΔH);
Maximum daily water level rise, cm/day (+ΔHmax);
Interval between the date of the minimum air temperature and the date when the water level started to fall or a water–ice flow occurred, days (d);
Total water level drop, cm (Σ − ΔH);
Maximum daily water level drop, cm (−ΔHmax);
Increase in the mean daily air temperature from the date of minimum air temperature to the date when the water level began to fall or a water–ice flow occurred, °C (Σ+ΔT);
Maximum daily air temperature rise during the warming phase, °C (+ΔTmax).
Over the 30 years from 1994 to 2024, there were 82 cooling cycles (2–3 occurrences per winter). Of these, 22 cases involved water–ice flows. In 47 cases, water levels at the Dam HS rose by more than 10 cm, but no water–ice flows occurred. In the remaining 13 cases, cooling cycles occurred with minimum daily air temperatures below −10 °C, but the water level rose by less than 10 cm, and no water–ice flows occurred.
For each indicator, statistical characteristics were determined: the mean, standard deviation, coefficient of variation, maximum, and minimum values.
To assess the influence of meteorological conditions on the formation of ice dams and water–ice flows, a correlation analysis was performed.
Threshold values for the most important meteorological parameters for the formation of water–ice flows were determined using the Random Forest (RF) algorithm. Random Forest is a classification method that organizes a set of variables using decision trees. The data are grouped into clusters with similar characteristics, and threshold values are identified for classifying the data into specific categories. The algorithm is designed to automatically and repeatedly aggregate data into similar homogeneous groups. It can detect statistical relationships even in datasets with a limited number of variables. The professional data processing software package Statistica StatSoft, Russian language version 13.0, was used for this study [
34].
The longitudinal slope gradients of the Esentai River were measured using a Spectra Geospatial GNSS receiver model SP 85 (Trimble Inc., Westminster, CO, USA).
4. Results
4.1. Anchor Ice Dams
Mountain rivers on the Northern slope of the Ile Alatau, like those of all mountain ranges in Southeastern Kazakhstan, belong to the category of small and steep rivers [
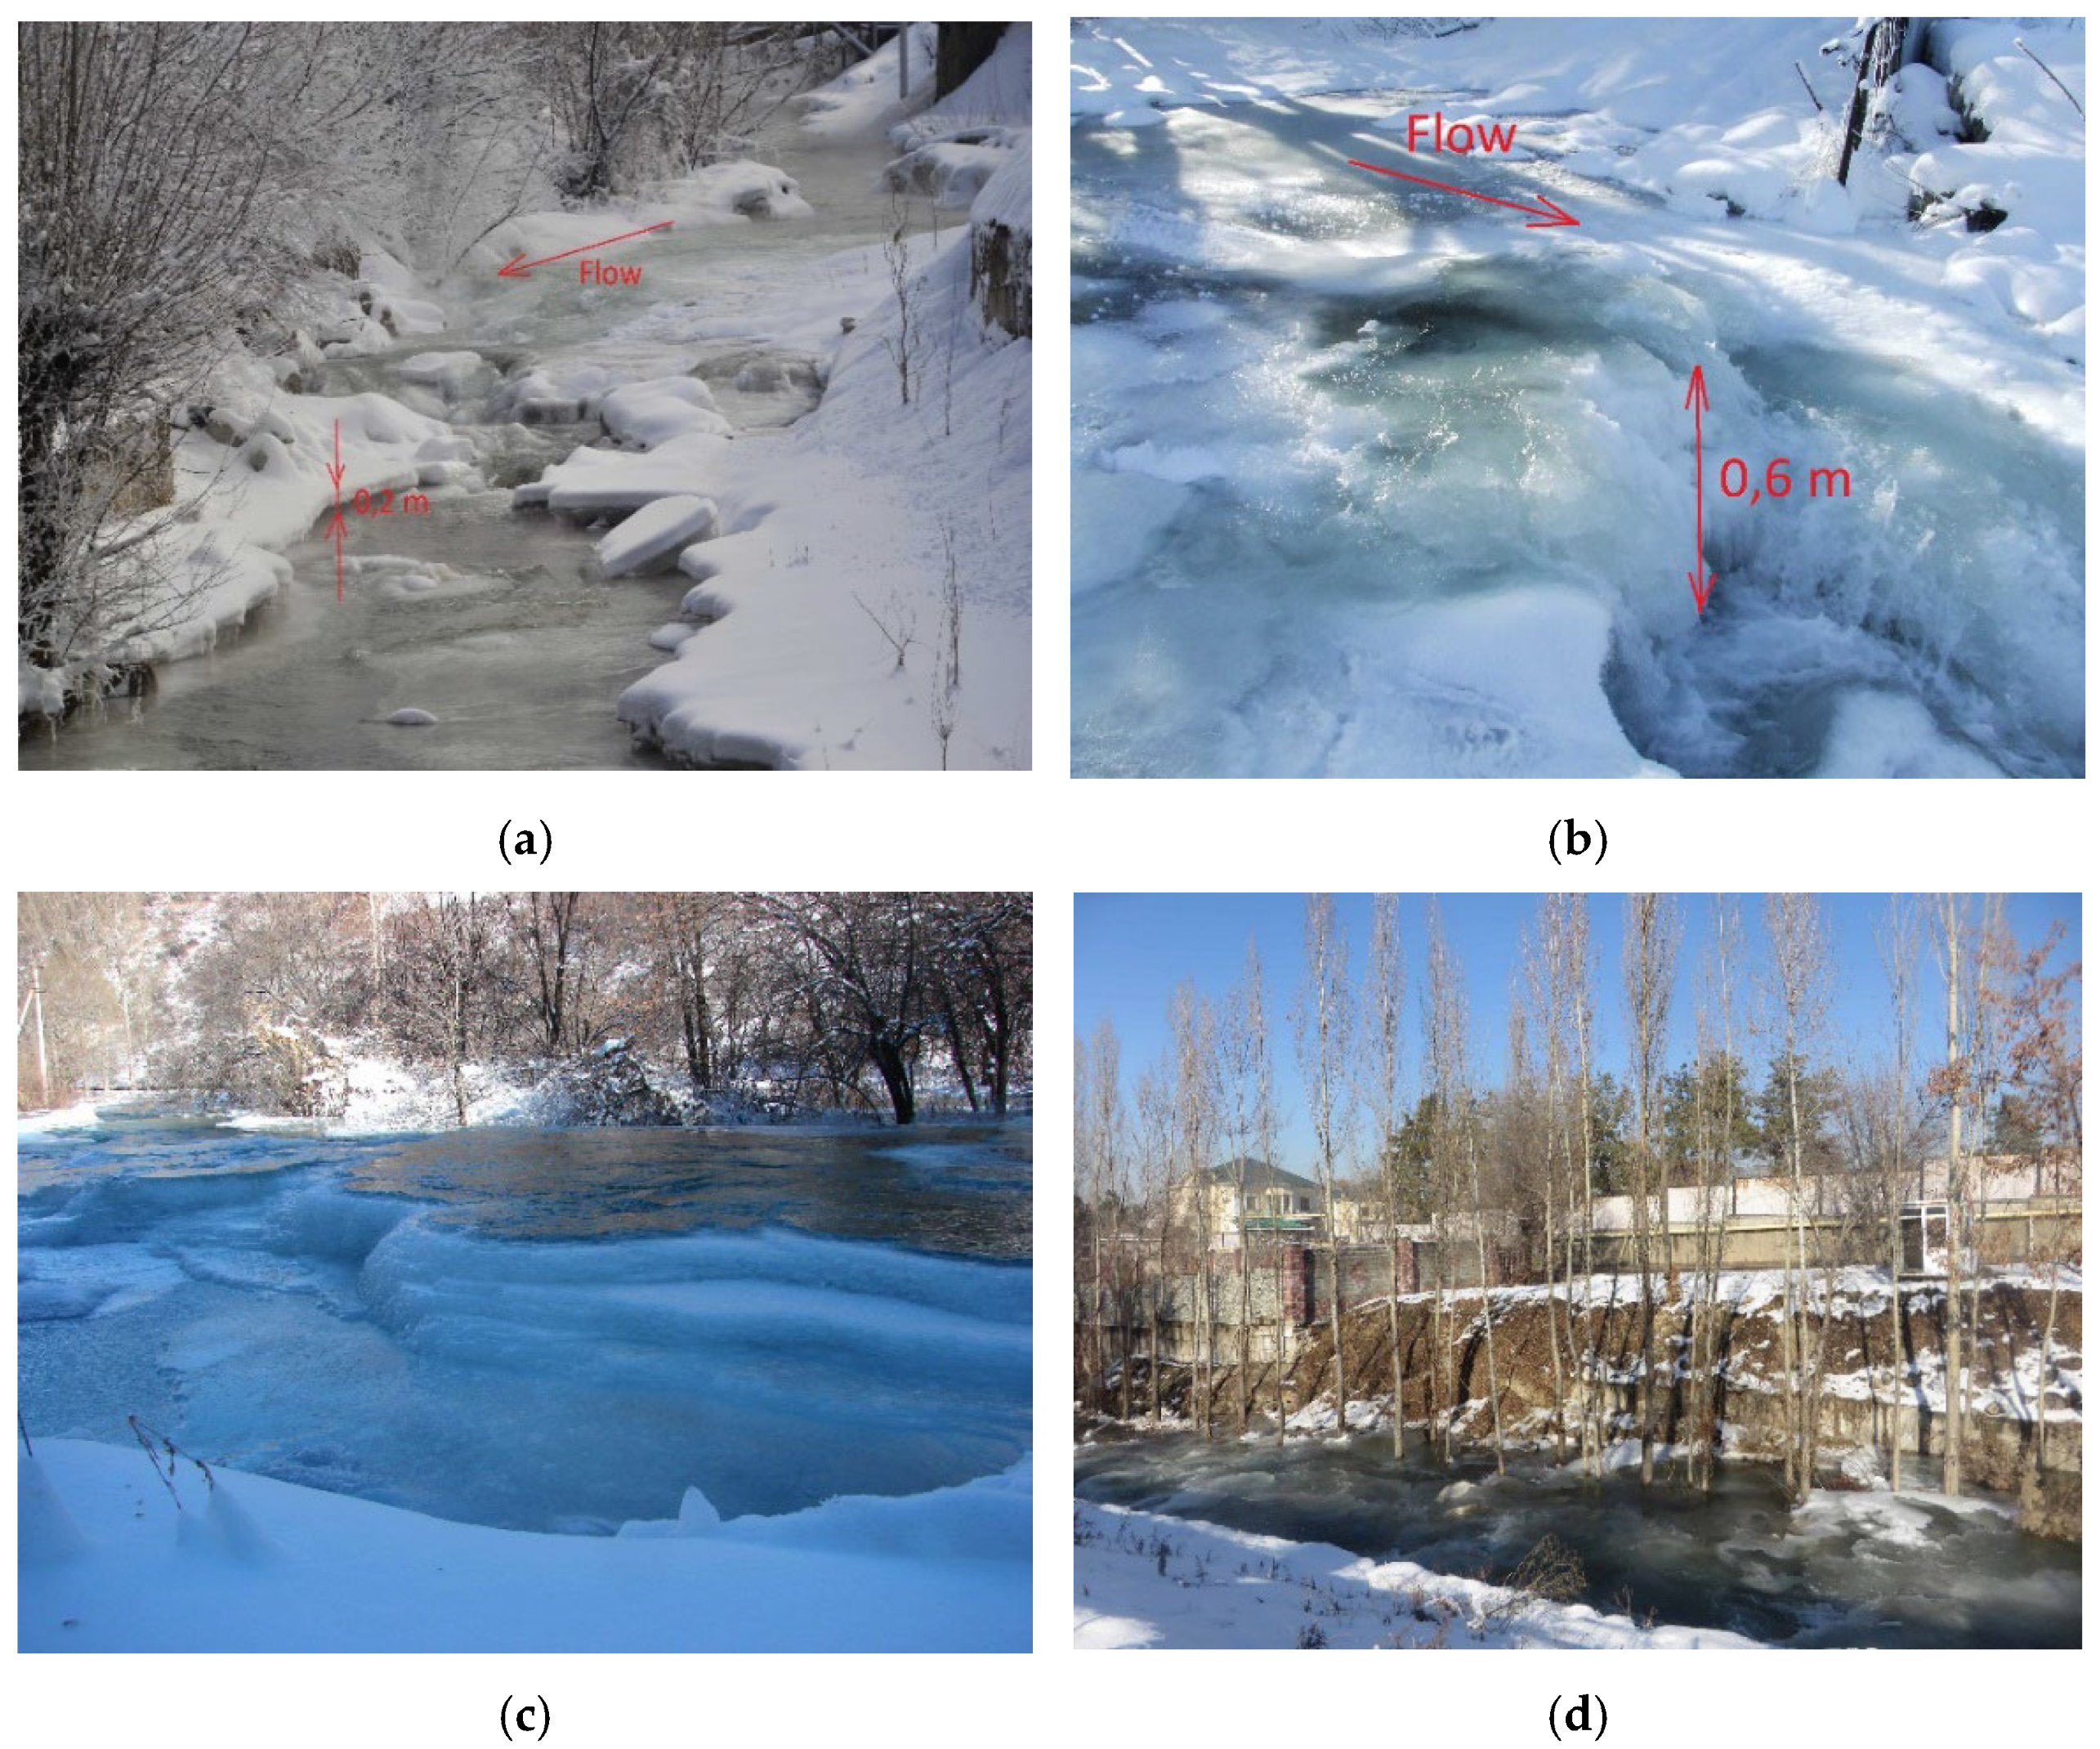
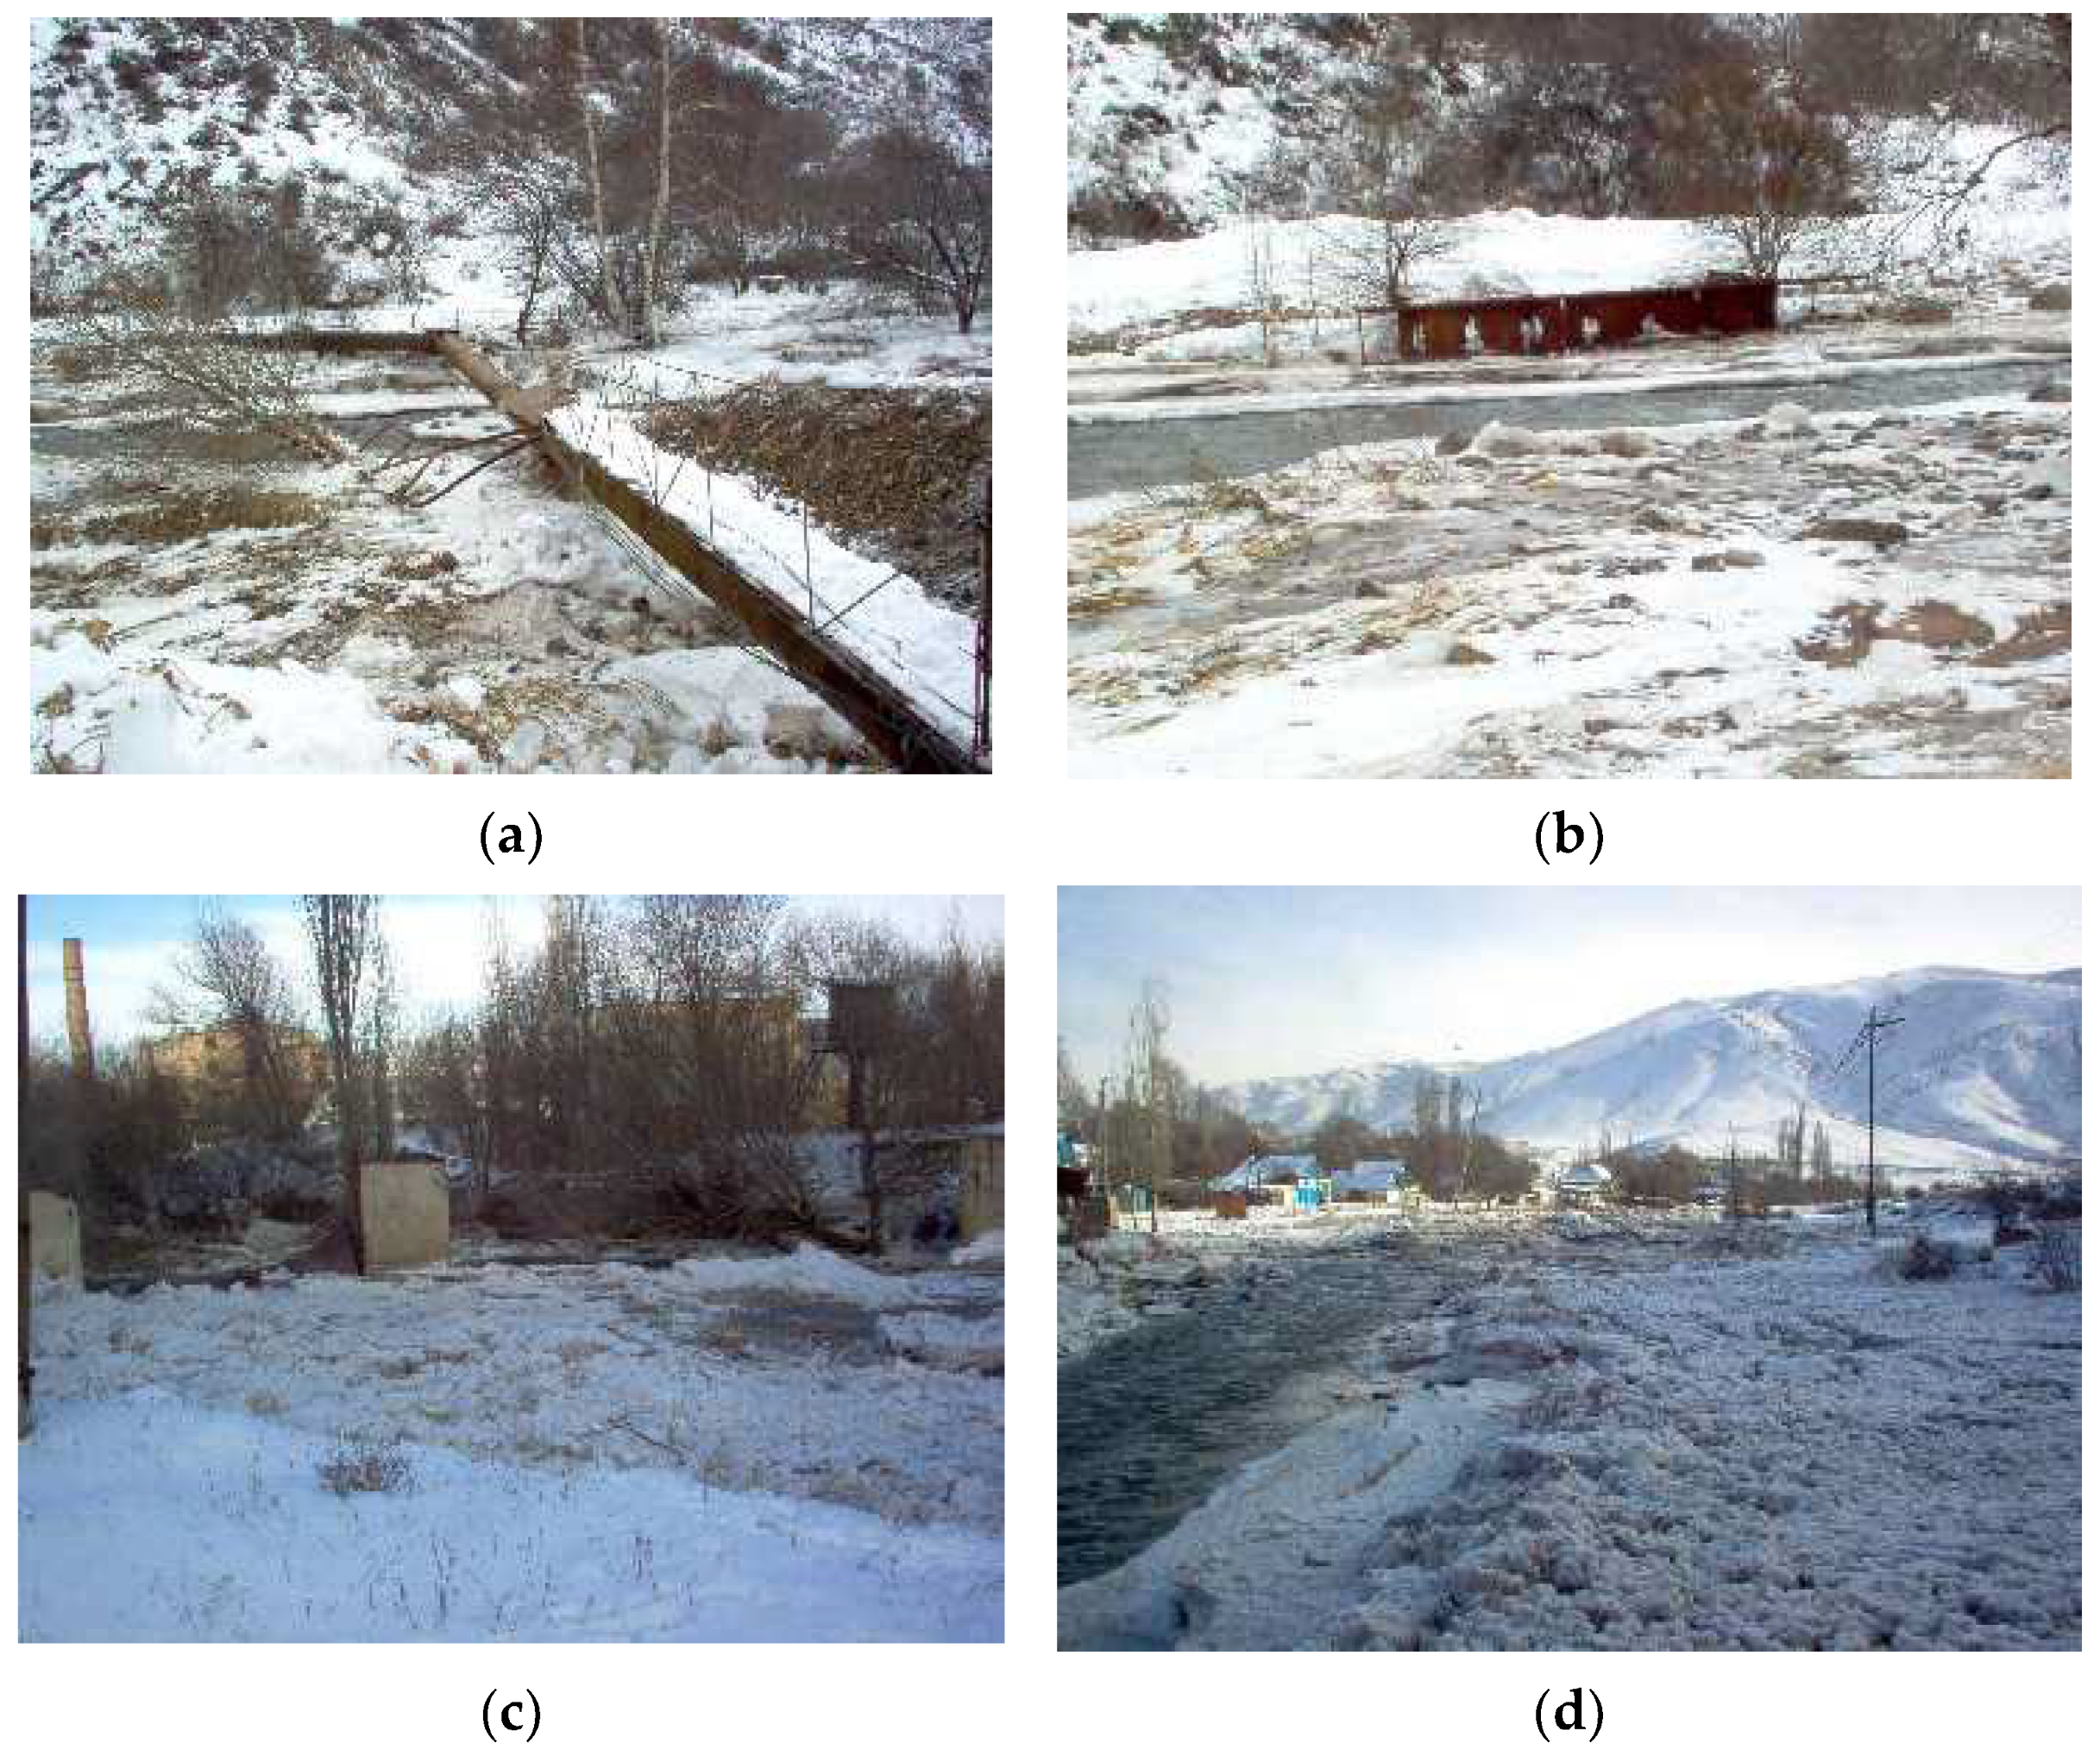
16]. Due to the high flow velocity (1–3 m/s) and the roughness of the riverbed, which is carved into mudflow deposits and composed of cobbles and boulders, the water flow exhibits high turbulence. In the moderately cold climate, with the mean winter air temperatures around −5 °C, a continuous ice cover is not formed on these rivers. Instead, as the cold period begins, shore ice is formed along the riverbanks, with ice thickness reaching 20–30 cm (
Figure 3a).
During severe cold spells, when the air temperature drops below −10 °C within 2–3 days, sometimes reaching as low as −25 °C, the water becomes supercooled. Anchor ice begins to form on the irregularities of the substrate, gradually growing into ice weirs, and later into ice dams (
Figure 3b,c). These processes dramatically alter the river’s morphology, creating a stepped profile with wide pools. As a result, the overall flow velocity decreases, further facilitating the growth of ice dams. The rise in water level leads to local flooding as the freezing water inundates adjacent floodplain areas (
Figure 3c).
The most favorable conditions for the formation of anchor ice and ice dams are found in the lower reaches of rivers, just before they exit the mountains onto alluvial fans (1000–1200 m). Here, the channel gradients decrease to less than 5%, though they remain steep enough to maintain flow turbulence. Additionally, during winter, due to the temperature inversion characteristic of the foothill zone (see
Table 1), air temperatures decrease with decreasing altitude. For example, the mean winter air temperature at the Almaty MS (844 m) is 3.1 °C lower than at the Kamenskoye Plateau MS (1317 m), while the mean summer temperature is 3.3 °C higher. During severe cold spells, the temperature inversion becomes even more pronounced. Thus, the zone between 1000 and 1200 m experiences the greatest cooling of the water flow with minimal turbulence.
The maximum water level rises in the mountain rivers of Southeastern Kazakhstan during winter, caused by the formation of anchor ice and ice dams, have been recorded at hydrological stations, reaching up to 153 cm (
Table 2). Outside of hydrological stations, water level rises of up to 3 m have been observed, such as on the Uzunkargaly River in the winter of 2008 [
32]. Daily water level increases can reach 80 cm. A typical example of a water level rise during cold spells due to anchor ice and ice dam formation is shown in
Figure 4.
When warming begins after a cold spell, the strength of ice in ice dams decreases [
19], causing water to break through. Since ice strength is greatest at the crest of the dams, breaches often occur in the lower sections of the dams [
14]. The water accumulated upstream the dams flows downstream, causing a flood. Typically, dam failures occur gradually, resulting in a flood that lacks significant power or destructive force. However, the flood complicates the operation of hydraulic structures and clogs water intake openings with ice debris and frazil ice. Occasionally, dam failures take on a cascading nature, leading to an avalanche-like increase in flood discharge [
17,
25]. At some point, the flood begins to break through shore ice. The water flow becomes saturated with ice debris, slush ice, and snow, forming a destructive mudflow-like flood with a leading wave up to 5 m high, a velocity of up to 10 m/s, and a discharge of more than 300 m
3/s. Such flows can cause significant material damage and loss of life [
23,
24,
25,
26,
27].
4.2. Meteorological Conditions for the Formation of Anchor Ice Dams
Winter cold spells in Southeastern Kazakhstan, during which anchor ice and ice dams are formed, leading to water level rises in mountain rivers, occur 2–3 times each winter. From 1994 to 2024, there were 82 such cold spells. These events typically occur from late November to mid-February, with the majority (80%) happening in December and January. The period from the onset of the cold spell until the air temperature returns to its previous level is referred to as a cold cycle.
Table 3 provides statistical characteristics of cold cycles in the Ile Alatau from 1994 to 2024, based on data from the Almaty MS and the Dam HS.
The average duration of a cold cycle is 9 days. The minimum daily air temperature during a cycle can drop to −25.2 °C, with the temperature potentially decreasing by 19.1 °C in one day. The cumulative daily air temperatures throughout the cold cycle can reach −186.3 °C. Water level rises mid-cycle and drops at the end of the cycle can be as much as 106 cm. The maximum daily water level rise is 61 cm, while the maximum daily drop can reach 106 cm. The water level typically begins to fall three days after warming starts, once the daily air temperature has increased by 8.5 °C from the minimum.
For all cold cycle indicators, a high coefficient of variation (>0.3) is observed, which is typical for hydrometeorological parameters. The variation coefficient exceeds 0.5 for the daily air temperature anomaly (dT), the cumulative temperature during the cold cycle (ΣT), and most warming period indicators.
The cumulative daily air temperatures during the water level rise have the most significant impact on the overall water level increase during cold spells (
Figure 5). The correlation coefficient of this dependence is 0.71, and it is approximated by the following equation:
where Δ
H is the water level rise at the Dam HS (cm), and
ΣT is the cumulative daily air temperatures at the Almaty MS (°C without sign “minus”).
Many researchers note the dependence of the growth rate of anchor ice on air temperature [
17,
18]. It was found that the daily water level rise at the Dam HS depends on the daily air temperature at the Almaty MS during this period (
Table 4). The obtained growth rates align with data from other studies [
13,
17,
18].
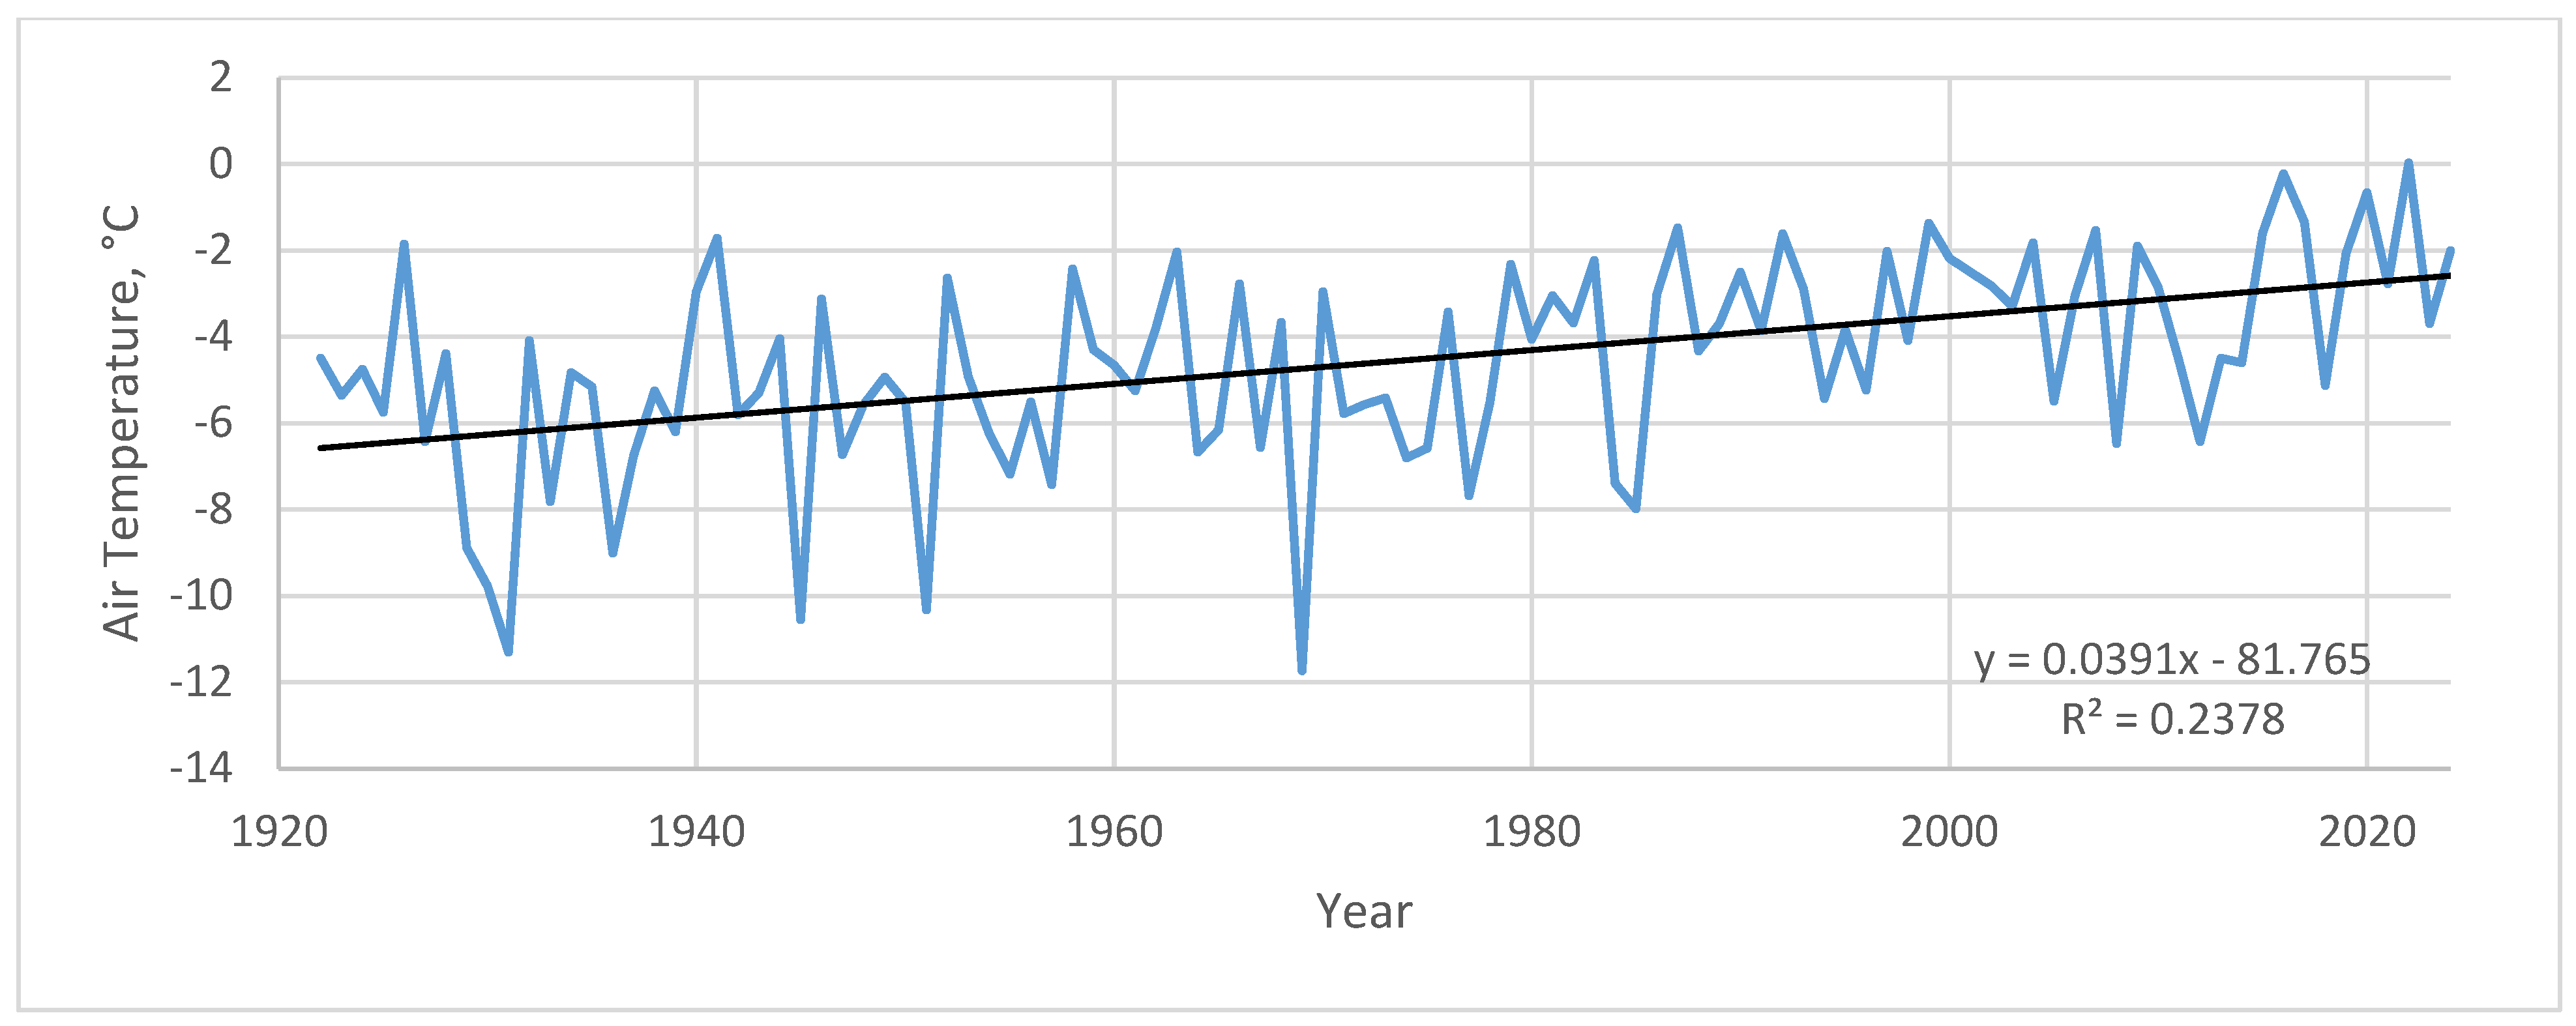
Given the importance of air temperature for the recurrence and intensity of cold spells, significant effects on anchor ice dam formation due to climate warming can be expected. Special attention should be paid to winter climate warming, which can be expressed through changes in the mean air temperature from December to February. At the Almaty MS, the mean winter temperature over the past 103 years (from 1922 to 2024) has increased with a statistically significant linear trend of 0.039 °C/year, rising by 4 °C (
Figure 6). Before 1970, the trend was minimal at 0.013 °C/year. After 1970, the temperature rise accelerated fivefold to 0.065 °C/year, and in the last 12 years, the trend increased 3.7 times to 0.242 °C/year. From 1922 to 1969, the mean winter temperature dropped below −10 °C four times. Since 1970, it has not fallen below −8 °C, and since 2012, it has not fallen below −4 °C. However, the frequency of extreme temperature drops in the winter months has changed only slightly.
4.3. Water–Ice Flows
There is documentation of 34 water–ice flows on the mountain rivers of Southeastern Kazakhstan from 1896 to 2024, available in both the literature and archives. Of these, eight caused material damage, and one resulted in human casualties. It should be noted that the total number of water–ice flows was significantly underestimated, as they were not officially recorded before 1987, and only large water–ice flows have been documented since then.
4.3.1. Historical Events of Destructive Water–Ice Flows
The Ulken Almaty, 10 December 1964. Water–ice flows on the Ulken Almaty River on 10 December 1964 are detailed in [
32]. These flows were preceded by a cold spell that began on 7 December, causing the mean daily air temperature to drop from −5 °C to −20 °C within three days by 9 December. On 10 December, when the water–ice flow occurred, the temperature rose by only 1.0 °C.
The water–ice flow started with a minor flood in the left tributary of the Ulken Almaty River. The channel gradient at the flood site was 8.7%. For the first 2 km, the flood was 20–30 cm deep, moving over the ice covering the riverbed. It then continued for 5.9 km with a gradient of 5.3%. By the end of this section, the flow depth increased to 0.5 m, and it began to break through the ice in the riverbed. The flow depth soon increased to 1.5 m, and the width reached 50 m. On a 3.2 km section with a gradient of 4.5%, followed by another 3.0 km with a gradient of 3.7%, the depth of the flow locally increased to 5 m, and the discharge reached 150 m3/s. The riverbed was completely cleared of ice. Along its course, the water–ice flow destroyed two pedestrian bridges. The steel reinforcement of one bridge was bent and laid along the bank. On the last 1.6 km, with a gradient of 3.2%, the flow deposited crushed ice along the banks. By the end of this section, the flow depth decreased to 1.5 m. The main mass of ice was settled in a quarry. The total length of the water–ice flow path was 7.8 km. The water–ice flow lasted about 30 min.
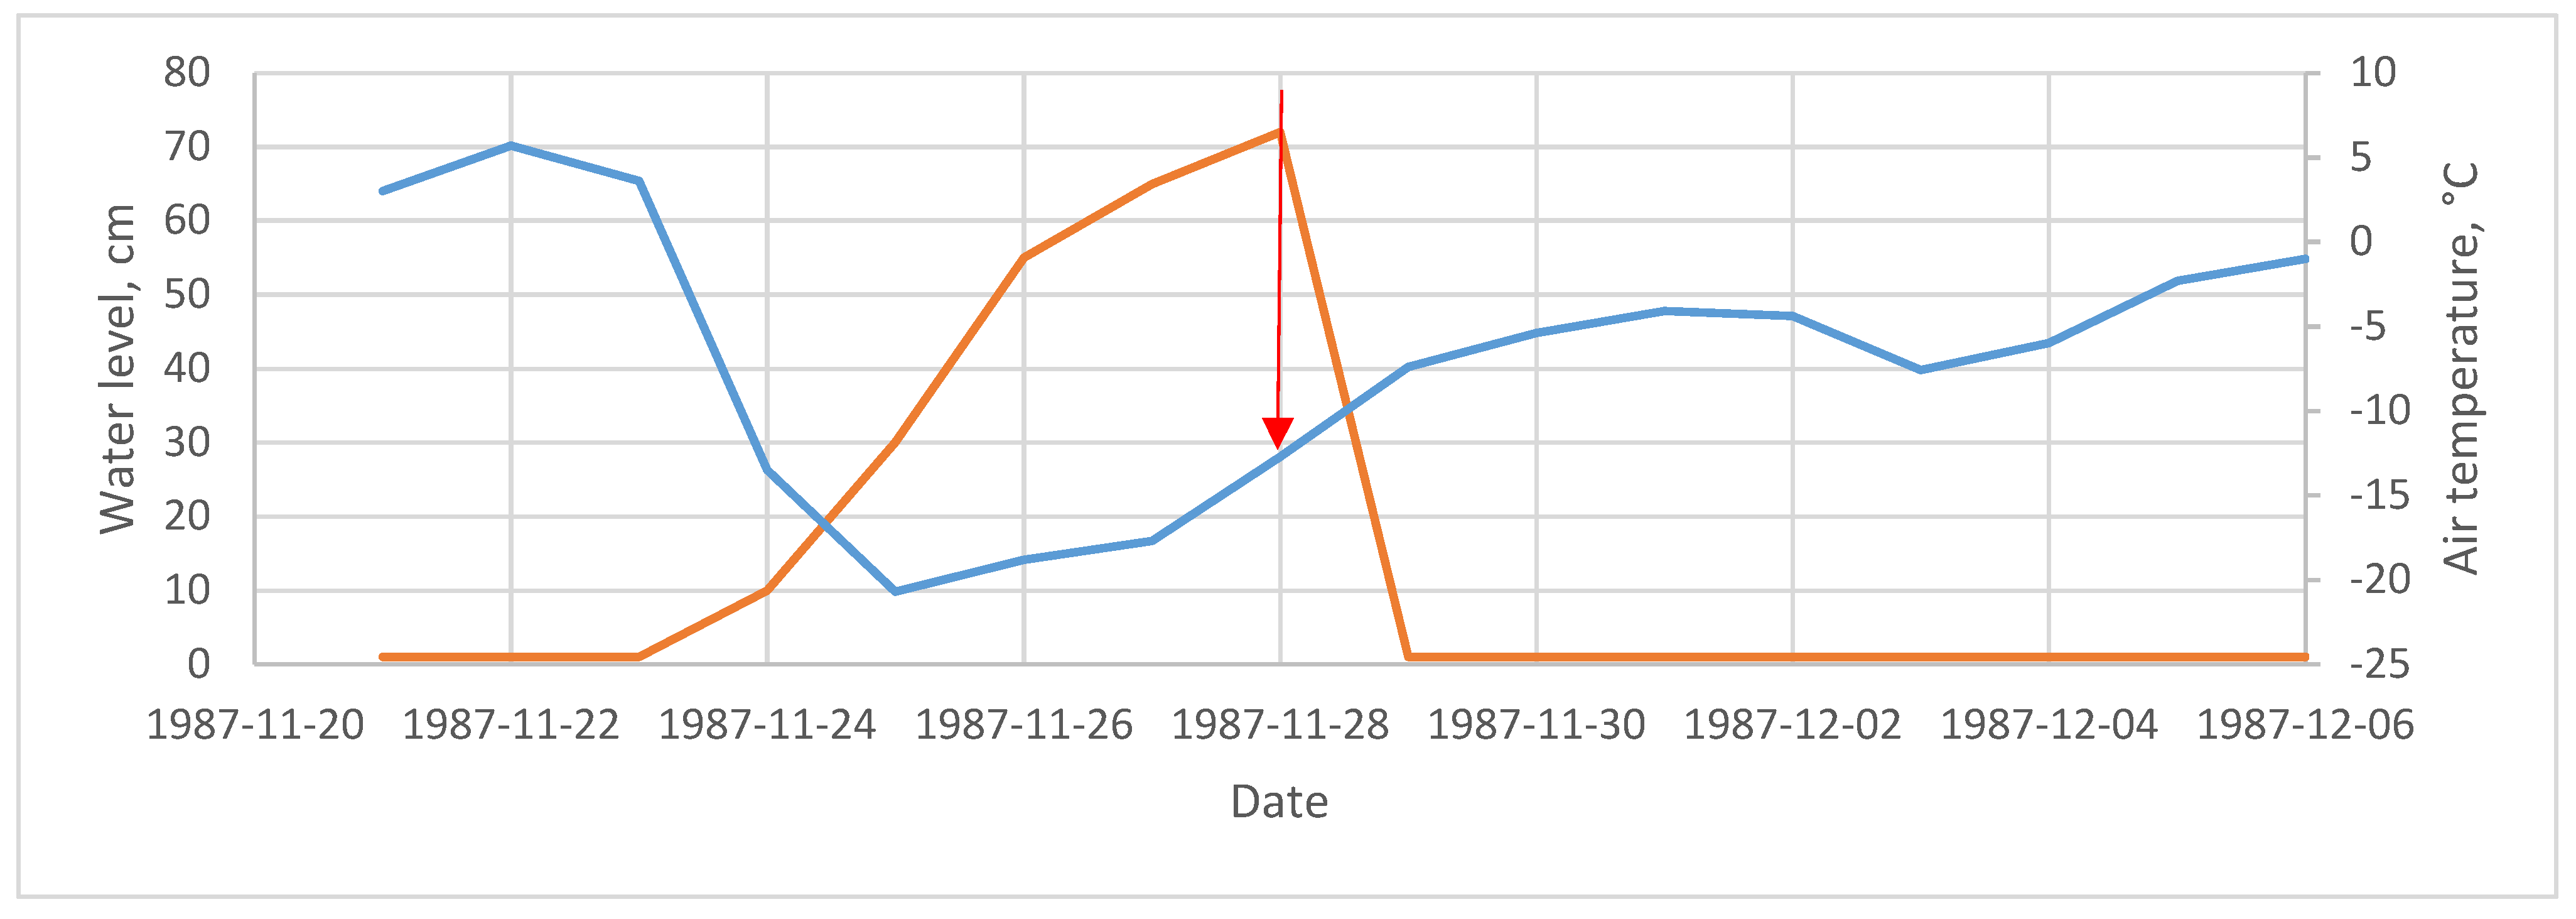
The Esentai, 28 November 1987. The water–ice flow started from the Dam HS on the Kishi Almaty River, then flowed along the Esentai River, a left branch of the Kishi Almaty. A description of this event is given in [
24]. Before the flow, the daily air temperature dropped from +5 °C to −14.5 °C between 22 and 25 November, with a minimum temperature of −27.6 °C (
Figure 7). This led to the formation of ice dams and the overflow of water beyond the riverbanks. The triggering factor for the water–ice flow was the operation of a bulldozer clearing the riverbed. The ice broken by the bulldozer caused a blockage, behind which about 30,000 m
3 of water was accumulated. The breach of this blockage resulted in a flow of water mixed with crushed ice, slush, and anchor ice. The discharge increased downstream, reaching 120 m
3/s, with a mean flow velocity of about 4 m/s. The flow traveled 6 km, destroyed private farm structures near the river, and was eventually stopped in the basin before the mudflow retention dam.
The Uzunkargaly, 5 January 2006. On 5 January 2006, a water–ice flow passed through the village of Fabrichny on the Uzunkargaly River, causing significant damage and human casualties [
24].
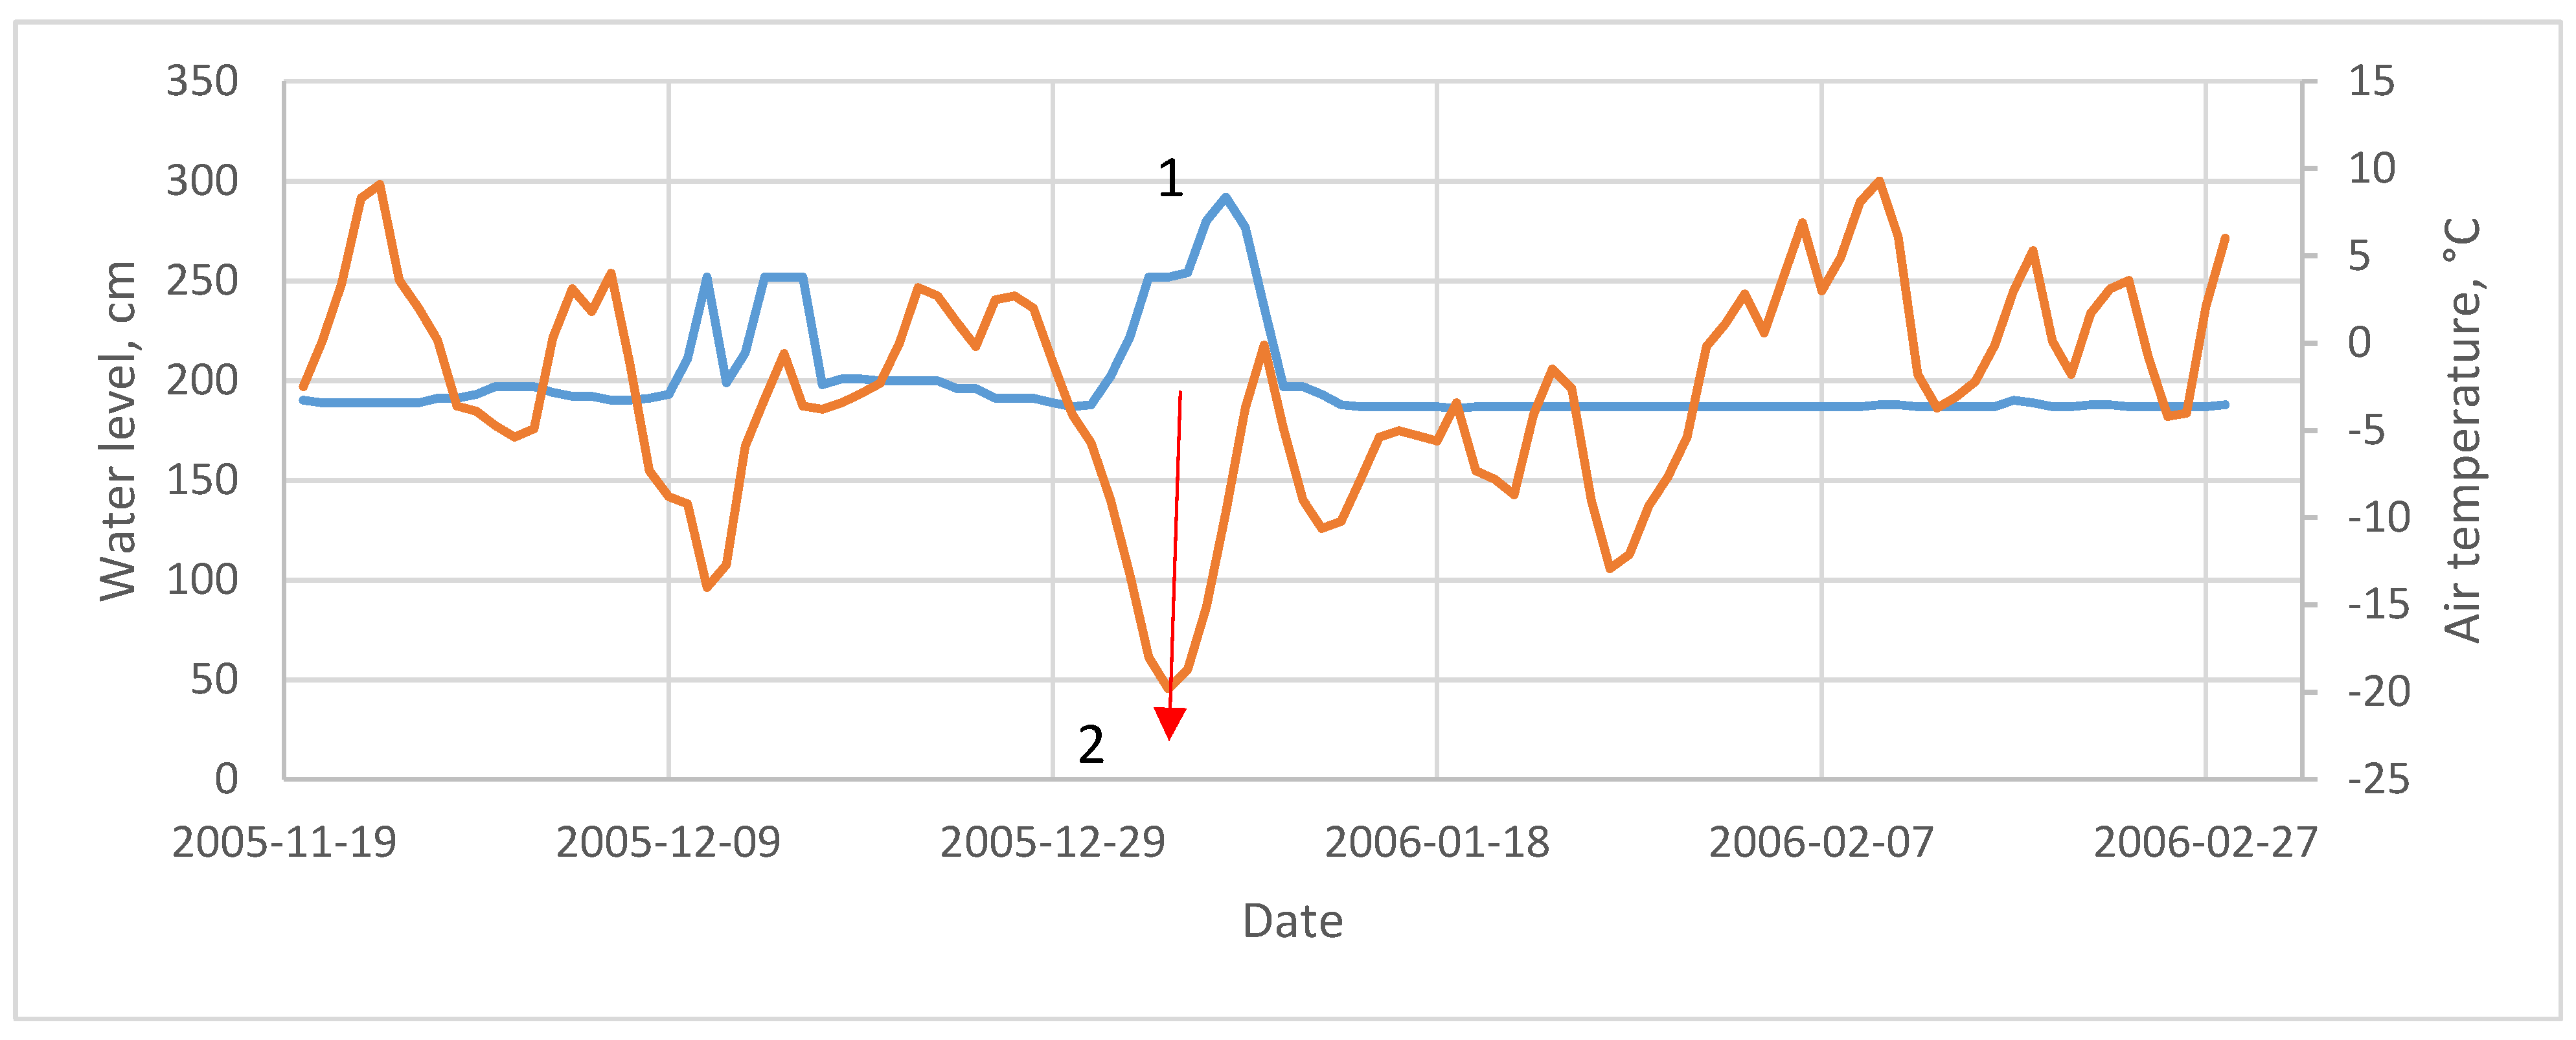
In the 2005–2006 winter on the rivers of the Ile Alatau, the process of anchor ice and ice dam formation began on 9 December, during the first cold wave (
Figure 8), and continued from 30 December during a second, more severe cold wave. The mean daily air temperature over seven days dropped from +2 °C to −19.8 °C.
The water–ice flow started at an altitude of 1200 m, 1.5 km upstream of the mudflow retention dam. The channel gradient at the point of flow formation was 5.1%. Ice deposits accumulated in the mudflow reservoir before the dam, while the water flowed through the dam’s open sluice gates, forming a secondary water–ice flow by breaking the ice formations in the riverbed. At the exit from the mountains, the flow discharge was about 40 m
3/s. After leaving the mountains and entering the alluvial fan, the flow continued for another 1.7 km and stopped in the village of Fabrichny, in the middle of the fan. The volume of ice deposits was 15,000 m
3. Along the way, the flow destroyed several pedestrian bridges, breached the concrete fence of a textile factory, and covered roads and streets with ice blocks (
Figure 9). The intake openings for the water supply were clogged with ice, leaving the village without water for several days. Two people died as a result of the water–ice flow.
The total path of the water–ice flow was 7.7 km, including 6 km in the mountainous part with a gradient of 3.3% and 1.7 km along the alluvial fan with a gradient of 2.7%.
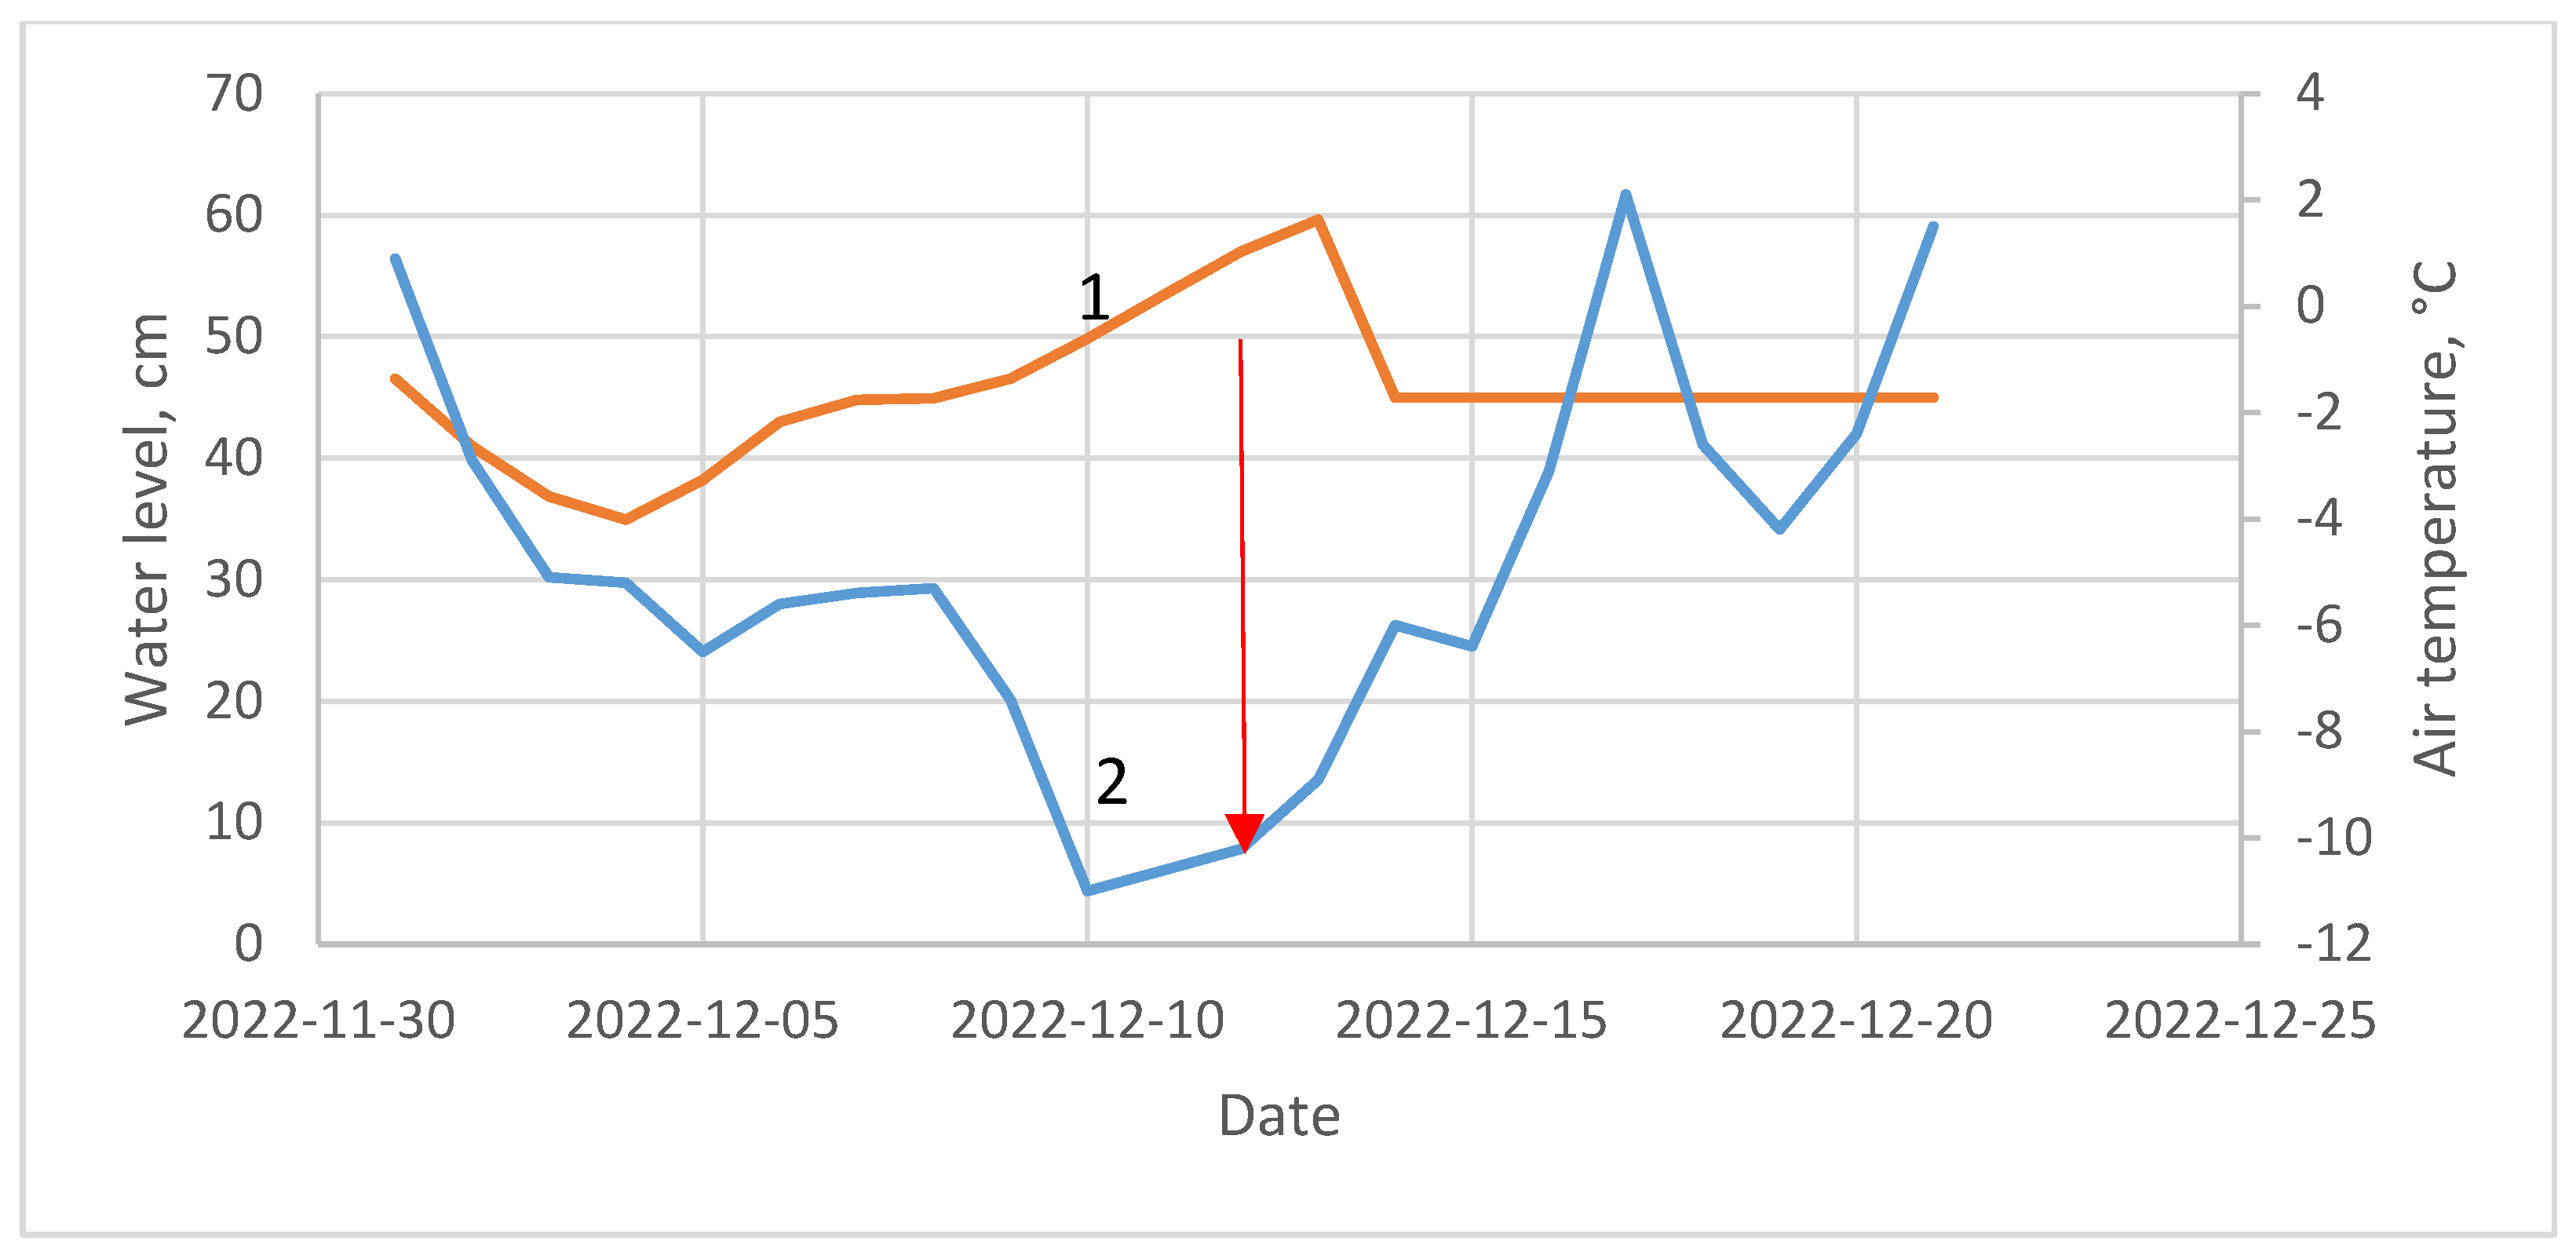
The Esentai, 13 December 2022. On 13 December 2022, a rapid water–ice flow mixed with ice debris surged through the artificial channel of the Esentai River, which has a concrete bottom and gabion walls. The formation of the water–ice flow was preceded by a cold spell during which the mean daily air temperature dropped by 12 °C over 10 days, from +1 °C to −11 °C (
Figure 10). During this period, anchor ice and ice dams were formed in the riverbed. At the Dam HS, the water level rose by 25 cm without any increase in discharge. Warming began on 10 December, during which the water–ice flow occurred. Its formation started at an altitude of 1400 m with a small flow of water-snow slush running over the shore ice and ice dams. The flow depth was 30–50 cm (
Figure 11a).
The flow gradually intensified, and 3 km downstream, began to break through the ice in the riverbed. This led to the flow becoming saturated with ice debris, with average block sizes of 50 × 30 × 10 cm3, and maximum sizes reaching 80 × 60 × 20 cm3. The resulting water–ice flow traveled 1.85 km along the concrete channel and stopped in the basin before the dam, leaving a deposit of crushed ice 50 m long, 30 m wide, and up to 1.5 m thick on the basin floor. The average gradient of the channel was 5.0%.
For most of the route, the flow depth was around 1.5 m. However, in the lower part of the path, when the channel gradient decreased, the flow depth exceeded the channel’s depth of 2.5 m, causing the flow to spill out on both sides of the channel. In the process, it destroyed the steel fence along the embankment for 200 m.
Using video footage of the flow taken by eyewitnesses, the flow’s velocity was estimated to be approximately 10 m/s. The channel width was 13 m, and the flow depth was 2.5 m. With these parameters, the flow discharge was calculated to be 325 m3/s.
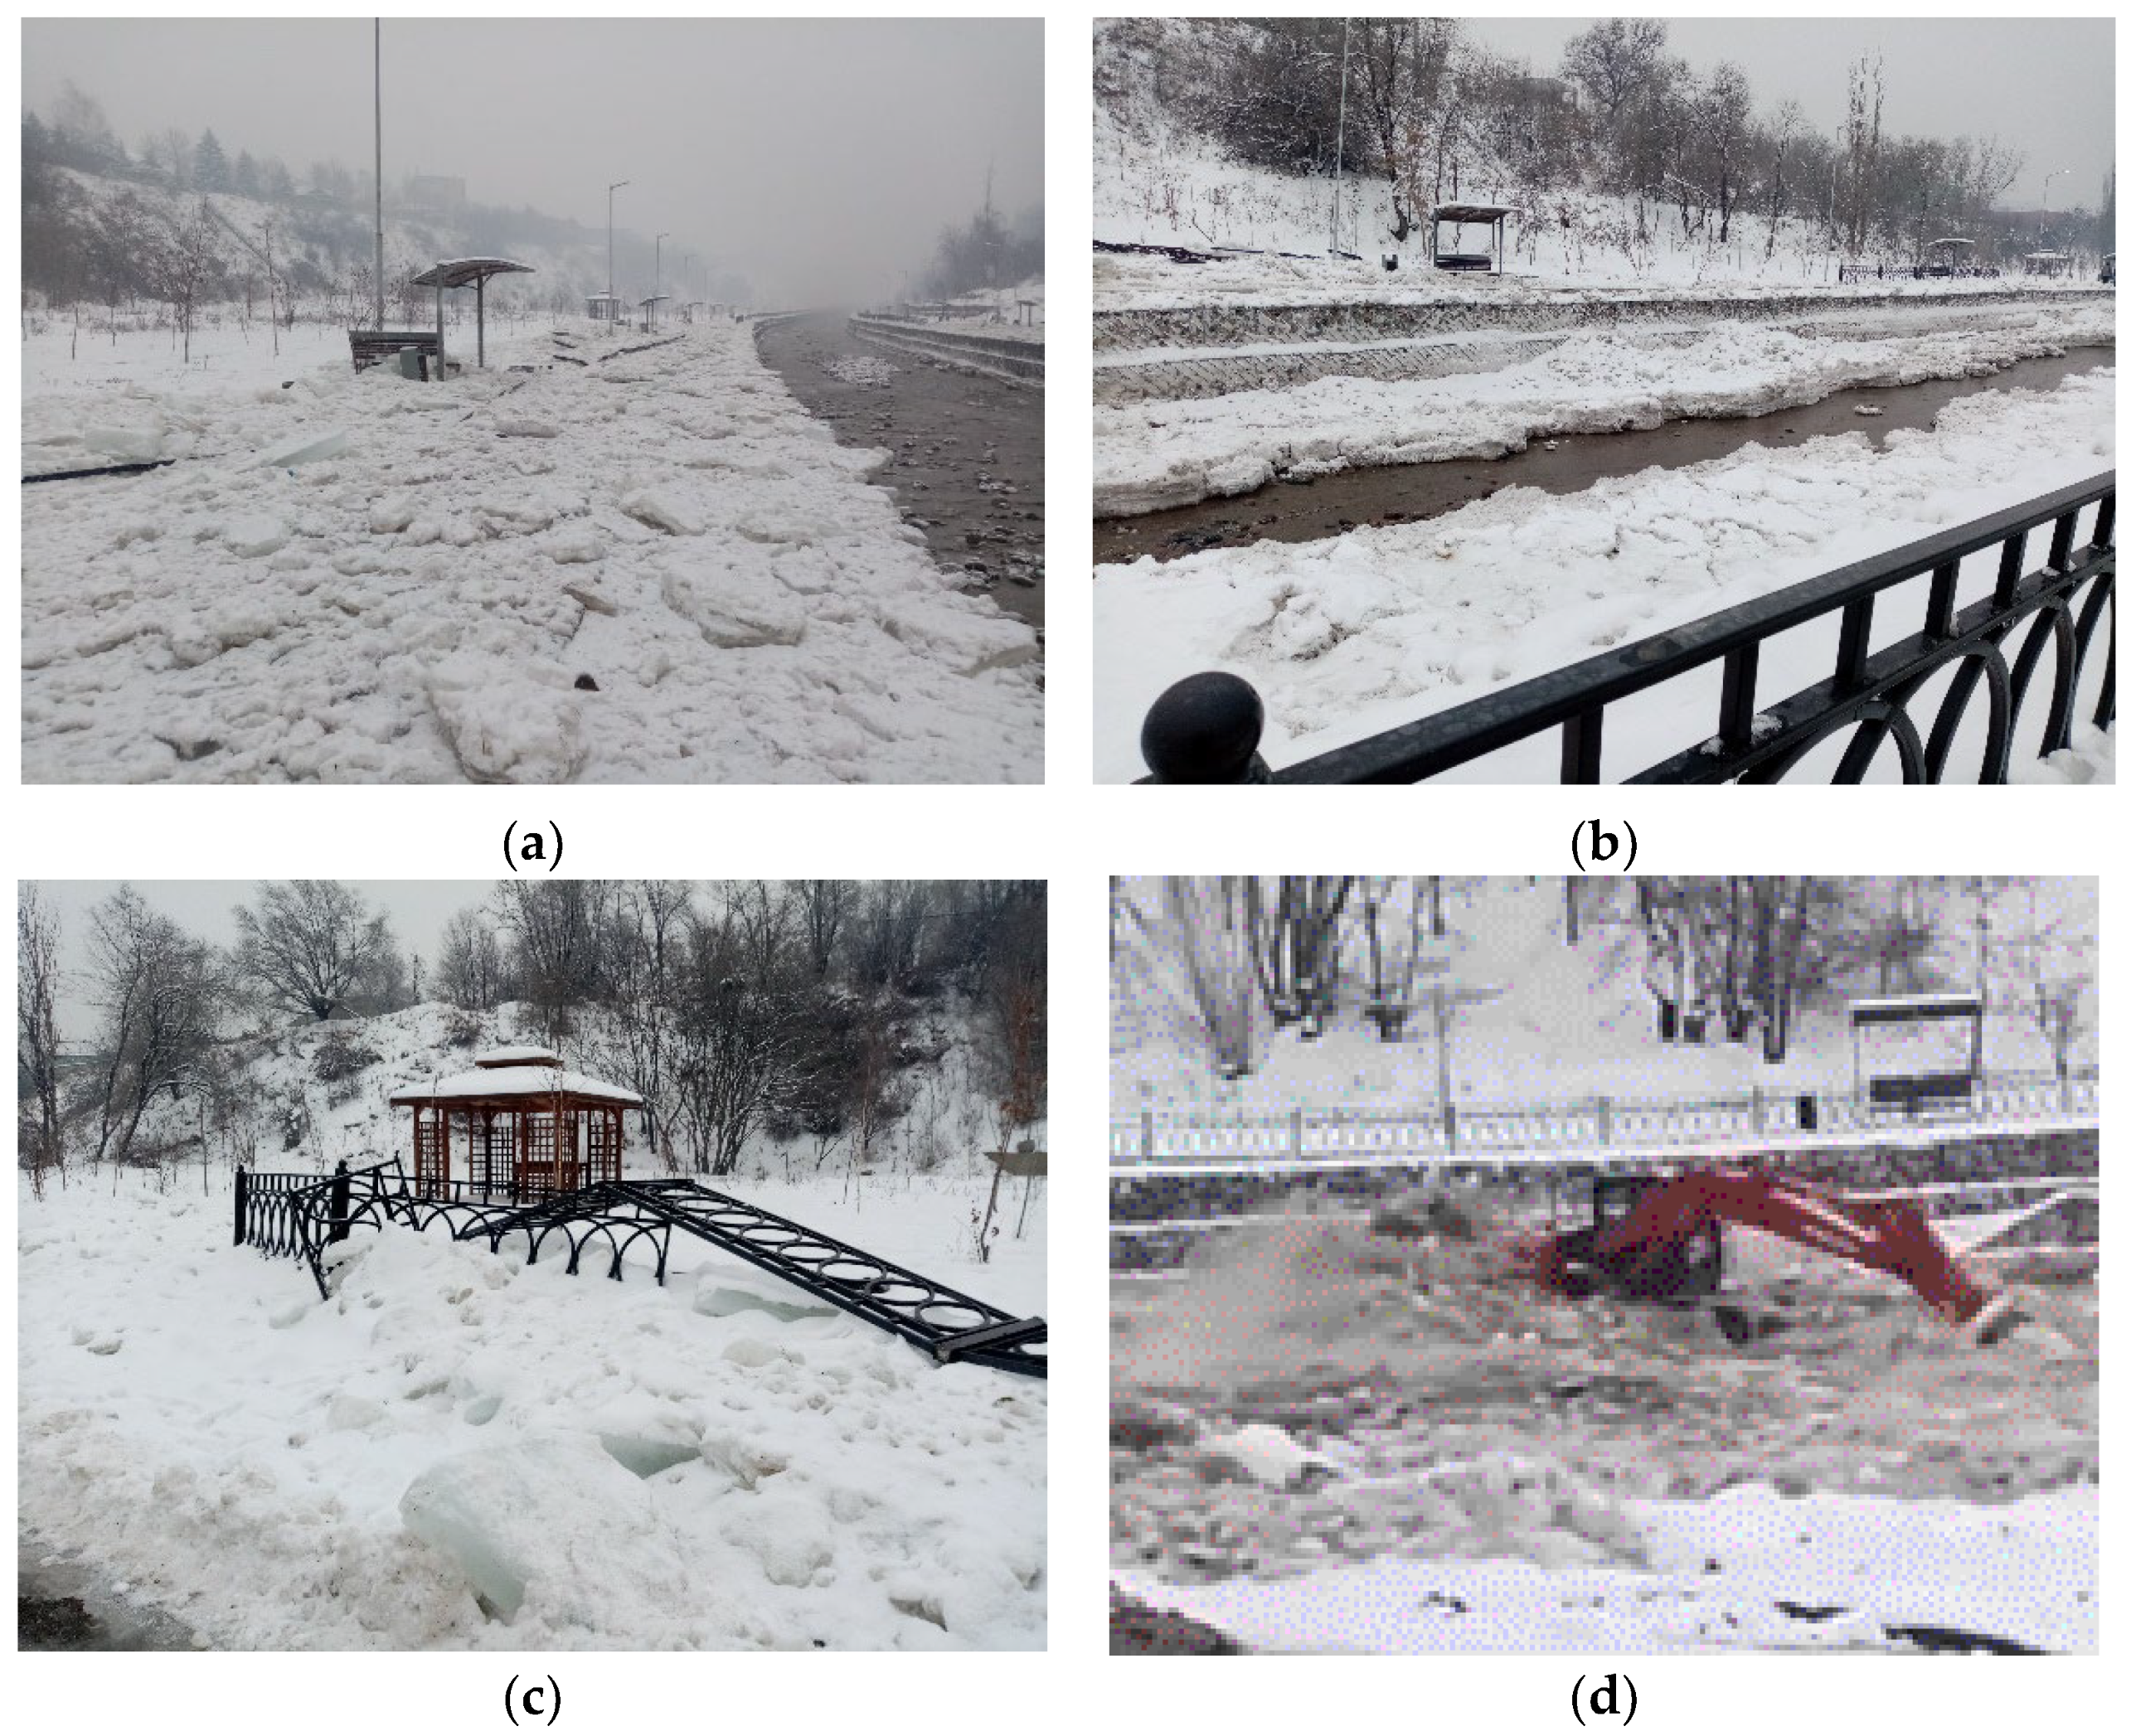
The Esentai, 16 December 2023. Almost exactly one year later, on 16 December 2023, another water–ice flow occurred on the Esentai River under very similar conditions. As in 2022, the flow was preceded by a sharp cold spell, with the mean daily air temperature at the Almaty MS dropping from −2 °C on 8 December to −20 °C on 14 December. As a result of anchor ice and ice dam formation, the water level at the Dam HS rose by 50 cm (
Figure 12). The cold spell in 2023 was more intense, and the water level rise was higher than in 2022. Therefore, the water–ice flow on 16 December 2023 was more powerful than the previous year.
The water–ice flow began in the same location as in 2022. The flow’s height and speed were greater than in 2022, resulting in more significant destruction (
Figure 13). In the lower part of the channel, 500 m before reaching the mudflow retention dam, the flow’s height exceeded the channel depth, and the ice mass swept away the steel fence along the embankment over a distance of 300 m. In some places, benches along the walkway were overturned. The impact of the ice blocks was so strong that the steel grates, welded from 1 × 1 cm
2 steel rods, were severely bent. Upon exiting the channel, the water–ice flow struck an excavator standing at the bottom of the basin (
Figure 13d). The crushed ice deposits covered the basin’s floor, stretching 70 m long and 30 m wide.
The volume of the ice carried by the flow exceeded 10,000 m3. Based on video footage taken by eyewitnesses, the speed of the flow’s leading part was calculated to be 11.5 m/s. With a flow width of 13 m and a depth of 2.5 m, this corresponds to a discharge of 374 m3/s.
4.3.2. Water–Ice Flows in the Mountain Rivers of Southeastern Kazakhstan
Since 1964, 34 events of water–ice flows have been recorded on the mountain rivers of Southeastern Kazakhstan. Information about these flows is presented in
Table 5. The temporal and spatial distribution of these flows is highly uneven.
Most water–ice flows occurred in December, accounting for 50% of the cases. February saw 35%, January 12%, and November only 3% (one case). The seasonal distribution of water–ice flows differs slightly from the distribution of cold spells. They are more frequent during the coldest months—December and January—when the most intense cold spells occur. Thus, only 10% of cold spells in November and 20% in February result in water–ice flows, while in December and January, 53% and 44% of cold spells lead to water–ice flows, respectively.
Over the 30 years from 1995 to 2024, there were 15 years in which at least one water–ice flow was observed on one of the rivers. In four of those years, two water–ice flows occurred, in three years, three flows occurred, and in one year, four flows occurred.
In seven cases, water–ice flows occurred on different rivers during the same cold cycle. In four cases, repeated water–ice flows were observed on the same river during a single cold cycle.
The majority of water–ice flows (15) were recorded on the Kaskelen River. Five occurred on the Uzunkargaly River, three on the Esentai River, two on the Shamalgan River, and one on each of the other rivers.
The data presented in the table, except for those related to the Esentai River flows in 2022 and 2023, were sourced from the literature. These reports were based on expert assessments by Kazhydromet specialists based on traces of mudflows. The flow speeds were assumed to be 5 m/s. Measurements of the speed of water–ice flows on the Esentai River using the video footage showed that it can exceed 10 m/s. Therefore, in most cases, the water–ice flow discharge may be underestimated.
The most accurate measurements of the speed and discharge of water–ice flows were obtained for the Esentai River flows on 13 December 2022 (250 m3/s) and 16 December 2023 (370 m3/s). These values were the first ever obtained for water–ice flows.
All water–ice flows were triggered by the formation of anchor ice dams during intense cold spells. In these events, the minimum air temperatures dropped to −25.2 °C, and the 5-day cumulative temperature values reached as low as −116.3 °C. Water–ice flows always occurred at the beginning of warming, typically on the third day, when the air temperature rose 3–5 °C above the minimum (see
Table 3 in
Section 4.2).
Approximately one-third of all cold spells resulted in water–ice flows. These were the most intense cold spells, with indicators differing from the mean values for all cold spells, as presented in
Table 3.
In cold spells that led to water–ice flows, the mean minimum daily air temperature was −15.8 °C, and the cumulative temperature for the entire cold cycle was −88.2 °C, compared to −12.9 °C and −74.9 °C, respectively, for all cold spells. The average water level rise during cold spells with water–ice flows was 69.8 cm, compared to 41.3 cm for all cold spells. The average water level drop after a water–ice flow was 54.5 cm, compared to 41.3 cm during floods without water–ice flows.
4.3.3. Application of the Random Forest Algorithm to Classify Hazardous Situations
The Random Forest machine learning method was used to analyze the conditions for the formation of anchor ice and water–ice flows. The advantages of this method are as follows: the smallest errors of all existing classification methods and the ability to work with arrays with a small number of variables. The work used the professional statistical data processing package Statictica StatSoft, Russian version 13.0 [
34]. The training objectives were as follows: separating meteorological situations in which anchor ice and water–ice flows are formed, determining the degree of influence of meteorological factors on the processes of formation of anchor ice and water–ice flows, determining the threshold values of meteorological factors for predicting the danger of the consequences of anchor ice formation.
The input parameters of the training sample were as follows:
- -
5-day sum of average daily air temperatures;
- -
Average air temperature on the current day;
- -
Daily air temperature gradient;
- -
Anomaly of average daily air temperature.
The output parameter was the hazard level of water–ice phenomena:
- -
Safe: without water level rise and water–ice flow (0);
- -
Moderately hazardous: with water level rise, but without water–ice flow;
- -
Hazardous: water level rise and water–ice flow.
A total of 3300 examples of daily data from November to March for the period 1985–2024 were taken for training. This period was chosen because no systematic observations of water–ice flows were carried out before 1985. The training sample included 22 cases of water–ice flows formation and 49 cases of the formation of large accumulations of anchor ice on the mountain rivers of Southeastern Kazakhstan. On average, over 39 years, 1.3 cases of anchor ice accumulations and 0.6 cases of water–ice flow passage were noted. In some years, 2–3 cold spells and water–ice flows on different rivers were observed; in other years, there were no cold spells and abnormal ice conditions. In total, 189 days with an increase in the ice water level of more than 20 cm were noted. On average, each such period lasted 4 days.
During the training process, the software package identified the significance of each predictor in percent:
- -
5-day sum of average daily air temperatures—100%;
- -
Average air temperature on the current day—89%;
- -
Daily air temperature gradient—98%;
- -
Average daily air temperature anomaly—86%.
The following conditions were used during training:
- -
Significance of the parameter was taken into account;
- -
Each “Classification Tree” was built from 100 individual trees with 30 training cycles;
- -
Number of branching nodes from 5 to 100.
The program combined the data into clusters, determined the threshold values, and built a common “decision tree” with average data. All meteorological data were divided into three groups: (1) without water level rise and water–ice flows; (2) with water level rise, but without water–ice flows; (3) with water level rise and with water–ice flows.
The threshold values of meteorological parameters for the formation of anchor ice and water–ice flows are given in
Table 6. It is evident that water–ice flows are observed even at lower critical values than for the formation of anchor ice.
The training and testing errors were—0.14 and 0.13, respectively. The standard statistical error was 0.01 within the 5% significance level.
It is very important to note that a necessary condition for the formation of water–ice flows is an increase in air temperature after a cold spell at a rate of 4.1 °C per day.
5. Discussion
Every winter, anchor ice dams are formed on the mountain rivers of Southeastern Kazakhstan, leading to rising water levels and flooding. Occasionally, these events result in destructive water–ice flows. These phenomena occur during severe cold spells caused by Arctic air masses. Air temperatures can drop to −25 °C or lower. These cold spells cover large areas, meaning that ice dams are formed simultaneously across Southeastern Kazakhstan. Therefore, meteorological and hydrological station data are representative and can be used to predict winter floods, high water levels, and water–ice flows throughout the region. For Southeastern Kazakhstan, the key stations are the Almaty MS and the Dam HS. The rate of rise of the water level depends on the air temperature. It begins when the day air temperature falls below −5 °C and reaches a maximum at temperatures below −15 °C.
The formation of anchor ice dams is observed 2–3 times per winter, mainly in December–February. Water–ice flows do not occur every year and rarely on more than one of the rivers. Although there are cases of water–ice flows on the same river two times a year. For the Ile Alatau ridge, the average frequency of water–ice flows was one event/year over the past 50 years. At the same time, about half of the years were without such phenomena.
The maximum water level rise caused by ice dams at the Dam HS reached 106 cm above the average winter low level. Outside of hydrological stations, water levels have been recorded rising up to 3 m. The rate of water level rise ranges from 0.07 to 0.25 cm/°C-h or from 1.7 to 6.0 cm/°C-day. Daily water level rises of 60–80 cm are possible. These findings align with results from studies on mountain rivers in Norway, Canada, and the USA [
7,
8,
9,
13,
15,
18].
The most critical meteorological parameter affecting ice dam formation is air temperature. Rapid ice dam growth begins when the air temperature drops below −10 °C, leading to maximum supercooling of the river water. The correlation coefficient between the total water level rise and the cumulative daily air temperature during the rise period is 0.71.
The breaking of ice dams and the release of accumulated water occur when air temperatures rise by 3–5 °C, due to a reduction in ice strength [
19]. Cascade dam failures can result in water–ice flows [
14]. These flows behave similarly to mudflows, and some researchers classify them as “para-mudflows”, where the solid component is ice debris [
30,
32]. The path length of such flows reaches 8 km, the velocity of such flows can exceed 10 m/s, with discharges reaching 370 m
3/s and leading wave heights of 3–5 m.
The river gradient has a very strong influence on the formation of anchor ice and ice dams, as well as on the transport and accumulation of ice carried by the water–ice flow [
35]. This influence is especially strong on mountain rivers and is manifested in two aspects. Firstly, high channel gradients provide a high flow velocity, and therefore turbulence of the flow, which is a necessary condition for the supercooling of water and the formation of anchor ice and ice dams. Secondly, a high gradient provides a high velocity of water flow, and anchor ice dams are destroyed, which leads to strong dynamic effects of the flow of ice in the river bed and the transformation of the water flow into a water–ice flow. When the gradient decreases below 2%, the speed and transport capacity of the flow decrease, and accumulation of ice debris occurs. The influence of channel gradients can be seen on the example of the Ile Alatau rivers. The formation of anchor ice, ice dams, and water–ice flows occurs in the lower part of mountain valleys, where the gradients of river channels vary from 5 to 10%. Steady movement of water–ice flows occurs in the lower part of river valleys and in the upper part of proluvial fans, where slopes of 4–6% predominate. Accumulation of ice occurs in the lower part of proluvial fans, where gradients become less than 2%.
6. Conclusions
The processes of formation of anchor ice dams have been very well studied in the countries of North America and Europe. There is very little information about these processes on rivers in temperate mountainous regions, and there is practically no information about water–ice flows worldwide. At the same time, as the data of observations of water–ice flows in Kazakhstan show, these flows pose a real threat to infrastructure and people. This threat must be taken into account when analyzing the risks of natural disasters and developing measures to reduce the risks of natural disasters. This is the theoretical and practical significance of the results of this work.
The processes of ice dam formation on small, steep rivers are relatively well studied in Northern Europe and North America. In Kazakhstan, these processes have not been specifically researched and have only been discussed in the context of water–ice flow formation. However, there is a wealth of literature on water–ice flows on the mountain rivers of Southeastern Kazakhstan, while such publications are lacking for other mountainous regions.
Therefore, Kazakhstan needs to expand its research into the formation of anchor ice, frazil ice, and ice dams, as well as the water–ice flows they cause. This will require the use of automated monitoring stations and unmanned aerial vehicles. In addition to measuring air and water temperature and water level, the list of parameters should be expanded to include at least solar radiation. Measurements should be taken at intervals of one hour or less.
For water–ice flow forecasting, using artificial neural networks, as done in [
36] for avalanche forecasting in the Ile Alatau, shows promise.
The RAMMS model, developed at the Swiss Federal Institute for Snow and Avalanche Research for mudflow calculations, could also be adapted for water–ice flow movement and be used for calculating the parameters of water–ice flows when designing protective structures.
Additionally, it is crucial to study the impact of climate change on ice phenomena in mountain rivers and the formation of water–ice flows using climate models with monthly resolution.
The primary protection measure for the Ile Alatau region is the establishment of an automated monitoring and early warning system, similar to the existing mudflow monitoring system. Threshold values of meteorological parameters can be used for baseline predictions of the water–ice flow risk.
Water–ice flows should be considered when assessing mudflow hazards in the region.

 ,
, 


