Review

Clarifying the Role of Phosphorus Management Strategies in Enhancing the Sustainability of Wastewater Treatment Plants

Sino-Dutch R&D Centre for Future Wastewater Treatment Technologies/Beijing Advanced Innovation Center of Future Urban Design, Beijing University of Civil Engineering & Architecture, Beijing 100044, China
*
Author to whom correspondence should be addressed.
Water 2024, 16(11), 1539; https://doi.org/10.3390/w16111539
Submission received: 5 April 2024 / Revised: 19 May 2024 / Accepted: 23 May 2024 / Published: 27 May 2024
(This article belongs to the Special Issue Biological Wastewater Treatment Process and Nutrient Recovery)

Abstract

:
With the emphasis on climate change and society’s goals of carbon neutrality, wastewater treatment plants (WWTPs) are facing new challenges to be more sustainable and particularly to reduce their greenhouse gas (GHG) emissions. In addition, the increasingly stringent discharge standard, especially the phosphorus removal target, also puts lots of pressure on WWTPs. The key solution is to tailor and/or optimize the phosphorus management strategies to balance removal targets and sustainability. As such, the present study systematically summarizes and analyzes different phosphorus management approaches and their impacts on the costs and operation of whole plants. The summary shows that precipitate scaling is a common issue that can be alleviated by proper phosphorus management strategies and operation optimization. Biological phosphorus removal and chemical phosphorus removal processes have their respective advantages and disadvantages. Most importantly, each phosphorus removal process probably has countering impacts on wastewater and sludge treatment lines. Thus, the evaluation of a specific phosphorus removal process should consider all factors in choosing a suitable technology, which is also true for phosphorus recovery, and the recovery from incineration ash seems to be a trend that is more feasible from a regulatory perspective.

1. Introduction

Phosphorus, as an essential element of life, is not only an important raw material for economic and social development but also the key to guaranteeing global food production and safety. For this reason, phosphate rock is kept in the updated Critical Raw Materials list of the European Union (EU) [1]. However, the improper management of phosphorus and excess input into the environment caused by anthropogenic activities lead to severe eutrophication [2]. Generally, when the phosphorus concentration in surface waterbodies reaches 0.01–0.02 mg-P/L, eutrophication can be induced [3]. Therefore, urban WWTPs, as typical point sources of pollution, are subject to strict limits on effluent phosphorus concentrations in different countries, and there is a trend of increasing stringency. In China, for example, Class A of the national wastewater discharge standard requires phosphorus residuals in effluent to be no higher than 0.5 mg-P/L, and some provincial standards are even stricter, e.g., Shandong province (≤0.3 mg-P/L) and sensitive watersheds in Kunming city (≤0.05 mg-P/L) [4,5,6]. In addition, the EU and the US EPA have also optimized and adjusted the discharge standard for WWTPs in recent years. In the draft version of the Urban Wastewater Treatment Directive in 2022, the phosphorus limit in effluent has to be reduced to 0.5 mg-P/L (or achieving no less than 90% removal efficiency), while the previous requirement was 1–2 mg-P/L [7]. Similarly, the Nutrient Reduction Memorandum issued by the US EPA in 2022 mentions that about half of all rivers and lakes have excess phosphorus loading and proposes strategies to reduce phosphorus input, including the adjustment of phosphorus discharge standards from WWTPs [8]. Overall, an increasingly stringent phosphorus discharge standard is foreseen, which brings challenges and pressure to the operation of WWTPs in terms of phosphorus management.
In terms of phosphorus removal technologies, enhanced biological phosphorus removal (EBPR) and chemical phosphorus removal are two commonly applied processes. EBPR enables PAOs to release phosphorus in the anaerobic stage and uptake phosphorus in excess in the aerobic stage to achieve phosphorus removal by discharging sludge. EBPR is an economical and environmentally friendly solution to achieve phosphorus removal, but it is also more susceptible to environmental factors, which leads to unstable phosphorus removal efficiency. A lot of work has been carried out to optimize and/or modify the configuration of the EBPR process, such as the recently reported side-stream-enhanced biological phosphorus removal (S2EBPR) process [9] and Tetrasphaera, a new type of phosphorus accumulation organism [10]. By contrast, chemical phosphorus removal can achieve a higher and more stable phosphorus removal efficiency but at the cost of chemical input and more excess sludge production [11]. Moreover, the emphasis on phosphorus removal efficiency will undoubtedly induce additional challenges and operational costs for WWTPs. On the one hand, some forms of phosphorus are not easily precipitable and are harder to eliminate, such as organic phosphorus compounds. Taking chemical phosphorus removal as an example, if the effluent phosphorus concentration is reduced from 1 mg-P/L to 0.5 mg-P/L, on the other hand, the cost will increase by 1.5–2.5 times [12,13], and if it is further reduced to 0.1 mg-P/L, the chemical agent consumption will increase by 6–7 times [12]. However, with the promotion of a circular economy, phosphorus management in WWTPs has undergone a shift from phosphorus removal to phosphorus recovery. The separation and concentration of phosphorus out of wastewater via the above two processes are still the first steps to recovering it herein.
In addition, the water sectors are gradually incorporating carbon emissions into their performance evaluation framework. In 2020, Water UK published the world’s first Net-Zero Carbon Emission Routemap for England and Wales, striving to achieve carbon neutrality by 2030 [14]. Since then, Denmark, Australia, and New Zealand have issued their roadmaps for carbon neutrality in the water sector [15,16,17]. Therefore, the phosphorus management strategies, subject to stringent discharge standards, should synergistically take carbon emissions into consideration. For EBPR and chemical phosphorus removal, a significant quantity of indirect carbon emissions is associated with electricity and chemical consumption, as well as the treatment and disposal of the waste sludge. Thus, if phosphorus cannot be effectively managed, the enhancement of phosphorus removal may lead to more carbon emissions and worsen sustainability. As such, the present article aims to summarize the management strategies of phosphorus in WWTPs and their impacts on the operation of WWTPs. In particular, the correlation and synergy between phosphorus management and GHG emissions are highlighted and discussed to guide more sustainable phosphorus management in WWTPs.

2. Mass Flow of Phosphorus in WWTPs

In a typical WWTP, different units and processes can divert, remove, and concentrate pollutants via various pathways, which is also the principle by which pollutants impact treatment performance. This is also true for phosphorus removal. As such, the mass flow of phosphorus in WWTPs adopting EBPR or chemical phosphorus removal processes is summarized and depicted in Figure 1. In a conventional activated sludge system, there is no tailored phosphorus removal process, but phosphorus is assimilated by microorganisms. In general, about 30–40% of phosphorus removal can be achieved via microorganisms’ metabolism (~2% dry solid content) and/or biosorption [18]. The residual flows into the receiving waterbodies with the effluent.
By contrast, the EBPR process provides a competitive advantage environment for phosphate accumulating organisms (PAOs) of which the phosphorus content can be as high as 6–15% in dry solids [19,20]. Thus, the mass flow of phosphorus in WWTPs with the EBPR process presents some unique features. Taking the Anaerobic–Anoxic–Oxic (AAO) configuration as an example (Figure 1a), the phosphorus in the influent (denoted as 100%) flows into the primary clarifier along with the phosphorus-contained reject water (~35%) [21,22,23]. Approximately 20% of the influent phosphorus can be retained and discharged to the sludge treatment line with the primary sludge while the rest flows to the next unit. In the biological treatment unit, most of the phosphorus is assimilated via the EBPR process into cells of PAOs (~90%), which is then discharged as residual sludge. It is important to note that the removal efficiency by PAOs is highly associated with the C/P ratio and operational environments [24]. A well-established EBPR process with a sufficient carbon source can typically achieve an effluent phosphorus content of 1 mg-P/L or evenlower, possibly less than 0.3 mg-P/L [25]. If the secondary effluent still cannot meet the discharge standard, an advanced flocculation and filtration unit is usually applied. When it comes to the sludge treatment line, it also has a significant impact on phosphorus mass flow. Since the majority of phosphorus is stored in the cells of PAOs, a certain amount of phosphorus is re-released into the supernatant [21,22,23] in the units of concentration, digestion, and dewatering. The released phosphorus is then rejected back to the water treatment line, which is equal to 35% of the influent phosphorus loading. It is important to highlight that there are several points in Figure 1a with a high concentration of phosphorus, such as the anaerobic stage of the biological treatment unit and reject supernatant, with tens or hundreds of mg-P/L. Generally, these points are favorable for conducting phosphorus recovery, which is a more sustainable management pathway [26,27].
Figure 1b shows the mass flow of phosphorus in a WWTP with chemical phosphorus removal. A precipitant, such as FeCl3 or AlCl3, is add to a biological treatment unit. Analogous to EBPR, most of the phosphorus is precipitated by the added precipitant and removed in the secondary settling tank as sludge (>90%). The efficiency of phosphorus removal is mainly determined by the amount of precipitant dosage. Due to the strong bond of the phosphate precipitates, the phosphorus is not easily released in the sludge treatment units. As a result, only 4% of the phosphorus is returned to the wastewater treatment line [21,28,29]. Additionally, the phosphorus concentration in the biological unit or reject water is lower compared to the EBPR process. These differences in mass flow between EBPR and the chemical removal process influence performance reliability, cost, and sustainability, which will be further discussed.

3. Precipitate Scaling Issue Related to Phosphorus Management

In the operations of WWTPs, pipes and pumps can become encrusted and even blocked with deposits, a problem known as precipitate scaling [30]. The deposits have been reported to be phosphate-related precipitates. As shown in Figure 1, certain points, such as sludge treatment units and reject water pipes, often have high phosphorus concentrations (in hundreds of mg-P/L), creating an environment conducive to the formation of phosphate precipitates that accumulate on the surface of pipes and pumps. This scaling can significantly reduce conveying capacity [31] and the efficiency of pumps, leading to substantial capital, operating, and maintenance expenses for WWTPs [26]. It has been reported that the cost to address the phosphorus precipitate scaling issue in WWTPs is approximately USD 2000–10,000 per million gallons of wastewater [26], a cost that could have been prevented. Therefore, it is essential to understand the formation and mitigation of precipitate scaling.
Generally, scaling issues are most commonly reported at the points where instruments and pipes handle sludge in WWTPs. The deposits typically consists of struvite, hydroxyapatite, and/or vivianite. According to Table 1, the phosphorus concentration in the supernatant of the sludge treatment line ranges from 30 to 150 mg-P/L with anaerobic digestion particularly inducing more phosphorus release [32]. Additionally, sludge from the EBPR process releases phosphorus more readily compared to sludge from the chemical phosphorus process [33], making the precipitate scaling issue in WWTPs with the EBPR process a priority. Meanwhile, the counter ions required for precipitation also exhibit significant concentrations in the supernatant (Table 1). For Ca2+, its concentration in the supernatant greatly depends on the local water source and hardness, typically reported in the range of around 100 mg/L [34]. Additionally, cell lysis releases a certain amount of Ca2+ and Mg2+ along with phosphorus, which is necessary for struvite precipitation with NH4+ [26]. Regarding the source of Fe (II), raw wastewater (0.5–1.5 mg/L) and Fe-based chemicals for phosphorus removal are two main contributors. In the sludge treatment line, particularly in the anaerobic digestion unit, Fe(III) is released and gradually reduced to Fe(II) due to the low-pH environment and the presence of iron-reducing bacteria [35].
The supersaturation ratios (SSRs) of struvite and amorphous calcium phosphate are then calculated in terms of the concentration of ions (Table 1). The SSRs of struvite and amorphous calcium phosphate indicate that the conditional solubility products are higher than the constant solubility products. Thus, there is a high possibility of uncontrolled struvite formation, particularly in WWTPs applying the EBPR process [34]. By contrast, carbonate ions in the supernatant could compete for Ca2+ to produce calcium carbonate, thereby reducing the potential for the formation of amorphous calcium phosphate. In addition, temperature has an impact on the solubility of precipitates, with a small increase in temperature inducing high solubility [34,42]. Compared to other factors, temperature has a relatively small effect on solubility. It is worth noting that the formation of struvite and calcium phosphate precipitates is strongly related to the pH of the solution. In anaerobic digestion tanks, the intermediates, such as Volatile Fatty Acids (VFAs) and CO2, lead to a decrease in the pH of the supernatant (pH ≈ 5, [32]) which could inhibit the formation of precipitates. However, the pH of the anaerobic digestion effluent could increase to 8 due to the degradation of VFAs and the release of CO2 in the pipeline elbow, valve, dewatering equipment, supernatant storage tank, reject water pumps [34], etc. Thus, these points are all at risk of precipitation formation [26]. It should be highlighted that the formation of precipitates does not necessarily cause scaling and/or pipe blockage. It is the deposition of the precipitates on the internal surface of the mechanical equipment or pipeline that leads to scaling problems [26]. Therefore, precipitate scaling is also closely related to hydrodynamic factors, pipe material, and surface roughness [42].
A number of measures have been proposed and practiced to reduce the potential for deposit scaling in pipes or equipment [26]. These measures can be categorized into two groups, with one focusing on reducing the solubility products of various precipitates. The most commonly used method involves lowering the concentrations of ions related to struvite, amorphous apatite, and/or vivianite by dosing chemicals [43]. For example, the dosage of ferric chloride in anaerobic digesters can immobilize phosphate and create FePO4 precipitate, which is less dense than struvite and reduces scaling potential [34]. However, the addition of FePO4 may increase the formation of vivianite [35]. Other chemicals applied include ethylene diamine tetraacetic acid (EDTA), phosphorus citrate (C6H9O10P), and polyaspartic acid (PASP), which either complex with Mg2+ or dissolve precipitates to prevent scaling. It should be noted that the biodegradability of EDTA is still uncertain, as it can chelate heavy metal ions that are not easily degraded by traditional wastewater treatment methods, leading to heavy metal accumulation, pollution, and toxicity. On the other hand, PASP is considered a safe, biodegradable inhibitor, but its high cost limits widespread use [44,45]. By incorporating resource recovery, if phosphorus from sludge can be extracted and recovered before entering an anaerobic digester, the phosphate concentration in the liquid can be reduced, lowering the chances of precipitation [46].
Another way to address precipitation scaling issues is by optimizing pipe materials and pipeline design [26]. For example, PVC and PE pipes and fittings have a smoother surface compared to metal pipes, which can reduce the adhesion of crystal deposits and slow down the growth of struvite [47,48]. Additionally, using a straighter and shorter pipeline with fewer fittings to convey digestion sludge can effectively prevent precipitate formation and scaling problems by reducing CO2 overflow and ensuring pH stability [49]. Furthermore, a broader perspective on solving precipitate scaling problems involves integrating with the sludge treatment paradigm. For example, Hao et al. compared two sludge treatment and disposal routes, i.e., sludge incineration after anaerobic digestion and drying, and incineration after drying without digestion [50]. The study found that the route without digestion had a more favorable net energy balance. Further, bypassing digestion can reduce phosphorus release, thereby significantly reducing precipitate scaling problems.

4. Phosphorus Management and WWTP’s Operation

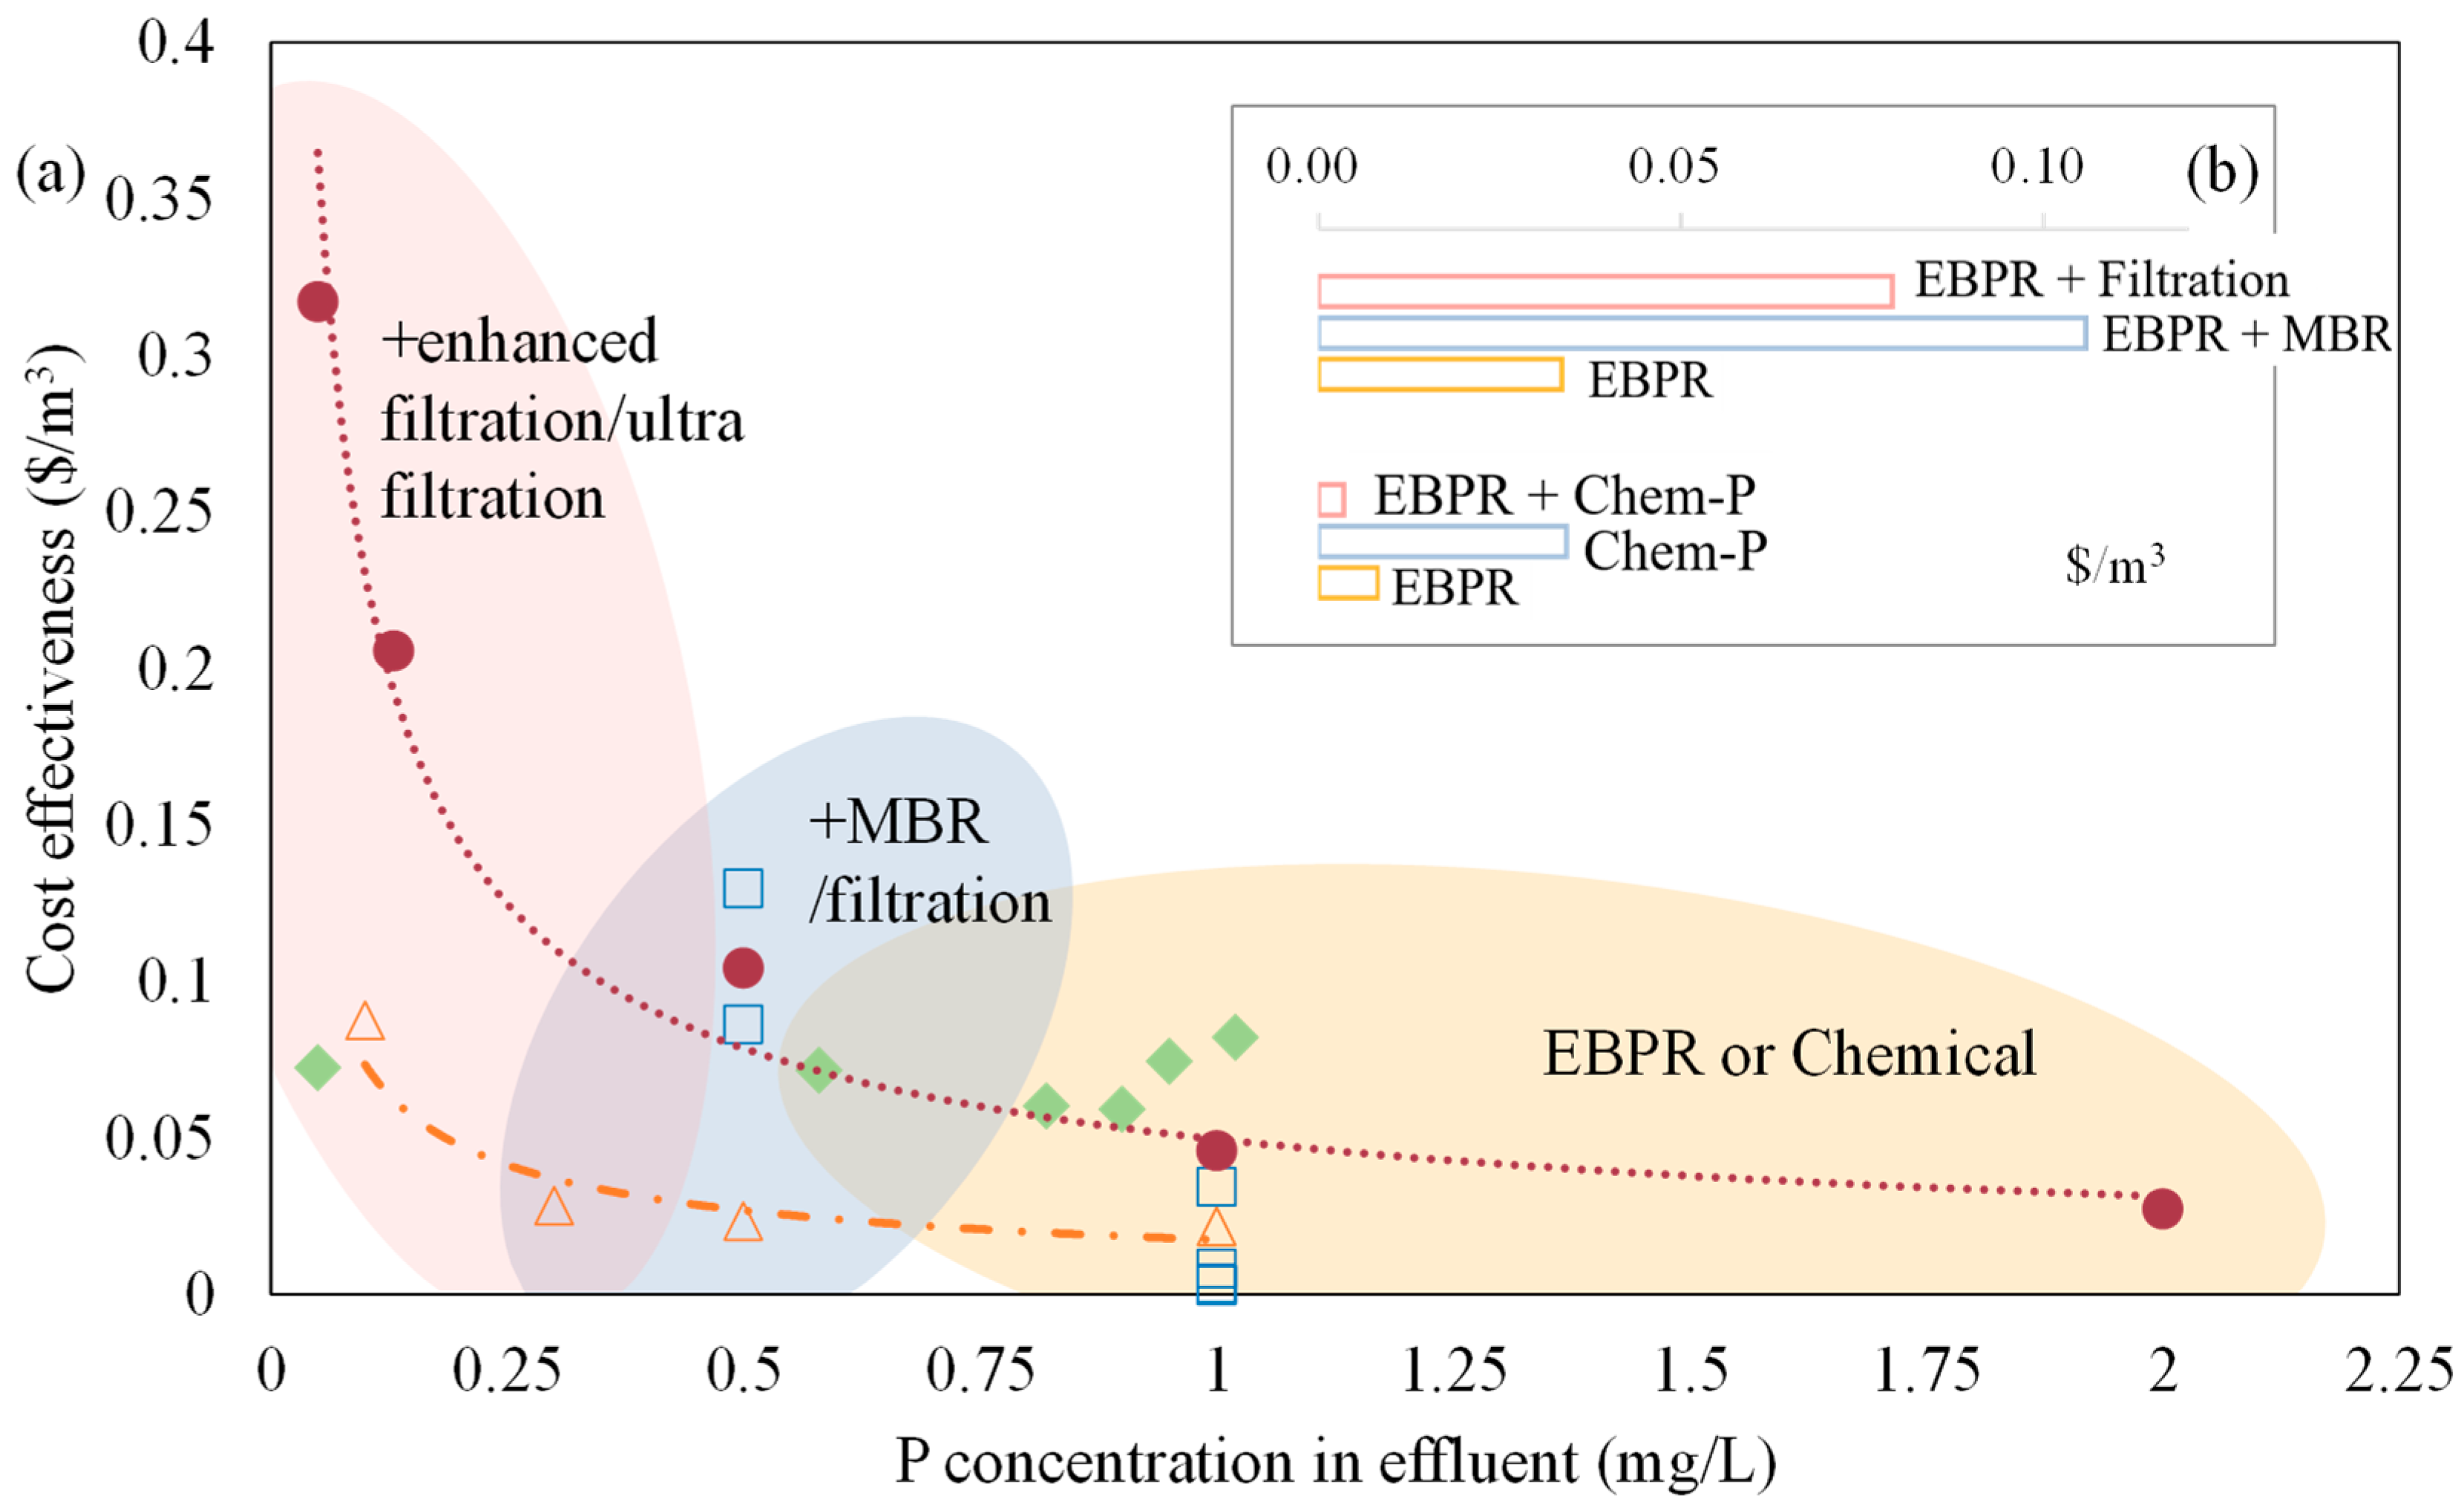
4.1. Operation and Maintenance Costs of Phosphorus Management Schemes

With increasingly stringent nutrient discharge standards, there is a lot of pressure on phosphorus management strategies to meet lower limits. The selection of a phosphorus management strategy is crucial not only for achieving effective phosphorus removal but also for determining operation and maintenance costs. The widely applied EBPR process is facing a challenge in consistently meeting very low residual phosphorus concentrations on its own [51]. For instance, a five-stage Bardenpho process or a Modified University of Cape Town (MUCT) process can achieve an effluent of approximately 1 mg-P/L [13]. Therefore, chemical phosphorus removal is often used in conjunction with EBPR, and in many cases, a polishing filtration unit (such as sand filters) is necessary to capture suspended solids (SS) to meet more stringent discharge standards [52]. This is a common approach in China to enhance the phosphorus removal performance of WWTPs [53,54]. However, this method also leads to increased operation and maintenance (O&M) costs due to additional infrastructure and chemical dosing. For example, reducing effluent phosphorus from 1 mg-P/L to 0.5 mg-P/L or 0.3 mg-P/L can increase plant O&M costs by 8% and 30%, respectively [12]. Therefore, O&M costs should be taken into account when selecting a phosphorus management scheme to ensure the sustainability of WWTPs.
The O&M costs and removal efficiency of various phosphorus removal processes are summarized and presented in Figure 2. The processes can be grouped into three categories according to their configuration. The first category is the stand-alone EBPR or chemical phosphorus removal process. In terms of performance, EBPR and chemical phosphorus removal alone (yellow area in Figure 2a) could achieve a stable effluent quality of ~1 mg-P/L consistently [55]. The corresponding O&M costs are USD 0.0082 and USD 0.0342 per m3, respectively (assuming 7 mg-P/L in the influent) [13,55,56]. The higher costs associated with chemical phosphorus removal are mainly attributed to the consumption of chemicals and the disposal of increasing sludge volumes [55]. When the residual phosphorus in the effluent has to meet a much lower limit, the suspended solids (SS) in the effluent become a key factor. Based on the dry weight content of phosphorus, if the effluent has a residual SS of about 20 mg/L, the contribution to TP can be approximately 0.4~1 mg-P/L. Therefore, the membrane bioreactor (MBR) process and/or magnetic enhanced separation are usually adopted to facilitate SS deception to achieve effluent phosphorus of ~0.5 mg-P/L or even less [57], which is referred to as the second category. It is worth noting that membrane fouling and sludge bulking in MBR have always been criticized [58]. As an alternative, the filtration process can be applied as an advanced polishing step to effectively retain the residual SS. As depicted in Figure 2, phosphorus removal with MBR or filtration as a supplement (blue area in Figure 2a) to achieve around 0.5 mg-P/L could double the O&M costs [55,59]. The filtration process seems to be more cost-effective than MBR, with a 30% cost reduction (Figure 2b). If a more stringent phosphorus effluent needs to be achieved, advanced coagulation/filtration, two-stage lime clarification, and/or even ultrafiltration (the third category in pink) should be applied, which means a dramatic and exponential increase in O&M costs (Figure 2a). Achieving an effluent quality of 0.1 mg-P/L increases O&M costs by 300% compared to EBPR or chemical phosphorus removal alone [56].
According to Figure 2, increasing the phosphorus discharge limit could lead to a significant cost increase. However, the figure also indicates that costs can be reduced by selecting a suitable phosphorus management strategy. For example, an additional filtration unit is more cost-effective than an MBR unit in terms of O&M costs [59]. Nonetheless, installing an additional filtration unit requires higher capital investment and land occupation. Therefore, a comprehensive economic analysis should be conducted before making a decision. For existing WWTPs, it may be more practical to implement MBR units, while for new wastewater plants, additional filtration could be a promising option. It is worth noting that a significant amount of phosphorus from the sludge supernatant flows back to the biological treatment unit (Figure 1), leading to an increase in phosphorus loading rate, and subsequently higher energy consumption and/or chemical dosage [28,60,61]. As such, if this part of phosphorus can be handled separately, the cost could be reduced. Bashar et al. conducted a simulation on the performance of side-stream phosphorus recovery from rejected water in a MUCT system [13]. The results showed that phosphorus recovery reduced the phosphorus loading rate of MUCT and chemical consumption. This approach achieved a phosphorus concentration of 0.5 mg-P/L at an O&M cost of USD 0.0712 per m3. In comparison, enhancing phosphorus removal in MUCT with MBR resulted in an effluent quality of 1.02 mg-P/L at an O&M cost of USD 0.082 per m3.
In addition, when a much lower phosphorus concentration is required, chemical dosing in a multi-point scheme is necessary to facilitate phosphate precipitation and filtration. This raises the question of whether EBPR is essential and justified to achieve a very low residual phosphorus level. Bashar et al. studied and compared the performance and O&M costs of different removal processes through mathematical simulation [13]. The results indicated that the O&M cost of EBPR supplemented with chemical enhancement was about USD 0.046 per m3 with an effluent concentration of 1 mg-P/L. In contrast, chemical phosphorus removal alone could achieve the same effluent quality at a cost of USD 0.023 per m3 (Figure 2b) [55]. The author explained that this cost difference is due to fluctuations in electricity and chemical consumption. Additionally, in terms of carbon emissions required to achieve an effluent of 1 mg-P/L, the GHG emissions caused by EBPR, chemical phosphorus removal, and the combined process of the two are 320,000, 150,000, and 160,000 kg CO2-eq/y, respectively [62]. Overall, the O&M costs of chemical phosphorus removal may not necessarily be higher than those of the EBPR process. The selection of a phosphorus management scheme should comprehensively consider influent quality, discharge standards, and operational factors in full-scale application.

4.2. Impact of Phosphorus Management Schemes on Wastewater Treatment

Different phosphorus management schemes and enhancement strategies for phosphorus removal not only affect O&M costs but also have an impact on overall treatment performance. For example, there are some differences between EBPR and biological nitrogen removal in terms of sludge retention time (SRT) and carbon source distribution [63,64]. Moreover, the nitrate carried back by the rejected water could lead to a deterioration of EBPR, which is a significant issue in the operation of large-scale WWTPs [65]. Several variants have been proposed to mitigate the mutual interference between biological phosphorus and nitrogen removal processes, such as UCT and S2EBPR. While these have been well-studied, they will not be the focus of the present study.
Chemical phosphorus removal, as an alternative to EBPR, could help avoid conflicts but also has negative impacts on treatment performance. In terms of chemical dosing points, chemical phosphorus removal can be classified into three paradigms, i.e., pre-precipitation, co-precipitation, and post-precipitation [66]. Each paradigm has different impacts. The pre-precipitation paradigm achieves precipitation in the primary clarifier and inevitably diverts some organic matter to the sludge, reducing the amount of carbon sources available for subsequent biological nitrogen removal. In contrast, co-precipitation and post-precipitation could alleviate this issue. However, co-precipitation may depress the activity of microorganisms, while post-precipitation requires additional capital investment for an additional settling tank. In general, chemical dosage at a molar ratio of 1–2 can achieve an effluent phosphorus concentration of 1 mg-P/L. To achieve an effluent quality of 0.1 mg-P/L, the dosage ratio should reach 4 (Al/P) and 8 (Fe/P) [67]. Such a high dosage could deplete alkalinity excessively and influence the metabolic activities of microorganisms [68]. It is worth noting that the negative impact of chemicals is associated with the dosage amount as well as other factors. Ren et al. reported that an iron salt dosage at Fe/P = 2 (in molar ratio) altered the microbial community and reduced the abundance of denitrifying bacteria and PAOs [69]. However, with the same dosage ratio, aluminum salt did not show a negative impact on microbial activity, but slightly stimulated the activity of denitrifying bacteria, likely due to the lower alkalinity consumption by aluminum salts. Derco pointed out that the dosage of iron-based chemicals (dosage < 400 mg/L) enhanced microbial activity and increased removal efficiencies [66]. Moreover, the dosed chemical improved sludge settling and enhanced the performance of the secondary clarifier, thereby reducing residual SS in the effluent.
Tertiary filtration is widely used to remove SS from secondary effluent, but it requires additional capital investment. Alternatively, MBRs are used to upgrade existing WWTPs to achieve SS reduction in effluent, but fouling issues have limited their application [58]. The lifespan of filtration processes is affected by various factors, including filter design, environmental conditions, influent water quality, and chemical dosage. Generally, the service life of filters and MBR membranes can exceed 10 years, which is an important consideration when assessing cost-effectiveness. Indeed, this issue could be alleviated by selecting an appropriate phosphorus management scheme systematically. Chemical phosphorus removal improves sludge properties [70] and stabilizes MBR working efficiency. Therefore, this study summarizes the impacts of chemical phosphorus removal on MBR fouling control, including chemical dosage, phosphorus removal efficiency, and fouling control performance, as shown in Figure 3.
The size of the cycles in Figure 3 represents the phosphorus concentration in effluent, with the yellow cycle equivalent to 0.62 mg-P/L as a reference. These studies achieved effluent phosphorus residuals below 0.6 mg-P/L and even as low as 0.03 mg-P/L [71,72]. This indicates that chemical dosages at ratios of 1–10, when used in MBR, can achieve promising and stable phosphorus removal performance. Additionally, in most studies, chemical dosages significantly mitigated membrane fouling, leading to a 20–100% decrease in the rate of trans-membrane pressure (TMP) increase [69,70]. However, in some cases, higher chemical dosages did not yield the expected positive results. Different colors in Figure 3 indicate different chemical types, which seem to have an impact on membrane fouling control.
A linear regression model was applied to analyze the correlation between chemical dosage and increases in TMP. The results indicated that a chemical dosage ratio of up to 4 is a critical threshold for reducing membrane fouling. Higher doses do not necessarily lead to better performance [73]. Ren et al. compared phosphorus removal efficiency and membrane fouling control using ferrous sulfate dosing at molar ratios of 1 and 2 [37]. The dosage ratio of 1 achieved a phosphorus effluent concentration of 0.38 mg-P/L and reduced membrane TMP increases by almost 90% [69,74]. Specifically, Fe (II) dosage increased the diameter of suspended solid particles and reduced the amount of soluble microbial products (SMPs) through coagulation. On the other hand, a ratio of 2 showed similar phosphorus removal performance but did not reduce membrane fouling compared to no chemical dosage. Surface analysis indicated that iron precipitation deposited on the membrane surface caused irreversible fouling. It was reported [74] that high dosage of ferrous salt can lead to the production of fine particles close to the membrane pore size, increasing the risk of fouling.
However, the reality is that dosages of chemicals often exceed 2 in molar ratio, and even surpass a 4 in WWTPs [70,73]. Therefore, other factors should be considered to avoid the negative impacts of high dosage. One solution is to select a favorable chemical. As depicted in Figure 3, ferrous sulfate and aluminum chloride (Orange and Rose-bengal, respectively) appear to be preferable to balance the mitigation of membrane fouling and phosphorus removal [58,74,75]. At the same dosage, ferrous salts are probably more favorable than ferric salts and polymerized ferric chloride (PFC) [71,76,77]. However, it should be noted that dosing Fe (II) is best performed in the anoxic zone. According to previous research, the extent of phosphorus removal would be influenced by the rate of Fe (II) oxidation [74]. Adding Fe (II) to a zone with excess oxygen can remove phosphorus more quickly, but it will also lead to a faster phosphate scaling rate. Despite a slower rate of Fe (II) oxidation, dosing in the anoxic zone is more efficient, as sufficient contact time with in situ-formed ferric oxyhydroxide (AFO) is assured [69]. It has been reported that direct dosing of Fe (III) salt could result in the rapid formation of large particles that deposit on the membrane surface and cause blockages [71]. Fe (II) can alleviate this issue by slowing down the precipitation process, ultimately saving capital costs. Aluminum salts are also widely applied and are more favorable than iron salts because they consume less alkalinity [58,71]. Additionally, the negative impact of chemicals on membrane fouling can also be alleviated by choosing the dosing point. Compared with dosing into the aerobic tank, dosing into an anoxic tank provides enough precipitation time to form large particles and is more conducive to alleviating membrane fouling [71,76].

4.3. Impact of Phosphorus Management Scheme on Sludge Treatment

In addition to wastewater treatment lines, sludge treatment also accounts for significant electricity and chemical consumption [78]. As sludge is discharged from the wastewater treatment processes, the type and/or operation of biological treatment processes could influence the sludge properties, thereby influencing the efficiency of concentrating and dewatering processes. This is also true for phosphorus removal processes. Bashar et al. classified the cost compositions of various phosphorus removal processes, with sludge treatment accounting for about 20% of the total O&M costs [13]. Therefore, sludge treatment should be considered synergistically in the selection and evaluation of phosphorus management strategies.
Phosphorus removal processes have a direct impact on sludge dewatering properties. In terms of EBPR process, the impacts on sludge dewatering are clear and well-established [79,80]. Generally, sludge from the EBPR process is more difficult to dewater [80]. Phosphorus release during sludge treatment is accompanied by the release of cations, of which the divalent ions are then deposited quickly. This results in an increase in the ratio of monovalent cations to divalent cations, leading to a deterioration in sludge dewatering performance. On the other hand, the polyphosphates adsorbed on extracellular polymeric substances (EPS) increase the quantity of bound water, making it more difficult to remove in the dewatering process [80,81,82]. Therefore, sludge from the EBPR process generally requires a higher dosage of flocculant dosage to enhance dewatering efficiency.
In contrast, sludge from the chemical phosphorus removal process presents some unique advantages in dewatering performance that are always overlooked when evaluating the chemical phosphorus removal process. As discussed above, chemical dosage in wastewater treatment lines also promotes sludge aggregation, increases the compactness of sludge flocs, and reduces the amount of SMP [70,83]. These features all contribute to improved sludge dewatering performance, leading to a reduction in the flocculant requirement in the sludge treatment line. Ojo and Ifelebuegu studied the impact of chemical phosphorus removal on sludge dewatering performance [84]. Their results showed that the dosage of Al(III) and Fe(III) salts (with molar ratios 11.48 and 5.54, respectively) at a concentration of 100 mg/L (with a Mixed Liquid Suspended Solids (MLSS) of 3300 mg/L and influent Total Phosphorus (TP) of 10 mg-P/L) improved the sludge dewatering efficiency significantly. In addition, the dewatering performance of sludge from the EBPR process and the chemical phosphorus removal process (with ferric chloride), respectively, were studied and compared. The flocculant required for sludge from chemical phosphorus removal is half of that from EBPR to achieve the same water content (~21%). It is worth noting that the amount and point of chemical dosage are critical in improving dewatering performance, as discussed by Ojo and Ifelebuegu. The pre-precipitation approach improved the dewatering properties of primary sludge, whereas the secondary sludge from a co-precipitation approach seemed to produce a poor dewatering performance. The result was observed in a bench-scale experiment, so there may be uncertainties in extrapolating them. It is also highlighted that chemical phosphorus removal should be evaluated systematically by considering sludge treatment, which requires further research and discussion.
Another possible impact of phosphorus management on sludge treatment is related to anaerobic digestion. Generally, due to the presence of Al and Fe ions in the sludge from chemical phosphorus removal, the sludge particles are larger and denser than those from EBPR, which is an advantage for sludge dewatering. However, this characteristic could decrease mass transfer, leading to a decrease in the reaction rate and biogas yield. This has been summarized and analyzed in many studies, and will not be repeated here [84,85,86]. Chemical phosphorus removal also has some positive effects on sludge digestion. For example, the presence of metal ions in sludge can reduce the content of volatile sulfur compounds (VSCs) in biogas [87] and alleviate the adverse effects of humic substances on digestion [88]. In addition, chemically precipitated sludge releases less phosphorus into the supernatant than EBPR sludge, thereby reducing the phosphorus amount returned to the wastewater treatment line. It should be emphasized that with the increasing emphasis on energy resource recovery in wastewater, chemically enhanced primary treatment to retain more organic matter for energy resource recovery is favored. However, further measures are needed to alleviate or avoid negative effects on the sludge anaerobic digestion process.

5. Phosphorus Recovery and Management

With the emphasis on resource recovery and sustainable wastewater management, the shift from pollutant/resource removal to recovery has been widely accepted. This paradigm shift also dictates that phosphorus recovery should be a priority in WWTPs [2,89,90]. A wide range of phosphorus recovery technologies have been studied and summarized in many articles [2,89,90,91,92,93], so they will not be the focus of this section. Phosphorus recovery from wastewater is not widespread and few projects have been reported in China. Thus, the present work aims to summarize the full-scale application projects of phosphorus recovery, highlighting the development trend and guiding their selection and application to promote the sustainability of WWTPs.
According to the recovery points, phosphorus recovery technologies could be classified into three categories, i.e., aqueous phase recovery, sludge recovery, and sludge ash recovery [94]. In general, phosphorus recovery potential and cost are highly associated with the phosphorus mass content and enrichment. Given the low phosphorus concentration in raw wastewater and effluent, there are no reported trials of phosphorus recovery at these two points. Aqueous phase recovery includes phosphorus recovery from the anaerobic tank and from the reject water of sludge treatment units of which the phosphorus concentrations are at tens or hundreds mg-P/L. In WWTPs with phosphorus removal from wastewater, approximately 90% of phosphorus is transferred to and enriched in sludge [91]. With incineration as the disposal route, phosphorus can be further concentrated and enriched in the sludge incineration ash [2]. As such, sludge and sludge incineration ash are two hotspots and are always processed to extract phosphorus products.
Recently, the European Sustainable Phosphorus Platform updated the inventory of phosphorus recovery and/or recycling facilities in operation or under construction at WWTPs [95]. The historical application of different recovery technologies is summarized and depicted in Figure 4. There are so far 118 reported full-scale phosphorus recovery projects, with a total installed capacity of 18.276 million kg/year. It is worth noting that the installed capacity is not calculated based on a unified substance but a sum of different output products from each recovery technology, such as struvite and hydroxyapatite. Most of the projects are located in the USA, Japan, Germany, and the Netherlands, which together account for 71%. In contrast, only two projects in China are reported and included in the list. The distribution of recovery points is also depicted in Figure 4. Obviously, aqueous phase recovery is the most widely applied approach for phosphorus recovery in terms of numbers, while sludge ash recovery is gradually becoming the largest contributor to installed capacity. Particularly, there has been a significant increase in the installed capacity in recent years and this increase has been mainly due to sludge ash recovery. It seems that the sludge ash recovery approach is more favorable and attractive [91,96]. On the one hand, this evolution in terms of recovery points is associated with policy changes in sludge treatment and disposal. For example, all sludge is incinerated in Japan, while the incineration rate in Germany is 90% as required by the government, and 20% in the USA [97]. This progress justifies the adoption of sludge ash recovery and explains its common application in Japan and Germany. On the other hand, sludge ash recovery is more cost-effective in terms of product-specific costs due to the enrichment of P in the ash compared with the other two approaches [91]. Moreover, sludge ash can be imported into industrial factories to leverage existing plants and avoid new capital investment.
In addition, the approach to phosphorus recovery should be carefully selected and integrated with other resource recovery plans at WWTPs. Hao et al. evaluated the energy recovery potential of two sludge management schemes, one involving sludge dewatering, drying, and sludge incineration, while the other follows anaerobic digestion, dewatering, drying, and incineration [50]. The energy balance analysis showed that the former without anaerobic digestion has a lower energy deficit and operational cost. This suggests that incineration could be a viable alternative to anaerobic digestion for energy recovery from wastewater. Therefore, integrating sludge ash recovery into this approach could economically facilitate phosphorus valorization. Official regulations and guidelines have already promoted sludge incineration as a disposal route for major cities in China [98]. These factors indicate the feasibility of sludge ash recovery to enhance the sustainability of WWTPs.

6. Influence of Phosphorus Removal on GHG Emissions

As summarized and analyzed above, the mass flow of phosphorus and/or the applied phosphorus management strategies have a series of impacts on the operation of WWTPs. In other words, to make WWTPs more sustainable, a phosphorus management strategy is one of the key factors and should be specifically tailored and optimized. Therefore, the level of GHG emissions has been an important benchmark to evaluate the sustainability of WWTPs. The association between phosphorus management and GHG emission, on the one hand, is seldom discussed, as phosphorus is not directly related to CH4 and N2O emissions. On the other hand, phosphorus management strategies significantly contribute to and/or affect the carbon footprint of WWTPs. Falk et al. evaluated GHG emissions of WWTPs to achieve different nutrient discharge limits [99]. The results showed that a stringent nutrient removal target (<2 mg N/L and <0.05 mg-P/L) increased GHG emissions by 130% compared with a general target (8 mg N/L and 1 mg-P/L). In general, phosphorus management requires electricity and chemical input, which contributes to Scope 2 and 3 emissions (Figure 5). In addition, phosphorus removal involves excess sludge abandonment and the treatment and disposal of this sludge also leads to GHG emissions.
The associations between phosphorus management and carbon emissions are complex when viewed systematically. According to the phosphorus mass flow, the phosphorus removal process also impacts other GHG emission activities. For example, post-precipitation configuration [66] requires additional construction works, leading to embodied carbon emissions. Pre-precipitation and co-precipitation schemes can utilize existing facilities fully, but they induce negative impacts on nitrogen removal. Chemical dosing in the primary clarifier can probably remove organic matter excessively and unnecessarily, resulting in a deficiency of carbon source for the following denitrification. A low C/N ratio could induce high N2O emissions or require external carbon dosing, which contributes to Scope 1 or Scope 3 emissions, respectively. Meanwhile, pre-precipitation also brings benefits for energy recovery by allocating more organic matter to anaerobic digestion for biogas production, reducing imported electricity.
The EBPR process also has some unfavorable impacts on GHG emissions of WWTPs. As depicted in Figure 1a, the removed phosphorus flows to the sludge treatment line with wasted sludge and is then released into the supernatant again, particularly in the anaerobic digestion stage. The rejected water flows back to the biological treatment unit and contributes about 35% to the total nutrient loadings. This means that this part of phosphorus is looping internally, which undoubtedly increases electricity consumption (Scope 2 emission). In addition, EBPR results in high phosphorus concentration in an anaerobic tank of the biological unit and sludge treatment line. The presence of magnesium, calcium, and/or ferrous could induce precipitation on the surface of pipelines or equipment, and thus bring extra O&M costs and carbon emission. Chemical phosphorus removal is criticized for its chemical consumption and large sludge production. However, the sludge from the chemical phosphorus removal process generally has better concentration and dewatering properties, which could reduce the flocculants dosed in the sludge treatment line. The opposite occurs in the EBPR process, in which the waste sludge generally requires a large quantity of chemicals to assist in dewatering. Thus, coupling phosphorus management with carbon emissions should include all emission activities within the reporting boundary to evaluate more subjectively and precisely.

7. Conclusions

Overall, phosphorus management strategies are important for meeting stringent discharge standards and also bring some impacts on the operation of WWTPs. Improving the phosphorus management strategy could save significant costs and maintenance work and reduce some impacts on other treatment processes as well as GHG emissions. With the emphasis on GHG emission reduction, WWTPs are striving to minimize their GHG footprint. Therfore, a tailored and systematic phosphorus management strategy is essential for each specific WWTP. Based on the discussion above, the following suggestions are proposed:
(1)
Prioritize phosphorus recovery in WWTPs, with phosphorus removal strategies designed to facilitate recovery.
(2)
The precipitate scaling issue should be noted in WWTPs and taken into consideration in the operation of WWTPs.
(3)
Whether implementing chemical phosphorus removal or EBPR, one should consider effluent discharge standards, other pollutant removal processes, and sludge treatment comprehensively.
(4)
In addition, the shortage of precipitant chemicals could become a bigger problem in the near future, which we have to consider further.
(5)
Phosphorus recovery technologies implemented should be integrated into the sludge disposal pathway and align them with policy directives.

Author Contributions

Conceptualization, R.L. and H.Z.; methodology, H.Z., Q.L. and D.H.; formal analysis, H.Z., Q.L. and D.H.; writing—original draft preparation, H.Z. and Q.L.; writing—review and editing, R.L.; visualization, D.H.; supervision, R.L.; funding acquisition, R.L. All authors have read and agreed to the published version of the manuscript.

Funding

The work is funded by the Beijing Municipal Commission of Education (general project, KM202010016013), Beijing Energy Conservation & Sustainable Urban and Rural Development Provincial and Ministry Co-construction Collaboration Innovation Center (30080921006), and also by the National Natural Science Foundation of China (52000007).

Data Availability Statement

Not applicable.

Acknowledgments

We acknowledge the support from Key Laboratory of Urban Stormwater System and Water Environment, Ministry of Education, China, and Beijing Overseas Talents Association.

Conflicts of Interest

The authors declare no conflicts of interest.

References

  1. European Commission, Directorate-General for Internal Market, Industry, Entrepreneurship and SMEs; Grohol, M.; Veeh, C. Study on the Critical Raw Materials for the EU 2023—Final Report. 2023. Publications Office of the European Union. Available online: https://data.europa.eu/doi/10.2873/725585 (accessed on 20 March 2024).
  2. Zhu, F.; Cakmak, E.K.; Cetecioglu, Z. Phosphorus recovery for circular Economy: Application potential of feasible resources and engineering processes in Europe. Chem. Eng. J. 2023, 454, 140153. [Google Scholar] [CrossRef]
  3. Yang, X.E.; Wu, X.; Hao, H.L.; He, Z.L. Mechanisms and assessment of water eutrophication. J. Zhejiang Univ. Sci. B 2008, 9, 197–209. [Google Scholar] [CrossRef] [PubMed]
  4. GB 18918-2002; Discharge Standard of Pollutants for Municipal Wastewater Treatment Plant. Ministry of Ecology and Environment of the People’s Republic of China: Beijing, China, 2002. Available online: https://www.mee.gov.cn/ywgz/fgbz/bz/bzwb/shjbh/swrwpfbz/200307/W020061027518964575034.pdf (accessed on 20 March 2024).
  5. DB5301/T 62-2021; Dianchi Basin Rural Domestic Sewage Treatment Facilities Water Pollutant Discharge Requirements and Limits. Kunming Administration for Market Regulation: Kunming, China, 2021. Available online: https://dgj.km.gov.cn/upload/resources/file/2022/02/11/3625907.pdf (accessed on 20 March 2024).
  6. Department of Ecological Environment of Shandong Province. Shandong Province 2023 Water Environment Quality Consolidation and Improvement Action Plan, China. 2023. Available online: http://www.shandong.gov.cn/jpaas-jpolicy-web-server/front/info/detail?iid=fc374a5f40634465b7e83b484340ea1a (accessed on 20 March 2024).
  7. European Commission. Proposal for a Directive of the European Parliament and of the Council Concerning Urban Wastewater Treatment (Recast). 2022. Available online: https://eur-lex.europa.eu/resource.html?uri=cellar:fc078ec8-55f7-11ed-92ed-01aa75ed71a1.0001.02/DOC_1&format=PDF (accessed on 20 March 2024).
  8. Fox, R. Accelerating Nutrient Pollution Reductions in the Nation’s Waters. United States Evironmental Protection Agency. 2022. Available online: https://www.epa.gov/nutrientpollution (accessed on 20 March 2024).
  9. Wang, D.; Tooker, N.B.; Srinivasan, V.; Li, G.; Fernandez, L.A.; Schauer, P.; Menniti, A.; Maher, C.; Bott, C.B.; Dombrowski, P.; et al. Side-stream enhanced biological phosphorus removal (S2EBPR) process improves system performance—A full-scale comparative study. Water Res. 2019, 167, 115109. [Google Scholar] [CrossRef] [PubMed]
  10. Liu, R.; Hao, X.; Chen, Q.; Li, J. Research advances of Tetrasphaera in enhanced biological phosphorus removal: A review. Water Res. 2019, 166, 115003. [Google Scholar] [CrossRef] [PubMed]
  11. Clark, T.; Stephenson, T.; Pearce, P. Phosphorus removal by chemical precipitation in a biological aerated filter. Water Res. 1997, 31, 2557–2563. [Google Scholar] [CrossRef]
  12. Williams, M.B. Cost of Phosphorus Removal at Wisconsin Publically-Owned Treatment Works. Wisconsin Department of Natural Resources. 2012. Available online: https://dnr.wisconsin.gov/topic/environment (accessed on 20 March 2024).
  13. Bashar, R.; Gungor, K.; Karthikeyan, K.; Barak, P. Cost effectiveness of phosphorus removal processes in municipal wastewater treatment. Chemosphere 2018, 197, 280–290. [Google Scholar] [CrossRef] [PubMed]
  14. Shemmans, D.; Haigh, M. Net Zero 2030 Routemap. Water UK. 2020. Available online: https://www.water.org.uk/news-views-publications/publications/net-zero-2030-routemap (accessed on 20 March 2024).
  15. Blythe, G. Navigating to Net Zero: Aotearoa’s Water Sector Low-Carbon Journey. 2021. Available online: https://www.waternz.org.nz/NavigatingtoNetZero (accessed on 20 March 2024).
  16. Christensen, N.K. Guidelines for Reporting in Line with Paris Model for a Climate- and Energy-Neutral Water Sector. The Danish Environmental Protection Agency. 2021. Available online: https://www2.mst.dk/Udgiv/publications/2021/04/978-87-7038-298-4.pdf (accessed on 20 March 2024).
  17. Neville, L. Statement of Obligations (Emission Reduction). 2022. Available online: https://www.g-mwater.com.au/news-updates/reports-and-publications/statements-of-obligations (accessed on 20 March 2024).
  18. Jupp, A.R.; Beijer, S.; Narain, G.C.; Schipper, W.; Slootweg, J.C. Phosphorus recovery and recycling—Closing the loop. Chem. Soc. Rev. 2021, 50, 87–101. [Google Scholar] [CrossRef]
  19. Marti, N.; Bouzas, A.; Seco, A.; Ferrer, J. Struvite precipitation assessment in anaerobic digestion processes. Chem. Eng. J. 2008, 141, 67–74. [Google Scholar] [CrossRef]
  20. Chu, W.; Shi, Y.; Zhang, L. Recovery of Phosphorus in Wastewater in the Form of Polyphosphates: A Review. Processes 2022, 10, 144. [Google Scholar] [CrossRef]
  21. Fernández-Arévalo, T.; Lizarralde, I.; Fdz-Polanco, F.; Pérez-Elvira, S.; Garrido, J.; Puig, S.; Poch, M.; Grau, P.; Ayesa, E. Quantitative assessment of energy and resource recovery in wastewater treatment plants based on plant-wide simulations. Water Res. 2017, 118, 272–288. [Google Scholar] [CrossRef]
  22. Solon, K.; Flores-Alsina, X.; Mbamba, C.K.; Ikumi, D.; Volcke, E.; Vaneeckhaute, C.; Ekama, G.; Vanrolleghem, P.; Batstone, D.; Gernaey, K.; et al. Plant-wide modelling of phosphorus transformations in wastewater treatment systems: Impacts of control and operational strategies. Water Res. 2017, 113, 97–110. [Google Scholar] [CrossRef] [PubMed]
  23. Lizarralde, I.; Fernandez-Arevalo, T.; Manas, A.; Ayesa, E.; Grau, R. Model-based opti mization of phosphorus management strategies in Sur WWTP, Madrid. Water Res. 2019, 153, 39–52. [Google Scholar] [CrossRef] [PubMed]
  24. Majed, N.; Gu, A.Z. Phenotypic dynamics in polyphosphate and glycogen accumulating organisms in response to varying influent C/P ratios in EBPR systems. Sci. Total Environ. 2020, 743, 140603. [Google Scholar] [CrossRef] [PubMed]
  25. Jia, X.; Zhao, X.; Zhou, Y.; Li, F.; Liu, W.; Huang, Y.; Zhang, H.; Ma, J.; Hu, G. Tri-functional lanthanum-based biochar for efficient phosphorus recovery, bacterial inhibition, and soil fertility enhancement. Biochar 2023, 5, 16. [Google Scholar] [CrossRef]
  26. Neethling, J.; Benisch, M. Struvite control through process and facility design as well as operation strategy. Water Sci. Technol. 2004, 49, 191–199. [Google Scholar] [CrossRef] [PubMed]
  27. Pastor, L.; Marti, N.; Bouzas, A.; Seco, A. Sewage sludge management for phosphorus recovery as struvite in EBPR wastewater treatment plants. Bioresour. Technol. 2008, 99, 4817–4824. [Google Scholar] [CrossRef] [PubMed]
  28. Bergmans, B.; Veltman, A.; van Loosdrecht, M.; van Lier, J.; Rietveld, L. Struvite formation for enhanced dewaterability of digested wastewater sludge. Environ. Technol. 2014, 35, 549–555. [Google Scholar] [CrossRef] [PubMed]
  29. Venkatesan, A.K.; Hamdan, A.-H.M.; Chavez, V.M.; Brown, J.D.; Halden, R.U. Mass Balance Model for Sustainable Phosphorus Recovery in a US Wastewater Treatment Plant. J. Environ. Qual. 2016, 45, 84–89. [Google Scholar] [CrossRef]
  30. Schauer, P.; Baur, R.; Barnard, J.; Britton, A. Controlling Magnesium and Phosphorus to Reduce Struvite Precipitation in Plant Processes and Increase Revenue. Proc. Water Environ. Fed. 2009, 2009, 926–947. [Google Scholar] [CrossRef]
  31. Mamais, D.; Pitt, P.A.; Cheng, Y.W.; Loiacono, J.; Jenkins, D. Determination of ferric chloride dose to control struvite precipitation in anaerobic sludge digesters. Water Environ. Res. 1994, 66, 912–918. [Google Scholar] [CrossRef]
  32. Achilleos, P.; Roberts, K.R.; Williams, I.D. Struvite precipitation within wastewater treatment: A problem or a circular economy opportunity? Heliyon 2022, 8, e09862. [Google Scholar] [CrossRef] [PubMed]
  33. Chen, Y.; Lin, H.; Shen, N.; Yan, W.; Wang, J.; Wang, G. Phosphorus release and recovery from Fe-enhanced primary sedimentation sludge via alkaline fermentation. Bioresour. Technol. 2019, 278, 266–271. [Google Scholar] [CrossRef] [PubMed]
  34. Doyle, J.D.; Parsons, S.A. Struvite formation, control and recovery. Water Res. 2002, 36, 3925–3940. [Google Scholar] [CrossRef] [PubMed]
  35. Wilfert, P.; Mandalidis, A.; Dugulan, A.; Goubitz, K.; Korving, L.; Temmink, H.; Witkamp, G.; Van Loosdrecht, M. Vivianite as an important iron phosphate precipitate in sewage treatment plants. Water Res. 2016, 104, 449–460. [Google Scholar] [CrossRef] [PubMed]
  36. Hu, D.; Zhou, Z.; Niu, T.; Wei, H.; Dou, W.; Jiang, L.-M.; Lv, Y. Co-treatment of reject water from sludge dewatering and supernatant from sludge lime stabilization process for nutrient removal: A cost-effective approach. Sep. Purif. Technol. 2017, 172, 357–365. [Google Scholar] [CrossRef]
  37. Ren, W.; Zhou, Z.; Jiang, L.-M.; Hu, D.; Qiu, Z.; Wei, H.; Wang, L. A cost-effective method for the treatment of reject water from sludge dewatering process using supernatant from sludge lime stabilization. Sep. Purif. Technol. 2015, 142, 123–128. [Google Scholar] [CrossRef]
  38. Ren, W.; Zhou, Z.; Wan, L.; Hu, D.; Jiang, L.-M.; Wang, L. Optimization of phosphorus removal from reject water of sludge thickening and dewatering process through struvite precipitation. Desalin. Water Treat. 2016, 57, 15515–15523. [Google Scholar] [CrossRef]
  39. Xavier, L.D.; Cammarota, M.C.; Yokoyama, L.; Volschan, I. Study of the recovery of phosphorus from struvite precipitation in supernatant line from anaerobic digesters of sludge. Water Sci. Technol. 2014, 69, 1546–1551. [Google Scholar] [CrossRef] [PubMed]
  40. Huang, H.; Liu, J.; Ding, L. Recovery of phosphate and ammonia nitrogen from the anaerobic digestion supernatant of activated sludge by chemical precipitation. J. Clean. Prod. 2015, 102, 437–446. [Google Scholar] [CrossRef]
  41. Martí, N.; Pastor, L.; Bouzas, A.; Ferrer, J.; Seco, A. Phosphorus recovery by struvite crystallization in WWTPs: Influence of the sludge treatment line operation. Water Res. 2010, 44, 2371–2379. [Google Scholar] [CrossRef]
  42. Fattah, K.P.; Chowdhury, F.L. Early detection of struvite formation in wastewater treatment plants. J. Environ. Eng. Sci. 2015, 10, 19–25. [Google Scholar] [CrossRef]
  43. Buchanan, J.R.; Mote, C.R.; Robinson, R.B. Struvite Control by Chemical Treatment. Trans. ASAE 1994, 37, 1301–1308. [Google Scholar] [CrossRef]
  44. Wierzbicki, A.; Sallis, J.D.; Stevens, E.D.; Smith, M.; Sikes, C.S. Crystal Growth and Molecular Modeling Studies of Inhibition of Struvite by Phosphocitrate. Calcif. Tissue Int. 1997, 61, 216–222. [Google Scholar] [CrossRef]
  45. Li, H.; Yu, S.-H.; Yao, Q.-Z.; Zhou, G.-T.; Fu, S.-Q. Chemical control of struvite scale by a green inhibitor polyaspartic acid. RSC Adv. 2015, 5, 91601–91608. [Google Scholar] [CrossRef]
  46. Deng, L.; Dhar, B.R. Phosphorus recovery from wastewater via calcium phosphate precipitation: A critical review of methods, progress, and insights. Chemosphere 2023, 330, 138685. [Google Scholar] [CrossRef]
  47. Keysar, S.; Semiat, R.; Hasson, D.; Yahalom, J. Effect of Surface Roughness on the Morphology of Calcite Crystallizing on Mild Steel. J. Colloid Interface Sci. 1994, 162, 311–319. [Google Scholar] [CrossRef]
  48. Parsons, S.; Doyle, J. Struvite scale formation and control. Water Sci. Technol. 2004, 49, 177–182. [Google Scholar] [CrossRef]
  49. Heinzmann, B. Induced Magnesium Ammonia Phosphate Precipitation to Prevent Incrustations and Measures for Phosphorus Recovery. Water Pract. Technol. 2006, 1, wpt2006051. [Google Scholar] [CrossRef]
  50. Hao, X.; Chen, Q.; van Loosdrecht, M.C.M.; Li, J.; Jiang, H. Sustainable disposal of excess sludge: Incineration without anaerobic digestion. Water Res. 2020, 170, 115298. [Google Scholar] [CrossRef]
  51. Stephens, H.M.; Neethling, J.; Benisch, M.; Gu, A.Z.; Stensel, H.D. Comprehensive analysis of full-scale enhanced biological phosphorus removal facilities. Proc. Water Environ. Fed. 2004, 2004, 89–107. [Google Scholar] [CrossRef]
  52. Strom, P.F. Technologies to Remove Phosphorus from Wastewater; Rutgers University: New Brunswick, NJ, USA, 2006; pp. 1–8. Available online: http://www.water.rutgers.edu/Projects/trading/p-trt-lit-rev-2a.pdf (accessed on 20 March 2024).
  53. Karunanithi, R.; Szogi, A.A.; Bolan, N.; Naidu, R.; Loganathan, P.; Hunt, P.G.; Vanotti, M.B.; Saint, C.P.; Ok, Y.S.; Krishnamoorthy, S. Phosphorus Recovery and Reuse from Waste Streams. In Advances in Agronomy; Elsevier: Amsterdam, The Netherlands, 2015; Volume 131, pp. 173–250. [Google Scholar]
  54. Azam, H.M.; Alam, S.T.; Hasan, M.; Yameogo, D.D.S.; Kannan, A.D.; Rahman, A.; Kwon, M.J. Phosphorous in the environment: Characteristics with distribution and effects, removal mechanisms, treatment technologies, and factors affecting recovery as minerals in natural and engineered systems. Environ. Sci. Pollut. Res. 2019, 26, 20183–20207. [Google Scholar] [CrossRef] [PubMed]
  55. Drynan, W.R. Relativecosts of Achieving Various Levels of Phosphorus control at Municipal Wastewater Treatment Plants in the Great Lakes Basin. International Joint Commission. 1979. Available online: http://hdl.handle.net/10214/14456 (accessed on 20 March 2024).
  56. Jiang, F.; Beck, M.B.; Cummings, R.G.; Rowles, K.; Russell, D. Estimation of costs of phosphorus removal in wastewater treatment facilities: Adaptation of existing facilities. Water Policy Work. Pap. 2005, 11, 1–45. [Google Scholar]
  57. Hazen and Sawyer. Treatment Strategies for Meeting Ultra-Low Total Phosphorus Limits: Performance and Pilots. 2022. Available online: https://www.hazenandsawyer.com (accessed on 20 March 2024).
  58. Sun, G.; Zhang, C.; Li, W.; Yuan, L.; He, S.; Wang, L. Effect of chemical dose on phosphorus removal and membrane fouling control in a UCT-MBR. Front. Environ. Sci. Eng. 2018, 13, 1. [Google Scholar] [CrossRef]
  59. Smith, C. Phosphorus Removal Evaluation for the Geneva Wastewater Treatment Facility. City of Geneva. 2015. Available online: https://www.geneva.il.us/301/Wastewater-Treatment-Plant (accessed on 20 March 2024).
  60. Battistoni, P.; De Angelis, A.; Pavan, P.; Prisciandaro, M.; Cecchi, F. Phosphorus removal from a real anaerobic supernatant by struvite crystallization. Water Res. 2001, 35, 2167–2178. [Google Scholar] [CrossRef] [PubMed]
  61. Lin, L.; Li, R.-H.; Yang, Z.-Y.; Li, X.-Y. Effect of coagulant on acidogenic fermentation of sludge from enhanced primary sedimentation for resource recovery: Comparison between FeCl3 and PACl. Chem. Eng. J. 2017, 325, 681–689. [Google Scholar] [CrossRef]
  62. Falk, M.W.; Reardon, D.J.; Neethling, J.; Clark, D.L.; Pramanik, A. Striking the Balance between Nutrient Removal, Greenhouse Gas Emissions, Receiving Water Quality, and Costs. Water Environ. Res. 2013, 85, 2307–2316. [Google Scholar] [CrossRef] [PubMed]
  63. Shi, J.; Lu, X.; Yu, R.; Zhu, W. Nutrient removal and phosphorus recovery performances of a novel anaerobic-anoxic/nitrifying/induced crystallization process. Bioresour. Technol. 2012, 121, 183–189. [Google Scholar] [CrossRef] [PubMed]
  64. Lee, H.; Yun, Z. Comparison of biochemical characteristics between PAO and DPAO sludges. J. Environ. Sci. 2014, 26, 1340–1347. [Google Scholar] [CrossRef] [PubMed]
  65. Dai, H.; Sun, Y.; Wan, D.; Abbasi, H.N.; Guo, Z.; Geng, H.; Wang, X.; Chen, Y. Simultaneous denitrification and phosphorus removal: A review on the functional strains and activated sludge processes. Sci. Total Environ. 2022, 835, 155409. [Google Scholar] [CrossRef] [PubMed]
  66. Derco, J.; Kuffa, R.; Urminská, B.; Dudáš, J.; Kušnierová, J. Influence of Phosphorus Precipitation on Wastewater Treatment Processes. In Operations Research-the Art of Making Good Decisions; Jian, K., Ed.; InTech: Houston, TX, USA, 2016. [Google Scholar] [CrossRef]
  67. Bliss, P.J.; Ostarcevic, E.R.; Potter, A.A. Process optimisation for simultaneous biological nitrification and chemical phosphorus removal. Water Sci. Technol. 1994, 29, 107–115. [Google Scholar] [CrossRef]
  68. de Haas, D.; Wentze, M.; Ekama, G. The use of simultaneous chemical precipitation in modified activated sludge systems exhibiting biological excess phosphate removal—Part 1: Literature review. Water SA 2009, 26, 453–466. [Google Scholar]
  69. Ren, B.; Li, C.; Zhang, X.; Zhang, Z. Fe(II)-dosed ceramic membrane bioreactor for wastewater treatment: Nutrient removal, microbial community and membrane fouling analysis. Sci. Total Environ. 2019, 664, 116–126. [Google Scholar] [CrossRef]
  70. Li, X.; Liu, Y.; Liu, F.; Liu, A.; Feng, Q. Comparison of ferric chloride and aluminum sulfate on phosphorus removal and membrane fouling in MBR treating BAF effluent of municipal wastewater. J. Water Reuse Desalin. 2016, 7, 442–448. [Google Scholar] [CrossRef]
  71. Wang, Y.; Tng, K.; Wu, H.; Zhang, Z.; Liu, X.; Leslie, G.; Waite, T.D. Effects of Ferric and Ferrous Iron Addition on Membrane Bioreactor Effluent Quality. The MBR Site. 2015. Available online: https://www.thembrsite.com/features/effects-ferric-ferrous-iron-addition-mbr-effluent-quality/ (accessed on 20 March 2024).
  72. Lee, E.-J.; An, A.K.; Kim, H.-S. Effects of Coagulant with Different Basicity on Membrane-based Biological Treatment for Removing Phosphorus. J. Coast. Res. 2017, 79, 65–69. [Google Scholar] [CrossRef]
  73. Manzouri, M.; Shon, H. Rectification methods for the fouling of ultrafiltration hollow-fibre membranes as a result of excessive soluble iron. Desalin. Water Treat. 2011, 32, 437–444. [Google Scholar] [CrossRef]
  74. Wang, Y.; Tng, K.H.; Wu, H.; Leslie, G.; Waite, T.D. Removal of phosphorus from wastewaters using ferrous salts—A pilot scale membrane bioreactor study. Water Res. 2014, 57, 140–150. [Google Scholar] [CrossRef] [PubMed]
  75. Song, K.-G.; Kim, Y.; Ahn, K.-H. Effect of coagulant addition on membrane fouling and nutrient removal in a submerged membrane bioreactor. Desalination 2008, 221, 467–474. [Google Scholar] [CrossRef]
  76. Zhang, Z.; Wang, Y.; Leslie, G.L.; Waite, T.D. Effect of ferric and ferrous iron addition on phosphorus removal and fouling in submerged membrane bioreactors. Water Res. 2014, 69, 210–222. [Google Scholar] [CrossRef] [PubMed]
  77. Yang, B.; Jiang, S.; Zhang, C.; Zhao, G.; Wu, M.; Xiao, N.; Su, P. Recovery of iron from iron-rich pickling sludge for preparing P-doped polyferric chloride coagulant. Chemosphere 2021, 283, 131216. [Google Scholar] [CrossRef]
  78. Zhuang, H.; Guan, J.; Leu, S.-Y.; Wang, Y.; Wang, H. Carbon footprint analysis of chemical enhanced primary treatment and sludge incineration for sewage treatment in Hong Kong. J. Clean. Prod. 2020, 272, 122630. [Google Scholar] [CrossRef]
  79. Capodici, M.; Mannina, G.; Torregrossa, M. Waste activated sludge dewaterability: Comparative evaluation of sludge derived from CAS and MBR systems. Desalin. Water Treat. 2016, 57, 22917–22925. [Google Scholar] [CrossRef]
  80. Mentzer, C.; Drinkwater, M.; Pagilla, K.R. Investigation of direct waste-activated sludge dewatering benefits and costs in a water resource recovery facility. Water Environ. Res. 2021, 93, 2998–3010. [Google Scholar] [CrossRef] [PubMed]
  81. Higgins, M.; Bott, C.; Schauer, P.; Beightol, S. Does Bio–P Impact Dewatering after Anaerobic Digestion? Yes, and not in a good way! In Proceedings of the Residuals and Biosolids Conference 2014, Austin, TX, USA, 18–21 May 2014; pp. 1–11. [Google Scholar]
  82. Mangrum, C.R.L.; Jenkins, D. The effect of divalent cation complexation on anaerobically digested enhanced biological phosphorus removal sludge dewatering performance. Water Environ. Res. 2019, 92, 677–688. [Google Scholar] [CrossRef] [PubMed]
  83. Wu, J.; Chen, F.; Huang, X.; Geng, W.; Wen, X. Using inorganic coagulants to control membrane fouling in a submerged membrane bioreactor. Desalination 2006, 197, 124–136. [Google Scholar] [CrossRef]
  84. Ojo, P.; Ifelebuegu, A.O. The Effects of Aluminium- and Ferric-Based Chemical Phosphorus Removal on Activated Sludge Digestibility and Dewaterability. Processes 2019, 7, 228. [Google Scholar] [CrossRef]
  85. Kindzierski, W.B.; Hrudey, S.E. Effects of phosphorus removal chemicals upon methane production during anaerobic sludge digestion. Can. J. Civ. Eng. 1986, 13, 33–38. [Google Scholar] [CrossRef]
  86. Abbott, T.L. Effects of Metal Salts on Odour, Pathogens, Dewaterability and Orthophosphate during the Anaerobic Digestion of Municipal Waste Sludge. Ph.D. Thesis, University of British Columbia, Vancouver, BC, Canada, 2014. [Google Scholar] [CrossRef]
  87. Luo, H.; Sun, Y.; Taylor, M.; Nguyen, C.; Strawn, M.; Broderick, T.; Wang, Z.W. Impacts of aluminum- and iron-based coagulants on municipal sludge anaerobic digestibility, dewaterability, and odor emission. Water Environ. Res. 2022, 94, e1684. [Google Scholar] [CrossRef] [PubMed]
  88. Li, J.; Hao, X.; Gan, W.; van Loosdrecht, M.C.; Wu, Y. Recovery of extracellular biopolymers from conventional activated sludge: Potential, characteristics and limitation. Water Res. 2021, 205, 117706. [Google Scholar] [CrossRef]
  89. Chrispim, M.C.; Scholz, M.; Nolasco, M.A. Phosphorus recovery from municipal wastewater treatment: Critical review of challenges and opportunities for developing countries. J. Environ. Manag. 2019, 248, 109268. [Google Scholar] [CrossRef]
  90. Law, K.P.; Pagilla, K.R. Reclaimed phosphorus commodity reserve from water resource recovery facilities—A strategic regional concept towards phosphorus recovery. Resour. Conserv. Recycl. 2019, 150, 104429. [Google Scholar] [CrossRef]
  91. Egle, L.; Rechberger, H.; Krampe, J.; Zessner, M. Phosphorus recovery from municipal wastewater: An integrated comparative technological, environmental and economic assessment of P recovery technologies. Sci. Total Environ. 2016, 571, 522–542. [Google Scholar] [CrossRef] [PubMed]
  92. Cieślik, B.; Konieczka, P. A review of phosphorus recovery methods at various steps of wastewater treatment and sewage sludge management. The concept of “no solid waste generation” and analytical methods. J. Clean. Prod. 2017, 142, 1728–1740. [Google Scholar] [CrossRef]
  93. Wu, Y.; Luo, J.; Zhang, Q.; Aleem, M.; Fang, F.; Xue, Z.; Cao, J. Potentials and challenges of phosphorus recovery as vivianite from wastewater: A review. Chemosphere 2019, 226, 246–258. [Google Scholar] [CrossRef] [PubMed]
  94. Egle, L.; Rechberger, H.; Zessner, M. Overview and description of technologies for recovering phosphorus from municipal wastewater. Resour. Conserv. Recycl. 2015, 105, 325–346. [Google Scholar] [CrossRef]
  95. Kabbe, C. Inventory of Phosphorus “Recovery and/or Recycling” Facilities Operating or under Construction at or Downstream of Wastewater Treatment Installations. European Sustainable Phosphorus Platform. 2023. Available online: https://www.phosphorusplatform.eu/activities/p-recovery-technology-inventory (accessed on 20 March 2024).
  96. Amann, A.; Zoboli, O.; Krampe, J.; Rechberger, H.; Zessner, M.; Egle, L. Environmental impacts of phosphorus recovery from municipal wastewater. Resour. Conserv. Recycl. 2018, 130, 127–139. [Google Scholar] [CrossRef]
  97. Koppes, J. The Changing Landscape of Sludge Disposal. 2022. Available online: https://www.solenis.com (accessed on 20 March 2024).
  98. The National Development and Reform Commission, the Ministry of Housing and Urban-Rural Development & the Ministry of Ecology and Environment. Implementation Plan for Harmless Treatment and Resource Utilization of Sludge, China. 2022. Available online: https://www.mohurd.gov.cn/gongkai/zhengce/zhengcefilelib/202209/20220928_768178.html (accessed on 20 March 2024).
  99. Falk, M.W.; Neethling, J.; Reardon, D.J. Striking the Balance between Nutrient Removal in Wastewater Treatment and Sustainability; IWA Publishing: London, UK, 2011. [Google Scholar] [CrossRef]
Figure 1. Phosphorus mass flow in WWTPs adopting (a) EBPR process (the above number) or post-chemically assisted EBPR process (bottom number) and (b) chemical phosphorus removal process.
Water 16 01539 g001
Figure 2. The correlation between achievable phosphorus limit and O&M costs (a) as well as the cost comparison among various phosphorus removal processes (b). (Different symbols represent data from different references).
Water 16 01539 g002
Figure 3. The membrane fouling potential under various chemical dosage ratios/types in the MBR reactor (bubble size indicates the phosphorus residual in effluent). (PAC—polyaluminum chloride; PFC—polymerization ferric chloride).
Water 16 01539 g003
Figure 4. The historical evolution of the global phosphorus recovery projects in terms of (a) project number (stacked area chart) and installed capacity (stacked column chart) and (b) country distribution.
Water 16 01539 g004
Figure 5. Phosphorus removal in WWTPs and association with GHG emission (red dots represent associated GHG emission activities).
Water 16 01539 g005
Table 1. The compositions of typical reject supernatant and precipitation potential.
SourcesPNH4+Ca2+Mg2+pHQc1Qc2SSR1SSR2NoteRef.
The supernatant of thickening and dewatering without digestion3410594217.47.05 × 10−91.50 × 10⁻¹⁴>1>1EBPR+chemi-cal P removal1
6827294n.f.7.4/5.98 × 10−14/>12
9427294197.74.57 × 10−81.14 × 10⁻¹³>1>13
The supernatant of digested sludge3074163148.032.93 × 10−83.51 × 10⁻¹⁵>1>1EBPR+chemi-cal P removal4
Of digestion6336837287.76.10 × 10−83.13 × 10⁻¹⁵>1>1EBPR5
The supernatant mixture of thickening and dewatering of digested sludge145.8355.265.8104.575.09 × 10−79.44 × 10⁻¹⁴>1>1Pilot plant with EBPR6
50.1400.491.969.76.91.31 × 10−73.04 × 10⁻¹⁴>1>16
43129129.949.86.72.60 × 10−86.32 × 10⁻¹⁴>1>16
The supernatant of digested sludge150.6541.76993.27.27.15 × 10−71.16 × 10⁻¹³>1>16
Note: Qc1 is the ion product of struvite (ion product is the chemical equilibrium constant that represents the solubility of a substance); Qc2 is the ion product of amorphous calcium phosphate (ACP); SSR1 is the ion product/solubility product (of struvite); SSR2 is the ion product/solubility product (of ACP). The solubility product of struvite is calculated to be 2.50 × 10⁻¹³, and the solubility product of ACP is calculated to be 2.00 × 10⁻²⁹. All ion concentration units in the table are in mg/L. References: 1 [36]; 2 [37]; 3 [38]; 4 [39]; 5 [40]; 6 [41].
Disclaimer/Publisher’s Note: The statements, opinions and data contained in all publications are solely those of the individual author(s) and contributor(s) and not of MDPI and/or the editor(s). MDPI and/or the editor(s) disclaim responsibility for any injury to people or property resulting from any ideas, methods, instructions or products referred to in the content.

