Article

Deformation and Strength of Unsaturated Loess—Hydraulic Coupling Effects under Loads

School of Geology Engineering and Geomatics, Chang’an University, Xi’an 710054, China
*
Author to whom correspondence should be addressed.
Water 2024, 16(7), 997; https://doi.org/10.3390/w16070997
Submission received: 11 March 2024 / Revised: 24 March 2024 / Accepted: 26 March 2024 / Published: 29 March 2024
(This article belongs to the Section Hydraulics and Hydrodynamics)

Abstract

:
The volumetric change in unsaturated loess during loading causes serious damage to the foundation and structure, accompanied by changes in hydraulic conditions. Therefore, quantifying the change in the load effect of loess under hydraulic coupling is of great significance for revealing the mechanism of hydraulic interaction. This study conducts isotropic compression and undrained shear tests on unsaturated compacted loess, simultaneously introducing the strength parameter η to enhance the Glasgow coupled model (GCM). The objective is to elucidate the hydraulic and mechanical coupling mechanism, where saturation increases under mechanical effects lead to strength degradation. The results show that saturation increases under mechanical effects improve the compressibility of the sample, and saturation has a direct impact on the stress–strain relationship. The increase in water content and confining pressure increases the trend of the critical state stress ratio M decreasing, and the strain softening trend increases. The compression of volume during shear tests increases the saturation, changes the hydraulic characteristics of loess, and affects the deformation and strength of loess. The modified GCM improves the applicability and prediction accuracy of unsaturated loess under the same initial state. The research results are of great significance for revealing the hydraulic and mechanical behavior of loess.

1. Introduction

The loess in China is widely distributed in provinces characterized by arid and semi-arid climates such as Shaanxi, Shanxi, Gansu, Ningxia, and Xinjiang [1]. In these arid and semi-arid regions, the groundwater level is generally deep, resulting in the soil often being in a partially saturated state. With large-scale engineering projects such as flat mountain construction in the hilly and gully areas of the Loess Plateau [2], engineering practices are based on compacted unsaturated loess, including loess foundations [3] and loess subgrades [4].
Loess, a type of unsaturated soil, displays water sensitivity. It exhibits high strength and low compressibility when the water content is low, but its strength decreases significantly and deformation increases greatly with high water content [5,6]. The mechanical behavior of loess is significantly influenced by water, establishing a close connection with loess engineering geology. As soil water content varies, the matric suction of unsaturated soil also changes, making it a key factor influencing the mechanical characteristics of unsaturated loess [7]. Many scholars have conducted extensive research on the influence of matric suction on the mechanical properties of loess. Volume change is one of the most basic characteristics of soil [8]. Through isotropic compression tests with constant suction, the normal compression curve of unsaturated loess flattens and moves downward as the suction decreases [9,10], indicating that the suction level has a significant impact on the compressibility of unsaturated loess [11]. Triaxial tests are widely regarded as the most appropriate approach for researching the mechanical properties of rocks and soils in laboratory settings. [12]. Many scholars have studied the relationship between shear strength and suction by controlling suction in triaxial tests under constant matric suction conditions [13,14], constant water content conditions [15,16], and true triaxial conditions [7,17]. Despite the potential for studying matric suction in unsaturated soil provided by the triaxial testing apparatus using the axis translation technique, the slow loading rate required to maintain equilibrium between pore water pressure and pore air pressure leads to extended test cycles. Additionally, measurements of pore air pressure and pore water pressure at the boundaries may not fully capture the characteristics of the entire specimen [18]. In cases of rapid loading application without sufficient time for pore water pressure to stabilize, the matric suction of the soil alters, deviating from the desired controllable suction state usually maintained in laboratory experiments [19,20]. Therefore, many scholars have attempted to study the shear strength characteristics with constant water content during the shear process of unsaturated soils through undrained and unconsolidated (UU) tests. Wong [18] estimated the change in matric suction during the shear process by measuring matric suction before and after a UU test and using a soil water characteristic curve (SWCC) with equilibrium soil suction, explaining the characteristics of the undrained shear strength of compacted clay. Pujiastuti [21] measured the matric suction using the filter paper method and conducted a series of UU tests to measure the shear strength of unsaturated sandy clay, obtaining the relationship between shear strength, cohesion, internal friction angle, and matric suction. Therefore, utilizing UU tests to examine unsaturated soils and predict variations in matric suction throughout the shearing process based on the soil–water characteristic curve is a viable approach.
A constitutive soil model comprises a mathematical description that elucidates the mechanical characteristics of soil. Within geotechnical engineering, a pivotal responsibility involves choosing an appropriate constitutive model that can effectively depict the soil’s failure or deformation conditions [22]. For the constitutive model of unsaturated soil, with a focus on the influence of matric suction on soil compressibility, the Barcelona Basic Model (BBM) was established through the adaptation of the Modified Cambridge Model (MCCM) [23]. Pedroso et al. [24] further improved the model with the extended Barcelona Basic Model (BBMx), which can respond to cyclic loading. However, considering suction alone cannot explain the influence of saturation on mechanical behavior [25]. Based on the understanding of hydraulic hysteresis, scholars have proposed hydraulic coupling models that consider the plastic deformation of soil caused by changes in saturation, such as the Glasgow coupled model (GCM), SFG model, and UNSW model [26,27,28,29,30]. Building upon hydraulic coupling, many researchers have incorporated intergranular bonding effects into constitutive models, leading to the development of constitutive models considering intergranular bonding [31,32,33]. As for the existing constitutive models applied to unsaturated loess, most of them consider its structural characteristics and propose structural parameters to study the deformation behavior and strength characteristics exhibited by structural failure during loading [34,35,36]. The volumetric deformation and changes in water content caused by the wetting or drying of unsaturated soil also have an impact on the structural properties of the soil. Therefore, considering the hydraulic characteristics of unsaturated loess is also crucial. However, research on the hydraulic coupling characteristics of unsaturated loess is still limited. Therefore, analyzing the hydraulic coupling effect of unsaturated loess under undrained conditions through hydraulic coupling models is of great theoretical and practical significance for understanding its strength and deformation behavior under loads.
Therefore, this article conducts isotropic compression tests and undrained shear tests on unsaturated loess, studying the hydraulic coupling effect of unsaturated loess under isotropic compression and shear conditions with constant water content. The estimation of the variation in matric suction during the shear process is based on the soil–water characteristic curve. The triaxial tests are simulated using BBMx and GCM, enabling a comparison between the simulation outcomes of BBMx and GCM with the experimental data. The hydraulic coupling characteristics of unsaturated loess under rapid loading conditions without drainage are analyzed. The strength parameter η, which characterizes the attenuation of initial strength with increasing saturation during shear, is introduced into the GCM to reveal the hydraulic coupling effect of strength attenuation with increasing saturation during shear. This improves its applicability to loess and provides a theoretical basis for engineering practice in loess distribution areas.

2. Materials and Methods

2.1. Samples

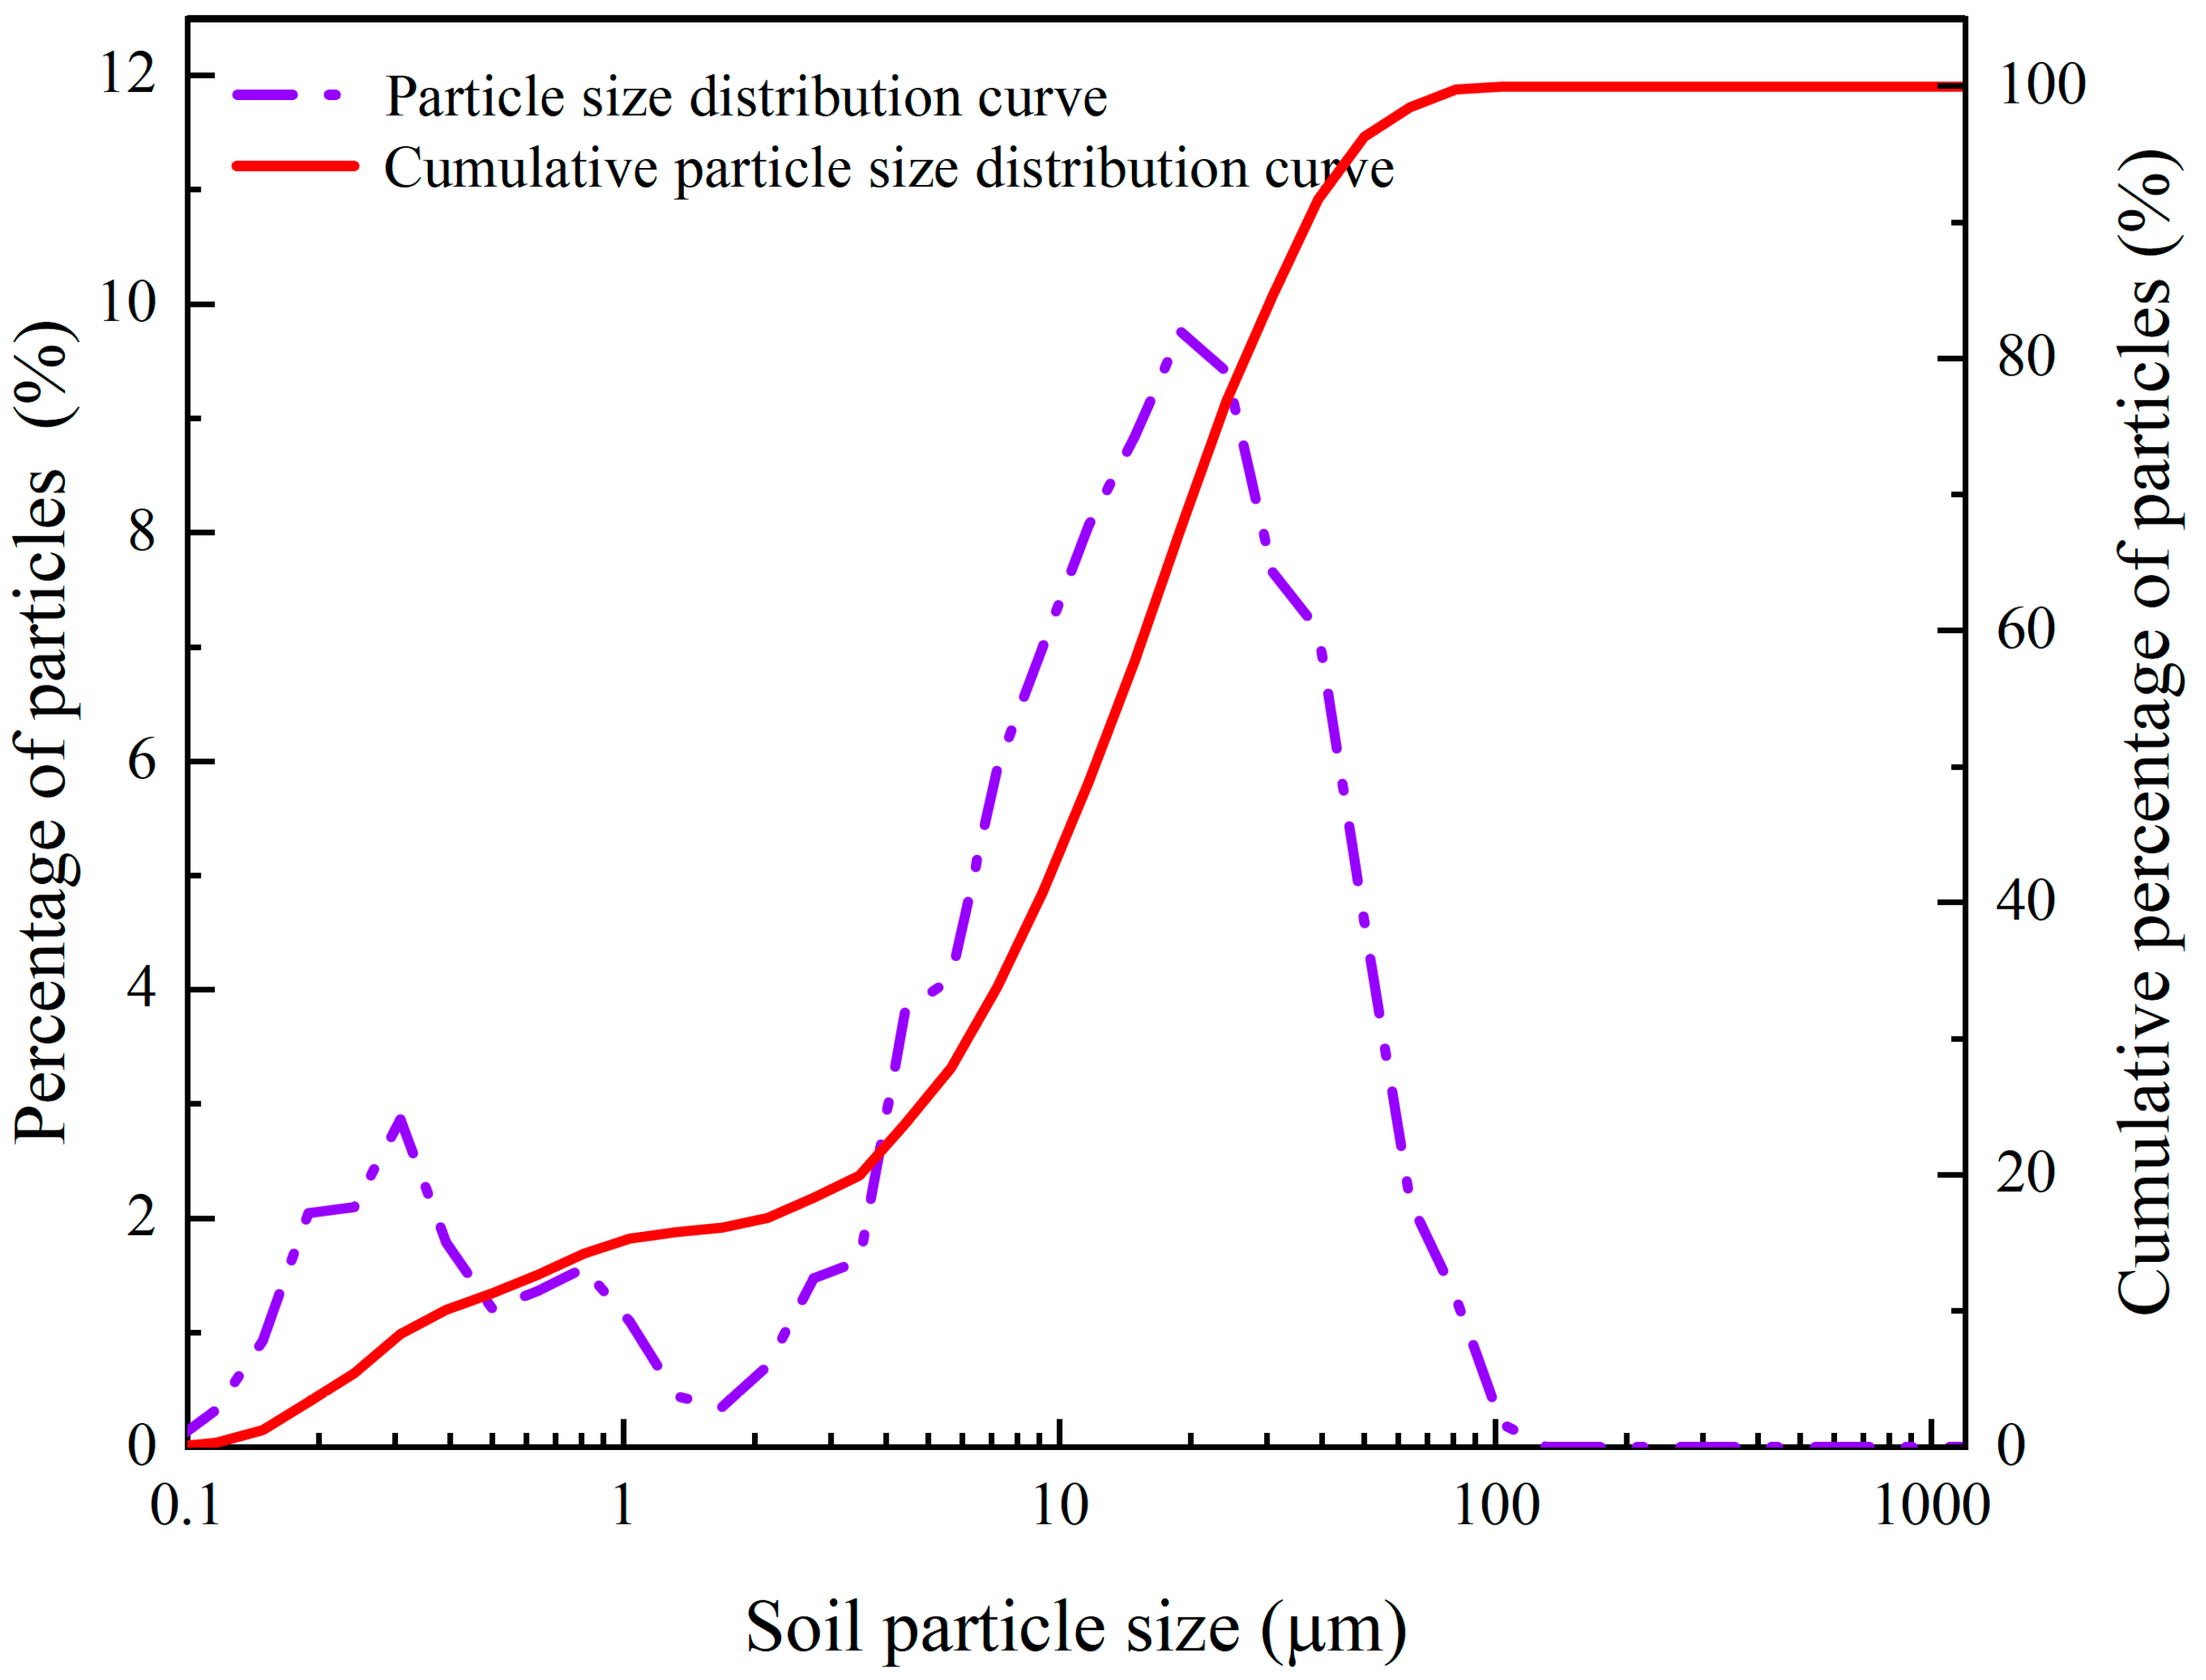
This study employed remolded loess samples collected from the Chanba area of Xi’an, Shaanxi Province, China, as depicted in Figure 1. The soil present in this area is classified as Malan loess, and samples were obtained at a depth of 4 m. After collection, the undisturbed samples were sealed using plastic wrap at the sampling site and then brought to the laboratory for standard physical property testing. The basic physical properties of the undisturbed loess can be referenced in Table 1 and Figure 2. The particles of loess in this area are mainly composed of silt (diameters ranging from 0.005 to 0.075 mm) and clay (diameters less than 0.005 mm), accounting for 73.92% and 25.79%, respectively. According to the “Standard for Geotechnical Testing Method” (GB/T50123-2019) [37], the loess in this location is classified as silty clay.

2.2. Testing Procedures

To prepare the reconstituted samples for the experiment, the loess was crushed, sieved through a 2 mm screen, and then dried. Remolded soil samples underwent undrained triaxial compression tests, isotropic compression tests, and pressure plate tests. There was a total of 60 samples for the triaxial test, with each sample made into a cylindrical reconstituted specimen with a diameter of 3.91 cm and a height of 8 cm. These samples were divided into three groups based on dry densities of 1.3 g/cm3, 1.4 g/cm3, and 1.5 g/cm3, with each group having four different water contents of 14%, 16%, 18%, 20%, and 22% and confining pressures set at 100 kPa, 200 kPa, 300 kPa, and 400 kPa, as shown in Table 2. The isotropic compression test included saturated reconstituted specimen specimens at three dry densities and unsaturated reconstituted specimens with a saturation degree of 60%. The triaxial compression test was conducted using an SLB-1A stress–strain controlled triaxial creep meter (as shown in Figure 3) by the “Standard for Geotechnical Testing Method” (GB/T50123-2019) [35]. For the unsaturated specimens, unconsolidated–undrained (UU) shearing was employed with a shearing rate set at 0.5 mm/min and termination conditions set at 20% of the axial length. The pressures for the saturated and unsaturated isotropic compression tests were set at 25 kPa, 75 kPa, 100 kPa, 200 kPa, 300 kPa, 400 kPa, 600 kPa, 800 kPa, and 1000 kPa. In the case of saturated soil, after drainage stabilization, stepwise unloading was carried out to obtain the isotropic compression curve and unloading rebound curve. Samples needed for the pressure plate apparatus were prepared as saturated ring knife reconstituted specimens with diameters of 6.81 cm and heights of 2 cm, for tests to measure the soil–water characteristic curves under different dry density conditions. During the experiment, data were recorded at least once every 24 h. Before each recording, the pipeline was flushed to eliminate the influence of bubbles trapped in the high-air-entry-value ceramic disk on the data.

3. Basic Model Features

3.1. The Expanded Barcelona Basic Model

The Barcelona Model (BBM), proposed by Alonso et al. [23], serves as an extension of the Modified Cambridge Model (MCCM) aimed at simulating the mechanical characteristics of unsaturated soil. Their approach involved incorporating the effect of suction on soil and resolving the discontinuity between the stress yield surface and the matric suction yield surface inherited from the MCCM. To overcome the limitations of the BBM, Pedroso et al. [24] introduced a smooth yield surface and proposed an extended version called the expanded Barcelona Basic Model (BBMx). In this study, the BBMx will be employed for simulation using COMSOL Multiphysics.
The BBM model in three-dimensional stress space adopts three stress variables, p, q, and s, where p = (σ1 + σ2 + σ3)/3 − ua represents the mean net stress, q = σ1σ3 represents the deviatoric stress, σ1, σ2, σ3 are the principal stresses in the three-dimensional stress state, and s = uauw represents the matrix suction, with ua being the pore air pressure and uw being the pore water pressure. To address the computational challenges associated with the discrete yield surface of the BBM, Pedroso et al. [24] proposed a continuous yield surface. The expression for this continuous yield surface is as follows:
F y = q 2 + M 2 p p c s p + p s + p r e f 2 exp b s s y p r e f exp b s y p r e f
p s = k s
where pcs denotes the consolidation stress under the existing suction, ps represents the tensile strength generated by the prevailing suction, and it functions as a suction-dependent variable, as described in Equation (2). Here, k stands for the suction-stress ratio, b is the dimensionless smoothing parameter, sy denotes the yield value under the current suction, pref represents the reference stress, and M signifies the slope of the critical state line. The consolidation stress under the current suction, pcs, is determined by the following equation:
p c s = p r e f p c p r e f exp λ 0 κ λ s κ
where λ(s) signifies the compression index linked to variations in suction, λ(0) denotes the compression index at saturation, and κ represents the rebound modulus. Equation (3) illustrates the yield function of the model in the p-s plane, shown in Figure 4 as the loading collapse (LC) yield surface. The formula for λ(s) is provided by the following equation:
λ s = λ 0 1 r exp β s + r
where the parameters β and γ are used for fitting.
The critical state line slope M can be calculated based on the Matsuoka–Nakai criterion, with its specific value being contingent upon the Lode angle and the internal friction angle φ.
M = 6 sin φ 3 sin φ 2 ω 1 + ω 1 ω sin 3 θ π 2 1 4
When both suction and average net stress lie within the area enclosed by the two yielding surfaces shown in Figure 4, the soil is in the elastic stage. Plastic deformation occurs when the stress state crosses the area enclosed by these two surfaces. Suction and average net stress both result in volumetric strain, and their corresponding hardening law is given by the following equation:
d p c p c = v λ 0 κ d ε v p
d s y s y + p a t = v λ s κ s d ε p v
where ν represents the void ratio; pat is the atmospheric pressure; λ is the compression index of suction change; κ is the resilience index of suction change; and vp is the plastic volumetric strain.

3.2. Glasgow Coupled Model

Wheeler et al. [27] introduced the Glasgow coupled model (GCM), a hydraulic coupled constitutive model, to elucidate the mechanical and water retention properties of unsaturated soils under isotropic conditions. Lloret-Cabot et al. [25] then broadened the GCM to include general three-dimensional stress states.
The GCM employs Bishop’s stress tensor σij and the modified matric suction s* as stress variables. However, under general three-dimensional stress scenarios, one can potentially simplify the analysis by considering only the mean Bishop’s stress p*, deviatoric stress q, and modified matric suction s* [38], as follows:
p * = p t o t S r u w 1 S r u a = p + S r s
s * = n u a u w = n s
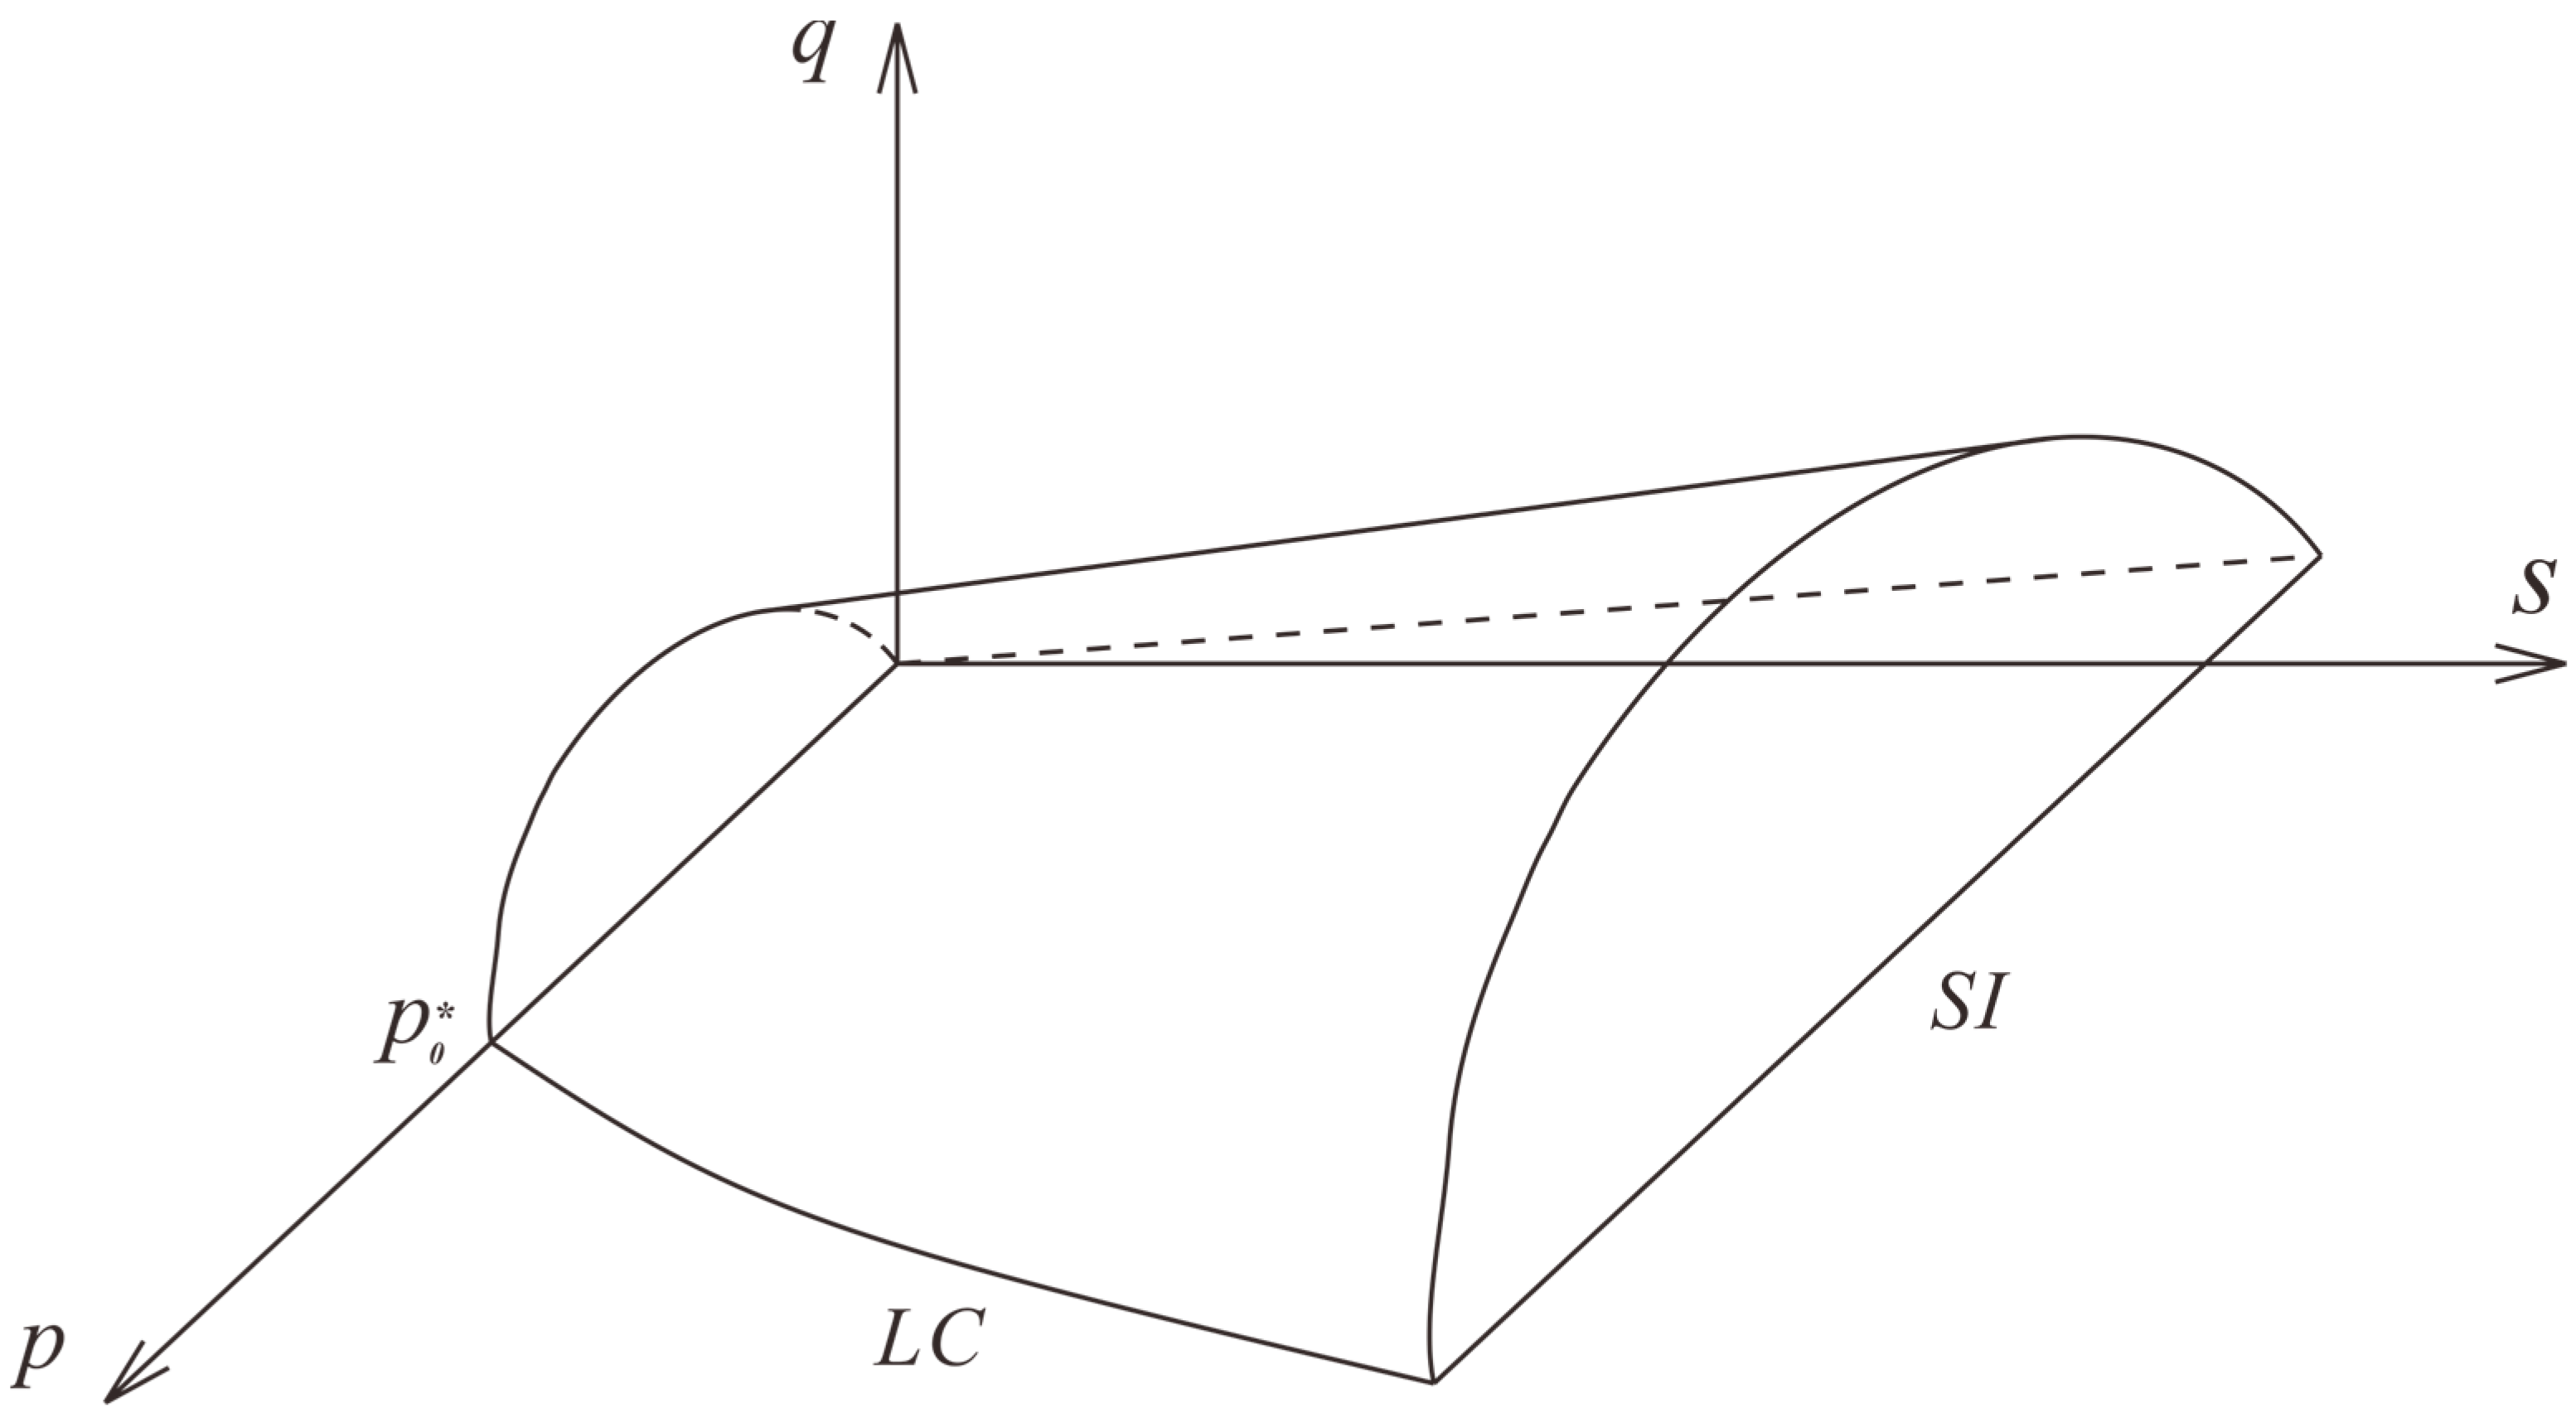
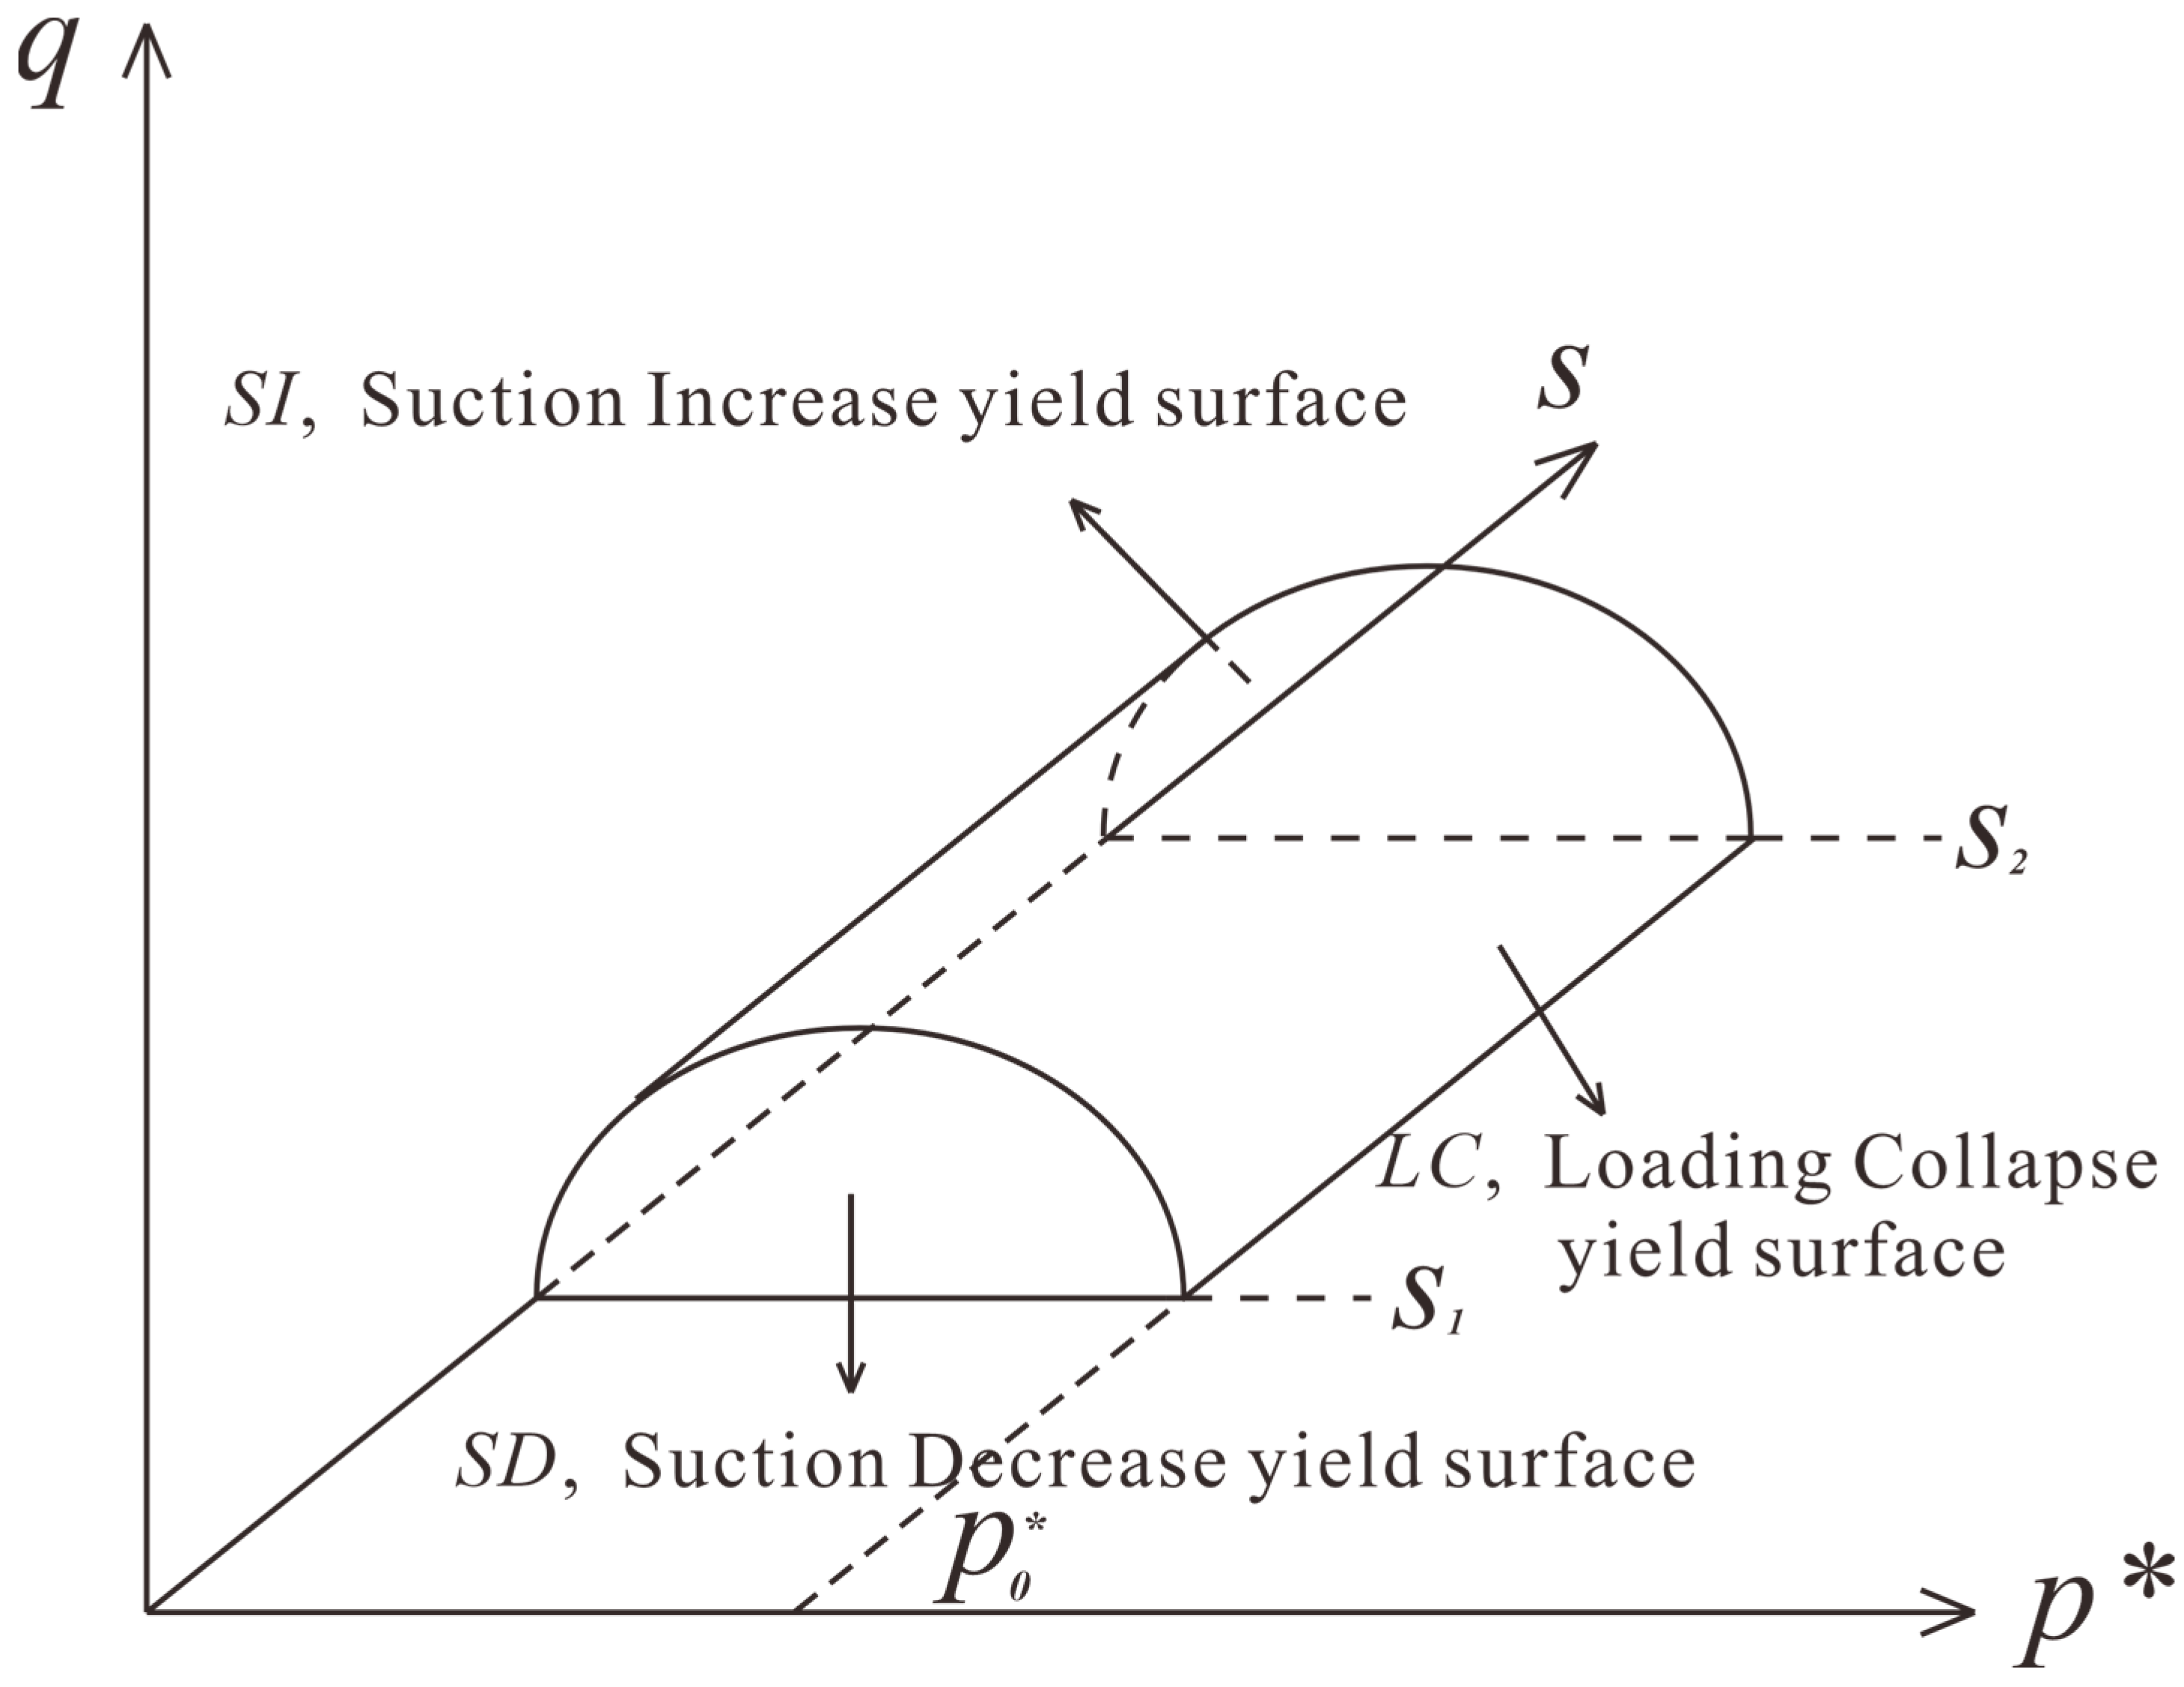
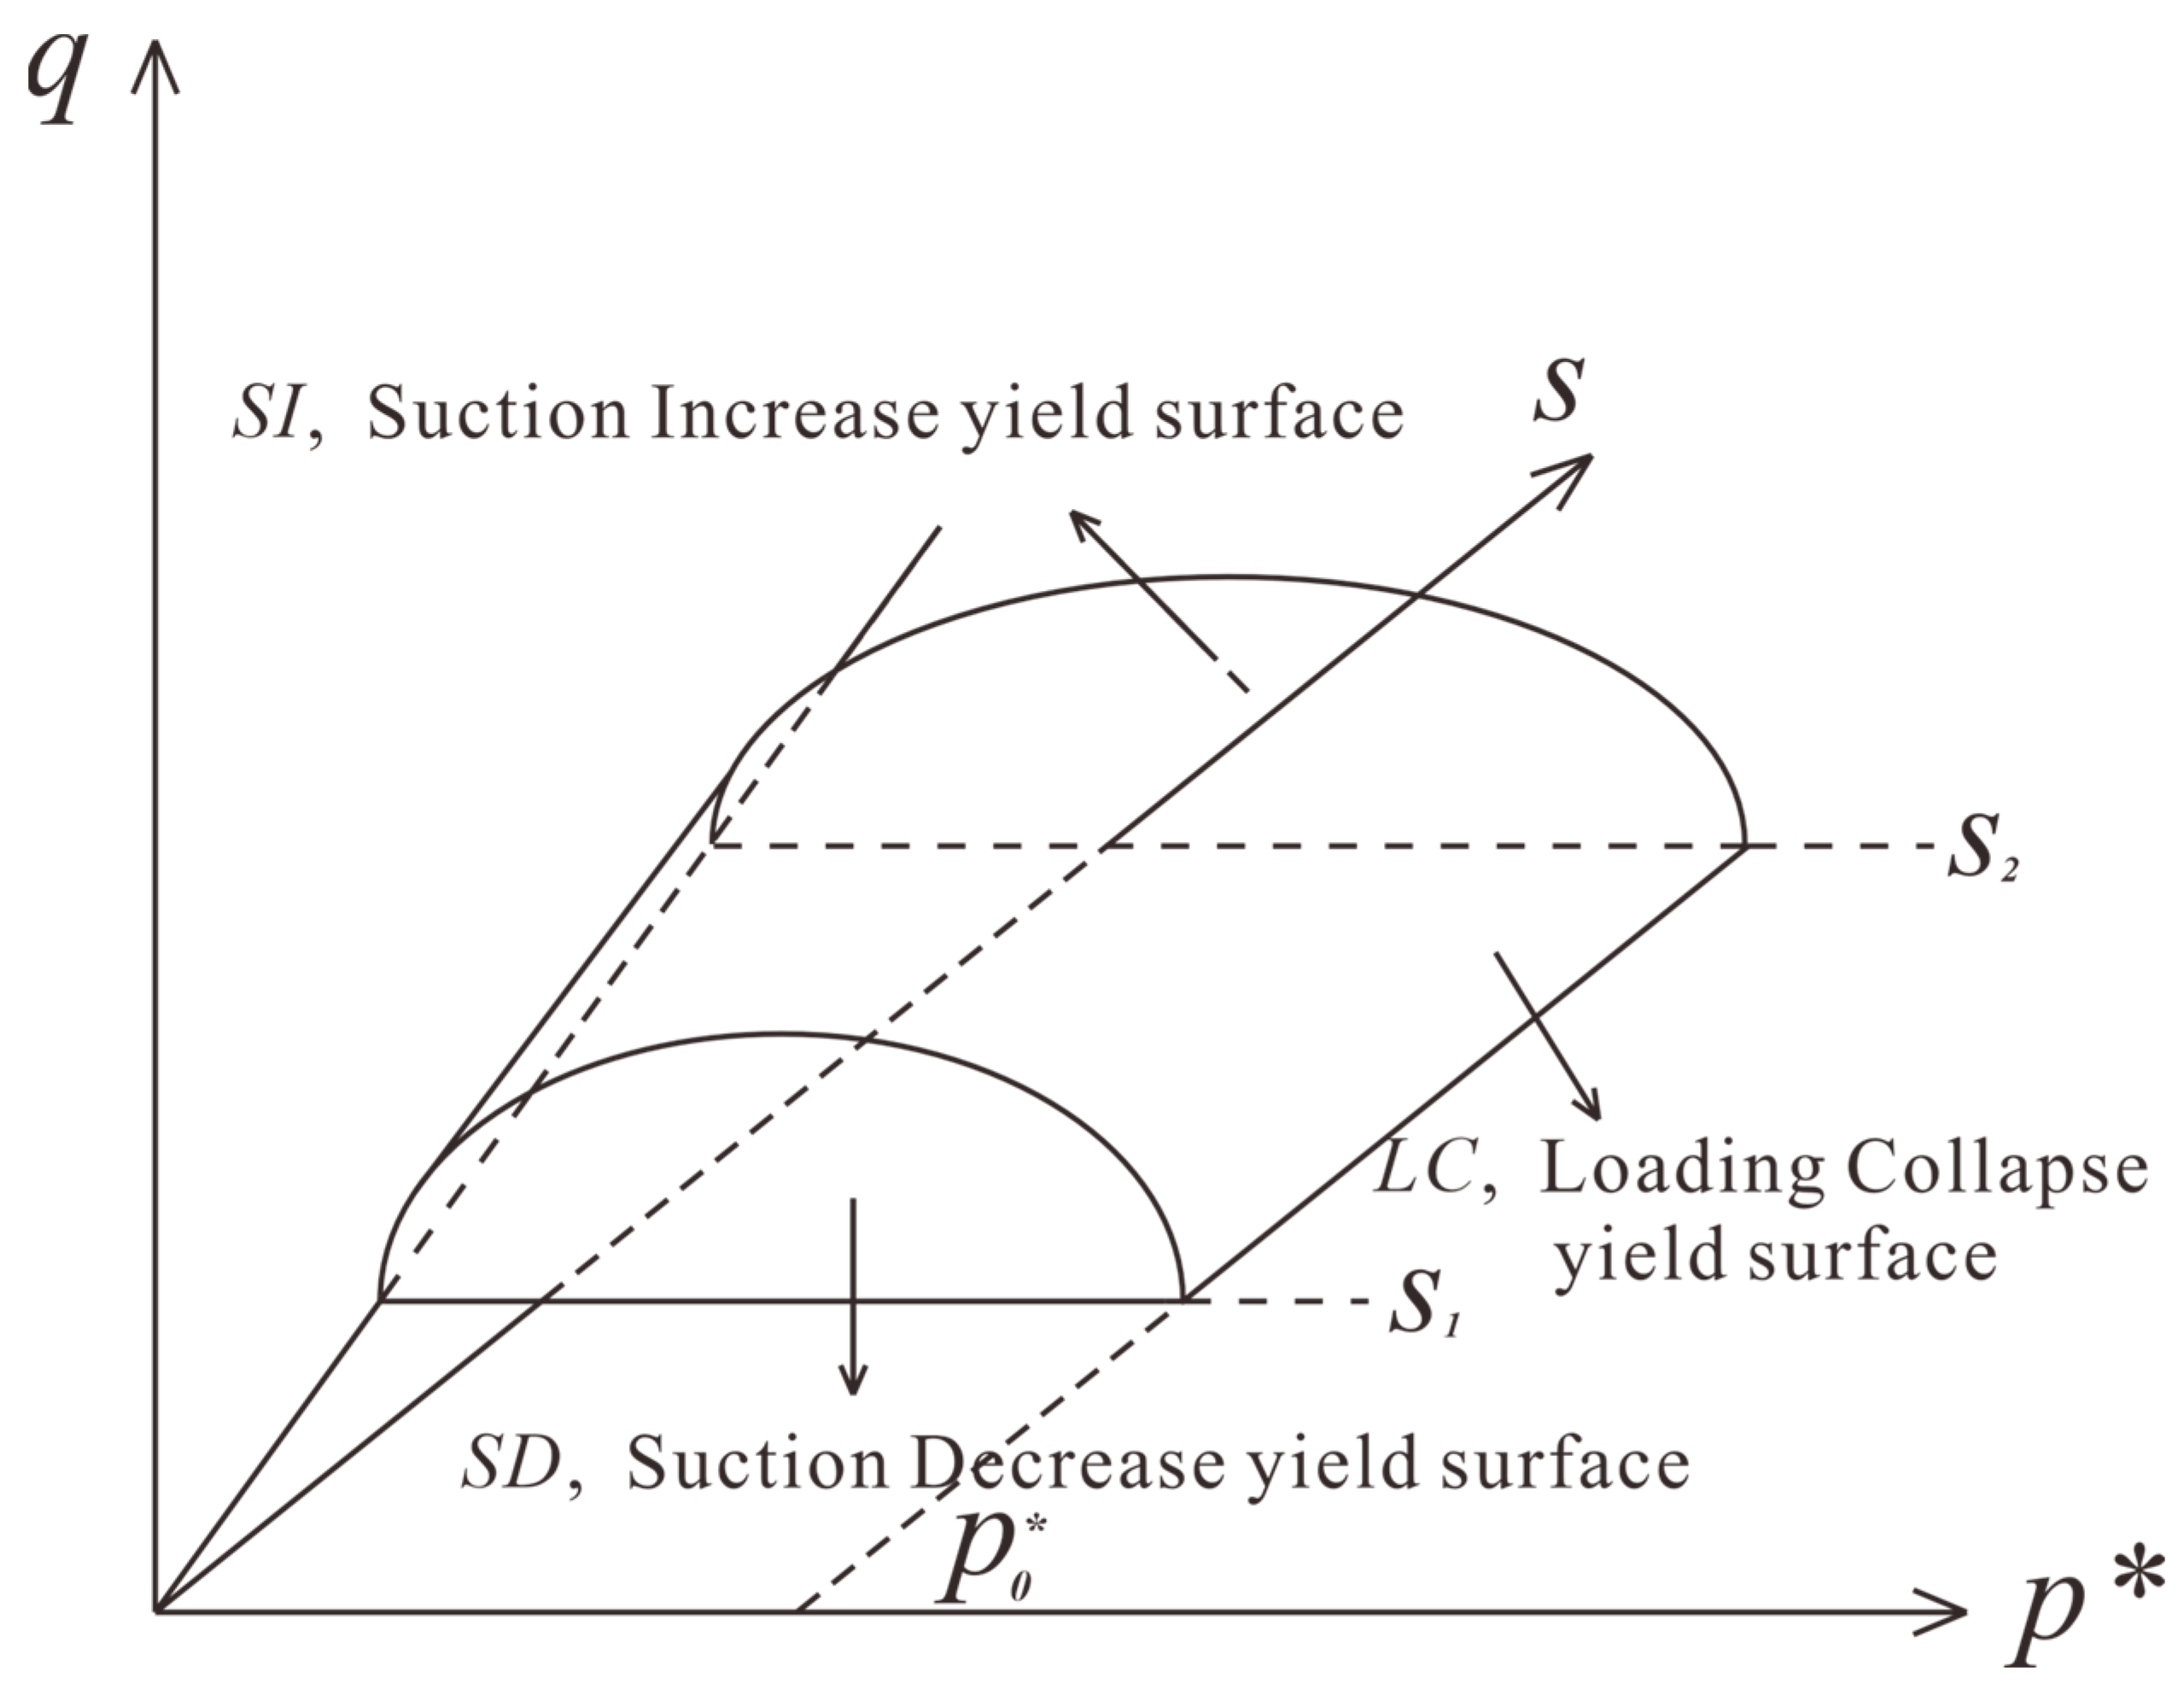
where ptot denotes the average total stress, n represents the porosity, and Sr indicates the saturation. Unlike the stress variables employed in BBM, the GCM takes into account the impact of volume change on sample saturation and matrix suction during the compression process. It introduces saturation into the average net stress and adjusts the matrix suction using the specific volume to achieve authentic hydraulic coupling. The model utilizes the loading collapse yield surface (LC), suction increase yield surface (SI), and suction decrease yield surface (SD) in the p*-q-s space, as depicted in Figure 5. The equation for the yield surface can be described as follows:
F y = q 2 M 2 p * p 0 * p *
s 1 = s *
s 2 = s *
where p0*, s1, and s2 in the equation represent the hardening parameters, defining the current positions of the three yield surfaces.
The presence of hydraulic coupling induces adjustments in the positions of the yield surfaces due to the interaction between the solid and liquid phases. The repositioning of the LC yield surface occurs as a result of both external forces and the coupling effects stemming from the repositioning of the SI or SD yield surfaces caused by the drying or wetting of the soil mass. Conversely, the displacement of the SD or SI yield surfaces can also lead to shifts in the position of the LC yield surface. The hardening law can be described by the following expression:
d p 0 * p 0 * = v λ κ d ε v p k 1 λ w κ w d S e p
d s 1 / 2 s 1 / 2 = k 2 v λ κ d ε v p 1 λ w κ w d S e p
where k1 is the coupling coefficient, representing the volume change caused by changes in moisture content; k2 is the coupling coefficient, representing the movement of the moisture retention curve caused by plastic deformation; λw and κw are both SWCC scanning slopes; dSep is the saturation-induced plastic deformation.

4. Results

4.1. Soil–Water Characteristic Curve

To estimate the variations in the matric suction of unsaturated soil samples during the shearing process, the soil–water characteristic curve (SWCC) is applied in this paper. Therefore, a model equation is needed to fit the obtained data points. The Van Genuchten (VG) model, proposed by Van Genuchten et al. [39], is chosen for fitting purposes. The following fitting formula is given:
S r = 1 1 + α s n m
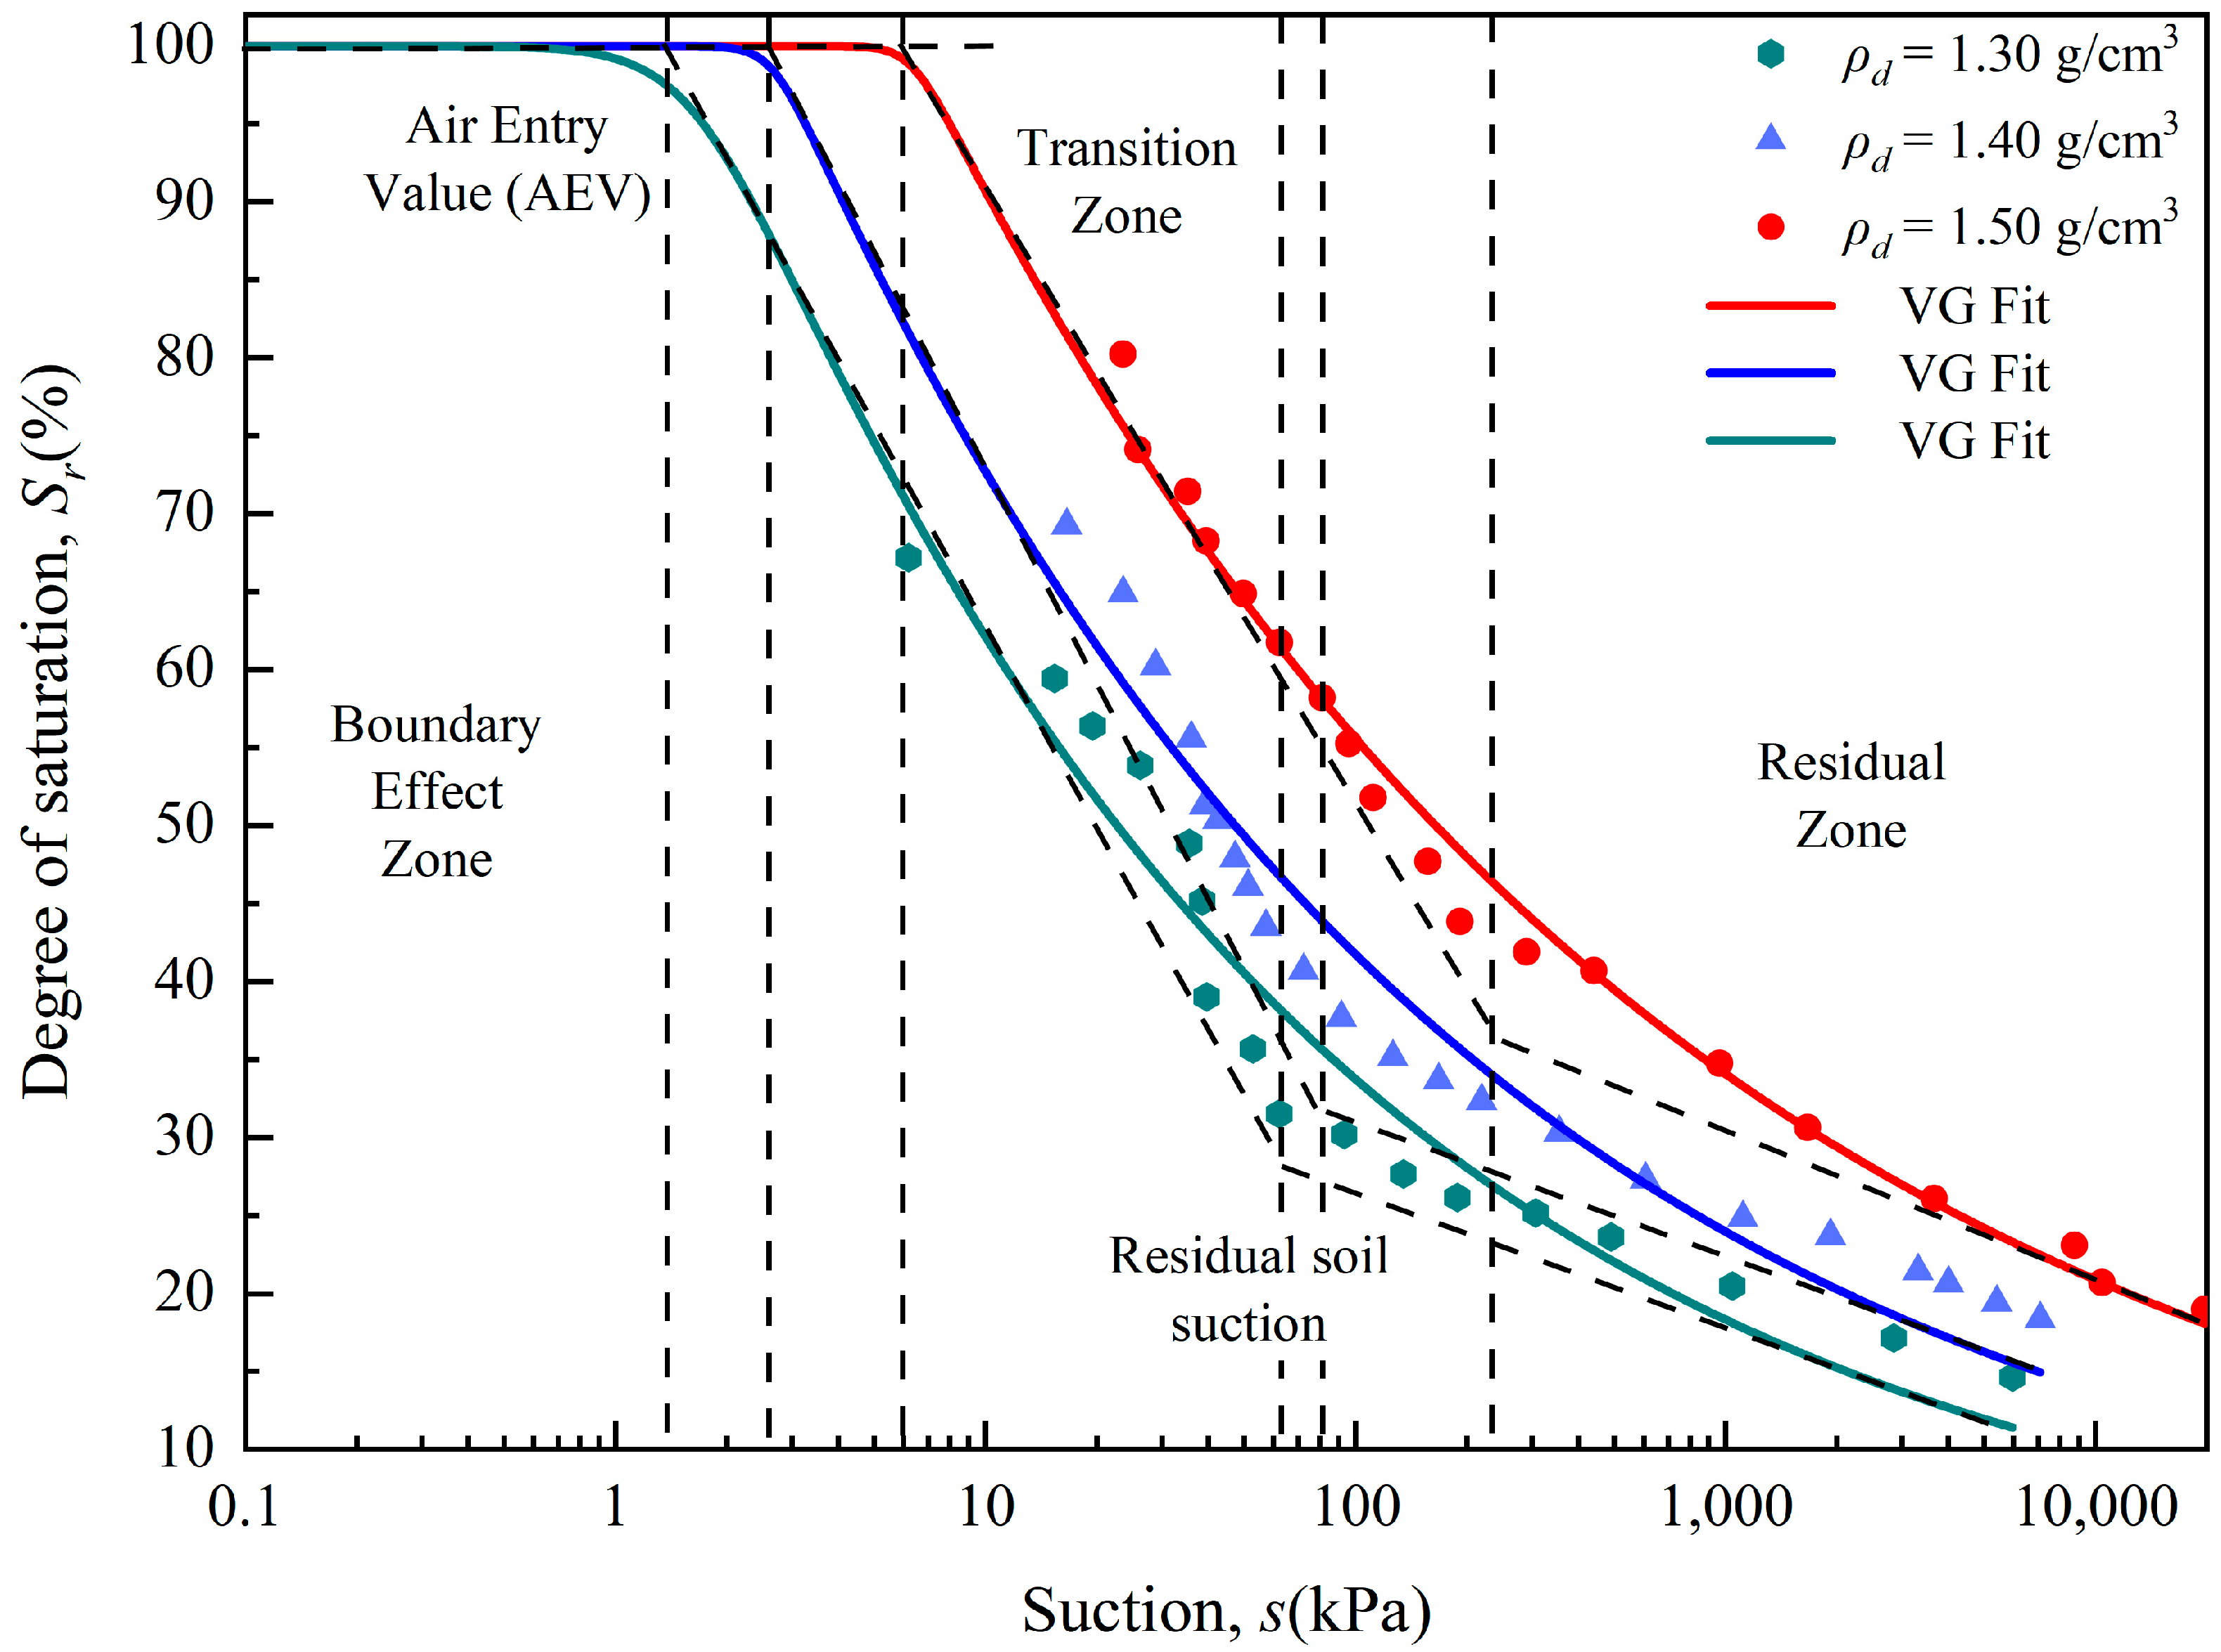
where parameters α, n, and m serve as fitting parameters related to the air entry value, pore size distribution, and overall curve symmetry; when the unit of matric suction s is kPa, the unit of α is kPa−1. Using Equation (15), the soil–water characteristic curves under three distinct dry densities are fitted, as shown in Figure 6, and Table 3 lists the fitting parameters for the three curves.
From Figure 6, it can be observed that the SWCCs of loess are significantly influenced by the initial dry density. As the dry density increases, the SWCC curve shifts upward, leading to an increase in the air entry value. This indicates that higher air pressure is needed to drain water from the soil, thereby demonstrating that samples with higher dry density exhibit improved water retention characteristics. The curves all demonstrate three stages, the saturation zone, the transition zone, and the residual zone, with boundaries defined by the air entry value and the residual value. Additionally, the initial dry density affects both the air entry value and the residual value, which gradually increases as the dry density increases. In the saturation zone, before reaching the air entry value, the soil samples are essentially fully saturated; as they transition into the transition zone, rapid dewatering initiates, leading to a gradual reduction in the rate of dehydration after surpassing the residual value.

4.2. Model Parameter Selection

For the BBMx, a three-dimensional soil sample will be simulated using COMSOL Multiphysics 6.1. The derivation and calculation process for the GCM will be conducted, and a virtual soil sample will be simulated in Matlab (R2020b). Most of the parameters in both models can be obtained from experiments, while those that are difficult to obtain from experiments will be selected based on previous literature and actual simulation. Considering the precision of sample preparation in experiments, there will be some fluctuations in the parameters measured for soil samples under the same conditions. Therefore, the parameter values will be selected within a certain range. For parameters λ(0) and κ, which are common to both models, the same values will be used. In this experiment, suction is reduced and will not exceed the yield surface sy of BBMx or the yield surface s2* of GCM; therefore, these two values will not be determined. See Table 4 and Table 5 for the selection of model parameters.

4.3. The Normal Consolidation Curve of Unsaturated Loess

For saturated soil, the normal consolidation curve demonstrates a linear correlation between the specific volume (v) and the natural logarithm of effective mean stress (lnp′):
v = N λ ln p = N λ ln p u w
where λ represents the compression index, which numerically equals the slope of the v-lnp′ line; N represents the intercept on the v-axis when lnp′ = 0.
Zhou et al. [40] established the compression index to the effective saturation (Se) for the normal consolidation line of unsaturated soils. To simplify, using the saturation degree (Sr) instead of the effective saturation (Se), the normal consolidation line for the soil is defined as follows:
v = N λ S r ln p
λ(Sr) is a function of the degree of saturation, and its relationship with the degree of saturation is defined as follows:
λ S r = λ 0 λ 0 κ 0 1 S r a
where λ0 indicates the incline of the saturation compression curve, κ0 represents the slope of the initial elastic segment of the saturation compression curve, and a is a fitting parameter.
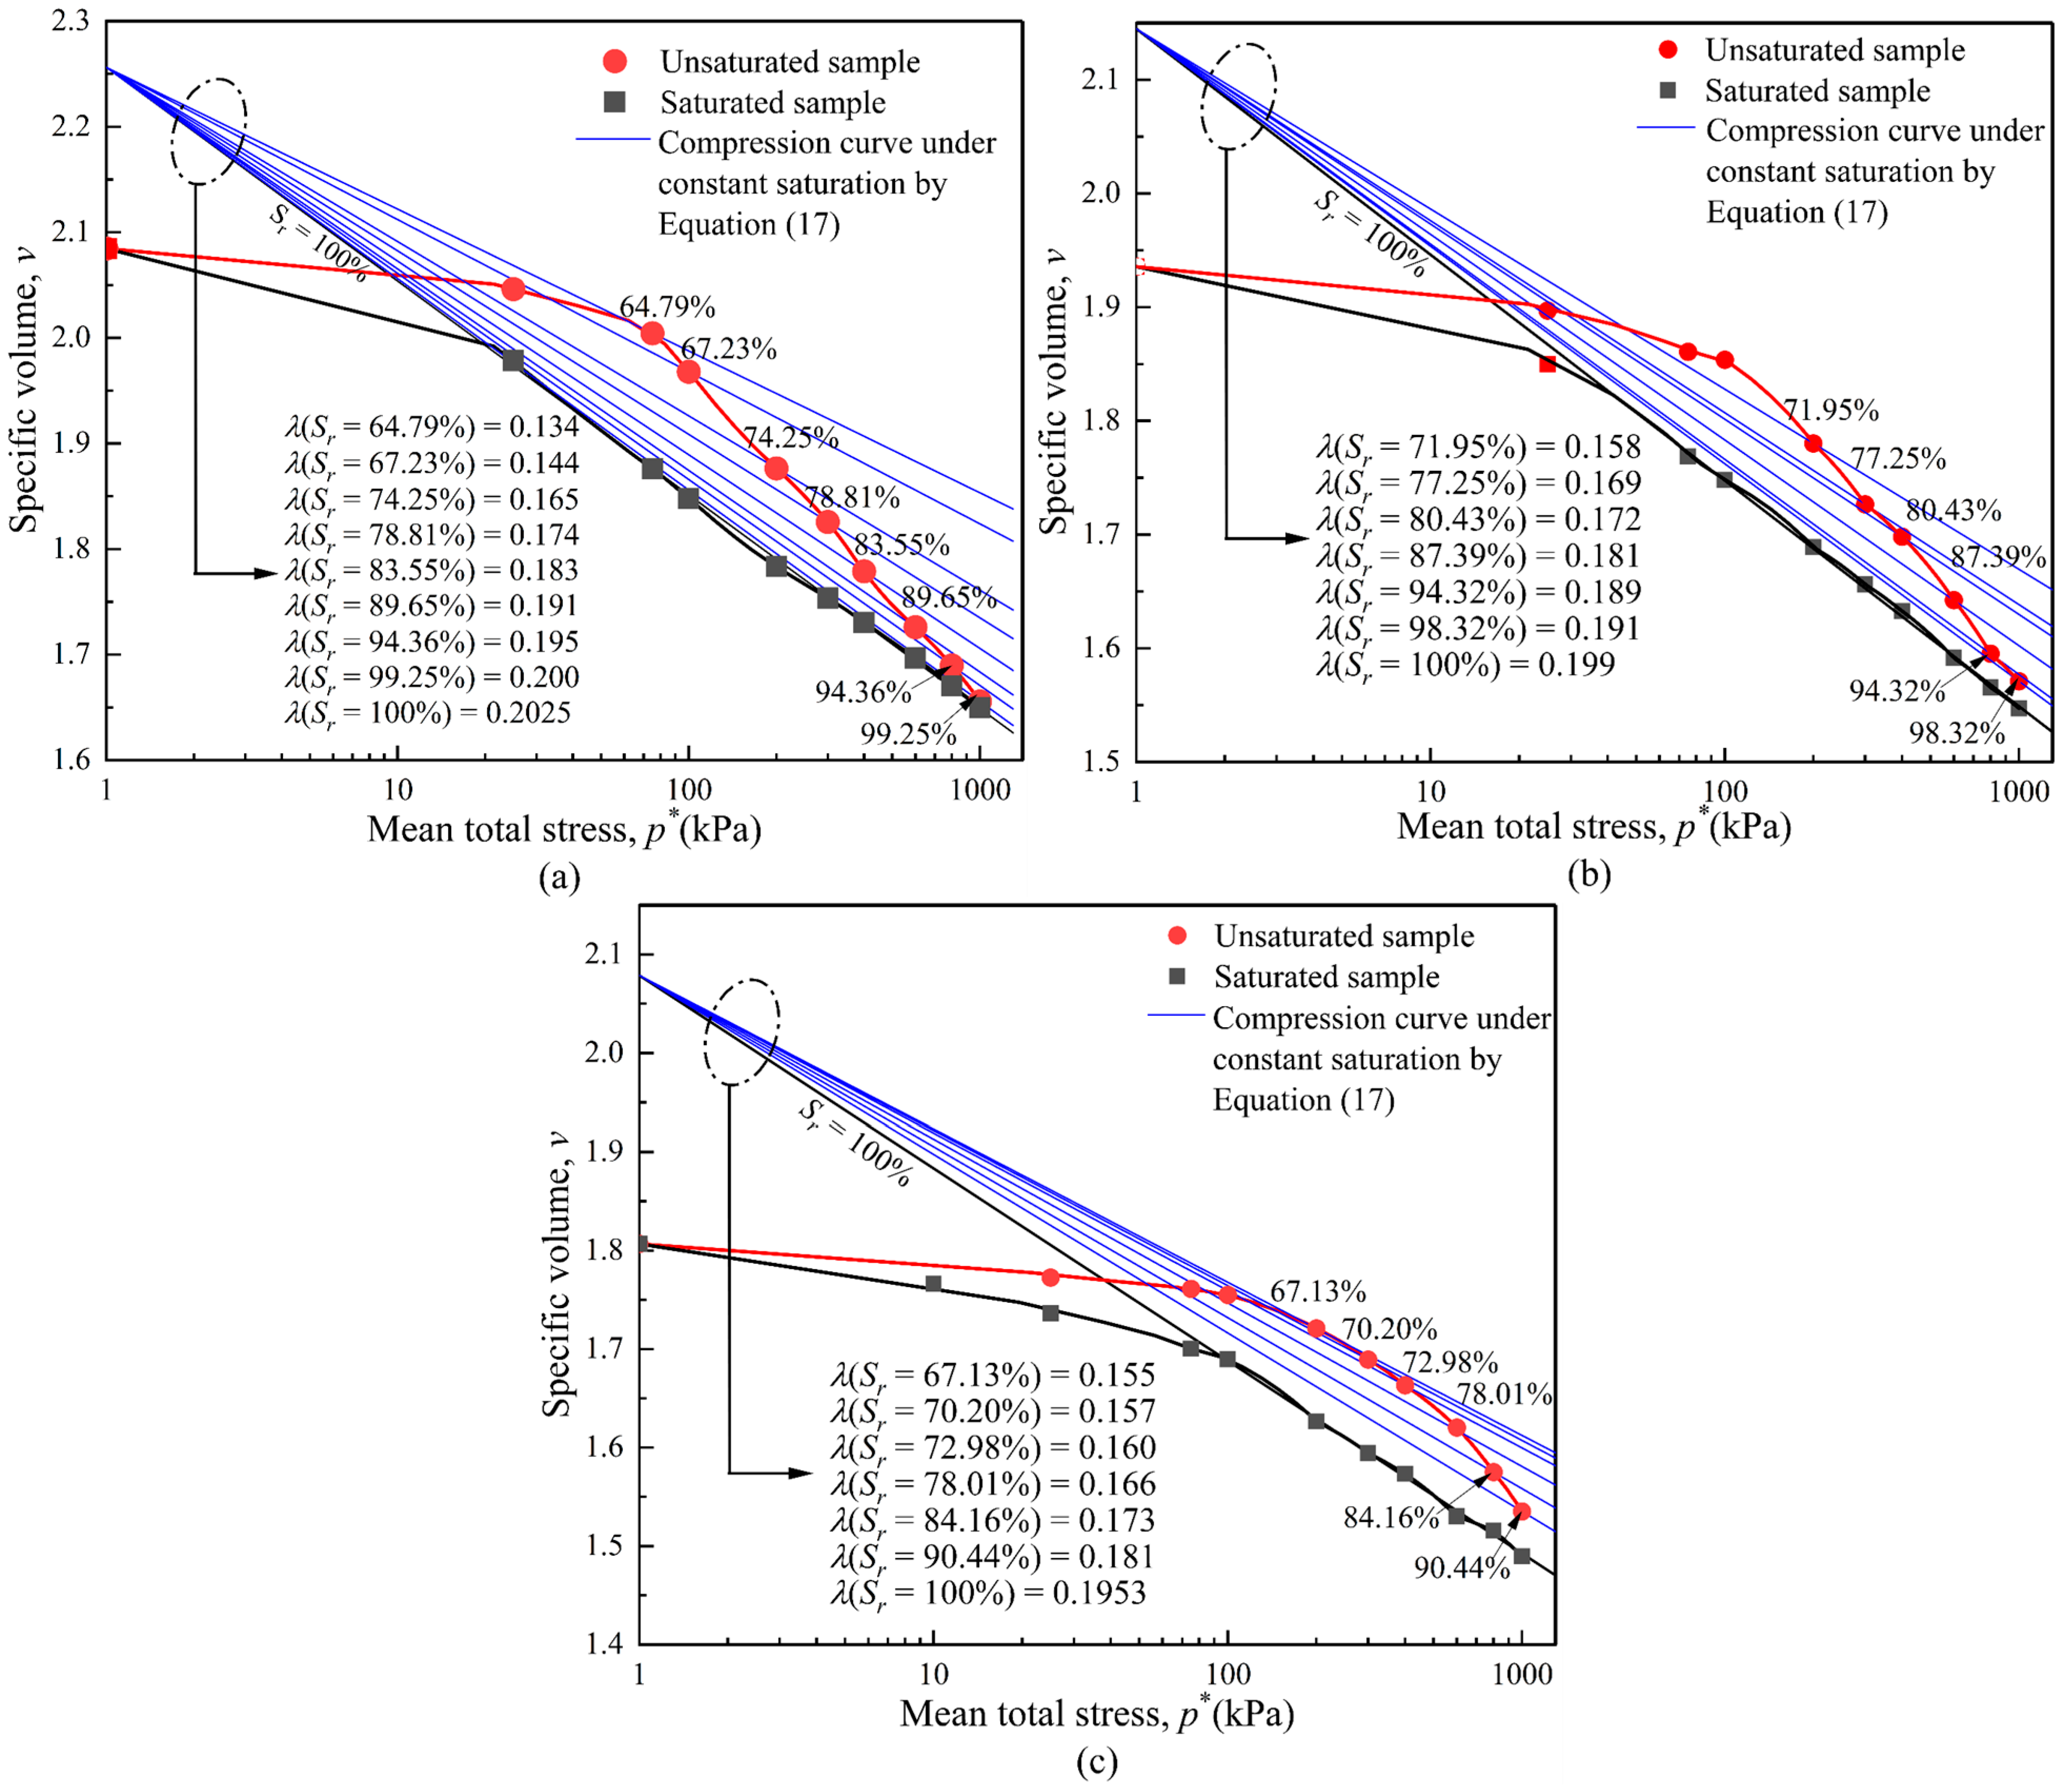
In Figure 7, the normal compression curves for saturated loess and unsaturated loess are presented under a saturation of 60% with three different dry densities. The presence of matric suction enhances the strength of unsaturated soil, leading to smaller deformations compared to saturated soil at yield. After yielding, the saturated soil exhibits a linear compression curve, with a constant value of the saturated compression index which decreases with increasing dry density. In contrast, as unsaturated soil undergoes consolidation, it experiences a reduction in volume, causing the discharge of gases from the pores, which in turn lowers the total void ratio. However, water is rarely expelled from the soil, resulting in an increase in saturation with increasing pressure. As the saturation gradually approaches 100%, the compression curve of unsaturated soil gradually converges towards that of saturated soil, and the compression index also approaches that of saturated soil. The escalation in the compression index implies that the compressibility of unsaturated soil increases as the saturation level grows during the consolidation process. This enhanced compressibility observed could stem from a decrease in the air volume between soil particles at lower saturation levels, creating more room for the liquid phase. This reduction may weaken inter-particle bonding, thereby elevating the soil’s compressibility and eventually approaching the compressibility level exhibited by saturated soil under higher stress. With lower dry densities, the pressure needed to attain saturation is reduced, potentially due to the diminished compressive resistance of the soil skeleton with these densities, as well as the weaker strength provided by matric suction at equivalent saturation levels.
In Figure 8a, the parameter values resulting from fitting Equation (18) with a dry density of 1.5 g/cm3 are displayed. This information is then used to calculate the compression coefficients at different degrees of saturation, presented in Figure 8b. The process of substituting the compression coefficients into Equation (17) results in obtaining the normal consolidation curves at constant degrees of saturation. The consolidation curve of loess with an initial degree of saturation of 65% is plotted against the predicted curve in Figure 8b to assess the validity of Equation (17). The results reveal that the elastic–plastic segments of the consolidation curve at 65% saturation are all within the range of the predicted curve and exhibit a high degree of correspondence. Combined with the consolidation curves in Figure 7, this fully demonstrates the significant importance of saturation on the hydraulic coupling effect in the compaction of loess.

4.4. Analysis of Simulation and Test Results

The experiment employs the unconsolidated–undrained triaxial test method, where pore water pressure is not monitored throughout the testing procedure. Only the stress, strain, and volume change during the shearing process are measured. Stress and strain are directly measured by sensors, while the specimen’s volume change is indirectly obtained from the change in confining pressure volume. Through the specimen’s volume change, the change in the specific volume of the specimen can be determined, thereby obtaining the variation in the saturation degree of the specimen during undrained shearing. The VG model calculated from the measured data is then used to calculate the specimen’s pore water pressure and applied in the simulation.
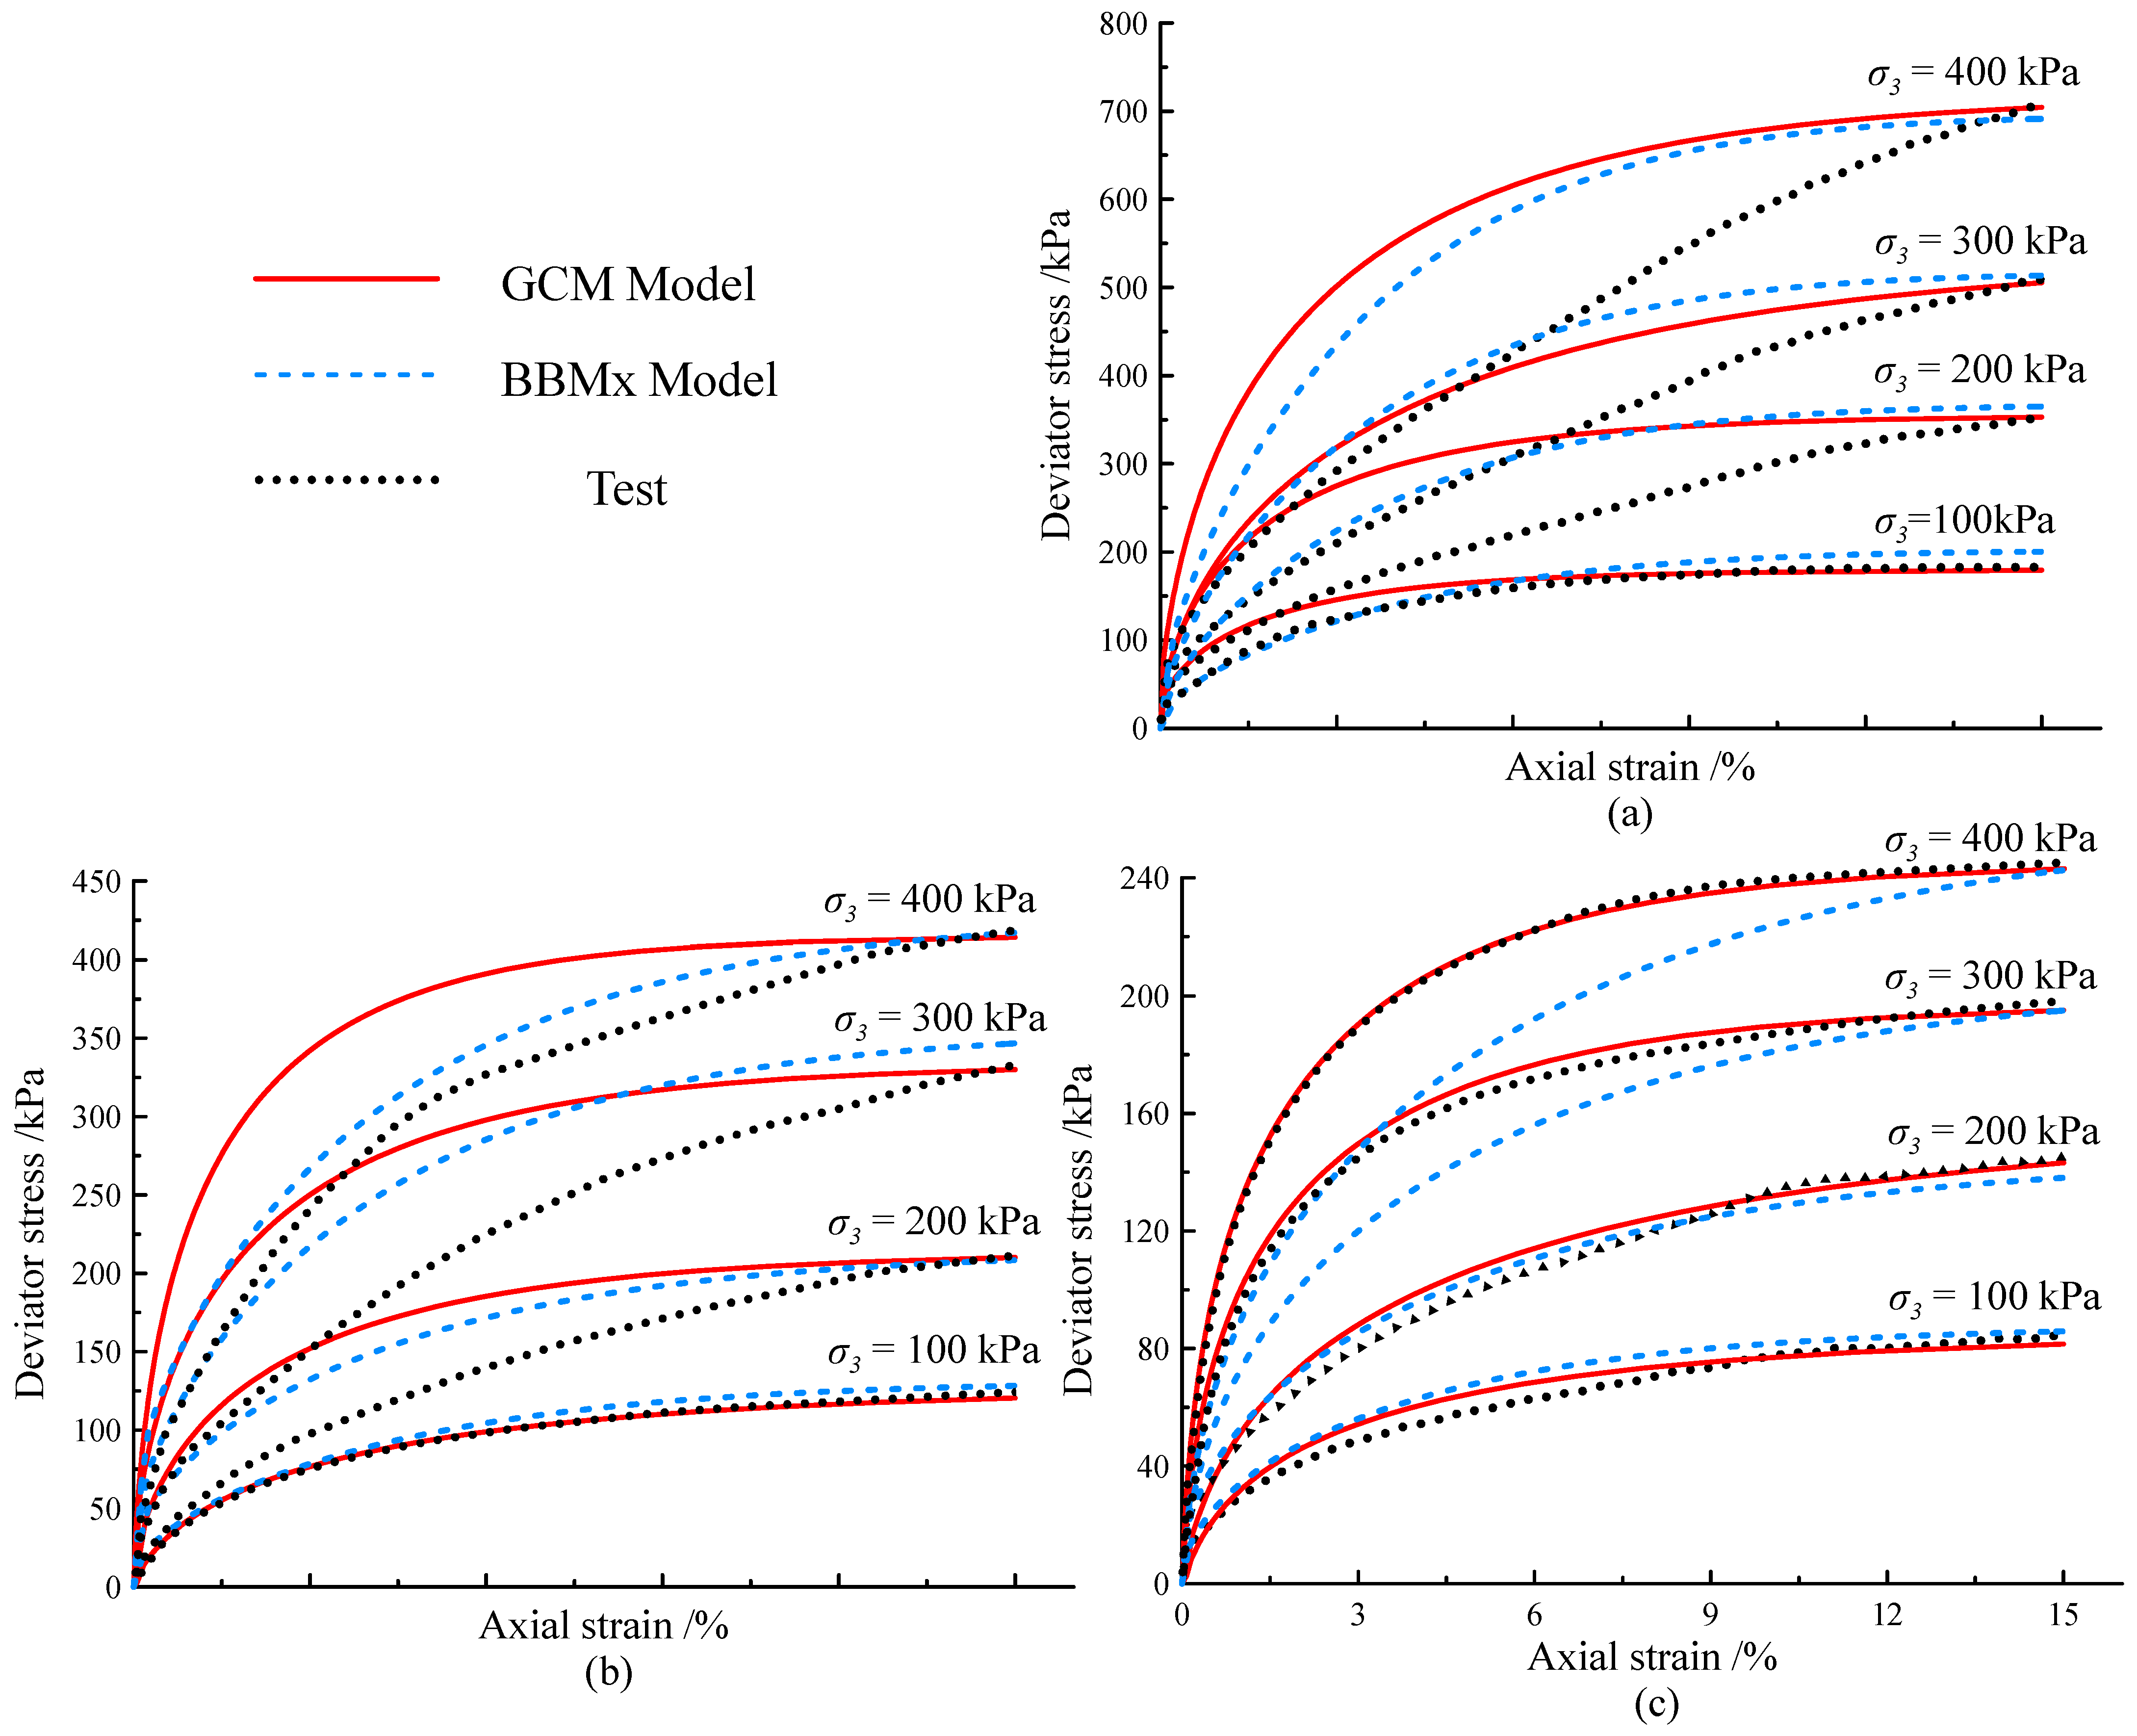
In Figure 9, the stress–strain relationship curves are depicted for different confining pressures, considering initial water contents of 14%, 18%, and 22% with a dry density of 1.3 g/cm³, along with the calculation results of the two models. Based on Equation (15), the initial matrix suctions calculated are 88.4 kPa, 34.2 kPa, and 16.3 kPa with three different water contents. As depicted in Figure 9, with the decrease in initial matrix suction, the deviator stress of the specimen under the same confining pressure decreases, indicating a gradual reduction in shear strength. For water contents below 18% and confining pressures exceeding 100 kPa, the curve demonstrates notable strain hardening. Moreover, the rate at which deviator stress increases intensifies gradually with higher axial strain. Once the water content exceeds 18%, the stress–strain curve starts shifting towards a strain-softening state, leading to a reduction in the rate of deviator stress increment as the strain rises. When the water content reaches its maximum value of 22%, the strain-softening phenomenon becomes most apparent, but a peak has not yet been reached. At a confining pressure of 100 kPa, where the deviator stress is also close to 100 kPa, the specimen exhibits uniform failure. However, once the confining pressure exceeds 100 kPa, the deviator stress considerably surpasses the corresponding confining pressure, resulting in a bulging failure of the specimen. The significant difference in deviator stress under different confining pressures indicates a pronounced influence of confining pressure on shear strength. Concerning the fitting results, both the BBMx and GCM show excellent alignment with the experimental data at a confining pressure of 100 kPa. However, when the confining pressure exceeds 100 kPa, especially with low water contents, as shown in Figure 9a,b, both models overestimate the rate of early deviator stress growth, leading to some deviation from the actual experimental values. Additionally, both the fitting curves exhibit strain softening rather than strain hardening. Therefore, the fitting curves can only match the experimental data well when the water content gradually increases, causing the test curves to transition to a strain-softening state. It is found that both BBMx and GCM correspond well with the experimental data when observing the peak strength of the two models.
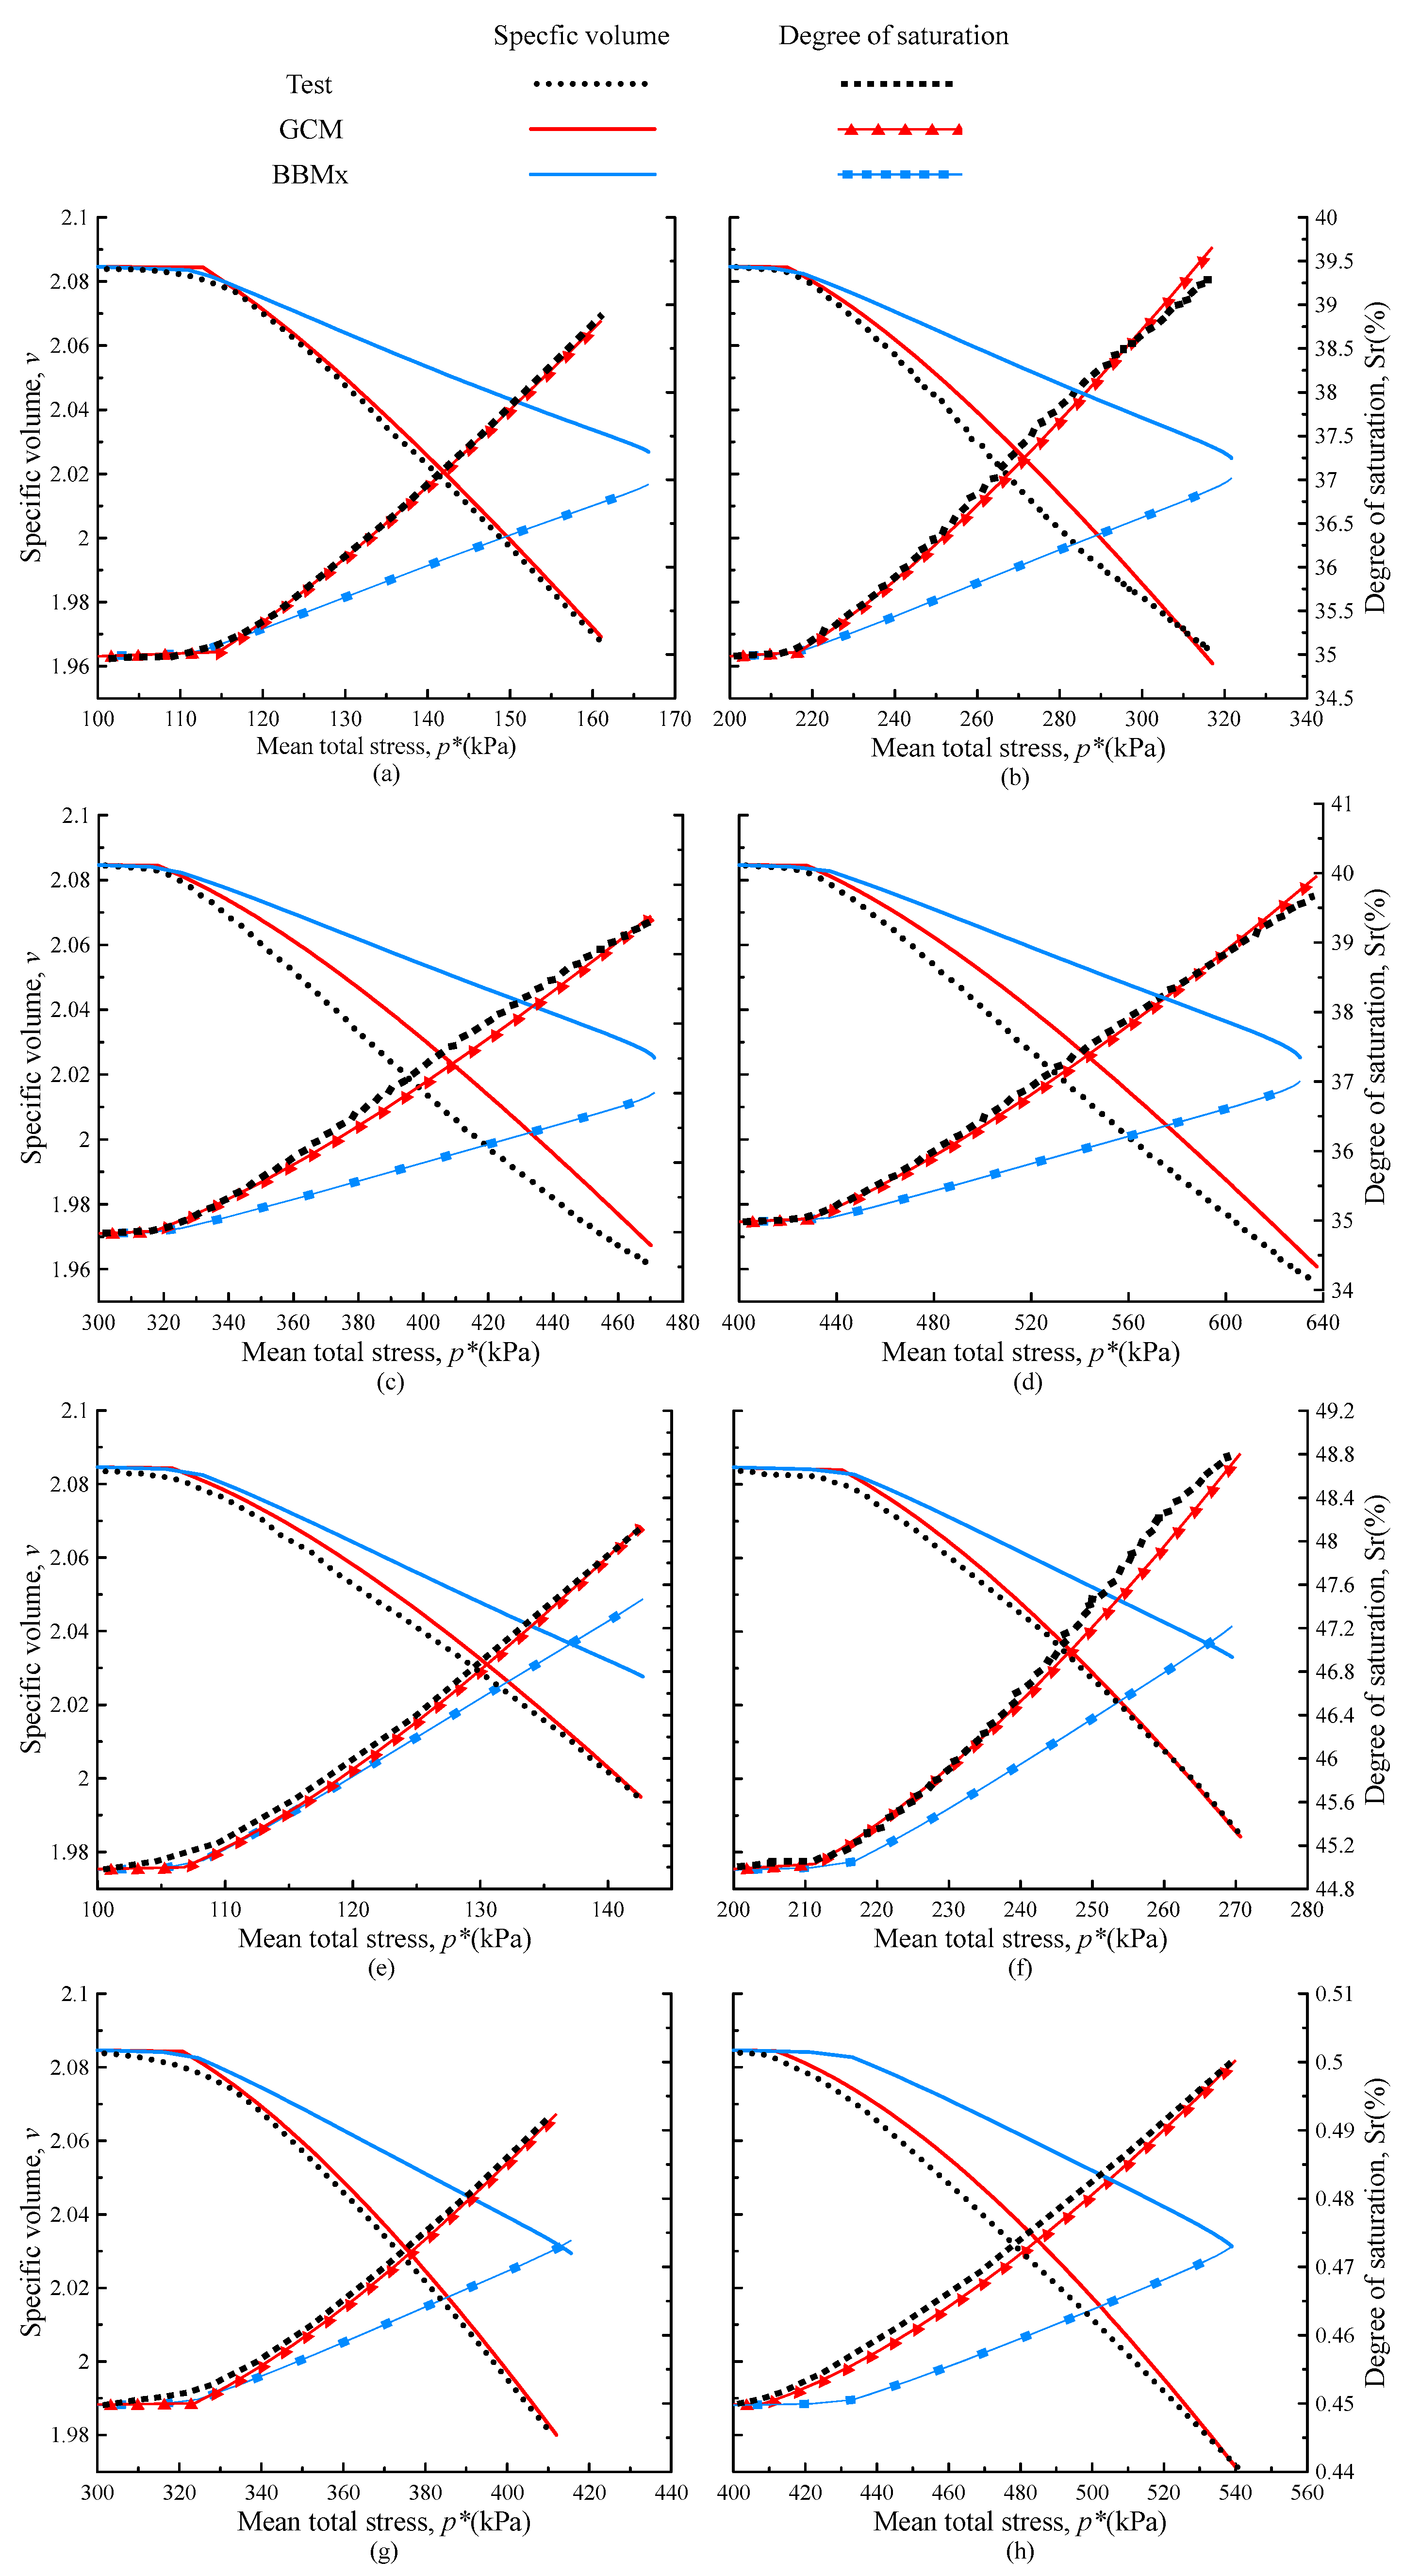
In Figure 10, the associations between specific volumes and degrees of saturation with mean effective stress are portrayed for three different initial water contents with a dry density of 1.3 g/cm³, along with simulation results. By analyzing Figure 10, one can observe that irrespective of the water content level, the specific volume decreases as the confining pressure increases, signifying that the specimen’s volume variation amplifies with the rise in confining pressure. Because the test is undrained, the decline in volume will inevitably bring about a rise in the degree of saturation. Comparing the results of the two models with the experimental data reveals that the specific volume changes calculated by the GCM are more consistent with the actual experimental results, while the BBMx shows a significant disparity from the experimental data.

4.5. The Hydraulic Coupling Effect during Shearing

The undrained shearing of unsaturated soil essentially involves a constant water content shearing process. Although the volume reduction in the pore spaces within the soil during shearing does not change the water content [41], it does result in an elevation of saturation, as defined by the degree of saturation. The decrease in shear strength of the soil occurs due to the increase in saturation, despite the water content remaining constant. The critical state parameter M, which reflects the softness or hardness of the specimen, is used to study this hydraulic coupling effect concerning confining pressure and water content.
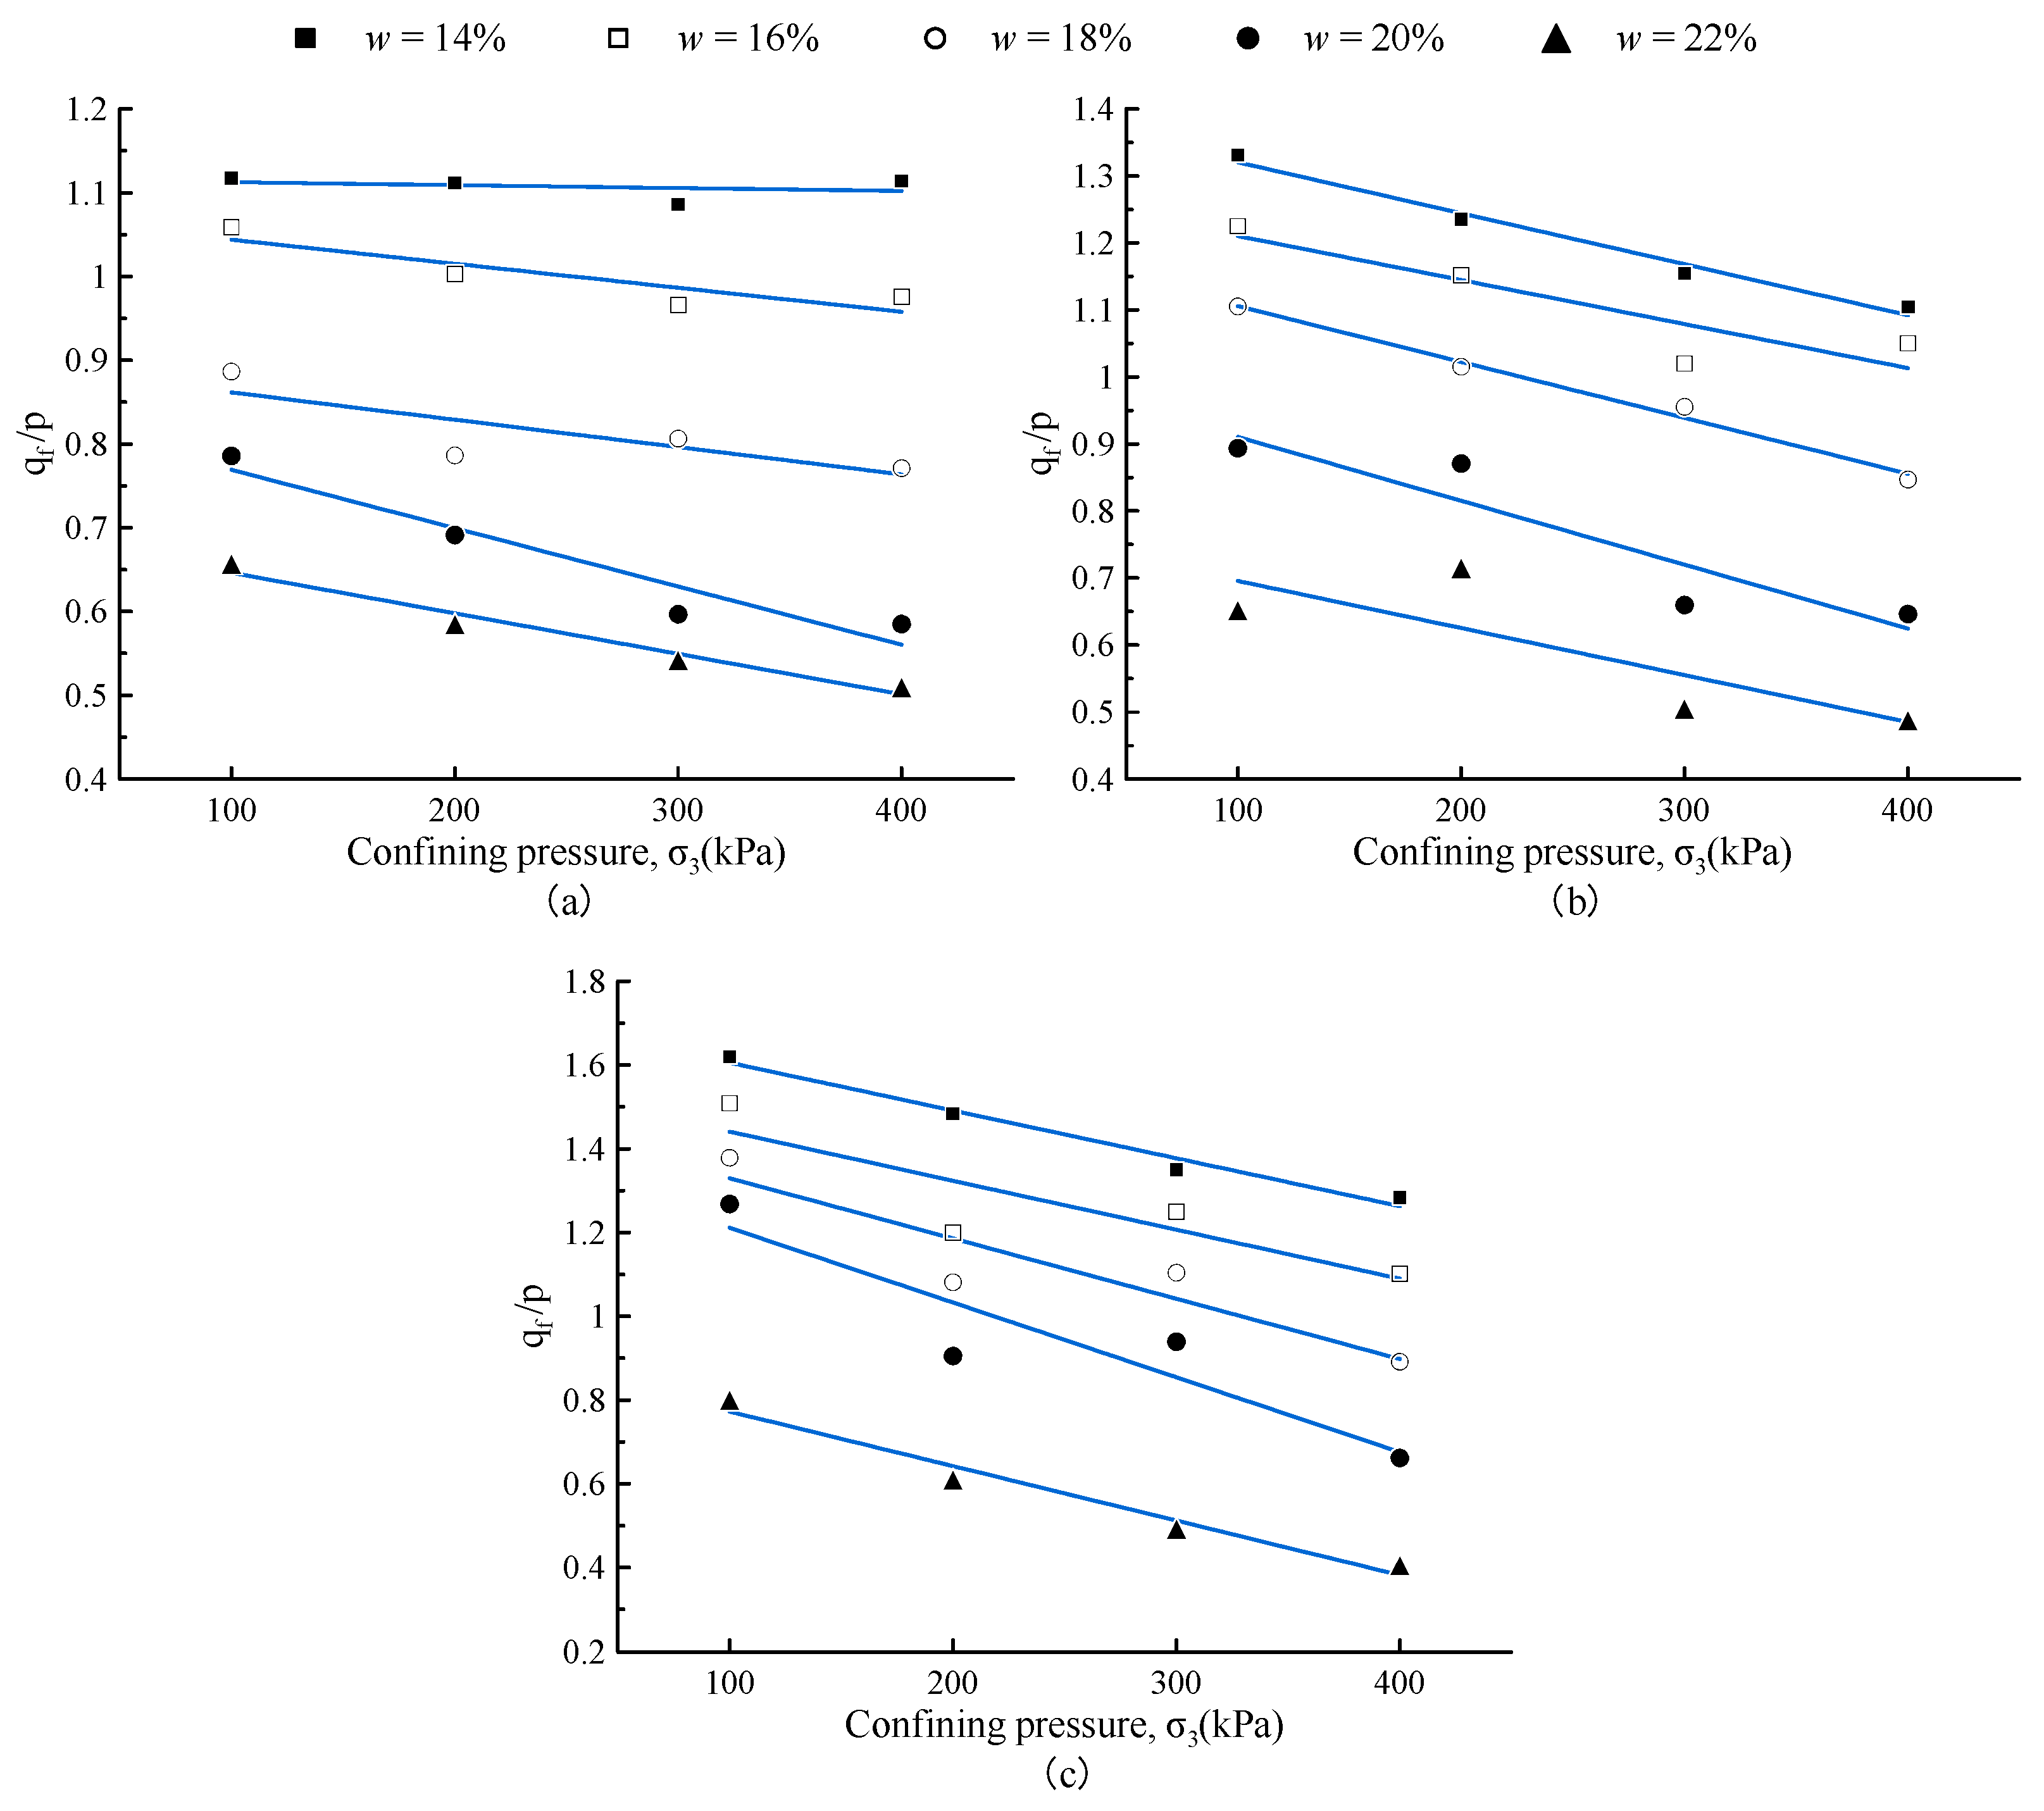
Figure 11 depicts the correlation between the critical state parameter M and the confining pressure across various dry densities and initial water contents. It can be noted that, overall, the critical state parameter decreases gradually as the initial water content increases. In cases where the dry density is 1.3 g/cm³ and the water content is 14%, the variation of M with confining pressure is minimal. However, with a further increase in water content, it starts to show a decrease as the confining pressure increases. In contrast, for specimens with other dry densities, the variation in M is more significant with any given water content.
It can be observed that the unsaturated specimens exhibit different behaviors from the consolidated specimens when sheared under undrained conditions. In post-consolidation shear, M remains a constant, independent of the confining pressure or initial water content; it does not change with variations in confining pressure or initial water content. However, under undrained conditions, with the same water content, M decreases with increasing confining pressure; thus, higher confining pressure does not enhance the specimen’s strength but rather makes it more susceptible to failure. This phenomenon can be explained using Figure 12: when the axial strain remains fixed at 15%, the final volume change in the specimen is significantly influenced by the confining pressure. A higher confining pressure results in the reduced lateral deformation capability of the specimen. Thus, with the water content maintaining consistency with that in Figure 10, the specific volume decreases upon the completion of shearing as the confining pressure rises, bringing about an increase in saturation. The reduction in pore size during shear induces the migration of the incompressible fluid. With a low water content in the soil, the water films between particles are mostly not interconnected. Even as the pore space gradually decreases, the interconnection of liquid between particles is limited, resulting in reduced interparticle friction and a decrease in M. This effectively explains the nearly constant M observed with moisture content of 14% in Figure 11a. With the same dry density, as the water content within the soil increases, the volume of the meniscus-shaped water between particles increases to the extent that adjacent menisci become interconnected. At this point, the liquid phase within the soil becomes interconnected, leading to a decrease in interparticle friction and a reduction in soil strength. This explains why, with any given dry density, M decreases with increasing initial water content under the same confining pressure shown in Figure 11. An increase in confining pressure enhances the volume compression of the specimen, making it easier for the liquid to occupy the pores and reduce friction. Therefore, with any given dry density (except for w = 14% in Figure 11a), M decreases with increasing confining pressure for specimens with the same water content. Consequently, during shear, the specimens are subjected to axial loading and confining pressure, forcing liquid migration, thereby increasing saturation and affecting the hydraulic coupling process of the specimen’s strength.

4.6. The Proposal of the Strength Parameter η

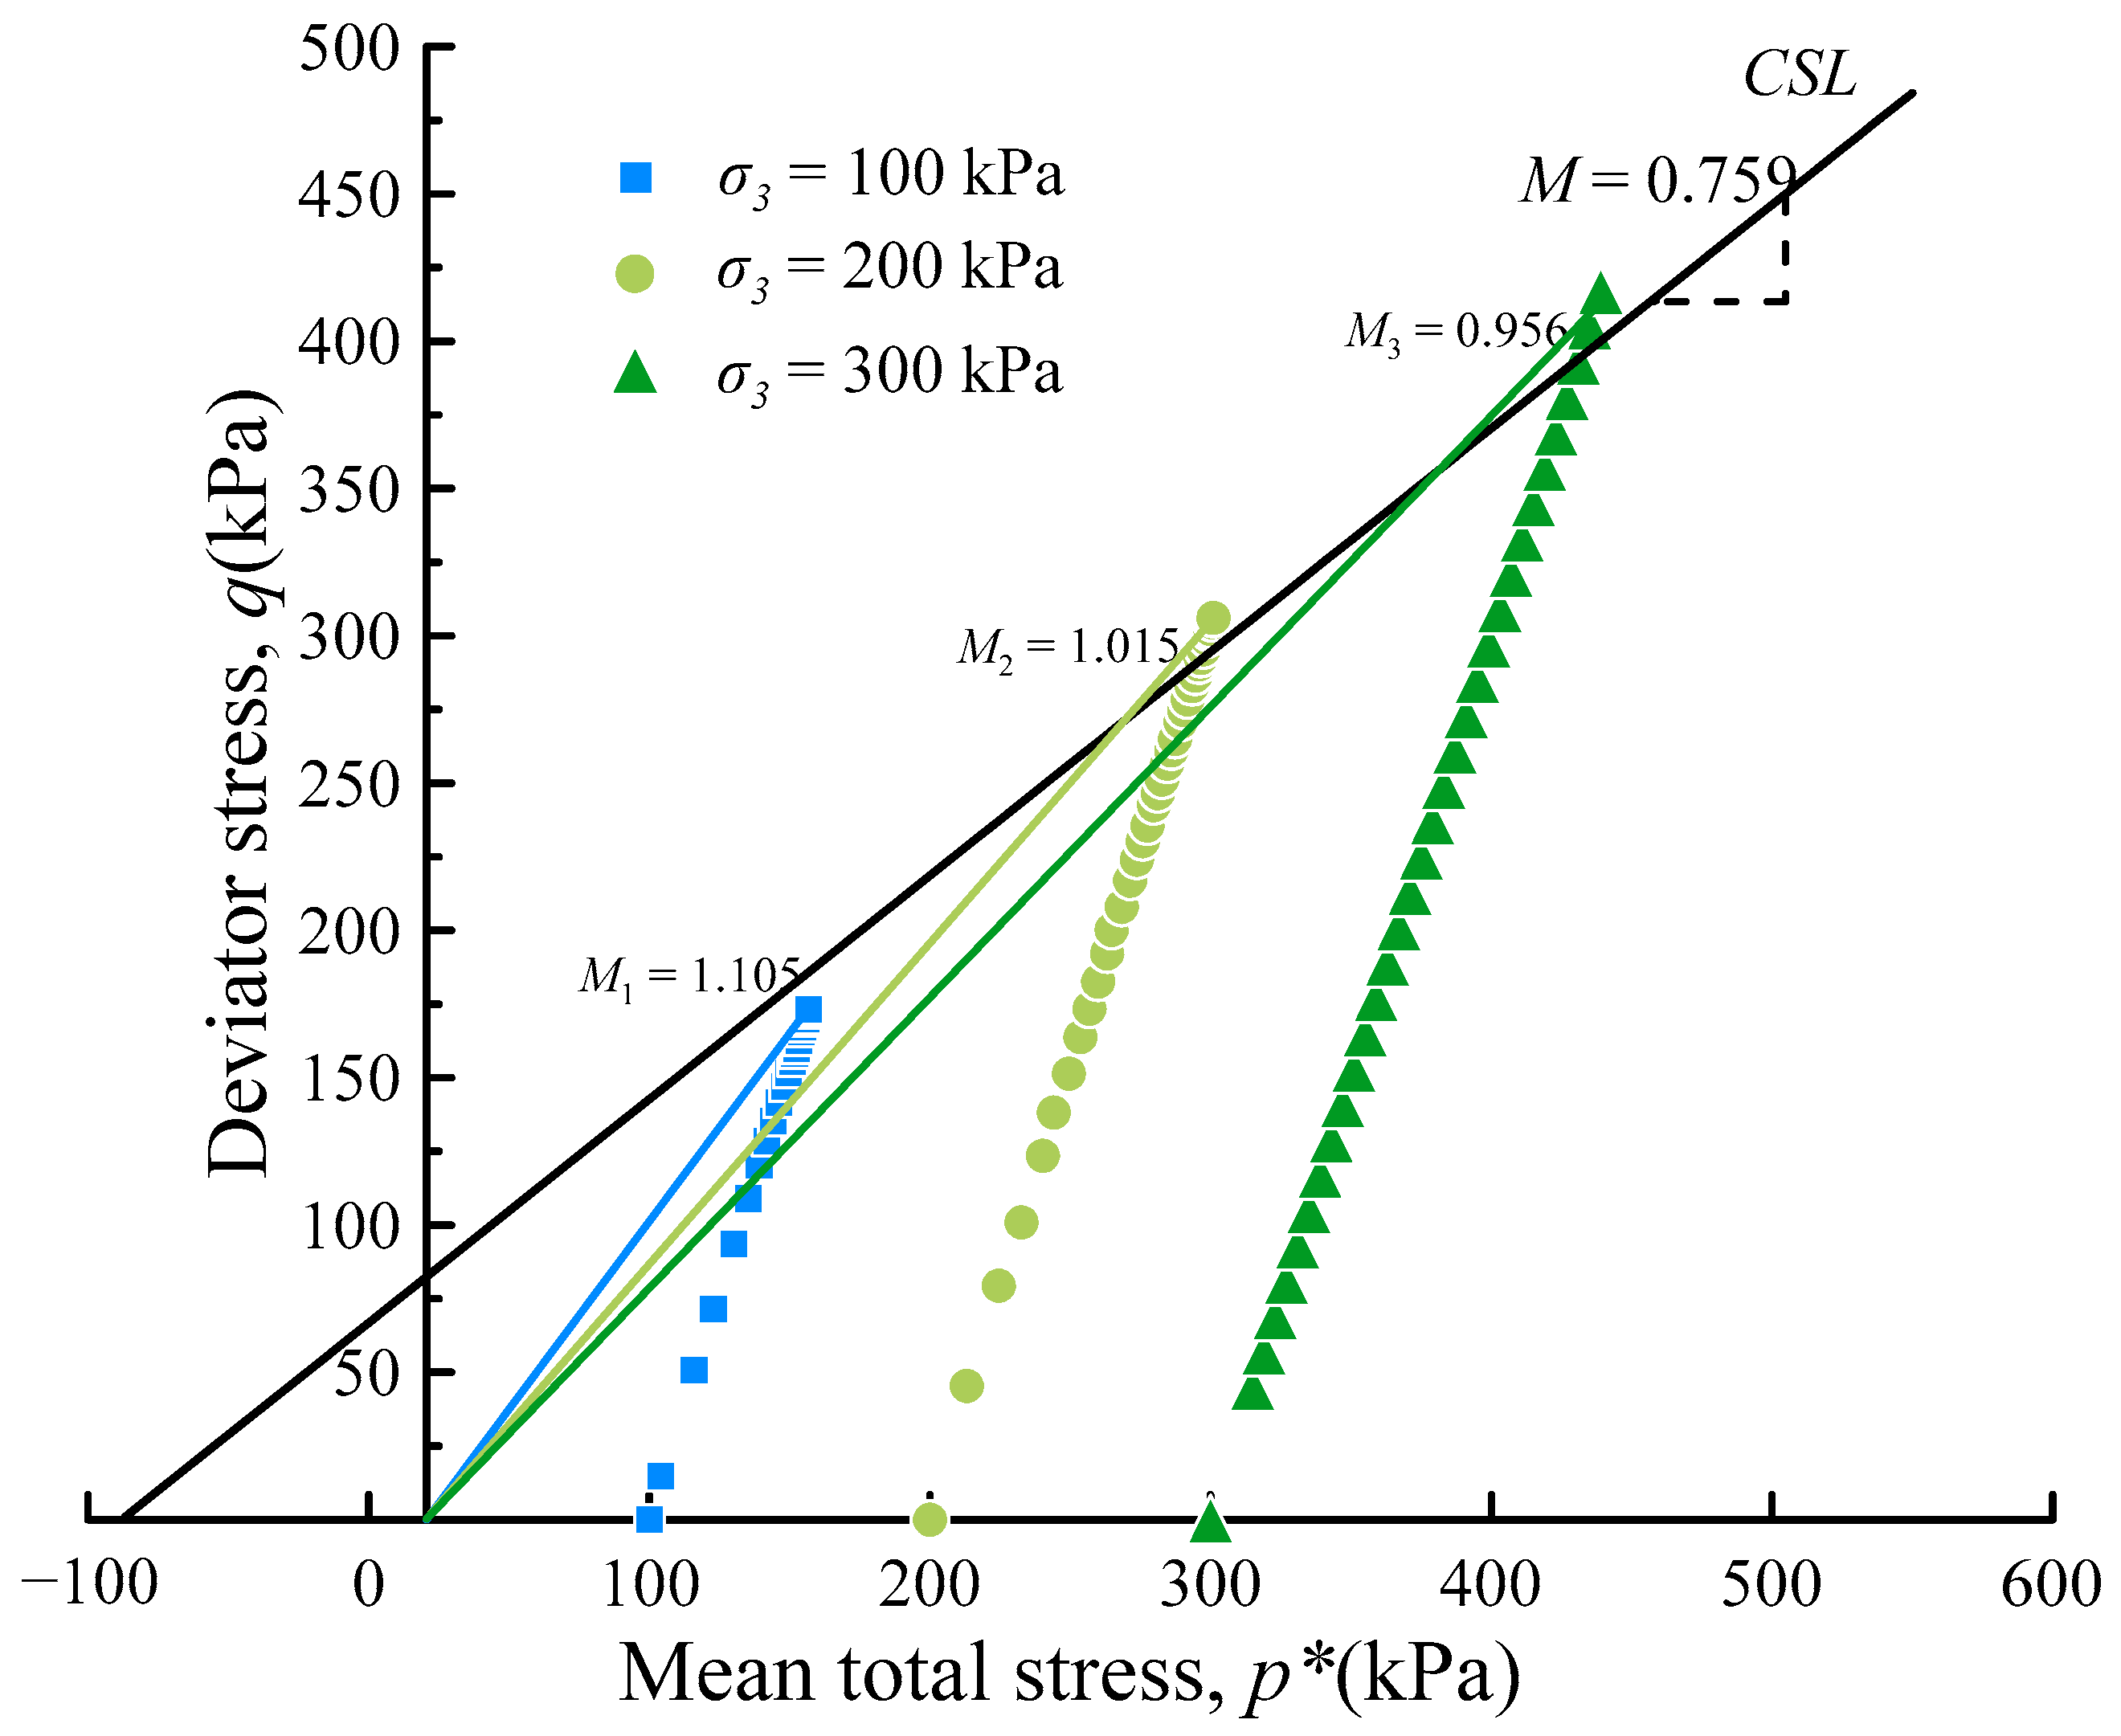
The critical state lines of stress paths under confining pressures of 100 kPa, 200 kPa, and 300 kPa at ρd = 1.4 g/cm3 and w = 18% are shown in Figure 13. Observation reveals that the critical state line does not go through the origin but intersects the negative half-axis specifically along the x-axis. Undisturbed unsaturated loess always exhibits higher tensile strength [42], and the shear strength boundary in the p-q plane does not go through the origin [34]. This strength decreases gradually with increasing shear, resulting in different critical state stress ratios for the same sample under different confining pressures. Similarly, the unstressed unsaturated compacted loess in this study also demonstrates these characteristics, where an increase in saturation due to shear leads to reduced strength. The original GCM’s Fy yield surface fails to capture this feature, thus prompting the proposal of a unique strength parameter η, which reflects this characteristic and makes the critical state line unique, as follows:
η = M u M s = q / p u q / p s
In the equation, the formula Mu represents the stress ratio of unsaturated soil, while Ms represents the stress ratio of saturated soil; as the soil becomes fully saturated, the matric suction approaches zero, and the interparticle bonding and friction are minimal, leading to a lower stress ratio than that of unsaturated soil. As seen from Equation (19), as the soil’s degree of saturation increases, its stress ratio becomes closer to that of saturated soil, and the η approaches 1. Figure 14a depicts the variation trend of the strength parameter η with axial strain at ρd = 1.4 g/cm3 and w = 18%. With increasing axial strain, the degree of saturation gradually rises, causing η to decrease, indicating that the initial strength decreases with shear. This behavior can be fitted using an exponential function as given by Equation (20).
η = y 0 + A 1 e ε a / t 1
where y0, A1, and t1 are all fitting parameters. When the axial strain is set to zero, the obtained strength parameter is defined as the initial strength parameter η0. As shown in Figure 14b, the value diminishes with a rise in confining pressure, highlighting the influence of the initial confining pressure on the soil. By fitting its relationship with confining pressure, the initial strength parameter η0 of the soil at a confining pressure of 400 kPa can be approximately 3.52. For any unsaturated compacted loess, the range of values for the strength parameter η is [1, η0]. During shearing, it gradually decreases from the maximum value η0 and tends towards 1. The strength degradation factor ζ is defined to represent the decay of the strength during shearing, and its expression is as follows:
ζ = η 1 η 0 1
As observed in Equation (21), the range of values for the strength degradation factor ζ is [0, 1]. In the initial stage, the degradation factor is 1, representing the initial strength. As shearing progresses, ζ gradually approaches 0, indicating the gradual decay of the initial strength. Based on the above formula, incorporating the degradation factor into the expression of Equation (10) yields the following form:
F y = q 2 M 2 p * + p p 0 * p *
p = ζ × p s
where ps represents the abscissa value of the intersection point of the critical state line with the x-axis, and p′ denotes the strength value corrected using the degradation factor. Substituting the yield surface formed by Equations (22) and (23) for the original Fy yield surface results in the modified GCM (MGCM).
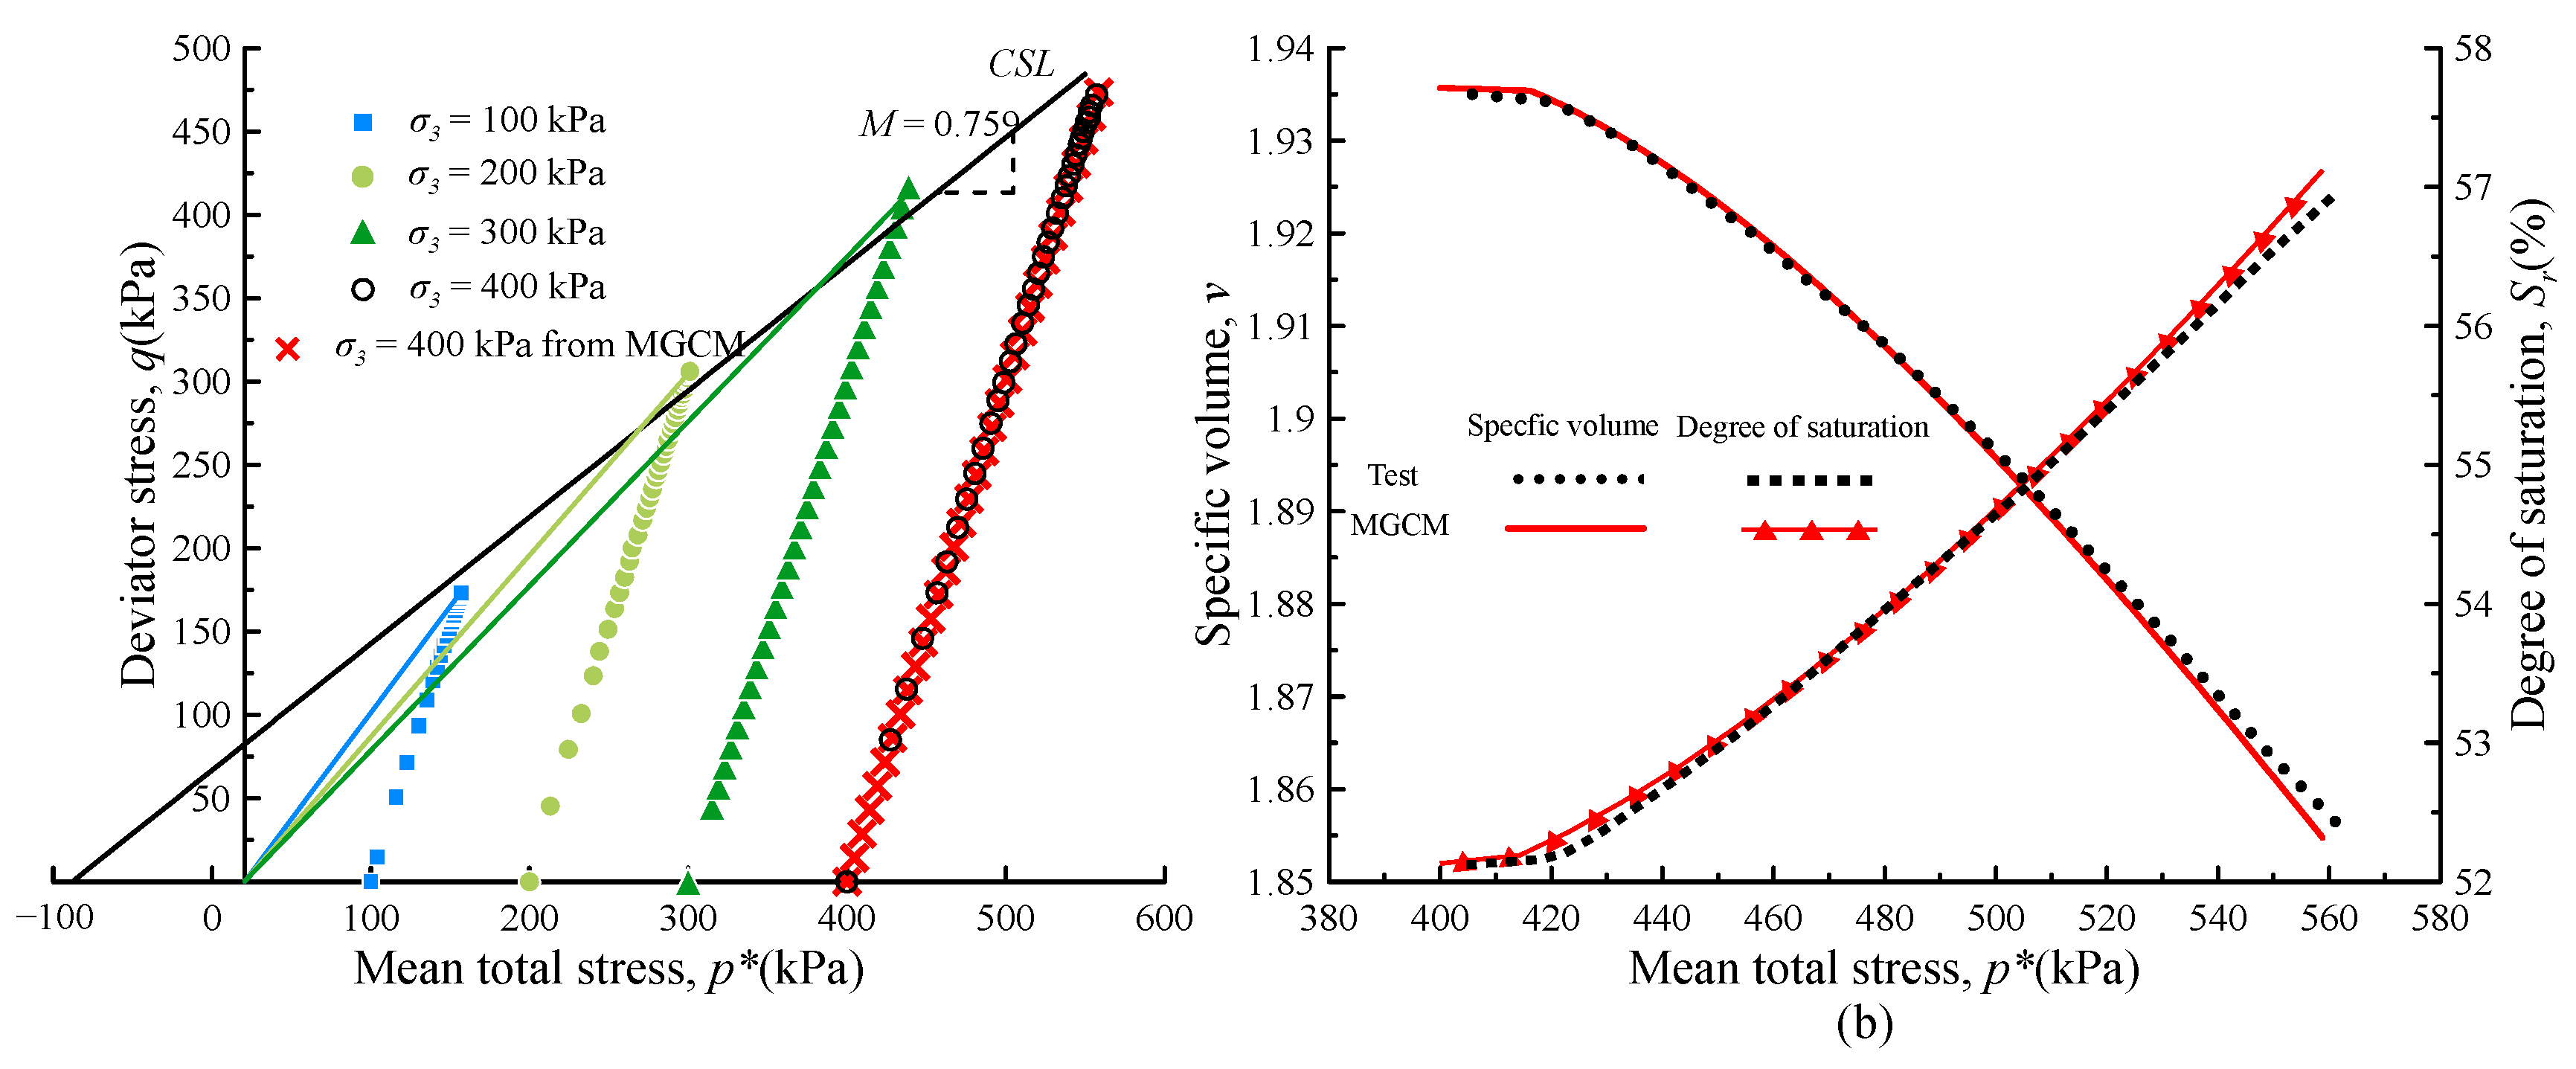
The shape of the yielded surface in the p*-q-s space after modification is shown in Figure 15. To examine the predictive capability of the modified model, predictions for the test conducted at a confining pressure of 400 kPa as shown in Figure 13 were made and compared with the experimental results. The parameter selections can be found in Table 6, and the comparison between the simulated results and the experimental results is shown in the following Figure 16.
From Figure 16a, it can be observed that, with the improvement in the yield surface, the simulated stress paths closely match the experimental values and are both close to the critical state line. Figure 16b shows the relationship curve of average total stress with specific volume and degree of saturation, demonstrating that the MGCM still exhibits good predictive capability for specimen volume changes and saturation changes. Therefore, the inclusion of the strength parameter η not only makes the critical state line unique but also enhances its applicability to unsaturated compacted loess.

5. Discussion

The fitting results of the two models suggest that, with the same saturated state and parameters such as the compression coefficient λ(0) and resilience coefficient κ, the GCM exhibits closer agreement with the experimental data regarding specific volume changes than the BBMx. This indicates that considering only matric suction cannot fully explain the stress effects of unsaturated loess. By incorporating saturation into the stress variables, the GCM accounts for the plastic volumetric strain resulting from changes in the water retention properties of the specimen. Therefore, under the same controlled compression parameters, the GCM better reflects the variations in the volume and degree of saturation of unsaturated loess under triaxial shearing compared to the BBMx.
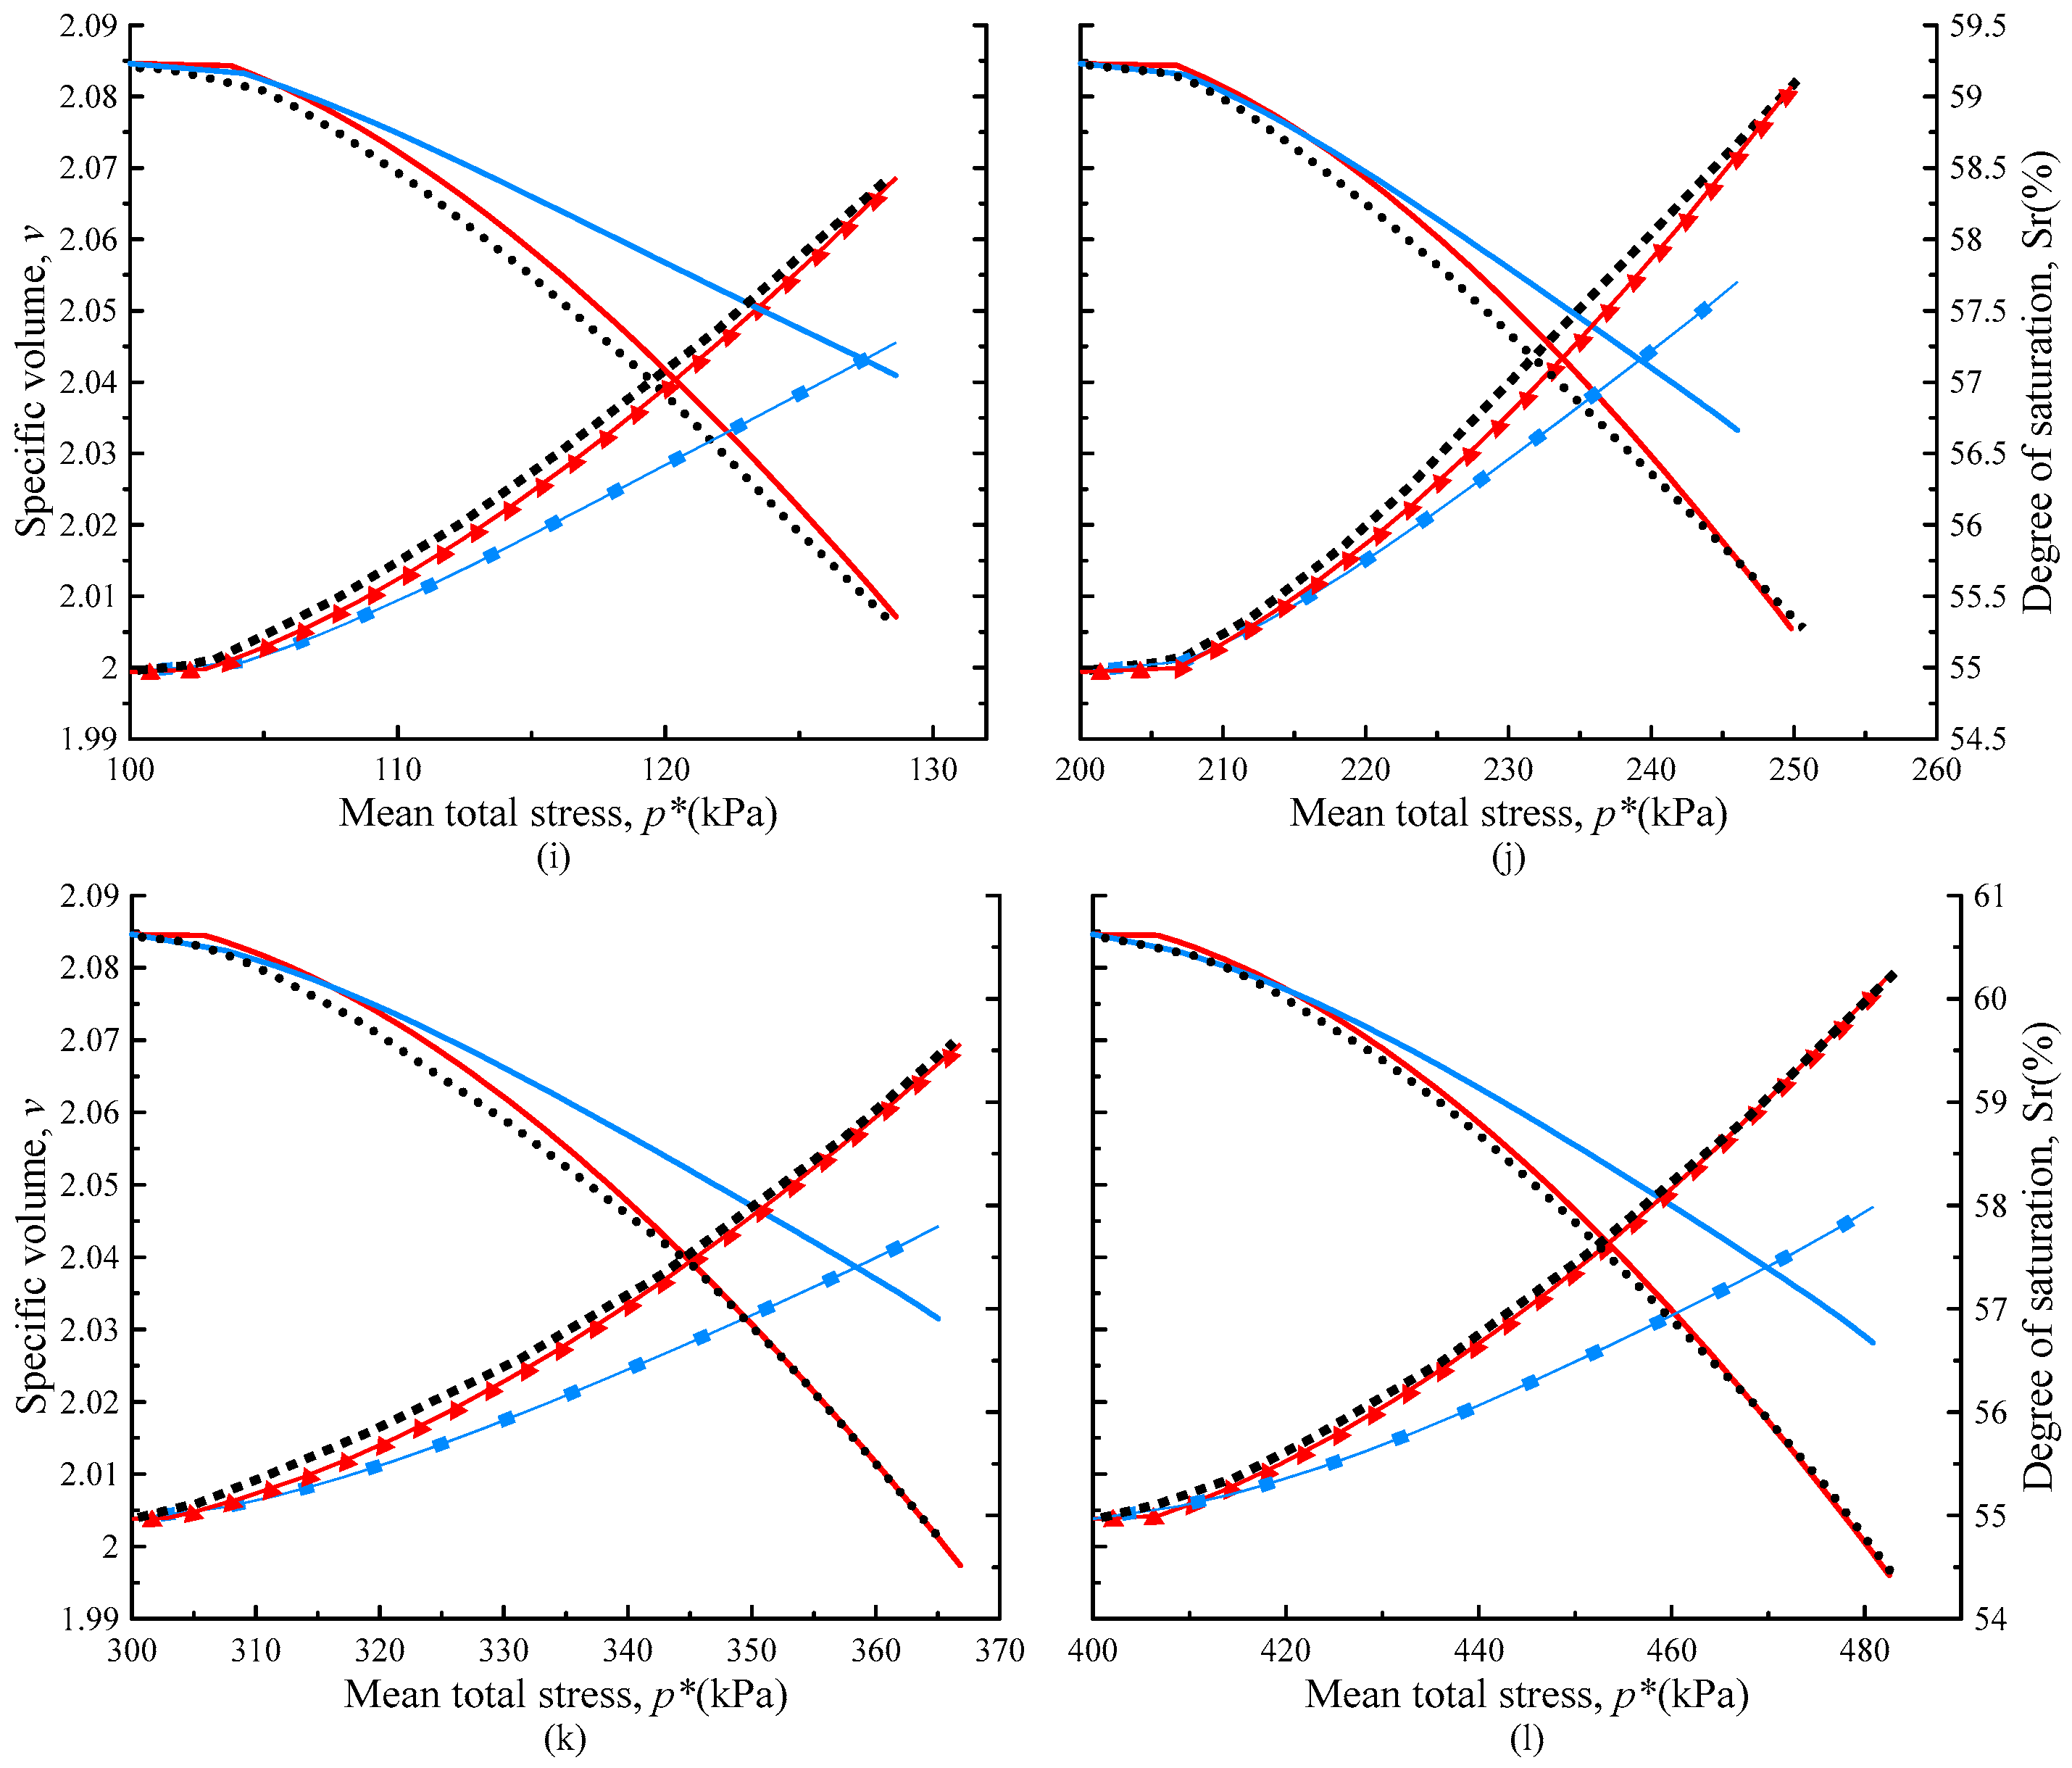
The water content of the test samples in this study did not allow the samples to reach saturation after compression. Calculations were conducted for an initial state with a dry density of 1.5 g/cm³ and a moisture content of 25% in both models until the matrix suction was reduced to zero to investigate the applicability of the two models under high water content. The analysis focused on the differences in the calculated results under high moisture content. Figure 17 illustrates the calculation results of the two models at confining pressures of 100 kPa, with water contents of 22% and 25%. It can be observed that compared to the soil sample with a moisture content of 22%, the difference in specific volume results obtained by GCM and BBMx reduces significantly under higher moisture conditions. Regarding saturation, the result obtained by GCM approaches saturation when the matrix suction is zero, while BBMx still exhibits a certain deviation from saturation. In summary, the hydro-mechanical coupling model matches well with the experimental data under any water content condition. With lower water content, the BBMx exhibits notable deviations from the experimental data; however, with increased water content and as the soil nears saturation, diminishing the impact of saturation and matrix suction on its mechanical characteristics, the computational outcomes of the two models converge more closely.

6. Conclusions

This study investigated the hydro-mechanical coupling effects on the mechanical properties of unsaturated compacted loess under undrained conditions. Through isotropic compression tests and undrained shear tests on unsaturated compacted loess, and by using constitutive models, the BBMx and GCM, to simulate the shear tests, the hydraulic coupling characteristics of unsaturated compacted loess under load effects were investigated. The following conclusions were drawn:
(1)
The mechanical impact of increased saturation with constant water content influences the mechanical properties of unsaturated loess. Under constant water content, volume compression reduces the strength of unsaturated compacted loess. This is evident both in isotropic consolidation, where the compression index can be expressed as a function of saturation, and in triaxial shearing, where increasing water content leads to higher confining pressure, which in turn increases saturation and intensifies the trend of M reduction and strain softening. This illustrates the hydraulic coupling effect of the mechanical increase in saturation on the mechanical characteristics of unsaturated loess.
(2)
The hydro-mechanical coupling model (GCM), considering the mechanical changes in saturation, can better reflect the hydro-mechanical response of loess under load conditions. As the water content increases, the influence of hydraulic factors on the model’s performance gradually weakens. The model (BBMx) that does not consider hydraulic effects shows an increased response of loess properties under high water content, indicating a reduced dependence of the mechanical properties of loess on saturation with high water content.
(3)
The introduction of the strength parameter η, which characterizes the decay of initial strength as saturation increases during shearing, reveals the hydraulic–mechanical coupling effect of strength decay with increasing saturation during shearing and makes the critical state line of the same sample unique, thus improving the GCM. The improved model not only enhances the accuracy of model calculations but also improves predictive capability for the same initial state. The results of the constitutive model calculations indicate that the hydraulic coupling effect reveals the variation laws of specific volumes and saturations of unsaturated loess with average stress.
In this paper, we investigated the hydraulic coupling mechanism of the strength degradation of saturated loess under mechanical loading with constant water content using isotropic consolidation and undrained shear tests. We introduced a strength parameter η into the GCM to reflect this behavior, and the modified model showed good predictability for undrained shear tests. Since the change in matric suction during shearing and the softening effect of increased saturation on strength were not directly measured in the study, the use of the strength parameter η to describe these phenomena is only indirect. Therefore, the accurate measurement of non-equilibrium pore water pressure under rapid loading and considering the strength parameter η as a function of saturation is crucial for studying the hydraulic coupling in unsaturated compacted loess under undrained shear. This research will provide important insights for engineering practices involving unsaturated compacted loess in the Loess Plateau region.

Author Contributions

Conceptualization, H.C. and W.W.; methodology, H.C.; software, H.C.; validation, H.C., W.W. and B.Q.; formal analysis, H.C.; investigation, M.A.; resources, X.L.; data curation, H.C.; writing—original draft preparation, H.C.; writing—review and editing, B.Q.; visualization, B.Q.; supervision, B.Q.; project administration, X.L.; funding acquisition, X.L. All authors have read and agreed to the published version of the manuscript.

Funding

This research was funded by the National Natural Science Foundation of China (Grant No. 42230712, 41877225).

Data Availability Statement

Some or all data, models, or codes that support the findings of this study are available from the corresponding author upon reasonable request.

Conflicts of Interest

The authors declare no conflicts of interest.

References

  1. Li, Y.; Shi, W.; Aydin, A.; Beroya-Eitner, M.A.; Gao, G. Loess genesis and worldwide distribution. Earth-Sci. Rev. 2020, 201, 102947. [Google Scholar] [CrossRef]
  2. Pu, C.; Xu, Q.; Zhao, K.; Jiang, Y.; Hao, L.; Liu, J.; Chen, W.; Kou, P. Characterizing the Topographic Changes and Land Subsidence Associated with the Mountain Excavation and City Construction on the Chinese Loess Plateau. Remote Sens. 2021, 13, 1556. [Google Scholar] [CrossRef]
  3. Li, J.; Zhao, S.; Wang, X.; Hao, J.; Zhi, B.; Zhang, H.; Deng, B.; Xu, J. Experimental Study on Consolidation Characteristics of Compacted Loess. Adv. Civ. Eng. 2021, 2021, 6687858. [Google Scholar] [CrossRef]
  4. Lai, J.; Liu, Y.; Xiang, Y.; Wang, W.; Xu, J.; Cao, B.; Zhao, D.; Wei, W.; Bao, H.; Yan, C.; et al. Experimental study on shear strength of saturated remolded loess. PLoS ONE 2022, 17, e0271266. [Google Scholar] [CrossRef] [PubMed]
  5. Leng, Y.; Peng, J.; Wang, S.; Lu, F. Development of water sensitivity index of loess from its mechanical properties. Eng. Geol. 2021, 280, 105918. [Google Scholar] [CrossRef]
  6. Xing, Y.; Gao, D.; Jin, S.; Zhang, A.; Guo, M. Study on Mechanical Behaviors of Unsaturated Loess in terms of Moistening Level. KSCE J. Civ. Eng. 2019, 23, 1055–1063. [Google Scholar] [CrossRef]
  7. Shao, S.; Shao, S.; Wang, J. True triaxial mechanical properties of unsaturated loess in foundation pit engineering. Bull. Eng. Geol. Environ. 2021, 80, 4751–4772. [Google Scholar] [CrossRef]
  8. Sheng, D. Review of fundamental principles in modelling unsaturated soil behaviour. Comput. Geotech. 2011, 38, 757–776. [Google Scholar] [CrossRef]
  9. Niu, L.; Niu, H.; Zhao, Y.; Ge, L.; Guo, M.; Ren, W.; Wang, Y.; Zhang, A. Study on the Unified Mechanical Properties of Ili Undisturbed Loess under the Influence of Soluble Salt. Sustainability 2023, 15, 14717. [Google Scholar] [CrossRef]
  10. Zhang, Z.; Fu, Y.; Zhou, A.; Hou, X.; Zhang, M.; Fan, Z. Coupled Hydromechanical Behavior of Compacted Loess during Isotropic Compression. Int. J. Geomech. 2023, 23, 04023167. [Google Scholar] [CrossRef]
  11. Zhang, D.; Wang, J.; Chen, C.; Wang, S. The compression and collapse behaviour of intact loess in suction-monitored triaxial apparatus. Acta Geotech. 2019, 15, 529–548. [Google Scholar] [CrossRef]
  12. Bai, J.; Diao, Y.; Jia, C.; Liu, C.; Zhang, M.; Wang, C. A Review of Advances in Triaxial Tests: Instruments, Test Techniques and Prospects. KSCE J. Civ. Eng. 2022, 26, 3325–3341. [Google Scholar] [CrossRef]
  13. Yates, K.; Russell, A.R. The unsaturated characteristics of natural loess in slopes, New Zealand. Géotechnique 2022, 73, 871–884. [Google Scholar] [CrossRef]
  14. Zhang, J.W.; Mu, Q.Y.; Garg, A.; Liu, F.L.; Cao, J. Shear behavior of unsaturated intact and compacted loess: A comparison study. Environ. Earth Sci. 2020, 79, 79. [Google Scholar] [CrossRef]
  15. Gao, B.; Su, L. Triaxial Mechanical Testing of Undisturbed Unsaturated Loess. Soil Mech. Found. Eng. 2020, 57, 57–64. [Google Scholar] [CrossRef]
  16. Zhong, Z.-L.; Liu, Y.-X.; Liu, X.-R.; Li, X.-Y.; Wang, S. Influence of moisture content on shearing strength of unsaturated undisturbed quaternary system middle pleistocene. J. Cent. South Univ. 2015, 22, 2776–2782. [Google Scholar] [CrossRef]
  17. Zheng, F.; Shao, S.; Wang, J.; Shao, S. Experimental Study on the Mechanical Behaviour of Natural Loess Based on Suction-Controlled True Triaxial Tests. KSCE J. Civ. Eng. 2020, 24, 2304–2321. [Google Scholar] [CrossRef]
  18. Wong, C.K.; Lun, M.C.H.; Wong, R.C.K. Interpretation of undrained shear strength observed in confined triaxial compression tests on compacted clay. Can. Geotech. J. 2021, 58, 1690–1702. [Google Scholar] [CrossRef]
  19. Yan, G.; Li, Z.; Galindo Torres, S.A.; Scheuermann, A.; Li, L. Transient Two-Phase Flow in Porous Media: A Literature Review and Engineering Application in Geotechnics. Geotechnics 2022, 2, 32–90. [Google Scholar] [CrossRef]
  20. Yan, G.; Li, Z.; Bore, T.; Galindo Torres, S.A.; Scheuermann, A.; Li, L. A lattice Boltzmann exploration of two-phase displacement in 2D porous media under various pressure boundary conditions. J. Rock Mech. Geotech. Eng. 2022, 14, 1782–1798. [Google Scholar] [CrossRef]
  21. Pujiastuti, H. The Effect of Matric Suction on the Shear Strength of Unsaturated Sandy Clay. Int. J. GEOMATE 2018, 14, 112–119. [Google Scholar] [CrossRef]
  22. Onyelowe, K.C.; Ebid, A.M.; Ramani Sujatha, E.; Fazel-Mojtahedi, F.; Golaghaei-Darzi, A.; Kontoni, D.N.; Nooralddin-Othman, N. Extensive overview of soil constitutive relations and applications for geotechnical engineering problems. Heliyon 2023, 9, e14465. [Google Scholar] [CrossRef]
  23. Alonso, E.E.; Gens, A.; Josa, A. A constitutive model for partially saturated soils. Géotechnique 1990, 40, 405–430. [Google Scholar] [CrossRef]
  24. Pedroso, D.M.; Farias, M.M. Extended Barcelona Basic Model for unsaturated soils under cyclic loadings. Comput. Geotech. 2011, 38, 731–740. [Google Scholar] [CrossRef]
  25. Lloret-Cabot, M.; Sánchez, M.; Wheeler, S.J. Formulation of a three-dimensional constitutive model for unsaturated soils incorporating mechanical-water retention couplings. Int. J. Numer. Anal. Methods Geomech. 2013, 37, 3008–3035. [Google Scholar] [CrossRef]
  26. Yao, Y.-P.; Kong, Y.-X. Extended UH Model: Three-Dimensional Unified Hardening Model for Anisotropic Clays. J. Eng. Mech. 2012, 138, 853–866. [Google Scholar] [CrossRef]
  27. Wheeler, S.J.; Sharma, R.S.; Buisson, M.S.R. Coupling of hydraulic hysteresis and stress–strain behaviour in unsaturated soils. Géotechnique 2003, 53, 41–54. [Google Scholar] [CrossRef]
  28. Sheng, D.; Sloan, S.W.; Gens, A.; Smith, D.W. Finite element formulation and algorithms for unsaturated soils. Part I: Theory. Int. J. Numer. Anal. Methods Geomech. 2003, 27, 745–765. [Google Scholar] [CrossRef]
  29. Sheng, D.; Fredlund, D.G.; Gens, A. A new modelling approach for unsaturated soils using independent stress variables. Can. Geotech. J. 2008, 45, 511–534. [Google Scholar] [CrossRef]
  30. Khalili, N.; Habte, M.A.; Zargarbashi, S. A fully coupled flow deformation model for cyclic analysis of unsaturated soils including hydraulic and mechanical hystereses. Comput. Geotech. 2008, 35, 872–889. [Google Scholar] [CrossRef]
  31. Cardoso, R.; Han, B.; Cai, G.; Xie, L.; Li, J.; Zhao, C.; Jommi, C.; Romero, E. Bounding surface constitutive model for unsaturated soils considering microscopic pore structure and bonding effect. In E3S Web of Conferences, Proceedings of the 4th European Conference on Unsaturated Soils (E-UNSAT 2020), Lisbon, Portugal, 19–21 October 2020; EDP Sciences: Les Ulis, France, 2020; Volume 195. [Google Scholar] [CrossRef]
  32. Hu, R.; Liu, H.-H.; Chen, Y.; Zhou, C.; Gallipoli, D. A constitutive model for unsaturated soils with consideration of inter-particle bonding. Comput. Geotech. 2014, 59, 127–144. [Google Scholar] [CrossRef]
  33. Liu, W.-H.; Li, W.-G.; Zhang, H.-Y.; Lin, X.-Y.; Kong, G.-Q.; Wang, L.; Hu, P. A critical state constitutive model for unsaturated structured soils. Comput. Geotech. 2022, 152, 104993. [Google Scholar] [CrossRef]
  34. Gao, D.; Zhao, K.; Jin, S.; Xing, Y. Moistening Deformation Constitutive Model for Unsaturated Loess. Int. J. Geomech. 2022, 22. [Google Scholar] [CrossRef]
  35. Shao, S.J.; Yu, Q.G.; Long, J.Y. A stress-strain relationship with soil structural parameter of collapse loess. In Proceedings of the 3rd Sino-Japan Geotechnical Symposium, Chongqing, China, 4–7 November 2007; pp. 488–500. [Google Scholar]
  36. Yao, Z.; Chen, Z.; Fang, X.; Wang, W.; Li, W.; Su, L. Elastoplastic damage seepage–consolidation coupled model of unsaturated undisturbed loess and its application. Acta Geotech. 2019, 15, 1637–1653. [Google Scholar] [CrossRef]
  37. GB/T50123-2019; Standard for Geotechnical Testing Method. Ministry of Water Resources of the People’s Republic of China: Beijing, China, 2019.
  38. Lloret-Cabot, M.; Wheeler, S.J.; Sánchez, M. A unified mechanical and retention model for saturated and unsaturated soil behaviour. Acta Geotech. 2016, 12, 1–21. [Google Scholar] [CrossRef]
  39. van Genuchten, M.T. A Closed-form Equation for Predicting the Hydraulic Conductivity of Unsaturated Soils. Soil Sci. Soc. Am. J. 1980, 44, 892–898. [Google Scholar] [CrossRef]
  40. Zhou, A.-N.; Sheng, D.; Sloan, S.W.; Gens, A. Interpretation of unsaturated soil behaviour in the stress—Saturation space, I: Volume change and water retention behaviour. Comput. Geotech. 2012, 43, 178–187. [Google Scholar] [CrossRef]
  41. Behbehani, F.; McCartney, J.S. Compression Response of Sedimented Unsaturated Soils. J. Geotech. Geoenviron. 2022, 148. [Google Scholar] [CrossRef]
  42. Liang, Q.; Wu, X.; Li, C.; Wang, L. Mechanical analysis using the unconfined penetration test on the tensile strength of Q3 loess around Lanzhou City, China. Eng. Geol. 2014, 183, 324–329. [Google Scholar] [CrossRef]
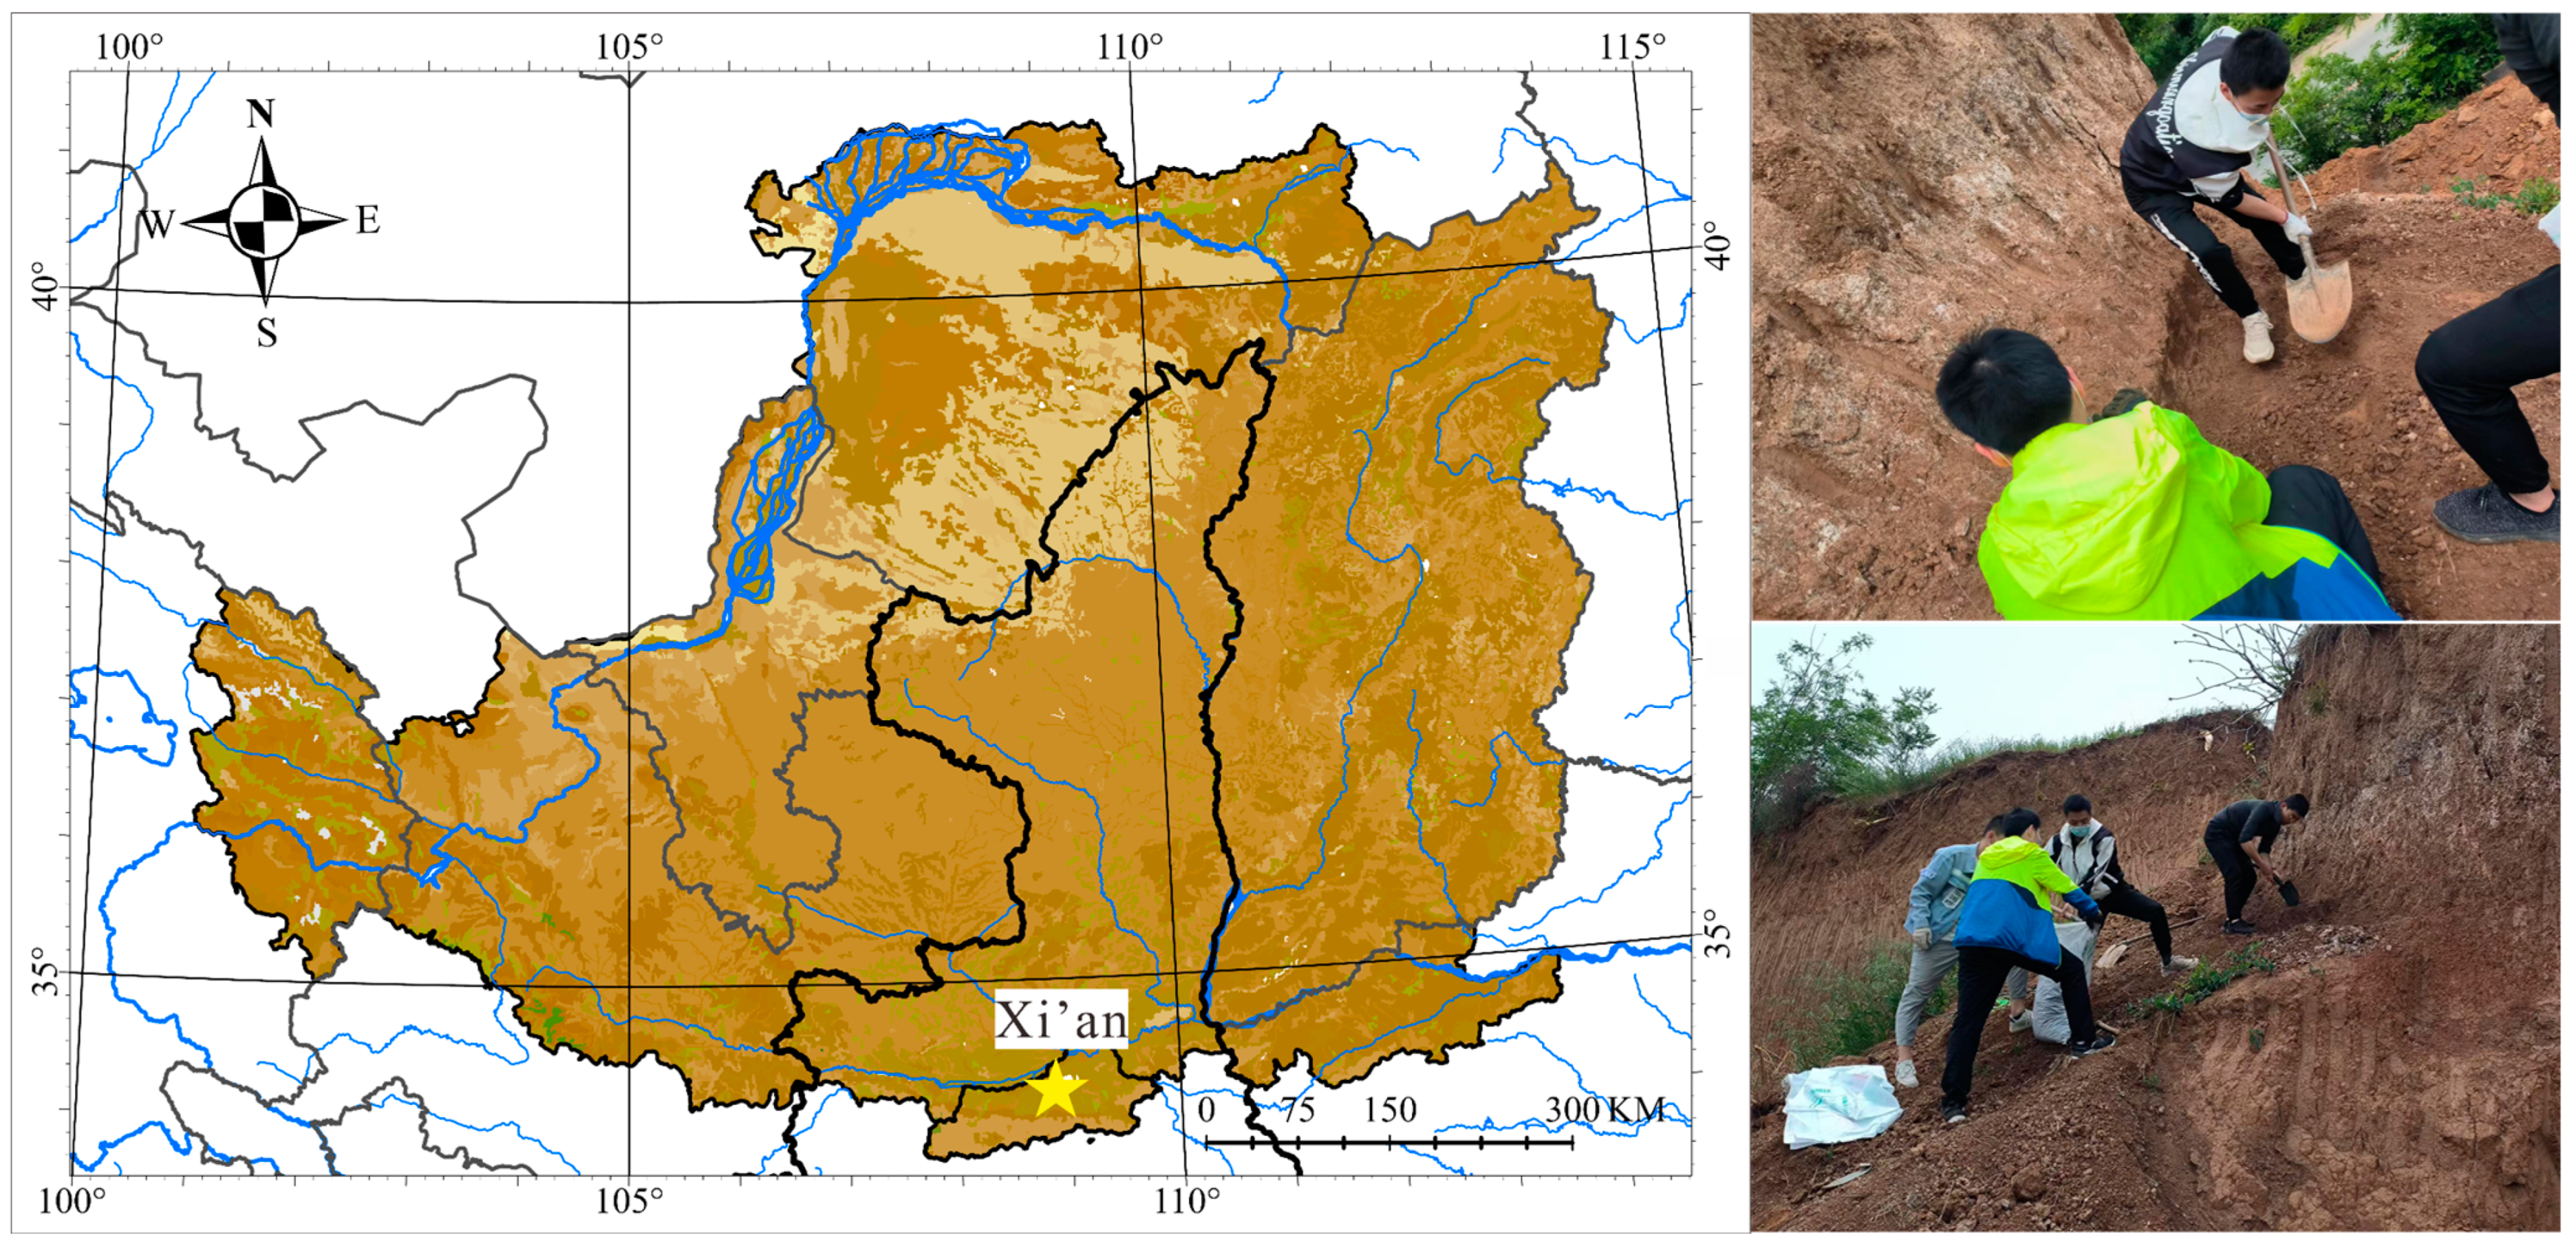
Figure 1. Schematic diagram of sampling location.
Water 16 00997 g001
Figure 2. Grain size distribution.
Water 16 00997 g002
Figure 3. Strain-controlled triaxial apparatus.
Water 16 00997 g003
Figure 4. Yield surface of BBMx in p-q-s space [22].
Water 16 00997 g004
Figure 5. Yield surfaces in Glasgow coupled model (GCM) [25].
Water 16 00997 g005
Figure 6. Soil–water characteristic curves under different dry densities.
Water 16 00997 g006
Figure 7. The normal consolidation curve of unsaturated loess: (a) ρd = 1.3 g/cm3, (b) ρd = 1.4 g/cm3, (c) ρd = 1.5 g/cm3.
Water 16 00997 g007
Figure 8. Fitting of parameter a and prediction of NCLs at ρd = 1.5 g/cm3: (a) calibration of fitting parameter a; (b) the compression curve of normally consolidated loess and predicted NCLs by Equation (17).
Water 16 00997 g008
Figure 9. Different stress–strain relationships under various water contents at ρd = 1.3 g/cm3: (a) w = 14%; (b) w = 18%; (c) w = 22%.
Water 16 00997 g009
Figure 10. The relationship between specific volume and degree of saturation as a function of mean effective stress ρd = 1.3 g/cm3: (a) w = 14%, σ3 = 100 kPa; (b) w = 14%, σ3 = 200 kPa; (c) w = 14%, σ3 = 300 kPa; (d) w = 14%, σ3 = 400 kPa; (e) w = 18%, σ3 = 100 kPa; (f) w = 18%, σ3 = 200 kPa; (g) w = 18%, σ3 = 300 kPa; (h) w = 18%, σ3 = 400 kPa; (i) w = 22%, σ3 = 100 kPa; (j) w = 22%, σ3 = 200 kPa; (k) w = 22%, σ3 = 300 kPa; (l) w = 22%, σ3 = 400 kPa.
Water 16 00997 g010aWater 16 00997 g010b
Figure 11. The relationship between the critical state parameter and confining pressure for different dry densities and water contents: (a) ρd =1.3 g/cm3; (b) ρd = 1.4 g/cm3; (c) ρd = 1.5 g/cm3.
Water 16 00997 g011
Figure 12. Conceptual diagram of the three-phase relationship of soil with constant water content under shear.
Water 16 00997 g012
Figure 13. The critical state line at ρd = 1.4 g/cm3 and w = 18%.
Water 16 00997 g013
Figure 14. The variation in the strength parameter η during shearing: (a) the strength parameter versus axial strain; (b) the initial strength parameter η0 versus confining pressure.
Water 16 00997 g014
Figure 15. The shape of the modified yield surface Fy in the p-q-s space.
Water 16 00997 g015
Figure 16. The MGCM calculation results: (a) the stress paths; (b) the relationship between specific volume and degree of saturation with total stress.
Water 16 00997 g016
Figure 17. Model calculation results: (a) the degree of saturation and specific volume vary with the average total stress at w = 22%; (b) the degree of saturation and specific volume vary with the average total stress at w = 25%.
Water 16 00997 g017
Table 1. Basic properties of loess samples.
Specific GravityWater ContentDry Density (g/cm3)Void RatioSize CompositionLiquid Limit (%)Plastic Limit (%)
>0.075 mm0.075–0.005 mm<0.005 mm
2.7111.21%1.431.090.2973.9225.7935.1219.96
Table 2. Triaxial shear test scheme.
SamplesDry DensityConfining PressureWater ContentQuantity
Loess 11.3 g/cm3100 kPa, 200 kPa, 300 kPa, 400 kPa14%, 16%, 18%, 20%, 22%60
Loess 21.4 g/cm3
Loess 31.5 g/cm3
Table 3. VG model fitting parameters.
Dry DensityαnmR2
1.30 g/cm30.60340.0660.935
1.40 g/cm30.37510.50.0230.950
1.50 g/cm30.158110.0190.989
Table 4. BBMx model parameters.
ParameterDry Density
1.3 g/cm3
Dry Density
1.4 g/cm3
Dry Density
1.5 g/cm3
ν0.40.40.4
λ(0)0.20250.1990.1953
λ(s)0.1519–0.15470.1493–0.14970.1465–0.1469
κ0.008–0.010.008–0.010.008–0.01
κs0.008–0.010.008–0.010.008–0.01
β0.180.180.18
γ0.750.750.75
sy
pref20–30 kPa25–45 kPa30–65 kPa
M0.456–1.1060.400–1.0130.236–1.122
k0.1–3.950.5–5.210.46–13.45
Table 5. GCM model parameters.
ParameterDry Density
1.3 g/cm3
Dry Density
1.4 g/cm3
Dry Density
1.5 g/cm3
ν0.40.40.4
λ(0)0.20250.1990.1953
κ0.008–0.010.008–0.010.008–0.01
λw0.0320.0390.042
κw0.010.0180.032
k10.10.20.2
k20.80.80.8
s18–44 kPa12–48 kPa26–233 kPa
s2
M1.12–0.511.33–0.4871.62–0.41
Table 6. The simulation parameters.
νλ(0)κλwkwk1k2pss2Mη0
0.40.480.0080.0390.0180.20.841.3 kPa18.5 kPa0.7593.52
Disclaimer/Publisher’s Note: The statements, opinions and data contained in all publications are solely those of the individual author(s) and contributor(s) and not of MDPI and/or the editor(s). MDPI and/or the editor(s) disclaim responsibility for any injury to people or property resulting from any ideas, methods, instructions or products referred to in the content.