Abstract
Surface water is a critical natural resource, but its mapping accuracy is vulnerable to cloud cover, snow, shadows, and diverse roofing materials. Recognizing the limitations of a single threshold segmentation method that fails to achieve high-precision extraction of surface water in complex terrain areas, this study introduces a multiple threshold water detection rule (MTWDR) method to improve water extraction results. This method uses the multi-band reflectance characteristics of ground features to construct a water index and combines brightness features with the Otsu algorithm to eliminate interference from highly reflective ground features like ice, snow, bright material buildings, and clouds. The Yunan–Guizhou Plateau was selected as the study area due to its complex terrain and multiple types of surface water, and experiments were conducted using Sentinel-2 data on the Google Earth Engine (GEE). The results demonstrate that: (1) The proposed method achieves an overall accuracy of 94.08% and a kappa coefficient of 0.8831 in mountainous areas. In urban areas, the overall accuracy reaches 95.15%, accompanied by a kappa coefficient of 0.8945. (2) Compared to five widely used water indexes and rules, the MTWDR method improves accuracy by more than 3%. (3) It effectively overcomes interference from highly reflective ground features while maintaining the integrity and accuracy of water boundary extraction. In conclusion, the proposed method enhances extraction accuracy across different types of surface water within complex terrain areas, and can provide significant theoretical implications and practical value for researching and applying surface water resources.
1. Introduction
Water resources are a fundamental pillar for human survival and socio-economic development [1,2], and also play an indispensable role in climate change, ecological research, and natural disaster monitoring [3,4]. As an important part of water resources [5], the precise extraction of surface water coverage is of great significance to the protection and management of water resources, encompassing rivers, lakes, and reservoirs that exhibit distinct seasonal variations [6,7]. The precise extraction of surface water on a large-scale can significantly contribute to the protection and management of water resources [8,9]. In recent years, remote sensing technology has emerged as a pivotal tool for extensive surface water mapping owing to its instantaneous imaging capabilities, wide coverage area, and provision of rich spectral information about ground objects. It enables the acquisition of comprehensive surface water data for in-depth analysis and has emerged as a pivotal approach for large-area surface water mapping. Consequently, high-precision automatic extraction of surface water utilizing remote sensing data has become an important research topic in water resource studies.
Currently, there are two categories of methods for surface water extraction using remote sensing data. The first is machine learning approaches that utilize spectral, texture, shape, and other features to accurately classify objects and water bodies using mathematical models [10]. For example, Sun et al. [11] effectively extracted urban water coverage at the pixel level by employing a mixed training dataset and the support vector machine (SVM). Deng et al. [12] utilized the random forest model to extract lakes in Wuhan urban agglomeration with an average accuracy of 93.11%. Luo et al. [13] proposed an enhanced deep learning model by integrating an image classification model and a semantic segmentation model, enabling accurate recognition of small water bodies on a fine scale. Notably, the algorithm demonstrated superior accuracy compared to SVM and U-Net. Although machine learning-based approaches can enhance the precision of surface water extraction, they are complex algorithms that require a large number of training samples unsuitable for large-scale applications due to the complexity and diversity of surface water information comprising various types of aquatic bodies posing challenges for these methods.
The second category is the water index method, which constructs a spectral index that maximizes the distinction between water and non-water, and then uses optimal segmentation threshold to extract surface water. For example, McFeeters [14] utilized Landsat TM’s near-infrared and green bands to develop the normalized difference water index (NDWI) for water body extraction. Xu [15] replaced the near-infrared band with the mid-infrared band to construct the modified normalized difference water index (MNDWI), which further mitigates interference from buildings, vegetation, and soil. Feyisa et al. [16] introduced the automated water extraction index (AWEI), considering both spectral reflectance differences between water and shadow areas. Li [17] weighted the water index based on local spatial information of images to create a background difference water index (BDWI). Compared to machine learning methods, the water index method offers high efficiency in calculations and enables rapid extraction of surface water over large areas. However, due to varying interfering ground objects in different backgrounds during water body extraction, a single approach using only a specific set of indices may not achieve high-precision results in complex terrain areas.
The aforementioned studies demonstrate that the machine learning-based water extraction method is susceptible to variations in training sample quality and background conditions (e.g., shadows, vegetation, clouds). Extracting large-scale surface water using this algorithm entails complexity and high computational costs. On the other hand, the water index method offers a relatively simple calculation process and enables rapid extraction of large-scale surface water. Nevertheless, different ground objects interfere with water body extraction under diverse backgrounds. For instance, mountainous areas are affected by mountain shadows, clouds, snow, and vegetation, among others; while urban areas face challenges from roofs and roads made of various materials. When employing a single threshold for extracting water bodies in complex terrain areas, using a sole water index approach becomes challenging due to difficulties in determining an ideal threshold to distinguish between water and non-water regions. Consequently, the applicability and accuracy of this method are constrained by intricate backgrounds [18,19].
Due to the susceptibility of a single water index to complex background ground objects during water bodies extraction, several scholars have developed mixed index rules for extracting water bodies with a large area. For instance, Zou et al. [20] employed the MNDWI, normalized difference vegetation index (NDVI) [21], and enhanced vegetation index (EVI) [22] to construct mixed index rules (MNDWI > NDVI or MNDWI > EVI) and (EVI < 0.1) for surface water body extraction in the United States. Building upon Zou et al.’s study [20], Deng et al. [23] proposed a multiple index water detection rule (MIWDR) suitable for surface water extraction in the Yangtze River Basin. Liu et al. [9] utilized the AWEI, MNDWI, NDVI, and EVI to establish logical combinations of multiple indices for rapid extraction of water bodies in the Yellow River Basin. The mixed index rule method offers fast computation and high efficiency in complex terrain areas. However, there remains a scarcity of comprehensive water detection rules applicable at such a scale presently, necessitating further research.
To address the aforementioned issues, this paper proposes a novel method called the multiple threshold water detection rule (MTWDR) for surface water extraction in complex terrain areas. The sub-objects of this study are as follows: (1) water index and brightness index in the cap transform were calculated using Sentinel-2 data; (2) the Otsu algorithm was utilized to determine optimal segmentation thresholds for distinguishing water/non-water within each index; (3) development of a robust water bodies extraction rule using the calculated indices and their respective optimal thresholds to facilitate efficient surface water extraction.
The remaining sections of the paper are structured as follows: Section 2 provides an introduction to the materials and methods used in the research, including a detailed description of the research area, data sources, and methodologies. Section 3 presents the results of the surface water bodies extraction within the research area. Section 4 and Section 5 respectively offer in-depth discussions and conclusive remarks.
2. Materials and Methods
2.1. Study Area
The Yunnan–Guizhou Plateau, located in southwest China, is one of the four major plateaus in the country. With an average altitude exceeding 1000 m, this region exhibits diverse geomorphic features including mountains, plateaus, hills, basins, and canyons. The complex background landforms are accompanied by snow cover in the high-altitude northwest area. Due to variations in topography and atmospheric circulation conditions, the climate displays significant spatial variability within this region. Abundant water resources are found here as numerous rivers traverse through it. Notably, its water energy resource reserves rank among the highest in China. Additionally, there are 60 lakes covering an area of over 1 km2 with a total area of 1199.4 km2; these lakes account for approximately 1.3% of China’s total lake area. Characterized by karst terrain shaped by rivers such as the Jinsha River and Yuanjiang River cutting through it, the landscape appears relatively fragmented overall—a typical feature of this plateau region. Accurately assessing surface water extraction holds profound significance for both expediting development on the Yunnan–Guizhou Plateau and maintaining regional ecosystem stability [24,25]. The extent of the study area is presented in Figure 1.
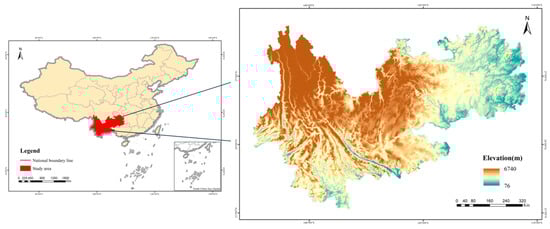
Figure 1.
Study area schematic.
2.2. Data
2.2.1. Sentinel-2
The Sentinel-2 satellite constellation, jointly developed by the European Space Agency (ESA) and the European Commission, consists of two satellites, namely 2A and 2B. These satellites provide high-resolution multi-spectral remote sensing data for comprehensive global coverage. With a re-visit cycle of five days, this satellite constellation is extensively utilized in surface change monitoring, environmental assessment, and natural resource management domains. Equipped with the multispectral imaging instrument MSI, Sentinel-2 captures imagery across 13 spectral bands encompassing visible light, near-infrared, and short-wave infrared regions. These images possess an image bandwidth of 290 km and exhibit spatial resolutions ranging from 10 m to 60 m. Table 1 presents the band parameters for Sentinel-2 data.

Table 1.
Main band parameters of Sentinel-2 data.
2.2.2. DEM
The elevation data set utilized in this study was SRTM-DEM, which has a spatial resolution of 30 m and can be accessed through the Earth Explorer user interface provided by the USGS open access hub at https://search.asf.alaska.edu (accessed on 7 February 2024).
2.3. Methods
Considerable spectral similarities exist between surface water and non-water objects, making it challenging to distinguish high-reflectance non-water objects such as snow-covered areas in mountain regions and brightly colored buildings in urban areas from water bodies. This study conducted experiments to enhance the identification of water information and make non-water information more discernible. Figure 2 illustrates the proposed process for extracting surface water in complex terrain areas, which involves data preprocessing, rule construction, threshold segmentation, water extraction, and evaluation of mapping accuracy. The Sentinel-2 data went through some necessary preprocessing steps such as atmospheric correction, radiation calibration, and geometric correction, all of which were carried out using the GEE platform. After that, we chose nine representative ground objects based on their regional characteristics to establish some prior knowledge. Then, we used the multi-band reflectance characteristics of these ground objects tofeatures construct water index. To eliminate interference from highly reflective ground objects like snow, bright material buildings, and clouds, we integrated brightness features. We used the Otsu algorithm to determine the optimal segmentation threshold for distinguishing water bodies from non-water bodies, which helped us obtain accurate classification results for the entire region’s water bodies. Finally, quantitative accuracy evaluation indices (overall accuracy and Kappa coefficient) were used to assess the performance of surface water classification.
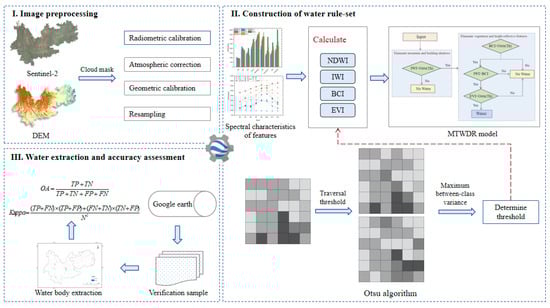
Figure 2.
Conceptual workflow of the proposed method.
2.3.1. Image Preprocessing
This study utilized remote sensing data from Sentinel-2 L2A products acquired between March and April 2022, which underwent atmospheric correction using the Sen2Cor processor of the Sen2Cor processor. This processor is designed specifically for the Sentinel-2 environment and effectively deals with the atmospheric effects present in the Sentinel-2 1C top-of-atmosphere (TOA) product. Ultimately, it generates a Class 2A bottom-of-atmosphere (BOA) reflectance product. This paper presents various preprocessing techniques for remote sensing images including resampling and cloud removal.
2.3.2. Construction of Water Rule-Set
- Analysis of the spectral characterization
The extraction of water bodies in different scenes is influenced by various interference factors. In urban areas, the accuracy of water body extraction is affected by building shadows and asphalt roads, while in mountainous areas, it is influenced by mountain shadows, vegetation, clouds, and snow. Leveraging the disparity in reflectance values across different bands of the target ground object can enhance its brightness value while suppressing that of the background object. It is imperative to assess the characteristics of each scene based on prior knowledge and subsequently select appropriate rules for water body extraction.
According to regional characteristics, representative water bodies including clear water (CW), sediment water (SW), and polluted water (PW) were selected, along with typical background ground objects such as road, building, bare soil (BS), vegetation, mountain shadow (MS), and cropland. Spectral curves were obtained from 150 sample points for each water body and background ground object. The selected typical ground objects are illustrated in Figure 3. As depicted in Figure 4, within the visible light band, the reflectivity of all three types of water bodies is higher in the green band compared to the blue and red bands. However, this reflectivity pattern is also observed in vegetation within the visible light band; thus, distinguishing water bodies solely based on visible light becomes impractical. In terms of discrimination degree from other ground objects, water bodies do not exhibit significant differences in the red band. Moving from near-infrared to short-wavelength infrared bands reveals a gradual decrease in reflectivity for water bodies relative to other ground objects. Ultimately, the minimum reflectivity value for water bodies is reached within the short-wavelength infrared band.
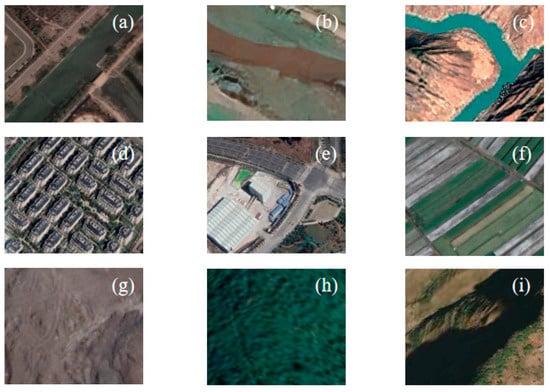
Figure 3.
Schematic diagram of typical features. (a) Polluted water. (b) Sediment water. (c) Clear water. (d) Building. (e) Road. (f) Cropland. (g) Bare soil. (h) Vegetation. (i) Mountain shadow.
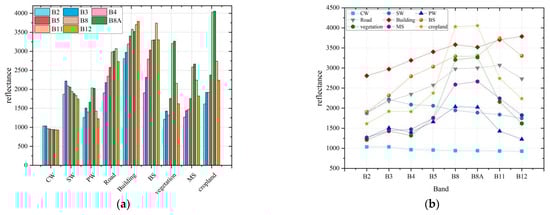
Figure 4.
Spectral curve of average reflectance of each surface feature. (a) Bar chart. (b) Line chart.
- 2.
- Construction of water rule-set
The study area exhibits a complex and diverse background, making it challenging to effectively suppress non-water body information and achieve high-precision water body extraction using a single water index. As depicted in Figure 4, the B3 band demonstrates the highest reflectivity for water bodies while the B12 band exhibits the lowest reflectivity, resulting in B3–B12 > 0. Conversely, other ground objects such as mountain shadows, bare soil, and buildings exhibit lower reflectivity compared to the B12 band (i.e., B3–B12 < 0). Consequently, utilizing B3–B12 can significantly enhance differentiation between water bodies and other ground objects during water body identification. Given the complexity of terrain within this large mountainous region, the NDWI is employed to extract water bodies by accentuating their dissimilarity from vegetation. Thus, an initial water index (IWI) is constructed based on the NDWI to substantially increase differentiation between water and non-water information while ensuring comprehensive extraction of all relevant areas. However, similar challenges persist with the IWI as with other indices since they are prone to misclassifying snow-covered areas or bright building materials as part of the water body due to interference factors. To address these issues effectively by mitigating interference from highly reflective ground objects like snow or bright material buildings along with clouds, brightness characteristics are derived from bands B5 and B8 leading to the Brightness Characteristic Index (BCI).
Therefore, the process of rule construction is illustrated in Figure 5. Firstly, water bodies are primarily identified using the IWI to mitigate the influence of mountain and building shadows. Subsequently, the BCI is employed to eliminate the impact of highly reflective ground objects such as snow and ice, bright material buildings, and clouds.
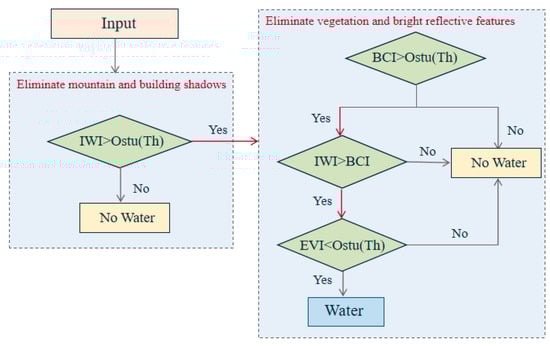
Figure 5.
Classification rule-set for Sentinel 2 surface water mapping. Th is the threshold value automatically calculated by the Otsu algorithm.
In the above Equations (1)–(3), is the reflectance, , , , , is the corresponding band of Sentinel-2, and L is the soil conditioning parameter.
- 3.
- A Method of Automatic Threshold Determination
The Otsu method, proposed by Japanese scholar Nobuyuki Otsu, is an adaptive threshold segmentation technique based on probability statistics. It utilizes the image histogram to determine the threshold criterion by maximizing inter-class variance and effectively distinguishes objects from backgrounds. This algorithm has gained significant popularity as an efficient and widely used image binarization approach [26]. Assuming the current gray level is T, the inter-class variance can be calculated using the following formula.
In the above equations, i is the number of gray levels, Pi is the probability of occurrence of gray level i, and are the ratio of the number of pixels of the background and the foreground portions to the total number of pixels, and and are the average gray values of the background and the foreground portions.
The Otsu algorithm is employed in this study to calculate the thresholds of IWI, BCI, and EVI individually. Subsequently, the water body is segmented based on the optimal threshold value, followed by superimposing the segmented water body images to obtain the final classification results.
2.3.3. Accuracy Assessment Method
The confusion matrix is a comparative matrix that quantifies the number of pixels belonging to each category and the number of pixels accurately classified in the ground truth test [27,28]. The accuracy of surface water extraction results was assessed in this study through the establishment of a confusion matrix, calculation of overall accuracy (OA), and determination of the Kappa coefficient. Additionally, widely used water index and extraction rules (Table 2) that have demonstrated superior water identification capabilities in recent years were selected for comparison with the method proposed in this paper.
Table 2.
Commonly used water indexes and rules.
In the above equations, TP is the number of correct positive samples, TN is the number of correct negative samples, FN is the number of missed detections for positive samples, FP is the number of false detections for negative samples, and N is the total number of samples.
3. Results
3.1. Accuracy Assessment
In order to facilitate a more comprehensive comparison of the extraction effects achieved by different methods, accuracy calculations were conducted in this study, and the results are presented in Table 3 and Figure 6. Amongst the various methods evaluated, the MTWDR exhibited the highest classification accuracy in mountainous areas, achieving an overall accuracy of 94.08% and a Kappa coefficient of 0.8831. The NDWI demonstrated an overall classification accuracy of 91.26% with a Kappa coefficient of 0.8528, while the MIWDR yielded an overall classification accuracy of 90.25% with a Kappa coefficient of 0.8402. The MNDWI and WDR followed closely behind with respective overall classification accuracies of 88.75% (Kappa coefficient: 0.8206) and 87.41% (Kappa coefficient: 0.8024). Conversely, WI2015 displayed the lowest classification accuracy among all indices assessed, recording an overall classification accuracy of only 84.59%, accompanied by a Kappa coefficient value of merely 0.7754.
Table 3.
Accuracy calculations for indexes and rules.
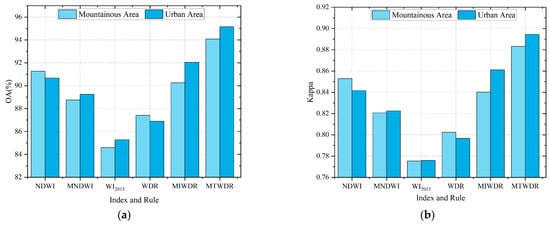
Figure 6.
Accuracy analysis for six indexes and rules. (a) Overall accuracy. (b) Kappa coefficients.
The proposed MTWDR method achieves the highest classification accuracy in urban areas, demonstrating an overall accuracy of 95.15% and a Kappa coefficient of 0.8945. The MIWDR approach demonstrates an overall classification accuracy of 92.04%, accompanied by a Kappa coefficient of 0.8611. Similarly, the NDWI attains an overall classification accuracy of 90.68% with a corresponding Kappa coefficient of 0.8415. Subsequently, consider the MNDWI and WDR methods; the MNDWI yields an overall classification accuracy of 89.25% along with a Kappa coefficient value of 0.8224, while the WDR achieves slightly lower results with an overall classification accuracy rate of 86.89% and a Kappa coefficient value of 0.7966, respectively. The index WI2015 exhibits the lowest performance in terms of classification accuracy among all methods evaluated in this study, recording an overall classification accuracy rate as low as 85.28%. Furthermore, its associated Kappa coefficient is calculated to be merely at the level of approximately 0.7758.
3.2. Water Extraction Results
In this chapter, the proposed method is compared with the extraction results of five commonly used water indexes and rules, and the extraction results are presented in Figure 7. Overall, the MNDWI, NDWI, WI2015, WDR, and MIWDR demonstrate higher completeness in extraction. However, due to the similarity between snow and water reflectivity, they are all influenced by the presence of snow-covered areas in the northwest region of the study area to some extent, resulting in the misclassification of snow as water bodies. Among them, the MNDWI, WI2015, and WDR exhibit more errors followed by the NDWI and MIWDR. The MTWDR overcomes the influence of highly reflective ground objects covered by snow while ensuring integrity in extraction results. In terms of details, the NDWI provides more complete extraction results but tends to mistake shadows and buildings as water bodies. The MNDWI effectively suppresses interference from building noise but may overlook small water bodies. WI2015 shows better recognition for small water bodies but is affected by building shadow interference leading to increased false classifications in urban areas with inaccurate identification of water body boundaries. The WDR is not affected by shadows or dark material ground objects but can be influenced by highly reflective urban buildings. The MIWDR effectively mitigates interference from mountain and building shadows. However, it faces challenges in accurately identifying water bodies in complex terrain areas, which makes it difficult to delineate their boundaries. In comparison, the proposed MTWDR effectively addresses issues related to building shadows and mountain shadows during water body extraction. It accurately captures slender water bodies along their boundaries and overcomes interferences caused by snow coverings and high-reflective materials present on urban structures. This enhances overall performance for large-scale complex terrain areas.
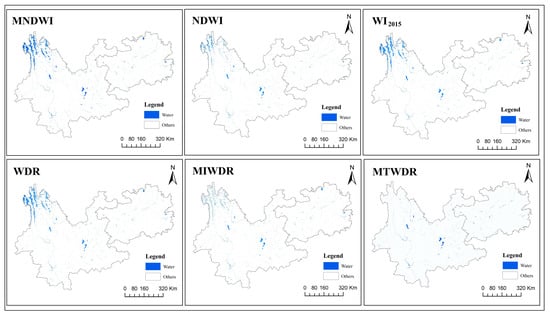
Figure 7.
Comparison of water extraction results for indexes and rules.
In the same methodology, variations in water body extraction accuracy across different regions are observed, with distinct influencing factors. To validate the universality and stability of our proposed method, we selected mountainous and urban regions for local comparison. Figure 8 illustrates the spatial distribution of the chosen comparison regions (a–f) within the research area.
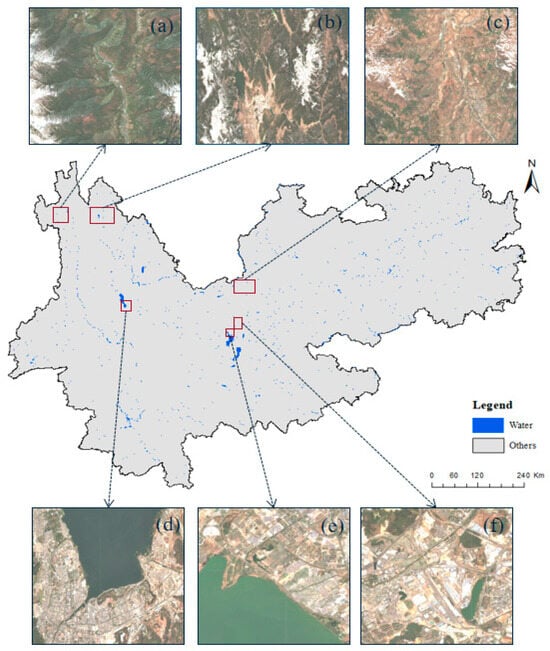
Figure 8.
The spatial locations of each selected region, which were utilized for comparing the surface water extraction results among different regions in the Yunnan-Guizhou Plateau, are also depicted in the inset of the entire study area, corresponding to Figure 9 and Figure 10 below. (a–c) Mountainous area; (d–f) Urban area.
3.2.1. Water Extraction Results in Mountainous Area
The mountainous region is complex and has various areas of shade. When extracting water in this area, many factors like mountain shadows, vegetation, clouds, and snow can affect the accuracy of the results. Figure 7 and Figure 8 illustrates that many high-reflectivity objects like clouds and snow are mistakenly classified as water bodies. Therefore, in the figure, (a–c) mainly focus on the snow-covered area in the northwest region of the study area. Figure 9 shows the results of water extraction using six different methods in the mountainous region. It is observed from this figure that NDWI extraction gives more comprehensive results and can identify small-scale water bodies. However, it can still be affected by shadows, clouds, snow, and other ground objects. The MNDWI can effectively reduce the interference caused by shadows, but it may wrongly classify high-reflectivity objects like clouds and snow during extraction [14,15]. WI2015 can successfully extract slender rivers while preserving their integrity, but it has limitations in water extraction outcomes due to cloud cover and shadowing from snow. The WDR can efficiently extract rivers, but it may struggle with misclassification due to bridges and cloud cover and shadowing from snow. The MIWDR method can partially mitigate the interference caused by mountain shadows, resulting in a more comprehensive water extraction. However, it still encounters challenges with cloud and snow shadows, leading to misclassification issues [20,23]. In comparison, the proposed MTWDR method exhibits superior performance in extracting water bodies accurately while effectively overcoming interferences from highly reflective surfaces like clouds and snow. It eliminates misclassification problems and significantly enhances the extraction efficiency of mountain water bodies.
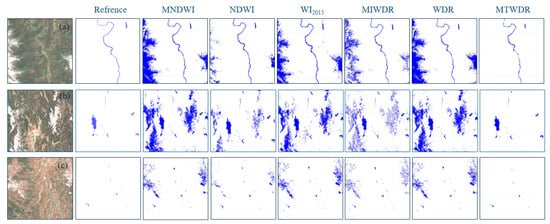
Figure 9.
Comparison of water extraction in mountainous area across indexes and rules.
3.2.2. Water Extraction Results in Urban Area
The extraction of water in urban areas is a challenging task as the ground objects in these areas are complex and often interfere with the extraction process. In Figure 10, you can see the results of six different methods for water extraction in urban areas, with (d–f) showing selected portions of the urban area. As seen in the figure, the effectiveness of water extraction in urban areas is mainly affected by buildings made of different materials. Among the six methods, WI2015 is good at recognizing small water bodies but is impeded by building shadow information, resulting in more false classifications and inaccurate delineation of water body boundaries within urban areas. The MNDWI can effectively suppress interference from building noise, but it may overlook small water bodies due to slight shadow information interference. The NDWI yields relatively comprehensive extraction results, but it can mistakenly identify shadows, bright material buildings, and other objects as water bodies. The MIWDR can successfully mitigate the influence of shadows and dark buildings within cities, but it fails to accurately extract small water bodies. The WDR remains unaffected by shadows and dark ground objects, but it is prone to be influenced by high-reflectance material buildings found in urban environments, while easily disregarding slender water bodies during extraction. The proposed MTWDR method demonstrates superior performance for extracting water bodies as it effectively inhibits interference from bright material buildings while reducing false identifications within urban areas and enhancing the overall accuracy of urban water extraction.
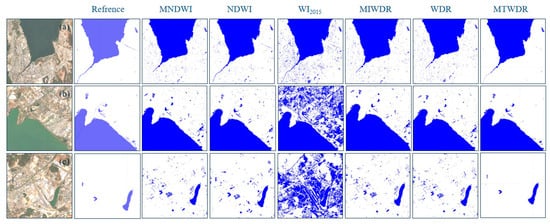
Figure 10.
Comparison of water extraction in urban areas across indexes and rules.
4. Discussion
4.1. Cross-Comparison with External Surface Water Datasets
In order to enhance the analysis of the MTWDR method’s effectiveness in extracting water bodies, this study selected four remote sensing data products related to surface water types for comparison of extraction results, as illustrated in Figure 11. These include: (1) the JRC global surface water dataset, which utilizes Landsat5, Landsat7, and Landsat8 satellite images from 1984 to 2022 to generate a comprehensive set of 30 m resolution global surface water coverage maps that depict the spatial and temporal distribution of surface water over the past three decades. (2) The China lake dataset (CLD), derived from Landsat images and topographic maps, employs semi-automatic extraction methods along with manual visual inspection and editing techniques to identify lakes larger than 1 km2 within China between 1960 and 2020. This dataset provides detailed analysis on changes in the number and area of Chinese lakes over the past six decades [30]. (3) China’s surface water, large dams, reservoirs, and lakes dataset (China-LDRL), released in 2022, encompasses geographic information on 2194 reservoirs and dams with a minimum area exceeding 1 km2 across China [31]. (4) The China water cover map (CWaC), published in 2020 through an automatic classification approach based on shape index and submerged frequency using time series Sentinel-1/2 imagery; it presents a nationwide depiction of water cover for the year 2020 [32].
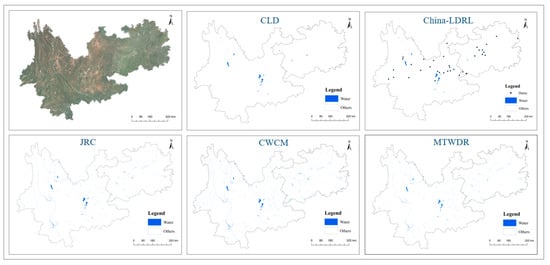
Figure 11.
Schematic diagram of the results of different data products.
Due to the variations in water bodies among different datasets, CLD represents a lake dataset, China-LDRL includes both lakes and reservoirs, while JRC and CWaC are multi-type water datasets. Moreover, each dataset has different time ranges, and large water bodies generally exhibit better extraction results as they intersect with multiple datasets. To validate the effectiveness of the proposed method for large-scale water bodies, the lake extraction results from each product and method in 2020 (Figure 12) should be compared. Overall, all datasets demonstrate satisfactory extraction results for large lakes by preserving the flexibility and continuity of their boundaries. However, there are some differences in extracting Xingyun Lake and Yilong Lake. Specifically, small gaps occur in the lake area of CLD and China-LDRL when extracting Xingyun Lake due to potential deviations caused by suspended solids within the lake. In contrast, JRC, CWaC, and our proposed method do not encounter such issues. Additionally, although minor discrepancies exist when extracting Yilong Lake at a detailed level, they do not significantly affect the overall performance of lake extraction.
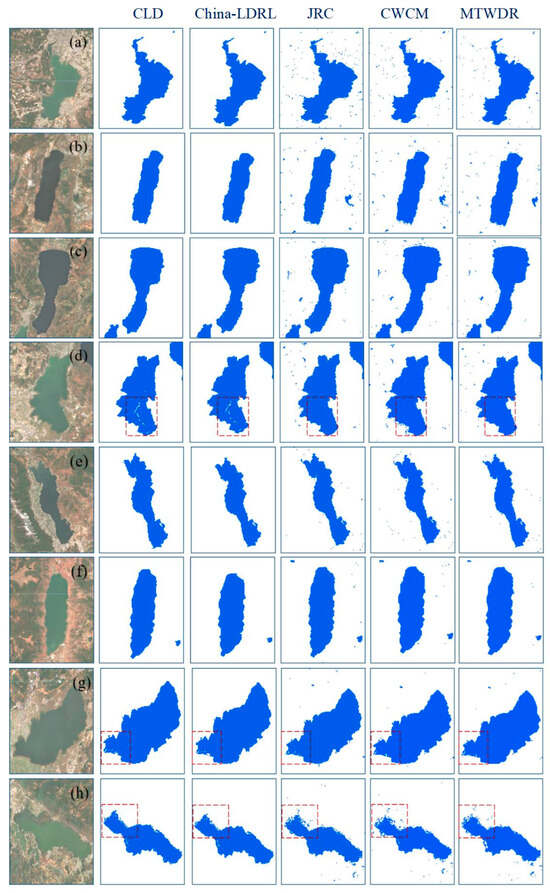
Figure 12.
Comparison map of selected lakes. (a) Dianchi. (b) Yangzonghai. (c) Fuxianhu. (d) Xingyunhu. (e) Erhai. (f) Chenghai. (g) Qiluhu. (h) Yilonghu. Where the red boxes indicate areas with significant differences in extraction.
4.2. Comparison of Results from Different Types of Water Bodies
Different types of water bodies exhibit varying extraction accuracy and are influenced by distinct factors using the same method. To ensure the universality and stability of the method proposed in this paper, diverse water body types were selected for local comparison. Consequently, different data products corresponding to the same year and region were chosen based on control variables to compare extraction results, ensuring the scientific validity of the comparative experiment. Due to limited coverage of artificial water body ditches in our study area and a lack of research on their extraction, detailed comparative analysis was conducted with existing datasets focusing on rivers, lakes, reservoirs, ponds, and paddy fields. Figure 13 illustrates the spatial distribution of selected comparison areas (a–j) within our study area.
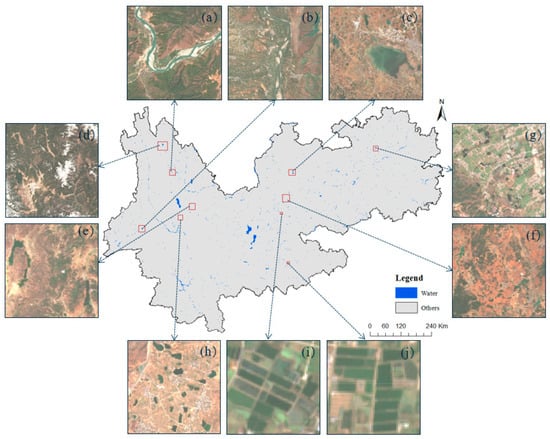
Figure 13.
The spatial locations of each selected area for comparing different types of surface water bodies in the Yunnan-Guizhou Plateau are also indicated on the inset map illustrating the entire study area, corresponding to Figure 14, Figure 15, Figure 16, Figure 17 and Figure 18 below. (a,b) Rivers; (c,d) Lakes; (e,f) Reservoirs; (g,h) Ponds; (i,j) Paddy Fields.
4.2.1. Rivers
The latest version (V1.4) of the JRC Monthly Water Recurrence global surface water dataset was selected for comparative analysis with the method proposed in this paper, regarding river extraction. As depicted in Figure 14, both JRC and MTWDR algorithms demonstrated a more comprehensive approach to extract rivers; however, within the red dotted box area, JRC maintained consistency in river extraction but failed to overcome interferences such as bridges and some sand and soil areas that were misclassified as water bodies. In contrast, the method presented in this paper accurately eliminates bridge interferences as well as sand and soil areas, resulting in a more precise depiction of river extraction details.
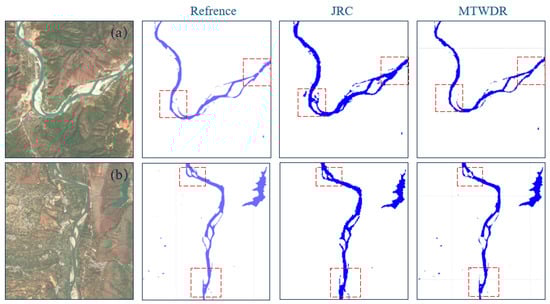
Figure 14.
Comparison of rivers extraction results across JRC. Where the red boxes indicate areas with significant differences in extraction.
4.2.2. Lakes
For the lake component, CLD [30] was chosen as a point of comparison with the method presented in this paper. As depicted by the red dotted boxes in Figure 15, both CLD and our proposed method exhibited varying degrees of incompleteness and inaccuracy when it came to delineating lake boundaries; however, comparatively speaking, CLD missed more boundary details than our approach did. From a macro perspective, while CLD failed to extract smaller lakes altogether, our method succeeded in doing so and produced more comprehensive extraction results.
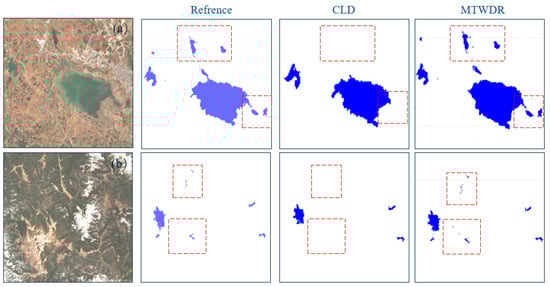
Figure 15.
Comparison of lakes extraction results across CLD. Where the red boxes indicate areas with significant differences in extraction.
4.2.3. Reservoirs
The China-LDRL [31] method was chosen for comparative analysis of the reservoir section. As depicted in Figure 16, the China-LDRL approach exhibited numerous omissions and failed to extract the reservoir within the red dotted box. In contrast, our proposed method yielded extraction results that closely resembled those obtained through manual vectorization, enabling a more comprehensive identification of reservoirs in the study area with enhanced accuracy.
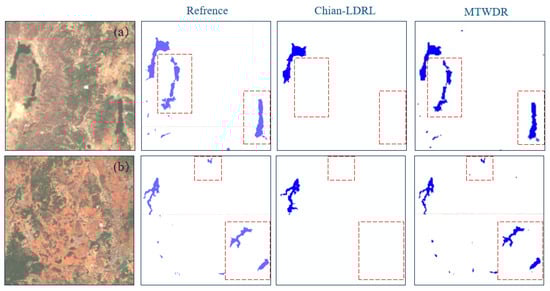
Figure 16.
Comparison of reservoirs extraction results across China-LDRL. Where the red boxes indicate areas with significant differences in extraction.
4.2.4. Ponds
For the pond analysis, CWaC [32] was chosen as a comparative method to the approach presented in this paper. As depicted by the red dotted box in Figure 17, CWaC failed to detect smaller ponds resulting in mixed water and land at pond edges with unclear boundaries between ponds. While our proposed method may not be comprehensive enough for all ponds, it successfully identifies small-area ponds with clear boundaries between water and land without any misclassification.
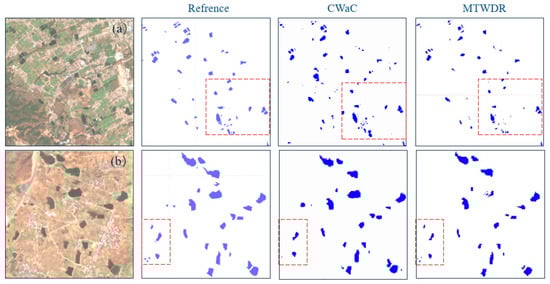
Figure 17.
Comparison of ponds extraction results across CWaC. Where the red boxes indicate areas with significant differences in extraction.
4.2.5. Paddy Fields
The comparative analysis of the paddy field was conducted with CWaC [32] for reference. As depicted in the red dotted box in Figure 18, the rice extraction results obtained by CWaC exhibited fragmentation, blurred boundaries of the paddy field, and misclassification of certain dry land areas as water bodies. In contrast, our proposed method displayed omission by failing to identify small-scale paddy fields; however, it yielded extraction results with clearer boundaries and zero instances of misclassification.
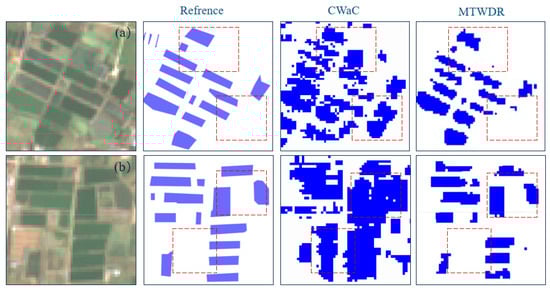
Figure 18.
Comparison of paddy fields extraction results across CWaC. Where the red boxes indicate areas with significant differences in extraction.
4.3. Limitations and Future Work
In this study, we focus on the surface water bodies of the Yunnan–Guizhou Plateau as our research subject. As mentioned earlier, the MTWDR has demonstrated superior performance in extracting water bodies. There are three reasons why the MTWDR is more effective in extracting water bodies of different regions and types: Firstly, by considering the unique spectral characteristics of Sentinel-2 and analyzing the spectral response mechanism, incorporating prior knowledge based on the specific features of our research area to enhance discrimination between water bodies and background ground objects. Secondly, we employ an Otsu algorithm for automatic recognition of segmentation thresholds and calculate optimal thresholds to accurately separate water bodies from non-water areas. Lastly, by integrating brightness features into our extraction rules, we mitigate interference from large-area high-reflectivity ground objects and achieve more precise results in identifying water bodies. However, it is important to acknowledge that this method still possesses certain limitations which warrant further discussion.
Firstly, the suppression of shadows and bright reflectivity from ground objects inevitably leads to the neglect of extraction for certain small water bodies that exhibit similar spectra to interfering ground objects, resulting in the loss of fine details pertaining to water body information. This subsequently affects both the accuracy and integrity of the extraction process. Secondly, due to Sentinel-2’s spatial resolution being limited to 10 m, it becomes challenging to identify small water bodies situated along narrow river coasts, particularly those encompassing small paddy fields and pond areas where pixel loss is more likely. Consequently, accurately distinguishing between ground objects and water bodies exhibiting comparable spectral characteristics while retaining comprehensive data on water bodies information emerges as a crucial research focus.
5. Conclusions
A new method for extracting water from large complex terrain areas has been proposed in this study. The method called the MTWDR aims to achieve high-precision extraction of surface water in complex terrain areas. The methodological strength of the study is its ability to eliminate interference from highly reflective ground objects (such as snow, bright material buildings, and clouds) by integrating brightness features and the Otsu algorithm. To achieve this, the method leverages prior knowledge to assess regional characteristics and utilizes the multi-band reflectance properties of ground objects. As a result, it significantly improves the mapping accuracy of surface water in complex terrain areas. The study used Sentinel-2 data and the GEE platform for extracting surface water on the Yunnan–Guizhou. The conclusions are as follows: (1) The proposed method demonstrates high accuracy in mountainous areas and urban regions, with an overall accuracy of 94.08% and 95.15%, respectively, along with Kappa coefficients of 0.8831 and 0.8945. Compared to five widely used water indexes and rules currently employed, our approach achieves an improvement in accuracy exceeding 3%. (2) The fusion of the MTWDR and the Otsu algorithm is an effective approach for extracting various water types, which effectively mitigates the interference caused by high-reflectivity surface features such as cloud and snow shadows in mountainous areas, as well as bright material buildings in urban regions. Moreover, this method preserves the integrity of regular water boundaries and enables slender water body extraction.
The results demonstrate the efficacy of the proposed method in extracting surface water bodies within complex terrain areas of the Yunnan–Guizhou Plateau, exhibiting strong robustness and suitability for large-scale remote sensing mapping of surface water. In the future, the MTWDR method can be applied for large-scale, high-precision, and long-term water dynamic monitoring.
Author Contributions
Conceptualization, X.Y. and L.H.; methodology, X.Y.; software, X.Y.; validation, X.Y.; formal analysis, X.Y.; investigation, X.Y.; resources, X.Y.; data curation, X.Y.; writing—original draft preparation, X.Y.; writing—review and editing, X.Y.; visualization, X.Y. and L.H.; supervision, L.H.; project administration, X.Y. and L.H.; funding acquisition, X.Y. and L.H. All authors have read and agreed to the published version of the manuscript.
Funding
This study was funded by the National Natural Science Foundation of China (No: 42171392); Major Scientific and Technological Projects of Yunnan Province (No: 202202AD080010); Yunnan Province Basic Research Special Key Project (No. 202001AS070032); Yunnan Normal University Graduate Student Research Innovation Fund (Grant No. YJSJJ23-B139).
Data Availability Statement
The Sentinel-2 (Sentinel-2 MSI in Earth Engine Data Catalog. Available online: https://developers.google.com/earth-engine/datasets/catalog/COPERNICUS_S2 (accessed on 7 February 2024)) satellite images were collected from the Google Earth Engine cloud computing platform and are freely available for all interested users. The DEM is openly available in the USGS open access hub at https://search.asf.alaska.edu (accessed on 7 February 2024).
Conflicts of Interest
The authors declare no conflicts of interest.
References
- Wang, X.X.; Xiao, X.M.; Zou, Z.H.; Dong, J.; Qin, Y.; Doughty, R.B.; Menarguez, M.A.; Chen, B.; Wang, J.; Ye, H.; et al. Gainers and losers of surface and terrestrial water resources in China during 1989–2016. Nat. Commun. 2020, 11, 3471. [Google Scholar] [CrossRef]
- Zhang, Y.; Li, C.; Chiew, F.H.S.; Post, D.A.; Zhang, X.; Ma, N.; Tian, J.; Kong, D.; Leung, L.R.; Yu, Q.; et al. Southern Hemisphere dominates recent decline in global water availability. Science 2023, 382, 579–584. [Google Scholar] [CrossRef]
- Cole, J.J.; Prairie, Y.T.; Caraco, N.F.; McDowell, W.H.; Tranvik, L.J.; Striegl, R.G.; Duarte, C.M.; Kortelainen, P.; Downing, J.A.; Middelburg, J.J.; et al. Plumbing the global carbon cycle: Integrating inland waters into the terrestrial carbon budget. Ecosystems 2007, 10, 172–185. [Google Scholar] [CrossRef]
- Carroll, M.L.; Townshend, J.R.; DiMiceli, C.M.; Noojipady, P.; Sohlberg, R.A. A new global raster water mask at 250 m resolution. Int. J. Digit. Earth 2009, 2, 291–308. [Google Scholar] [CrossRef]
- Wang, C.; Jia, M.; Chen, N.; Wang, W. Long-term surface water dynamics analysis based on Landsat imagery and the Google Earth Engine platform: A case study in the middle Yangtze River Basin. Remote Sens. 2018, 10, 1635. [Google Scholar] [CrossRef]
- Jiang, W.; He, G.; Pang, Z.; Guo, H.; Long, T.; Ni, Y. Surface water map of China for 2015 (SWMC-2015) derived from Landsat 8 satellite imagery. Remote Sens. Lett. 2020, 11, 265–273. [Google Scholar] [CrossRef]
- Jiang, W.; Ni, Y.; Pang, Z.; Li, X.; Ju, H.; He, G.; Lv, J.; Yang, K.; Fu, J.; Qin, X. An effective water body extraction method with new water index for Sentinel-2 imagery. Water 2021, 13, 1647. [Google Scholar] [CrossRef]
- Zhang, Y.C.S.; Du, J.Q.; Guo, L.; Fang, S.; Zhang, J.; Sun, B.; Mao, J.; Sheng, Z.; Li, L. Long-term detection and spatiotemporal variation analysis of open-surface water bodies in the Yellow River Basin from 1986 to 2020. Sci. Total Environ. 2022, 845, 157152. [Google Scholar] [CrossRef]
- Liu, Y.; Gao, Y. Surface water extraction in Yangtze River Basin based on sentinel time series image. Natl. Remote Sens. Bull. 2022, 26, 358–372. [Google Scholar] [CrossRef]
- Sun, J.Y.; Wang, G.Z.; He, G.J.; Pu, D.C.; Jiang, W.; Li, T.T.; Niu, X.F. Study on the water body extraction using GF-1 data based on adaboost integrated learning algorithm. The International Archives of the Photogrammetry. Remote Sens. Spat. Inf. Sci. 2020, 42, 641–648. [Google Scholar]
- Deng, Y.; Jiang, W.; Tang, Z.; Li, J.; Lv, J.; Chen, Z.; Jia, K. Spatio-temporal change of lake water extent in Wuhan urban agglomeration based on Landsat images from 1987 to 2015. Remote Sens. 2017, 9, 270. [Google Scholar] [CrossRef]
- Sun, X.; Li, L.; Zhang, B.; Chen, D.; Gao, L. Soft urban water cover extraction using mixed training samples and support vector machines. Int. J. Remote Sens. 2015, 36, 3331–3344. [Google Scholar] [CrossRef]
- Luo, X.; Tong, X.; Hu, Z. An applicable and automatic method for earth surface water mapping based on multispectral images. Int. J. Appl. Earth Obs. Geoinf. 2021, 103, 102472. [Google Scholar] [CrossRef]
- McFeeters, S.K. The use of the Normalized Difference Water Index (NDWI) in the delineation of open water features. Int. J. Remote Sens. 1996, 17, 1425–1432. [Google Scholar] [CrossRef]
- Xu, H. Modification of normalised difference water index (NDWI) to enhance open water features in remotely sensed imagery. Int. J. Remote Sens. 2006, 27, 3025–3033. [Google Scholar] [CrossRef]
- Feyisa, G.L.; Meilby, H.; Fensholt, R.; Proud, S.R. Automated Water Extraction Index: A new technique for surface water mapping using Landsat imagery. Remote Sens. Environ. 2014, 140, 23–35. [Google Scholar] [CrossRef]
- Li, L.; Su, H.; Du, Q.; Wu, T. A novel surface water index using local background information for long term and large-scale Landsat images. ISPRS J. Photogramm. Remote Sens. 2021, 172, 59–78. [Google Scholar] [CrossRef]
- Tulbure, M.G.; Broich, M.; Stehman, S.V.; Kommareddy, A. Surface water extent dynamics from three decades of seasonally continuous Landsat time series at subcontinental scale in a semi-arid region. Remote Sens. Environ. 2016, 178, 142–157. [Google Scholar] [CrossRef]
- Liu, H.; Shi, Y.; Chang, Q.; Guluzade, R.; Pan, X.; Xu, N.; Hu, P.; Kong, X.; Yang, Y. A New Extraction Method of Surface Water Based on Dense Time-Sequence Images. IEEE J. Sel. Top. Appl. Earth Obs. Remote Sens. 2024, 17, 3151–3166. [Google Scholar] [CrossRef]
- Zou, Z.; Xiao, X.; Dong, J.; Qin, Y.; Doughty, R.B.; Menarguez, M.A.; Zhang, G.; Wang, J. Divergent trends of open-surface water body area in the contiguous United States from 1984 to 2016. Proc. Natl. Acad. Sci. USA 2018, 115, 3810–3815. [Google Scholar] [CrossRef]
- Tucker, C.J. Red and photographic infrared linear combinations for monitoring vegetation. Remote Sens. Environ. 1979, 8, 127–150. [Google Scholar] [CrossRef]
- Huete, A.; Didan, K.; Miura, T.; Rodriguez, E.P.; Gao, X.; Ferreira, L.G. Overview of the radiometric and biophysical performance of the MODIS vegetation indices. Remote Sens. Environ. 2002, 83, 195–213. [Google Scholar] [CrossRef]
- Deng, Y.; Jiang, W.; Tang, Z.; Ling, Z.; Wu, Z. Long-term changes of open-surface water bodies in the Yangtze River basin based on the Google Earth Engine cloud platform. Remote Sens. 2019, 11, 2213. [Google Scholar] [CrossRef]
- Zhang, K.; Luo, J.; Peng, J.; Zhang, H.; Ji, Y.; Wang, H. Analysis of Extreme Temperature Variations on the Yunnan-Guizhou Plateau in Southwestern China over the Past 60 Years. Sustainability 2022, 14, 8291. [Google Scholar] [CrossRef]
- Lu, H.; Ding, L.; Ma, Z.; Li, H.; Lu, T.; Su, M.; Xu, J. Spatiotemporal assessments on the satellite-based precipitation products from Fengyun and GPM over the Yunnan-Kweichow Plateau, China. Earth Space Sci. 2020, 7, e2019EA000857. [Google Scholar] [CrossRef]
- Otsu, N. A threshold selection method from gray-level histograms. IEEE Trans. Syst. Man Cybern. 1979, 9, 62–66. [Google Scholar] [CrossRef]
- Aziz, G.; Minallah, N.; Saeed, A.; Frnda, J.; Khan, W. Remote sensing based forest cover classification using machine learning. Sci. Rep. 2024, 14, 69. [Google Scholar] [CrossRef]
- Lekka, C.; Petropoulos, G.P.; Detsikas, S.E. Appraisal of EnMAP hyperspectral imagery use in LULC mapping when combined with machine learning pixel-based classifiers. Environ. Model. Softw. 2024, 173, 105956. [Google Scholar] [CrossRef]
- Fisher, A.; Flood, N.; Danaher, T. Comparing Landsat water index methods for automated water classification in eastern Australia. Remote Sens. Environ. 2016, 175, 167–182. [Google Scholar] [CrossRef]
- Zhang, G.; Yao, T.; Chen, W.; Zheng, G.; Shum, C.K.; Yang, K.; Piao, S.; Sheng, Y.; Yi, S.; Li, J.; et al. Regional differences of lake evolution across China during 1960s–2015 and its natural and anthropogenic causes. Remote Sens. Environ. 2019, 221, 386–404. [Google Scholar] [CrossRef]
- Wang, X.; Xiao, X.; Qin, Y.; Dong, J.; Wu, J.; Li, B. Improved maps of surface water bodies, large dams, reservoirs, and lakes in China. Earth Syst. Sci. Data 2022, 14, 3757–3771. [Google Scholar] [CrossRef]
- Li, Y.; Niu, Z. Systematic method for mapping fine-resolution water cover types in China based on time series Sentinel-1 and 2 images. Int. J. Appl. Earth Obs. Geoinf. 2022, 106, 102656. [Google Scholar] [CrossRef]
Disclaimer/Publisher’s Note: The statements, opinions and data contained in all publications are solely those of the individual author(s) and contributor(s) and not of MDPI and/or the editor(s). MDPI and/or the editor(s) disclaim responsibility for any injury to people or property resulting from any ideas, methods, instructions or products referred to in the content. |
© 2024 by the authors. Licensee MDPI, Basel, Switzerland. This article is an open access article distributed under the terms and conditions of the Creative Commons Attribution (CC BY) license (https://creativecommons.org/licenses/by/4.0/).