Article

Evaluation of Climatological Precipitation Datasets and Their Hydrological Application in the Hablehroud Watershed, Iran

1
Department of Physics, University of Trento, 38123 Trento, Italy
2
Faculty of Civil Engineering, Shahrood University of Technology, Shahrood 3619995161, Iran
3
SRK Consulting (UK) Ltd., 5th Floor, Churchill House, 17 Churchill Way, Cardiff CF10 2HH, Wales, UK
4
School of Civil Engineering, Isfahan University of Technology, Isfahan 8415683111, Iran
5
Faculty of Earth Sciences and Spatial Management, Department of Meteorology and Climatology, Nicolaus Copernicus University, 87-100 Toruń, Poland
*
Author to whom correspondence should be addressed.
Water 2024, 16(7), 1028; https://doi.org/10.3390/w16071028
Submission received: 13 February 2024 / Revised: 27 March 2024 / Accepted: 28 March 2024 / Published: 2 April 2024

Abstract

:
Hydrological modeling is essential for runoff simulations in line with climate studies, especially in remote areas with data scarcity. Advancements in climatic precipitation datasets have improved the accuracy of hydrological modeling. This research aims to evaluate the APHRODITE, PERSIANN-CDR, and ERA5-Land climatic precipitation datasets for the Hablehroud watershed in Iran. The datasets were compared with interpolated ground station precipitation data using the inverse distance weighted (IDW) method. The variable infiltration capacity (VIC) model was utilized to simulate runoff from 1992 to 1996. The results revealed that the APHRODITE and PERSIANN-CDR datasets demonstrated the highest and lowest accuracy, respectively. The sensitivity of the model was analyzed using each precipitation dataset, and model calibration was performed using the Kling–Gupta efficiency (KGE). The evaluation of daily runoff simulation based on observed precipitation indicated a KGE value of 0.78 and 0.76 during the calibration and validation periods, respectively. The KGE values at the daily time scale were 0.64 and 0.77 for PERSIANN-CDR data, 0.62 and 0.75 for APHRODITE precipitation data, 0.50 and 0.66 for ERA5-Land precipitation data during the calibration and validation periods, respectively. These results indicate that despite varying sensitivity, climatic precipitation datasets present satisfactory performance, particularly in poorly gauged basins with infrequent historical datasets.

1. Introduction

Hydrological models serve as the primary solution for understanding and predicting hydrological processes, considering the economic constraints in measuring components and their non-linear and complex relationships [1,2]. However, hydrologists often face challenges in data collection for evaluating and modeling performance [3,4,5,6]. Developing countries, including Iran, confront data shortages, sparse station distribution, data gaps, a lack of updates, and high costs associated with data collection, particularly in arid regions. To address these limitations, alternative sources of climate input for hydrological models are required in areas without comprehensive data [7,8,9]. Various precipitation datasets are available for climate studies, including gauge-based datasets and reanalysis. These datasets offer long-term records of precipitation, making them suitable for such studies. On the other hand, these data products have shorter records that provide valuable information on weather processes, drought analysis, and hydrological modeling [10,11,12,13,14].
Asian Precipitation—Highly Resolved Observational Data Integration Towards Evaluation (APHRODITE) is known as a comprehensive collection of continental-scale daily precipitation products covering from 1951 onwards. It is derived from an extensive network of rain gauge data covering Asia, including the Himalayas, South and Southeast Asia, and mountainous regions in the Middle East [15]. APHRODITE provides valuable insights into long-term precipitation patterns. Another remarkable dataset is the Precipitation Estimation from Remotely Sensed Information using Artificial Neural Networks-Climate Data Record (PERSIANN-CDR) [16], which offers precipitation estimates with a daily temporal resolution and a spatial resolution of 0.25°. PERSIANN-CDR serves as a reliable alternative to gauge networks, providing valuable information in regions with sparse gauge coverage. This dataset demonstrates significant capabilities in studies involving high spatial and long-term precipitation datasets, including drought analysis in India, Iran, and China [17,18,19], as well as trend analysis in Brazil and the Amazon [20,21]. Furthermore, the fifth-generation ECMWF atmospheric reanalysis tool, ERA5, established in March 2019, delivers hourly estimates of a wide range of atmospheric, land, and oceanic climate variables. ERA5 significantly enhances the understanding of climate processes by offering detailed and continuous data [22]. Reanalysis datasets have been used in various fields such as meteorology [23,24], climatology [25,26], and environmental studies [27,28]. Recently, reanalysis datasets have also been used as input data or for calibration and evaluation data for hydrological modeling [29,30].
The APHRODITE, PERSIANN-CDR, and ERA5 datasets contribute significantly to the availability and accuracy of precipitation data, facilitating various research endeavors and improving our understanding of precipitation patterns and trends. In Malaysia, three long-term gridded climate products (APHRODITE, PERSIANN-CDR, and NCEP-CFSR) were evaluated for hydroclimatic simulations in tropical river basins from 1983 to 2007. These products were utilized as inputs to the calibrated Soil and Water Assessment Tool (SWAT) model to assess their ability to simulate streamflow. The results indicated that APHRODITE performed the best at precipitation estimation, followed by PERSIANN-CDR, while NCEP-CFSR showed unsatisfactory performance. Researchers recommended using APHRODITE precipitation and NCEP-CFSR temperature data for modeling Malaysian water resources [31]. Ajaaj et al. (2019) evaluated satellite- and gauge-based precipitation products through hydrologic simulation in the Tigris River Basin, using the SWAT model. They employed PRSIANN-CDR, MSWEP, APHRODITE, and CPC as inputs and found that APHRODITE exhibited better performance in monthly runoff simulations [32]. Comprehensive evaluation was performed between different datasets, including gauge-interpolated datasets (GPCCv8, CRU TS4.01, PREC/L, and CPC-Unified), multi-source products (PERSIANN-CDR, CHIRPS2.0, MSWEP V2, HydroGFD2.0, and SM2RAIN-CCI), and reanalysis (ERA-Interim, ERA5, CFSR, and JRA-55) against gauge observations over the Karun Basin in southwestern Iran to estimate precipitation. The findings showed that the GPCCv8 dataset agreed best with the measurements and most datasets estimated less than the actual amount [7].
In general, effective water resources management relies on quantifying the hydrological cycle and accurately measuring all of its components [33,34]. Therefore, appropriate dataset selection of various climate databases has a crucial impact on hydrological studies. In this research, in accordance with previous studies, APHRODITE, PERSIANN-CDR, and ERA5 were selected for modeling by variable infiltration capacity (VIC). Shayeghi et al. (2020) simulated the hydrology of the Sefidrood River Basin in northern Iran with four remote sensing precipitation products by VIC. The results showed that PERSIANN was the best precipitation dataset for capturing the streamflow, and APHRODITE and ERA-Interim gave better precipitation estimates at a daily time scale than other products [35].
Global precipitation datasets play a critical role in hydrological research and practical applications; these data sources are however susceptible to various uncertainties. Gauge-based datasets encounter uncertainties related to point-to-area interpolation and instrument reliability [36,37,38]. Remote sensing sensors also exhibit significant uncertainties due to imperfect algorithms and the limitations of the sensors, especially in areas with complex topographies and extreme weather conditions [39,40,41]. Furthermore, reanalysis datasets are constrained by limitations in the quantity and quality of assimilated data and the accuracy of model physics [42,43]. Consequently, uncertainties are pervasive across all meteorological datasets.
Hydrological models interpret the processes and relationships involved in the formation of a hydrological parameter, such as daily runoff. Precipitation, as the most important type of input data for meteorological models, introduces a significant amount of uncertainty into the modeling process. The sensitivity analysis of a model to different precipitation datasets and their effects on model outputs can provide users with a better understanding of selecting precipitation data. Therefore, the objective of this study is to assess the accuracy of precipitation estimates by long-term datasets, including APHRODITE, PERSIANN-CDR and ERA5-Land, and their application in predicting runoff in a region under water harvesting for agricultural purposes. This study was conducted in the Hablehroud watershed of Iran during a period lacking a regular network of ground stations that transmitted data to global meteorological centers. Following this period, considering the significance of accurately measuring precipitation in recent years, a number of high-precision stations were deployed, which have had a significant impact on the accuracy of global datasets. A sensitivity analysis of the model to each of these precipitation datasets, calibration, and quantification of the uncertainty associated with each precipitation dataset’s effect on runoff in the Hablehroud watershed were performed. The results of this study can contribute significantly to a better understanding of the performance of precipitation data in this watershed and its impacts on runoff.

2. Materials and Methods

2.1. Case Study

The watershed area of Hablehroud River is located in the southern margin of the central Alborz Mountains and is a tributary of the watershed of the central desert of Iran, with an area of 326,991 hectares, between 52°13′ and 53°13′ in east longitude and 35°17′ to 35°58′ in north latitude (Figure 1). In terms of its administrative divisions, the majority of the watershed area is located in Tehran province, with a part in Mazandaran province to the north and another part in Semnan province to the south. The highest point in this watershed area is Mount Sefidab, with an absolute elevation of 4047 m, while the lowest point is 982 m above sea level. The climate classification in the research area is semi-arid according to the Köppen–Geiger classification system, with a seasonal precipitation distribution of 45% in winter, 29% in spring, 22% in autumn, and only 3% in summer. The average annual precipitation over a period of thirty years for the entire watershed area is approximately 272 mm [44].

2.2. Hydrological Model

The variable infiltration capacity (VIC) [45] is used to model the rainfall–runoff process. VIC is a semi-distributed, macroscale, hydrologic model that solves full water and energy balances. This model has been tested in different basins with different scales and has performed well in diverse settings [46]. VIC is a grid-based model and is made up of two main components, a rainfall–runoff model and a routing component, which can be applied at different spatial scales and with different temporal resolutions, in this case, daily (version 4.2). Hydrological simulation was independently conducted in each cell using the VIC model. Subsequently, the simulated surface and subsurface runoff values for each cell were collected and transmitted along the flow network by employing the routing module introduced by Lohmann and Raschke [47]. Daily precipitation, max–min temperature, and wind speed were the primary forcing data, while soil data, land cover, and a vegetation library were provided for the model to generate runoff response components [48].

2.2.1. Sensitivity Analysis

Sensitivity analysis is an important aspect of hydrological modeling as it helps to identify the most influential parameters in the model and their impact on the output variables [49]. By varying the input parameters within a certain range and observing the resulting changes in the output variables, sensitivity analysis can provide insights into the behavior of a hydrological system and help to improve the accuracy of the model predictions [50]. In addition, sensitivity analysis can also be used to optimize model performance by identifying the most important parameters that need to be calibrated. This can help to reduce the computational time and effort required for calibration and improve the efficiency of the modeling process [51].
The calibration process of the VIC hydrological model as listed in Table 1 was performed with 7 parameters along with their adjustable ranges. The sensitivity analysis of the model was executed 5000 times by varying the calibration parameters using Latin hypercube sampling [52], and the results were then analyzed for the sensitivity of each parameter using the pyVISCOUS (version 2.2.1) library [53].

2.2.2. Calibration Method

In this research, an optimization method based on the genetic algorithm called Non-dominated Sorting Genetic Algorithm II (NSGA-II) was used. This method was developed by Deb et al. (2002) [54]. This method of calibration for hydrological models has gained considerable popularity these days [55,56,57] and was employed by Dang et al. (2020) to calibrate a VIC hydrological model [58].
In the calibration process, first, the model is calibrated with observed precipitation data using all parameters, and then, based on the individual climatic precipitation data and sensitivity analysis results, the model is calibrated for each dataset. Also, during this process, considering 2500 iterations were required for parameter adjustments, a total of 50 genes were employed. Following the identification of sensitive parameters for each model using climatological precipitation data, the non-sensitive parameters were fixed based on their values in modeling with observed precipitation data, and the sensitive parameters underwent calibration.

2.2.3. Input Data

Basic Data

In this research, information related to the soil of the region was obtained from the Harmonized World Soil Database (HWSD), accessible on the FAO website, which has 36 classes [59]. In the Hablehroud River watershed, there are three classes of this classification, including Leptosol-LP, Solonchak-SC, and Regosol-RG. The Leptosol-LP class is classified as a soil triangle in silt and both the Solonchak-SC and Regosol-RG classes are classified as loam. The soil layer is shown based on the soil triangle classification in Figure 2a.
Data related to vegetation cover for this area were obtained using MODIS satellite products and an MCD12Q1 product, and it was classified into 17 categories according to International Geosphere–Biosphere Programme (IGBP) standards [60]. In this basin, there are five categories of vegetation: open shrubland (0.6%), grassland (74.4%), cropland (0.02%), urban area (0.12%), and bare land (24.8%). Leaf surface coefficient data were obtained using the MCD12Q1 product and IGBP classification. To obtain albedo data, data from the MODIS satellite that were extracted using a theoretical algorithm (Figure 2b) were used [60].
The Hablehroud River originates from the Alborz Mountains and flows towards the central desert in a way that the difference in altitude between the highest point and lowest point in the basin is 3065 m. Although input files for altitude bands are optional for the model, it was necessary to introduce altitude bands for this area. The Shuttle Radar Topographic Mission (SRTM) was used to prepare this file, which is a digital elevation model (DEM) (Figure 2c) [61].

Meteorological Datasets

  • Precipitation
In this research, four precipitation datasets were used for simulating runoff. There are 10 rain gauge stations of the Ministry of Energy in the basin that have complete data since 1991. Therefore, this year was chosen for evaluation and modeling. To evaluate other precipitation data with ground station precipitation data, and to evaluate the ability of the VIC model in this watershed, interpolation was performed for each cell center based on the position of the stations using the inverse distance weighting (IDW) method (Figure 1). The precipitation data for a particular location can be retrieved using various interpolation methods, such as the IDW and kriging methods. Each method’s advantages and disadvantages depend strongly on the characteristics of the dataset. Despite the fact that employing these interpolation methods may lead to possible errors, to reconstruct precipitation data, using these methods seems inevitable. In addition, the superiority of the IDW method to other interpolation methods was confirmed in previous studies [62,63,64,65,66,67]. Simpler approaches, such as IDW, can provide more stable results, even if the final spatial variation is heavily smoothed and affected by over- or underestimation if the data are unevenly distributed [68]. In general, in Iran, the rain gauge station data were gathered and provided by two different organizations. One of them is the Iran Meteorological Organization (IRIMO) and the other is the Iran Water Management Research Institute Network (TAMAB). The data for these two organizations are completely independent. For the APHRODITE datasets, all data for Iran were only provided by the IRIMO [15]. In the PERSIANN-CDR datasets, the GPCP (version 2.2) was used to correct the biases of the PERSIANN rain rate estimates [16]. The GPCP monthly dataset (version 2.2) was corrected based on the CPCC dataset [69] and the GPCC dataset was also compiled by the IRIMO [70]. In this research, to have an independent evaluation, only the precipitation data provided by the TAMAB were used.
The Precipitation Estimation from Remotely Sensed Information using Artificial Neural Networks-Climate Data Record (PERSIANN-CDR) precipitation data from the CHRS database, which consists of satellite-based precipitation data with application in climate studies, were used for simulating runoff [16].
The Asian Precipitation—Highly Resolved Observational Data Integration Towards Evaluation (APHRODITE) precipitation data are ground station-based precipitation data established by the Center for Humans and Nature’s Research and Meteorological Center of Japan, which aims to create daily networked precipitation data throughout Asia [15].
The ERA5-Land reanalysis precipitation data, which cover a long period, were another precipitation dataset used in the runoff simulation [71]. Since the two precipitation datasets PERSIANN-CDR and APHRODITE were the same in terms of their spatial distribution and of course they had a larger cell size (0.25° × 0.25°), the model framework was built based on these two datasets, and then, the ERA5-Land precipitation dataset was upscaled with the help of the CDO library [72]. Complete information on the weather datasets used in this research is presented in Table 2. The average daily rainfall is presented in Figure 3.
  • Wind and Temperature
Due to the lack of a weather station during the research period in the study area, temperature and wind speed data from the European Centre for Medium-Range Weather Forecasts’ ERA5 were used. For this purpose, the data on minimum temperature and maximum temperature at a height of 2 m from the ground surface as well as wind speed at a height of 10 m were obtained from this reanalyzed database [22]. Figure 1 presents the location of the used rain gauge stations.

2.3. Evaluation Metrics

2.3.1. Evaluation of Climatological Data

To evaluate the quality and accuracy of the precipitation data, the interpolated precipitation time series corresponding to each cell were compared with the time series corresponding to the same cell in the climatic precipitation data. To this object, the statistical indices of the correlation coefficient (CC), KGE efficiency coefficient [73], percentage bias of relative deviation (PBIAS), probability of detection (POD), false alarm ratio (FAR), critical success index (CSI), frequency bias index (FBI), and Heidke skill score (HSS) were calculated. The equations for calculating these indices are presented in Table S1.
The POD is the fraction of rainfall events that the climatological precipitation detects among all rainfall events, and the FAR error rate is the proportion of unrealistic rainfall events among all precipitation detected by the climatological precipitation data. The CSI success threshold index is a function of the POD and FAR, which is a combination of misestimated warnings and missed events, thus its result is more balanced. The FBI represents the ratio of precipitation detections from climatological datasets to those from ground stations. A value of an FBI of less than one signifies fewer detected precipitation events compared to actual occurrences, while a value greater than one indicates more detections than observed. An optimal FBI value is 1. The HSS is on a scale from −1 to 1, with a score of 1 signifying flawless proficiency, 0 denoting a lack of skill (comparable to random chance), and negative values implying that a model’s performance is inferior to a random forecast. The HSS proves especially valuable for evaluating the dependability of a forecasting model in accurately predicting observed events and discerning them from random chance.

2.3.2. Evaluation of Hydrological Performance of Climatological Data

In this research, the KGE efficiency coefficient was used as the objective function, and this coefficient and its components will be evaluated in this research. These coefficients between the observed and simulated runoff were calculated on two daily and monthly scales at the Bonekoh Hydrometric Station. In addition to an objective function and its components, which were investigated in this study, the performance of climatological precipitation data in simulating runoff will be evaluated using two other assessment indices, namely the root mean square error (RMSE) and Nash–Sutcliffe efficiency (NSE). These traditional runoff evaluation indices were employed to assess the functionality of the simulated runoff alongside the examined objective function and its elements.

3. Results and Discussion

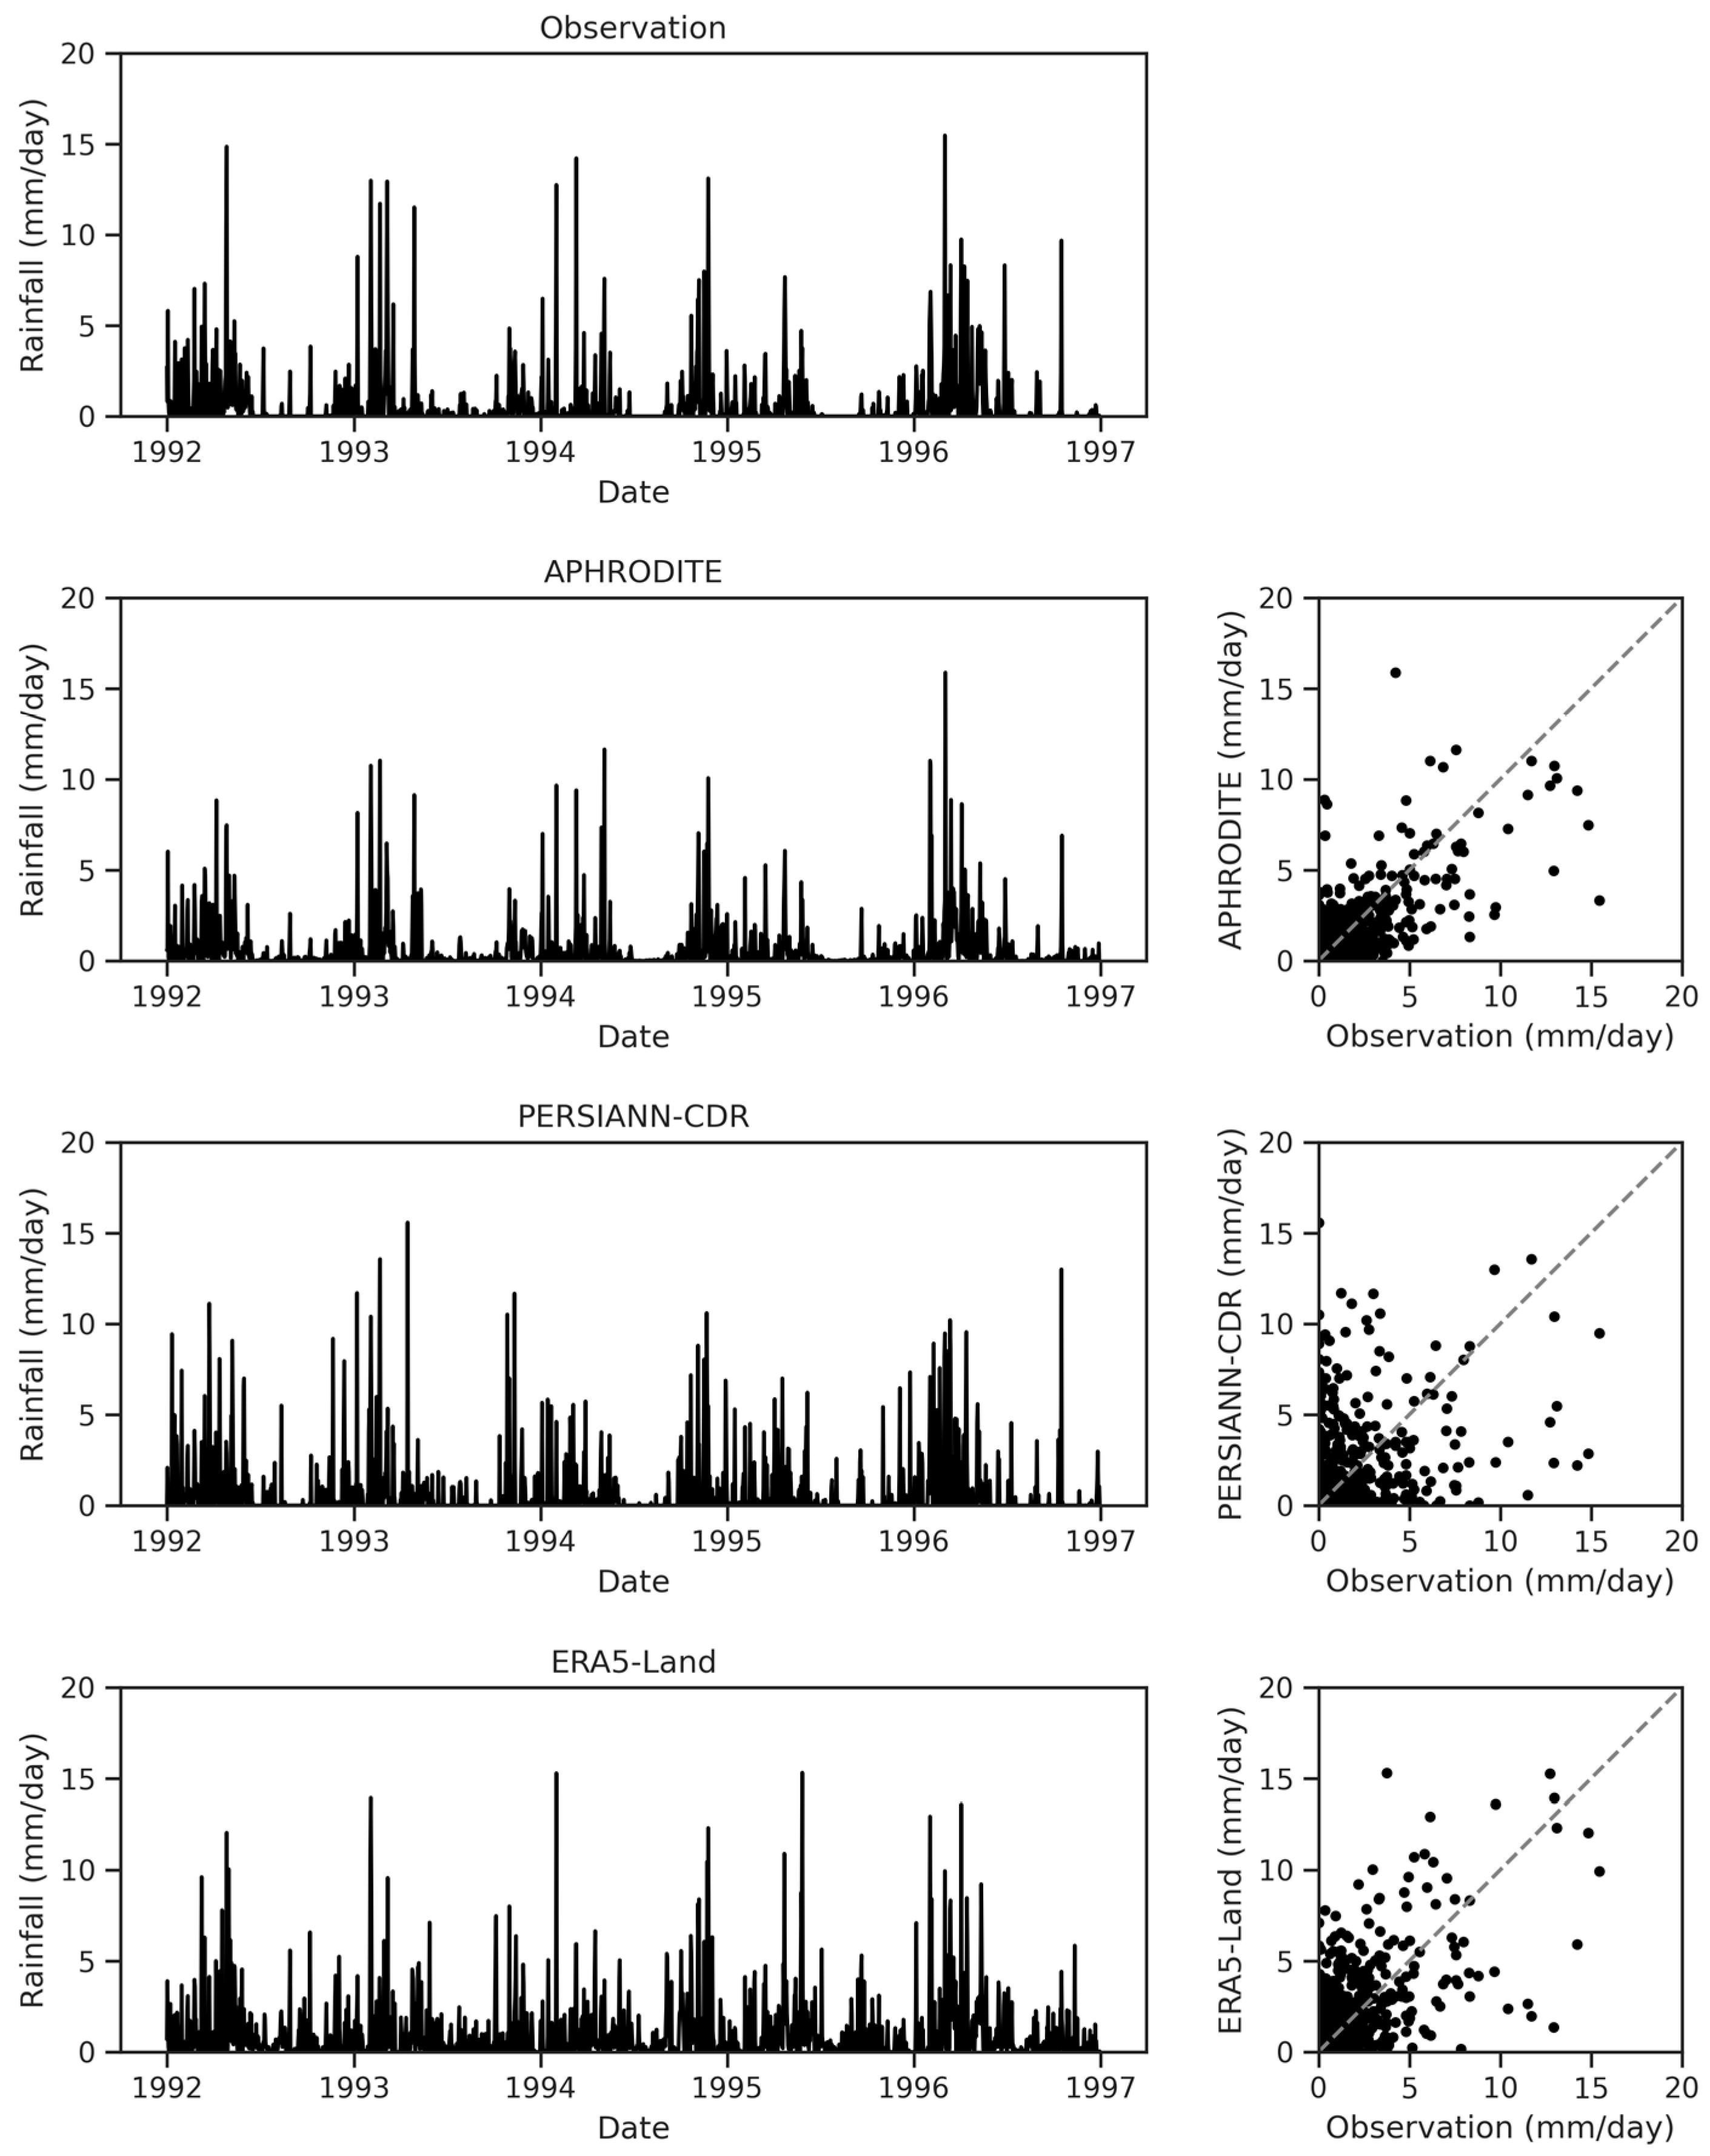
3.1. Evaluation of Precipitation Forcing

The climatic precipitation data used in this research were evaluated in all cells. The results of the statistical indicators are presented in (Table 3). Based on the information in this table, the highest correlation with an average correlation of 0.54 was observed in the APHRODITE precipitation data. The ERA5-Land and PERSIANN-CDR precipitation data were in the next categories with an average correlation of 0.41 and 0.24, respectively. The average percentage of deviation showed that the APHRODITE precipitation data estimated the precipitation as less than the actual amount, while the other two data sources estimated more than the reality. The maximum deviation is related to ERA5-Land precipitation data. Additionally, APHRODITE precipitation data showed the minimum deviation. Based on the average efficiency coefficient of the KGE, with correlation and deviation taken into account, the APHRODITE precipitation data had the highest accuracy in estimating the amount of precipitation and this coefficient was equal to 0.40 on average for the Hablehroud watershed. The PERSIANN-CDR precipitation dataset, with an average KGE equal to 0.18, was in second place and the ERA5-Land reanalysis precipitation dataset ranked third, with an average of 0.05. Given the visual interpretation presented in Figure 4, it can be inferred that the PERSIANN-CDR and ERA5-Land datasets tend to overestimate precipitation compared to ground stations, a trend supported by the bias values provided in Table 3 and aligned with Song et al. (2022) [74]. It should be noted that APHRODITE generally underestimates maximum precipitation, while ERA5-Land shows better performance in estimating heavy precipitation events, consistent with the findings of Mitra et al. (2019) [75] in estimating maximum precipitation data. However, the results of Ang et al. (2022) [76] demonstrated that, in general, the accuracy of the APHRODITE dataset was higher compared to ERA5-Land, aligning with the findings of this study.
According to rainfall detection, the APHRODITE and ERA5-Land precipitation datasets performed better than the PERSIANN-CDR dataset; PERSIANN-CDR did not detect approximately half of the rainfall events and more than 80% of the rainfall events it detected did not occur. Although all three rainfall datasets performed similarly in rainfall detection, the APHRODITE precipitation dataset had the least error in the detection of rainfall events and the FAR for this database was equal to 0.67. This error rate for PERSIANN-CDR was equal to 0.69 and for ERA5-Land, it was equal to 0.73, which indicates that 73% of the rainfall detections by this database were errors. The CSI efficiency coefficient, which is more complete than the other two precipitation detection indices, showed that the precipitation database with a CSI coefficient equal to 0.31 had the best performance in this field, while the other two datasets had no significant difference. In terms of the number of estimates indicated by the FBI, it can be stated that, given the consistently greater than 1 value of this metric, climatological precipitation datasets have more detection occurrences than the observed events. The highest error was calculated for the ERA5-Land dataset, averaging 3.63 and reaching up to 6.06 in some cases. This suggests that, on average, this dataset estimates the number of events to be 2.63 more than the observed count. According to these criteria, the best performance was observed in the PERSIANN-CDR precipitation dataset with an average of 1.86. Following this dataset was APHRODITE, with an FBI value of 2.97. The evaluation of the HSS, indicating the randomness of precipitation detections, and its optimal value being equal to 1, demonstrated similar performance across all three datasets. Although, on average, the AHPRODITE dataset exhibited the best performance with an HSS value of 0.33, followed by PERSIANN-CDR and ERA5-Land with values of 0.25 and 0.22, respectively. It is also noteworthy that, based on Table 3, the PERSIANN-CDR dataset showed lower variability compared to the other two datasets, indicating the uniformity and homogeneity of this dataset at the watershed level. The maximum and minimum differences in this measure were considerable in the two other datasets. Considering the spatial distribution of the precipitation data performance across the watershed, which are presented in Figure S6, it can be stated that all precipitation datasets evaluated in the highlands (encompassing the northern part of the watershed) exhibited poorer performance. This is reflected in the highest errors in the FAR, FBI, and HSS, and the lowest accuracy in the POD and CSI, in these areas. This correlation aligns with the findings of Yu et al. (2020) [77].
To conclude, the results demonstrated that the APHRODITE precipitation data performed best in all the indicators related to the amount and detection of precipitation which is in alignment with Ajaaj et al. (2018) in a data-scarce environment and Wang et al. (2021) in Mekong [32,78]. Although the ERA5-Land dataset had acceptable performance in the correlation and all precipitation detection indicators, it generally showed relatively weak performance due to the very high deviation rate reaching over 200% in one cell. Also, according to Figure S6, the results presented that the performance of all three precipitation datasets was fragile in the north of the watershed, which is high and cold, and as we advanced to the semi-arid and low altitude areas, the accuracy of precipitation estimation and detection increased. Figure 6a and Figure S1 illustrate the monthly averages for the entire period of 1992–1996 for all ten pixels used in evaluating the precipitation datasets and monthly averages of precipitation, respectively. It was observed that the PERSIANN-CDR and APHRODITE datasets generally underestimated precipitation during the high-precipitation months, while overestimating precipitation during the low-precipitation seasons (below average). According to this figure, the ERA5-Land dataset consistently overestimated precipitation compared to the actual amounts. However, it should be noted that, based on Figure S6, the highest errors for all datasets occur in the northern cells, which had a lower contribution percentage compared to other cells in simulating runoff.

3.2. Evaluation of Streamflow Simulations

In order to assess the capability of the model for runoff simulation, first, this model was calibrated with interpolated precipitation data using the IDW method. Then, the calibration of models was conducted based on the climatic precipitation dataset. The simulated runoff by the model was compared with the observed runoff at Bonekoh station using four series of precipitation datasets. The results of the comparison of the simulated runoff model with the observed runoff on a daily and monthly scale are presented in Table 4 and Table 5, respectively. The simulated runoff hydrographs of the calibration and validation periods are shown on a daily scale in Figure 4 and on a monthly scale in Figure 5. Moreover, the runoff datasets simulated by each precipitation dataset against the observed precipitation are presented on a daily time scale in Figures S2 and S3, as well as on a monthly scale in Figures S4 and S5.

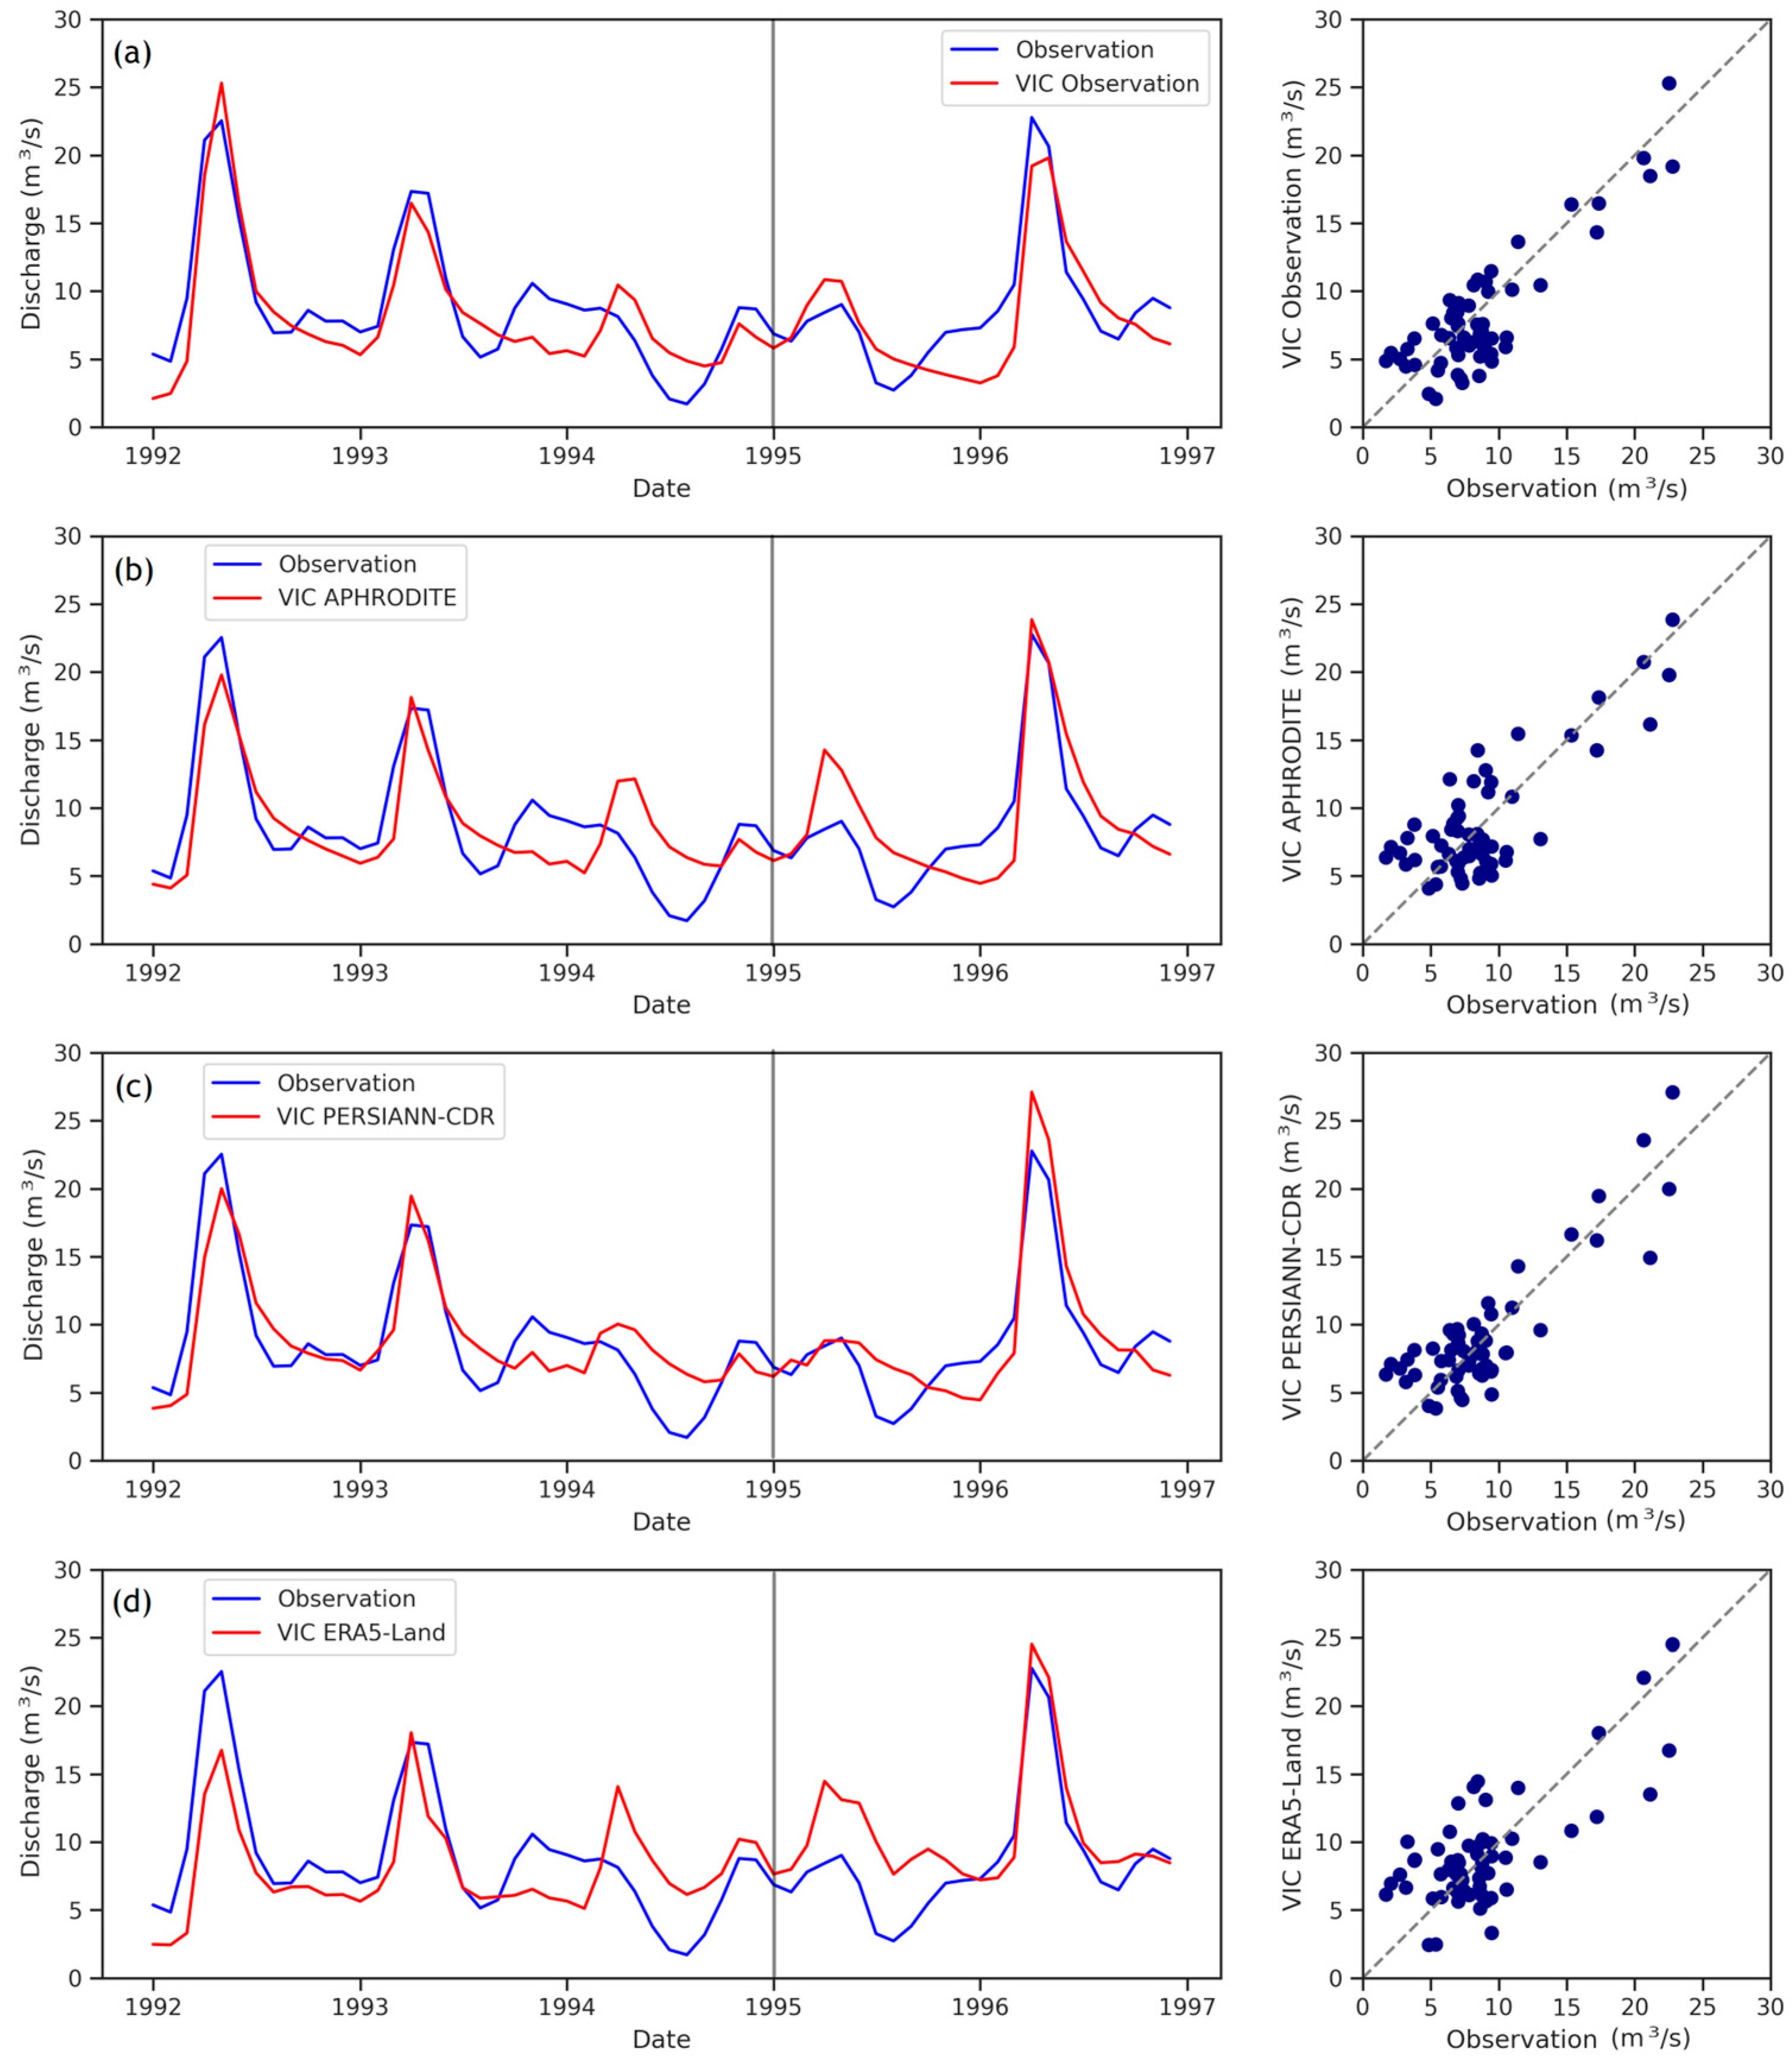
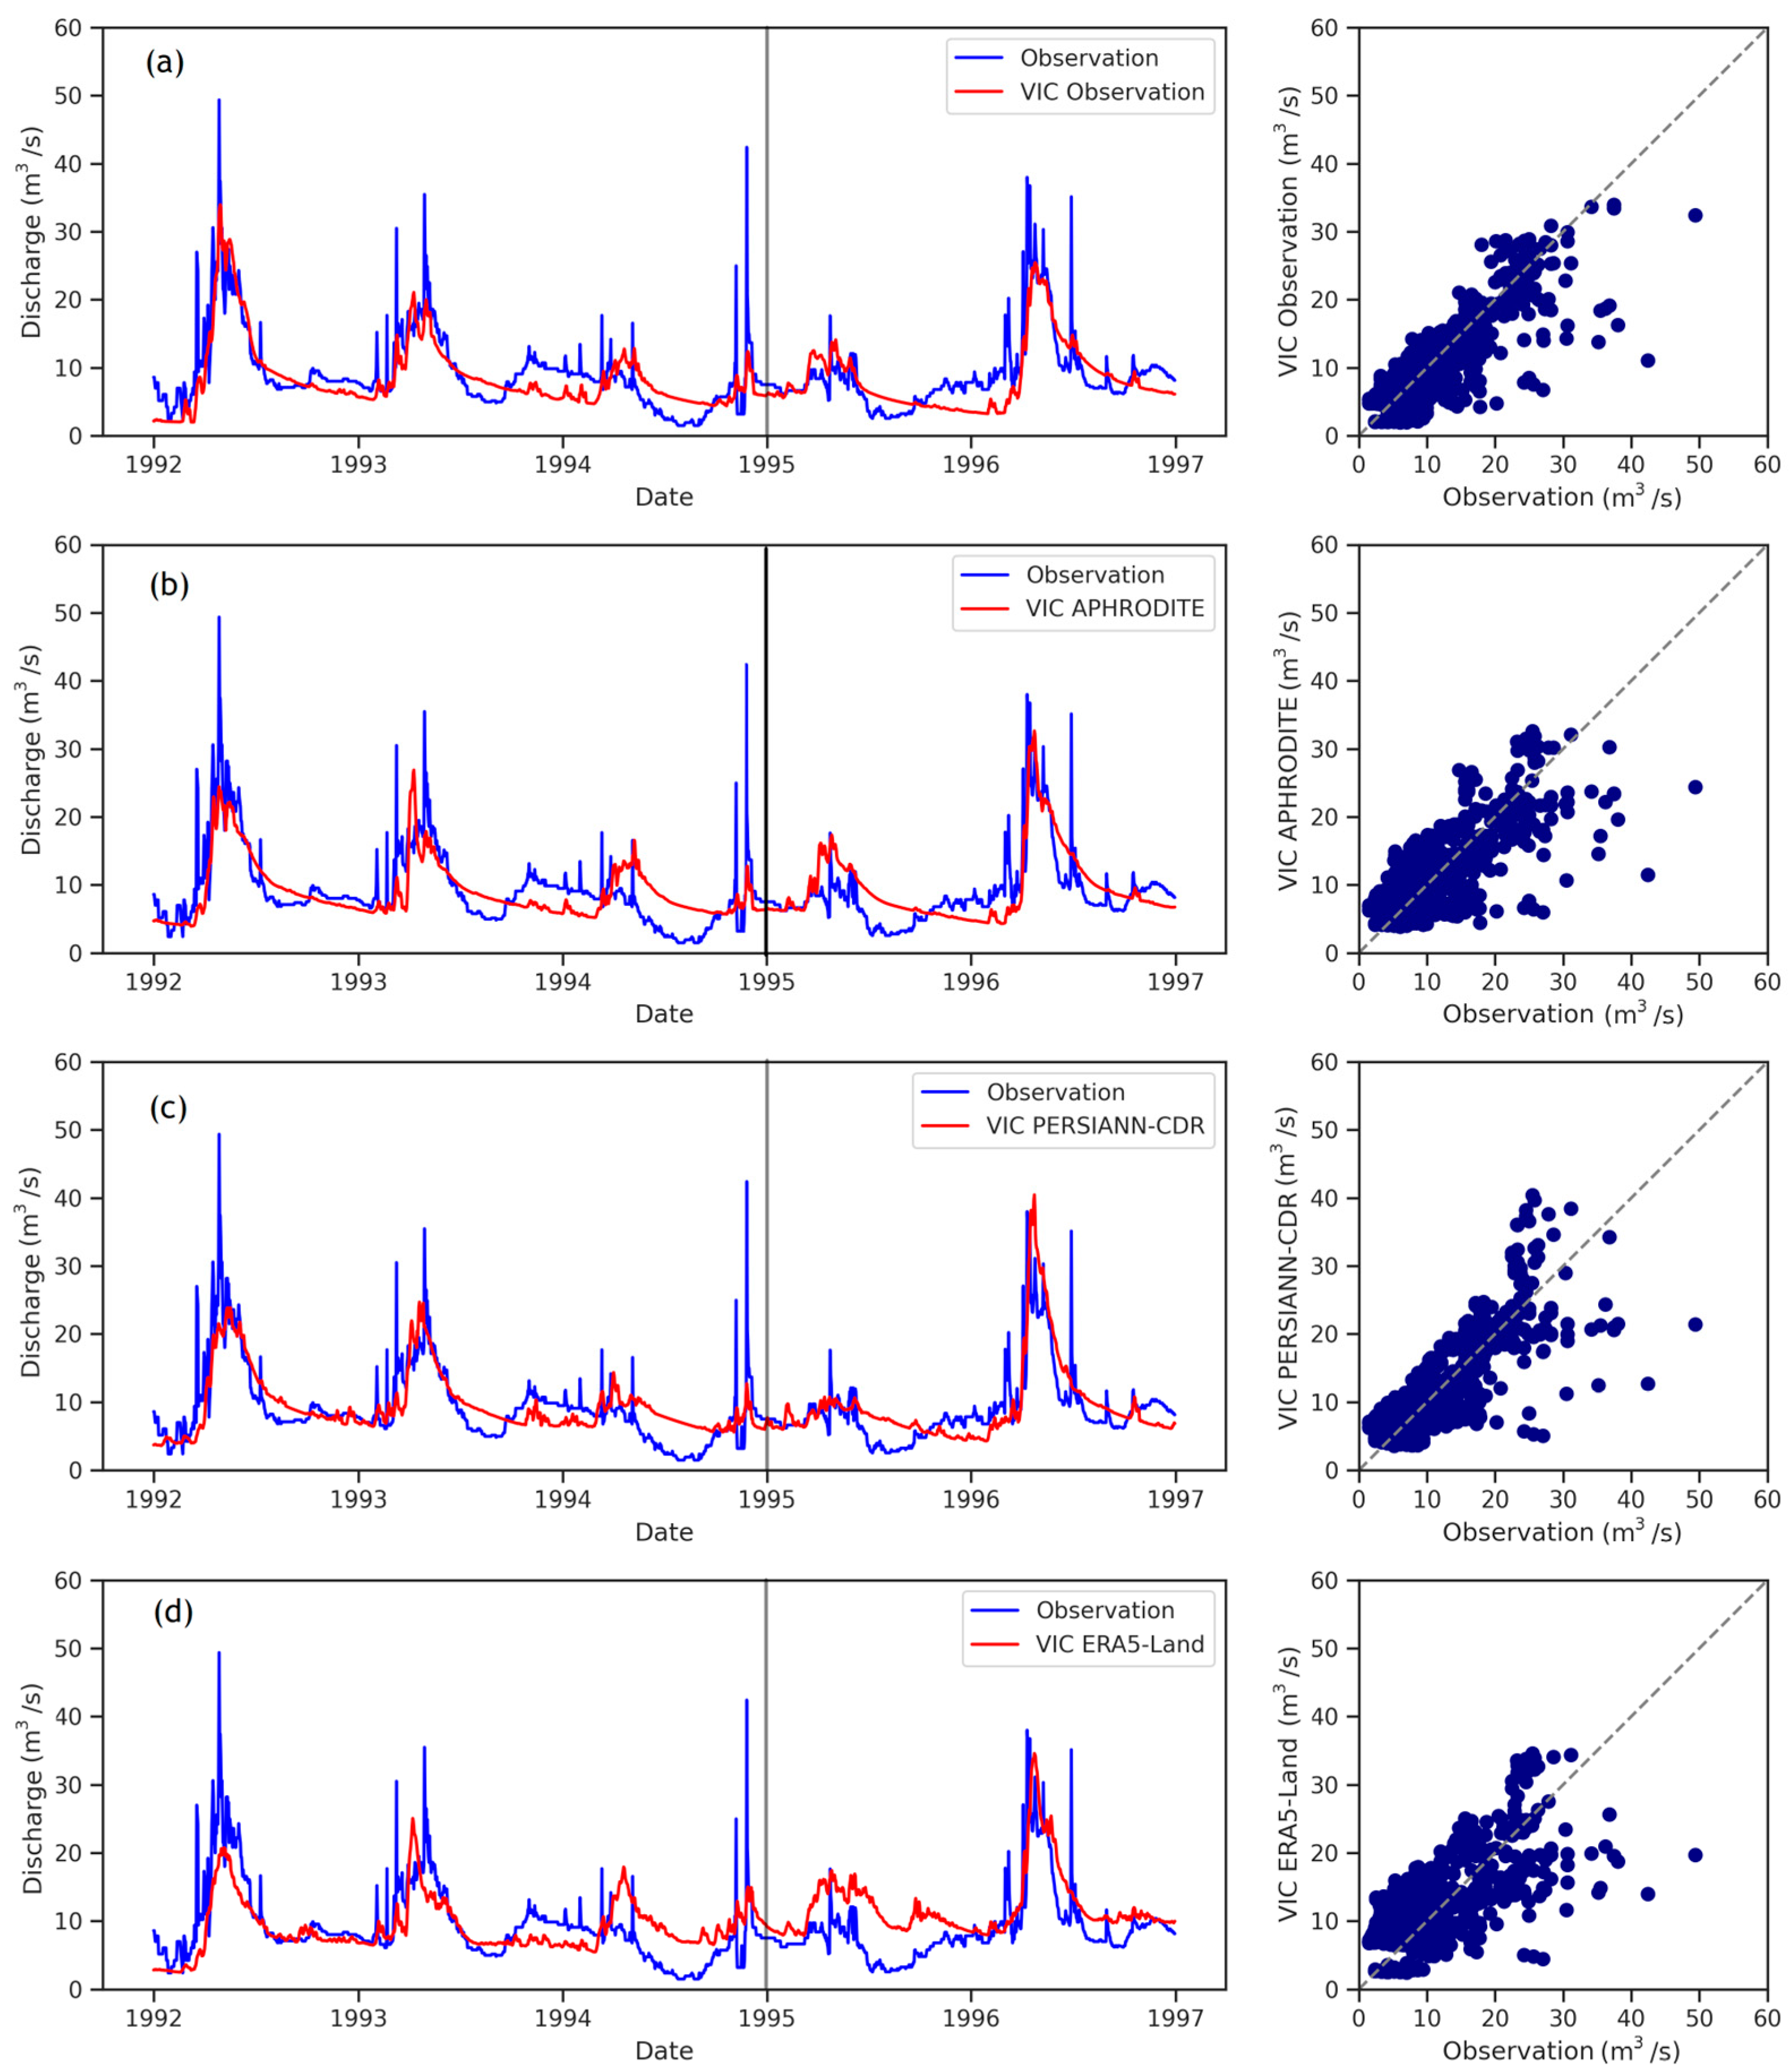
3.2.1. Daily Result Evaluation

According to the information presented in Table 4, in the calibration period, the model performed well by using the interpolated precipitation data, according to the KGE, which was 0.78, and the runoff simulated high correlation. The value of α being equal to 0.93 shows that the amount of simulated runoff was less compared to the observed amount in Bonekoh station, and the model underestimated it. The line of best fit in Figure S2a as well shows that this estimation was less than the reality. During the validation period of the model, it simulated the runoff with almost the same precision as the calibration period, which indicates the homogeneity of the precipitation data input to the model. In addition, in this period, the runoff was estimated to be less than the reality with the value of α being less than 1, and the line of best fit presented in Figure S3a proved this estimate to be less than the observations. The CC decreased in this period compared to the calibration period.
The results of the simulation of daily runoff in the calibration period using climatic precipitation data showed that the APHRODITE and PERSIANN-CDR precipitation datasets had similar performances. The efficiency coefficient of the KGE for the APHRODITE precipitation data was 0.62 and for PERSIANN-CDR 0.64. The ERA5-Land precipitation dataset, which had the worst performance in estimating the amount of rainfall, ranked third in the runoff simulation with a KGE value of 0.51. The APHRODITE and ERA5-Land precipitation datasets underestimated the runoff while PERSIANN-CDR overestimated it. Although the lowest correlation in the precipitation evaluation part was related to the PERSIANN-CDR precipitation dataset, this precipitation dataset showed the highest correlation in the runoff simulation. The line of best fit in Figure S2 as well as the daily hydrographs presented in Figure 4 show that the model using these three series of precipitation data overestimated low flows and underestimated maximum flows. More than the actual amount, they estimated that this could have been due to water harvesting during the period of cultivation and irrigation of lands and orchards.
Based on the RMSE index, the error magnitude during the calibration period for the ERA5-Land dataset was higher compared to the other datasets. The RMSE value for this dataset was 4.36. The lowest error was observed for the observational precipitation dataset, followed by the PERSIANN-CDR and APHRODITE datasets, with values of 3.40, 3.64, and 3.95, respectively. According to these error assessment criteria, once, the PERSIANN-CDR dataset performed nearly close to the observational precipitation dataset. In a similar vein, performance evaluations of the models with different precipitation datasets using the NSE index revealed that, akin to the RMSE index, the highest accuracy was associated with the observational precipitation dataset, and the lowest was related to ERA5-Land. The NSE values for these two datasets were 0.64 and 0.41, respectively, while for the PERSIANN-CDR and APHRODITE datasets, the values were 0.59 and 0.52, respectively.
In the validation period, based on the modeling objective function, the model based on the PERSIANN-CDR precipitation dataset performed better in the runoff simulation. The KGE value and correlation for this data were 0.77 and 0.83, respectively, which indicated the better performance of this precipitation dataset compared to the observational precipitation data. As these data overestimated the runoff during the calibration period, they also overestimated the runoff in this period, and this overestimation was also observed in the assessment of the accuracy of the precipitation of this database. The APHRODITE precipitation data performed better than ERA5-Land precipitation dataset in runoff simulation, such as during the calibration period. The KGE values for APHRODITE and ERA5-Land were 0.75 and 0.66, respectively, which shows that all three climatic precipitation datasets performed better in this period. Figure S3 shows that the model performed better in the simulation of minimum runoff using the PERSIANN-CDR and APHRODIATE precipitation datasets than the ERA5-Land one, which was due to the lower amount of deviation in the estimation of the rainfall amount.
Similar to the calibration period, during the validation period, the observed precipitation dataset and PERSIANN-CDR and APHRODITE datasets experienced comparable errors based on the calculated RMSE. The respective RMSE values for these three datasets were 3.30, 3.42, and 3.62. However, ERA5-Land exhibited a noticeable difference, with the highest RMSE equal to 4.64, compared to the other three datasets.
According to the reported NSE values in Table 4, the accuracy assessment index for simulating runoff was higher than 0.5 for all datasets except for the ERA5-Land dataset. For this dataset, the NSE value was calculated as 0.18, indicating the incapacity of this dataset in simulating runoff. In accordance with the categorization provided by Moriasi et al. (2007) [79], all datasets, except ERA5-Land, fell into the satisfactory category. The results of this study, indicating that ERA5-Land exhibits poorer performance in simulating runoff compared to PERSIANN-CDR, are in contrast to the findings of Jahanshahi et al. (2024) [80]. Also, comparing the simulated runoff results of the two precipitation datasets, PERSIANN-CDR and APHRODITE in this study revealed the superiority of PERSIANN-CDR. This contradicts the findings of Ajaaj et al. (2020) conducted in the Tigris region [32].

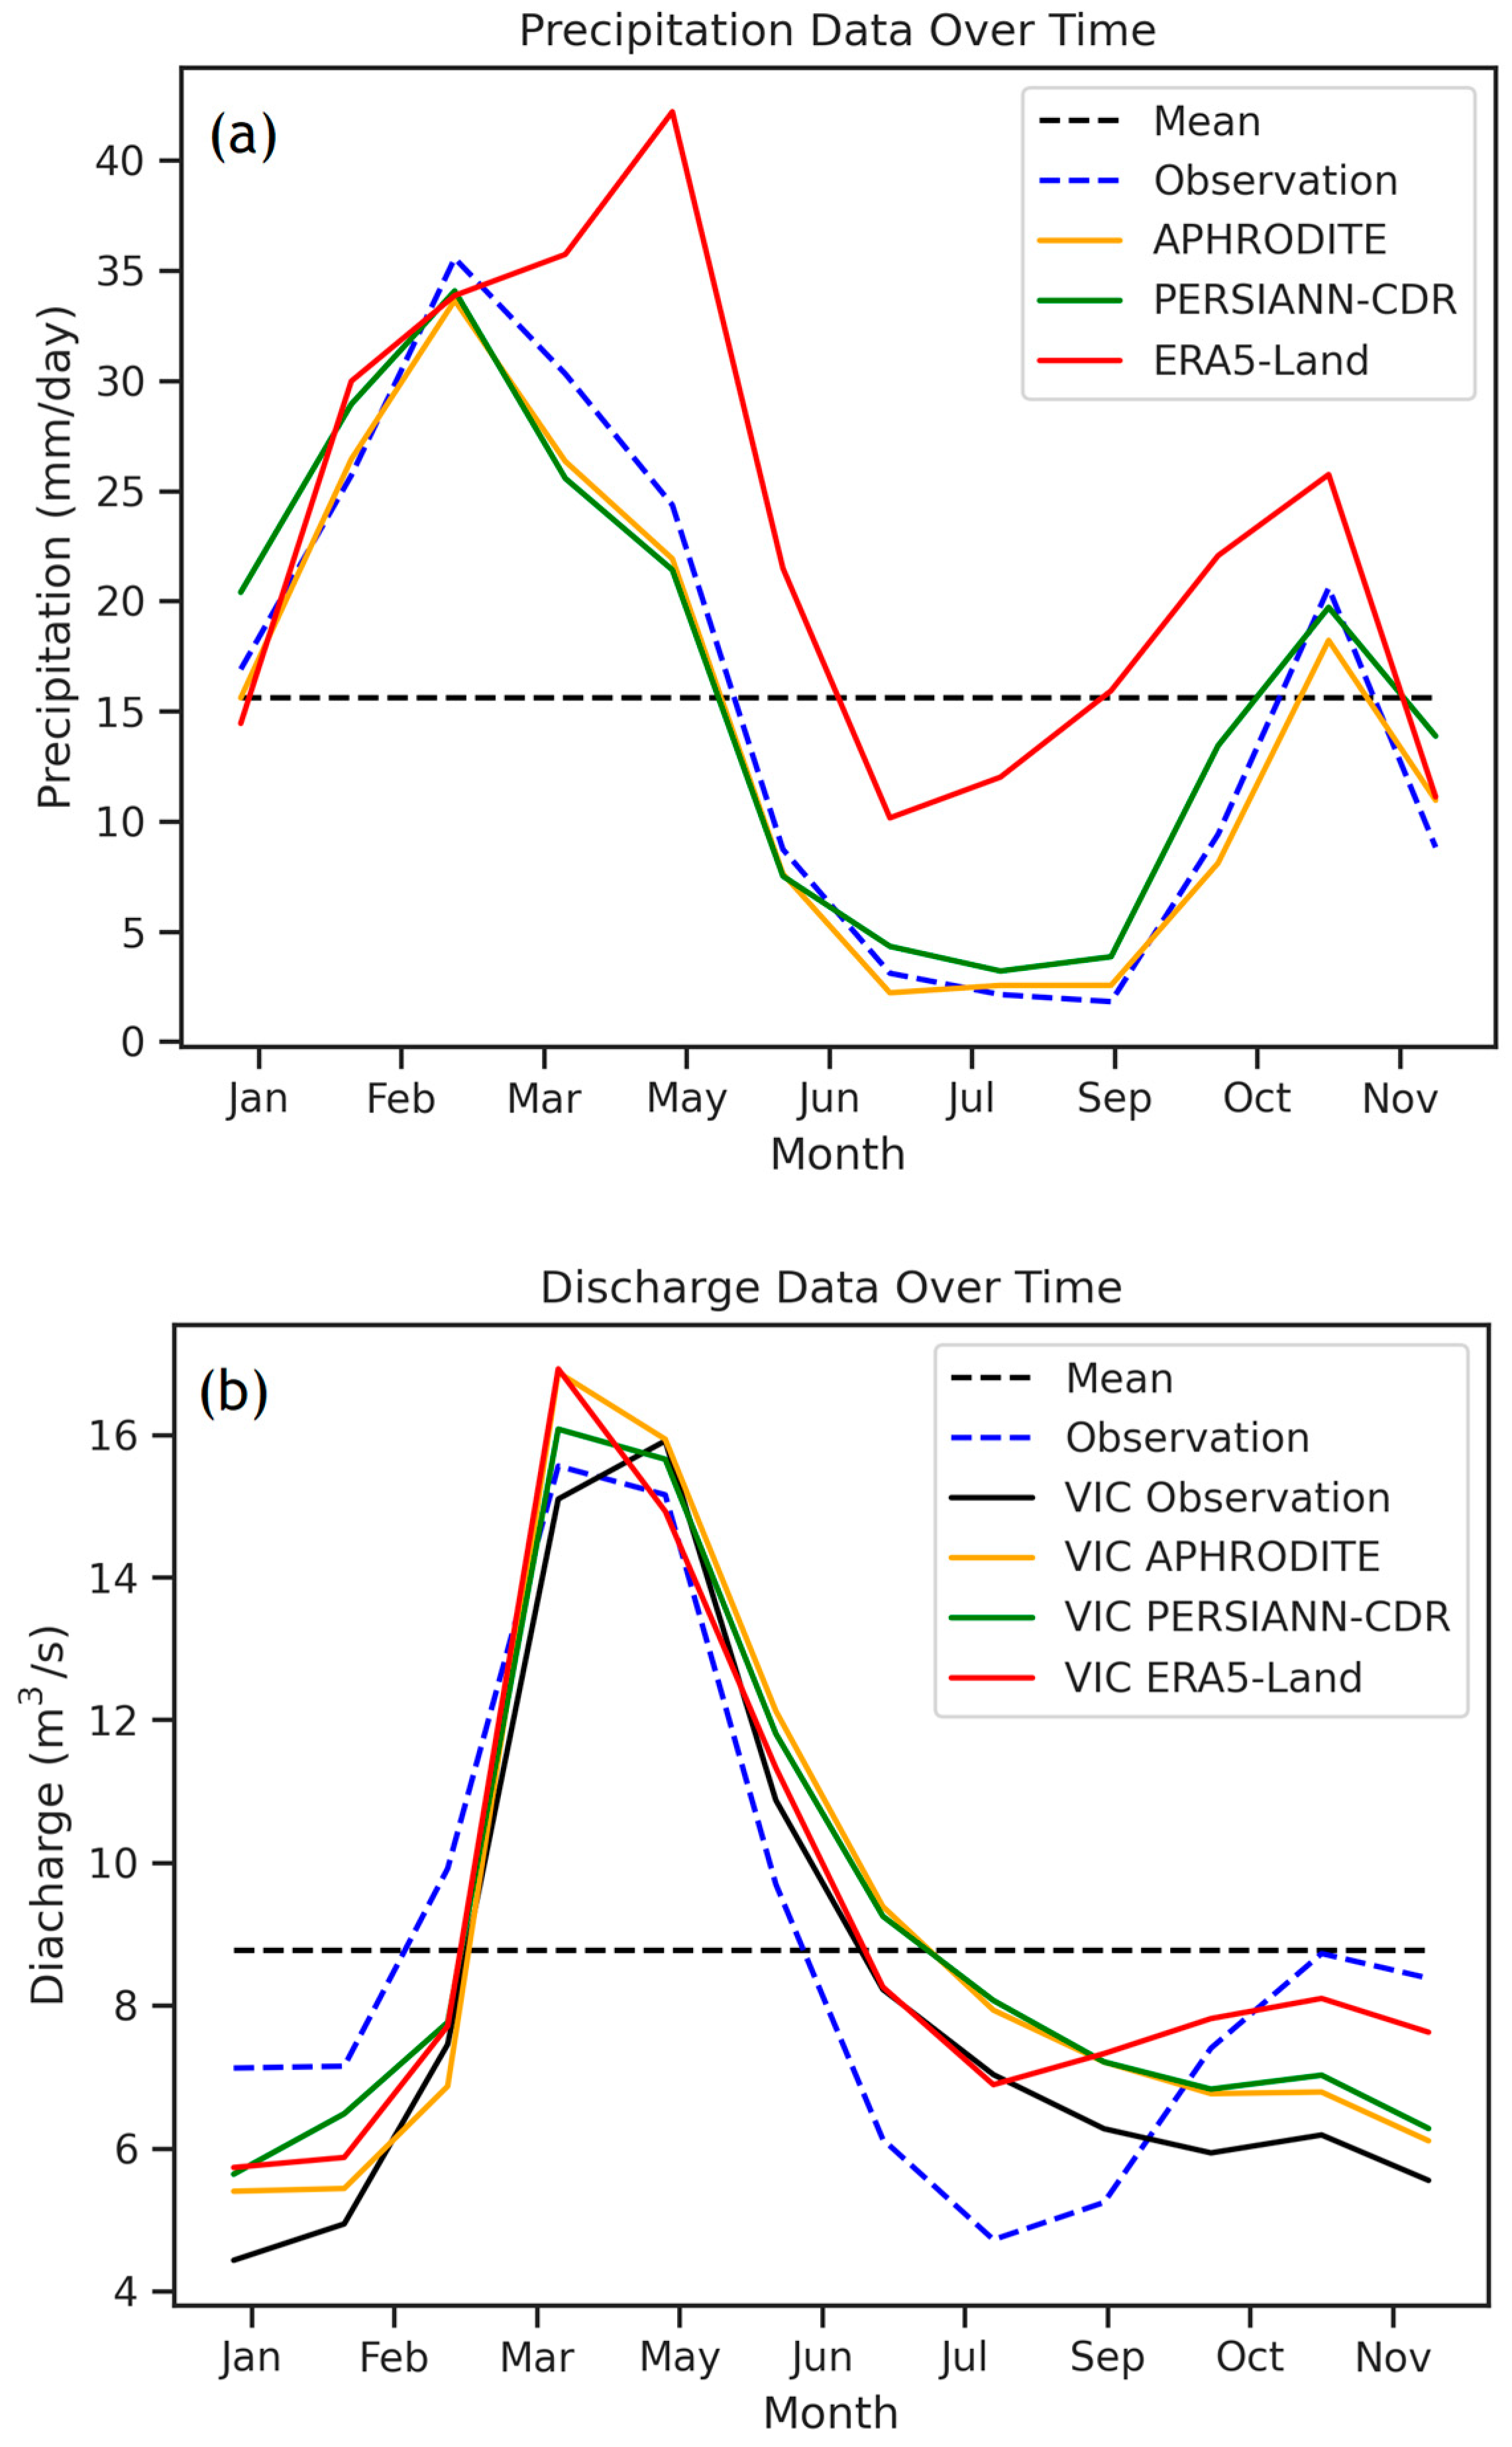
3.2.2. Monthly Result Evaluation

For the simulation of runoff on a daily basis, the VIC hydrological model was employed. Then, the results were converted to a monthly scale to compare them with the observed monthly runoff at Bonekoh station. The results are presented in Table 5 and Figure 5, Figures S4 and S5.
Table 4 shows that the runoff simulated using the interpolated precipitation data of the rain gauge stations of the Ministry of Energy had a high accuracy on a monthly scale. The efficiency coefficient of the KGE for this data series in the calibration period was equal to 0.86, and for the validation period, it was equal to 0.83, which was slightly higher than this coefficient in the daily scale. Figure 5 shows that the model did not perform well in simulating the runoff in the months when water harvesting was performed for agricultural purposes; on the other hand, it was able to estimate the maximum runoff with reasonable accuracy. The line of best fit in Figures S4a and S5a shows that in both simulation periods, the estimated runoff amount was less than the amount recorded at Bonekoh Hydrometric Station.
Based on the KGE and the CC presented in Table 4, the PERSIANN-CDR precipitation data performed better than other precipitation data in the runoff estimation during the calibration period. The KGE values for the PERSIANN-CDR, APHRODIATE, and ERA5-Land precipitation datasets were equal to 0.76, 0.71, and 0.59, respectively, and the order of superiority of these data in runoff simulation was repeated on a daily scale and on a monthly scale. Two precipitation datasets, ERA5-Land and APHRODITE, tended to underestimate the runoff, while PERSIANN-CDR overestimated the runoff. The line of best fit in Figure S4, like for the daily runoff simulation results, shows that these three data series estimated the minimum runoff more than the observations, which is related to the irrigation period of agricultural lands, while the maximum discharges were generally estimated less than the observations.
According to Table 5, the error level decreased in the monthly scale compared to the daily scale. The RMSE values were calculated for the precipitation datasets in simulating monthly runoff, showing a reduction greater than 1 m3/s. This indicates a higher accuracy of these datasets in monthly simulation. Additionally, the NSE values significantly increased for all four datasets, reaching 0.46 for the ERA5-Land dataset in the calibration period and 0.52 in the validation period. This index was relatively consistent for each of the other three datasets in both calibration and validation periods, with values of 0.73, 0.69, and 0.60 for the observed precipitation and PERSIANN-CDR and APHRODITE datasets, respectively.
During the validation period of all three precipitation datasets, the runoff was overestimated, which is reflected in the value of α being greater than 1, as well as the line of best fit in Figure S5. Based on the calibration objective function, the best performance in this period was related to the APHRODITE precipitation data with a KGE equal to 0.79, which was 0.77 for PERSIANN-CDR and 0.72 for ERA5-Land. The highest correlation was related to the PERSIANN-CDR precipitation data, while this same precipitation dataset had the lowest correlation compared to the rain gauge stations. Figure 5 and Figure S5 show that the APHRODITE precipitation data had a better accuracy in estimating the maximum flow, while the PERSIANN-CDR precipitation data estimated the minimum flow better, but on the other hand overestimated the maximum flow. The ERA5-Land precipitation dataset had inappropriate accuracy in estimating minimum discharges and overestimated them. Although the results of this study indicate that the PERSIANN-CDR dataset performs better than ERA5-Land in simulating runoff on monthly and daily scales, although the findings of Ougahi et al. (2022) [81] contradict these results. However, the modeling results of Usman et al. (2022) [82] showed that the accuracy of simulating runoff using both the APHRODITE and PERSIANN-CDR datasets was comparable and better than ERA5-Land, which is consistent with the findings of this study.
Figure 6b, representing the monthly average runoff over the period for various precipitation datasets, indicates that models had a better accuracy in simulating runoff during high-precipitation months compared to low-precipitation months. As the precipitation decreased and approached the water harvesting period for agricultural purposes in the region (approximately in July), the natural river regime changed, and the models lacked the capability to adequately simulate runoff. During the calibration process, where the focus was primarily on solving a numerical problem rather than being hydrologically sound, efforts were made to reduce errors. In this process, as runoff decreased, the optimization objective function improved, while errors were introduced for other months where water extraction did not occur, resulting in underestimation of the runoff in these months compared to the actual amounts.

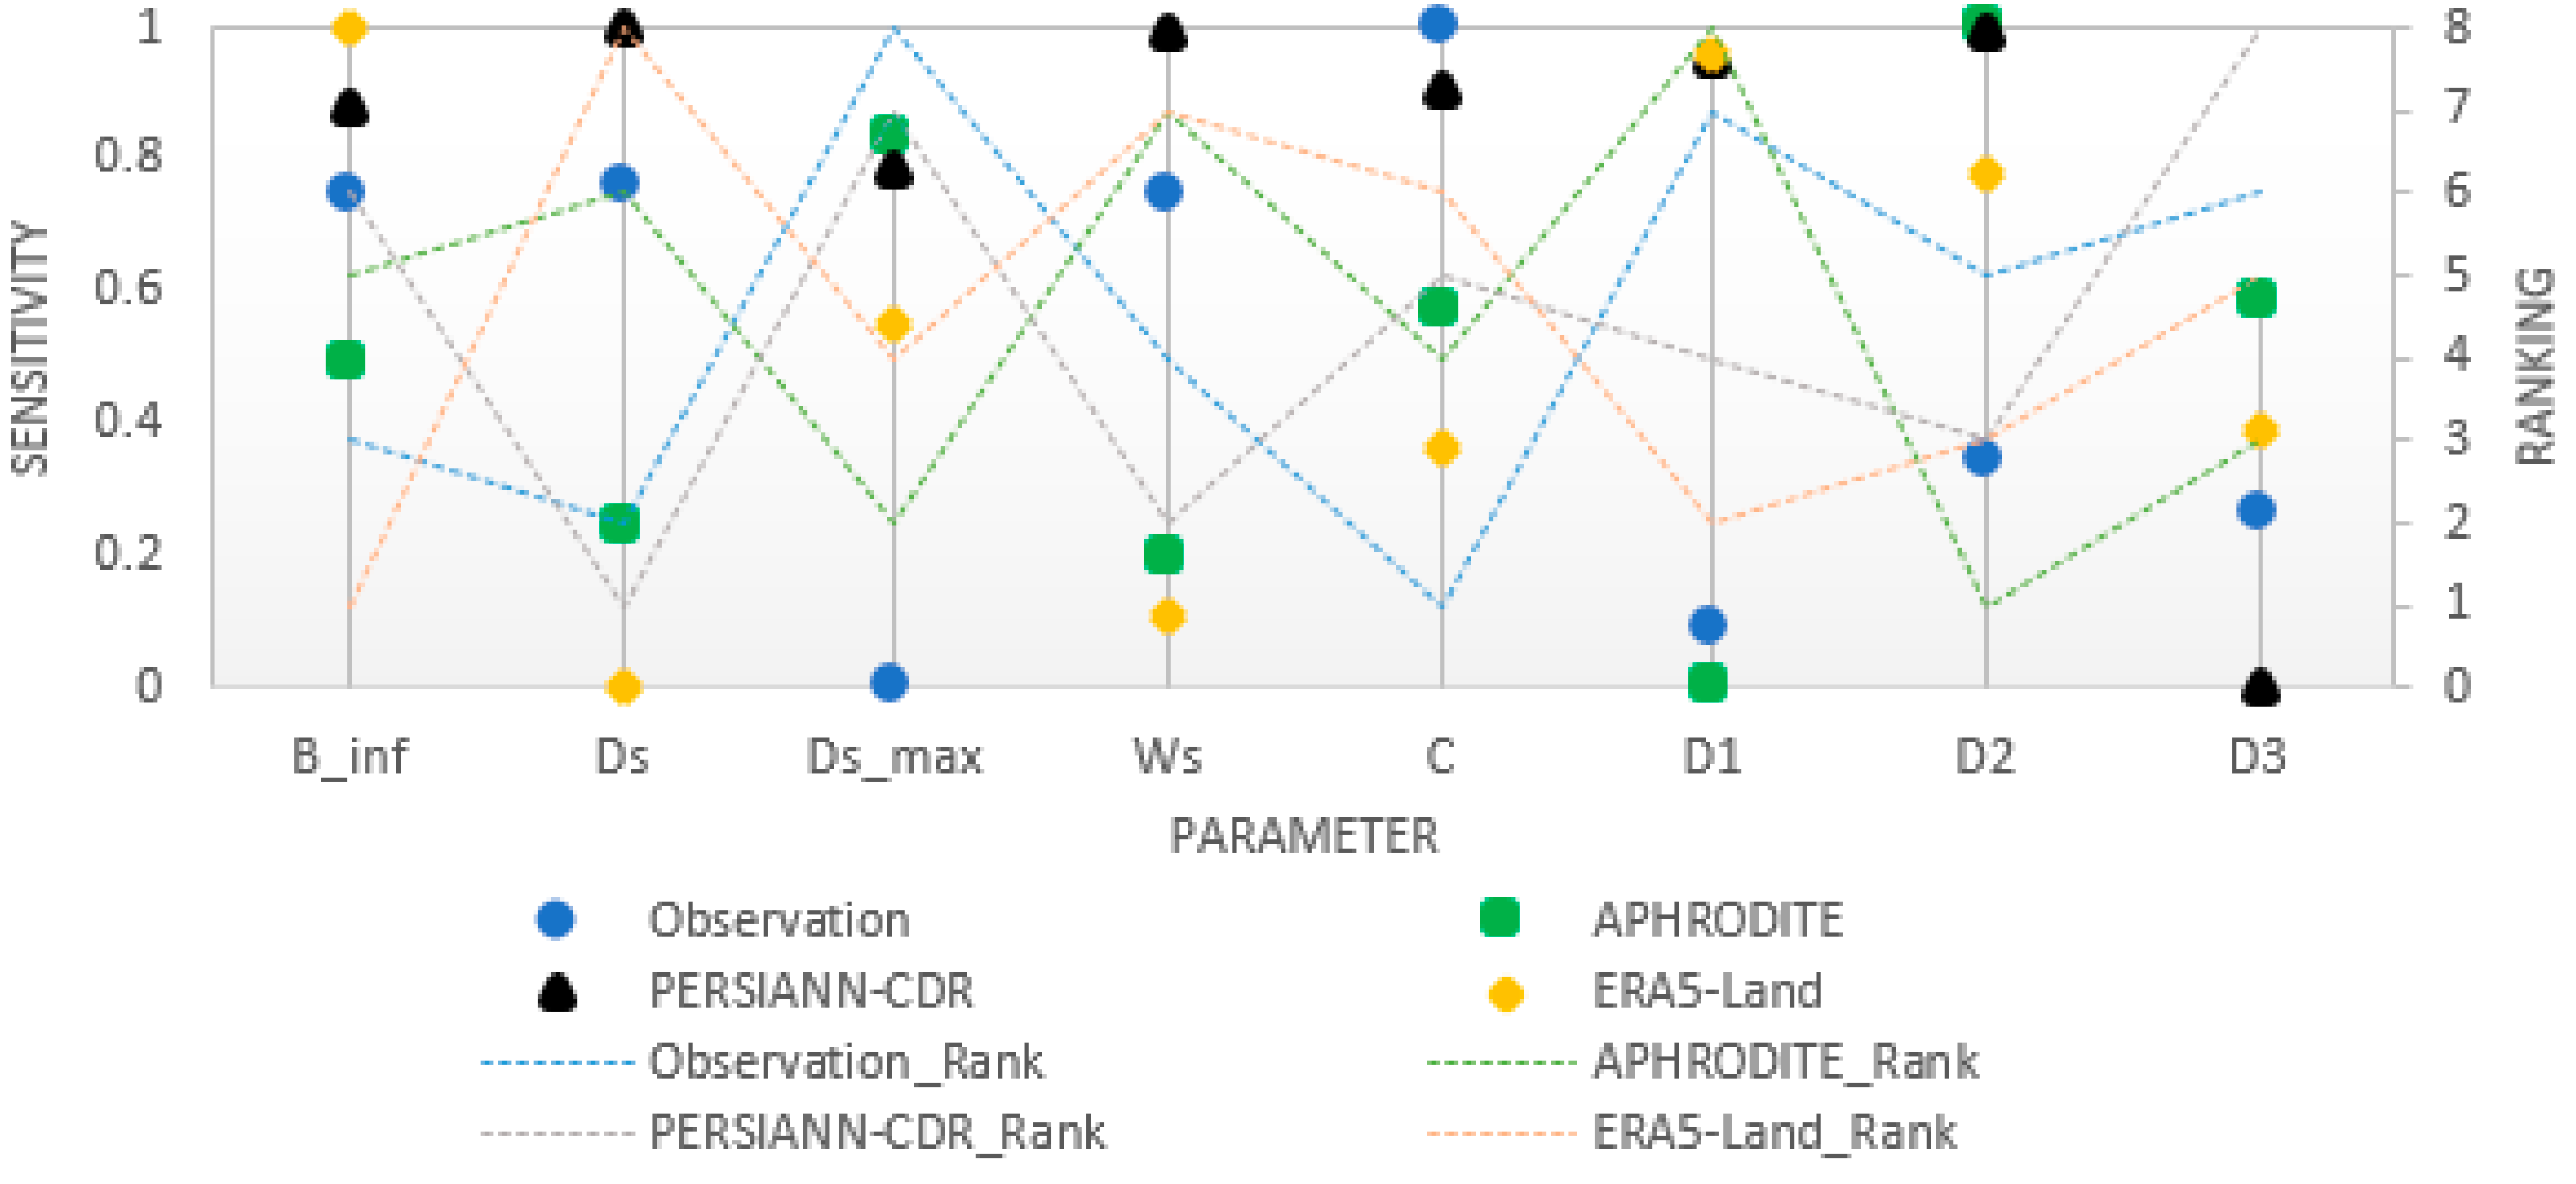
3.3. Sensitivity Analysis

The sensitivity analysis results, which were normalized for better comparison, are presented in Figure 7. These results indicate that there was no significant relationship between the sensitivity of the different precipitation data. The most sensitive parameters that could be recognized as the most effective parameters for all four precipitation datasets were the Binf and D2 parameters. For the observed precipitation data, the most effective parameters were C, Ds, and Binf, which indicated a higher sensitivity of the model to baseflow.
The sensitivity analysis results of the model using the APHRODITE precipitation dataset showed that the model had a higher sensitivity to the second and third soil layers. On the other hand, the sensitivity analysis of the model using the PERSIANN-CDR precipitation dataset showed that the model had similar sensitivity to observational precipitation data. For this dataset, Ds, Ws, and D2 were identified as the most important and sensitive parameters in the model. On the subject of the ERA5-Land precipitation data, according to its sensitivity analysis, it can be understood that it performed differently from other datasets, to the extent that D1, which was an unimportant parameter for other precipitation data, was ranked second in terms of importance for this dataset. Also, Ds, which was an important and key parameter in calibrating the model for the observational and PERSIANN-CDR datasets, was ranked last in terms of importance. Considering the obtained results, the calibration parameters for the APHRODITE dataset included Binf, Dsmax, C, D2, and D3, while for the PERSIANN-CDR dataset, all parameters except D3 were selected. For the ERA5-Land dataset, parameters Binf, Dsmax, D1, D2, and D3 were chosen, and the remaining parameters were determined based on the calibration results of the model with the observational data.
From another perspective, the numerical value of the precipitation sensitivity analysis showed that the model had fewer sensitive parameters for the observational data, with only four important parameters and four other parameters playing a significant role in model validation. Also, although the APHRODITE precipitation dataset had different sensitive parameters compared to the observational precipitation data, the number of sensitive parameters was similar to the observational data at four parameters. However, the PERSIANN-CDR precipitation dataset, which had a high error rate compared to the observational precipitation data, had more sensitive parameters than all precipitation data. The sensitivity analysis results of these precipitation data showed that the model was not only sensitive to the third soil layer, but that other parameter values must be determined with great care in the calibration process. According to the sensitivity analysis of the model using the ERA5-Land precipitation dataset, it could be seen that the model had fewer sensitive parameters with the help of these data, similar to the observational and APHRODITE precipitation datasets.

4. Conclusions

In this research, runoff was simulated based on three global climatic precipitation datasets as the input for a VIC model. The selected case study was a well-monitored basin in terms of observation stations, but due to agricultural harvests, it was not modeled using a VIC hydrological model. In order to assess the accuracy of a minimum precipitation dataset, these data were evaluated against the results of a cell with the interpolated data of rain stations. Next, to evaluate the capability of the VIC hydrological model in this area, runoff was simulated using interpolated precipitation data from the rain gauges, and the results were compared with the climatic precipitation data at daily and monthly time scales.
The subject of consideration in this research was most of the water in the agricultural sector, which caused the modeling to face a lot of error. These harvests were carried out intermittently and depending on the conditions of each sub-basin, starting from May to November, but from June to October, they were carried out in an integrated fashion at the basin level (studies on the integrated water and soil management of the Hablehroud watershed, Deputy Watershed Ministry of Jahad Agriculture, 1998).
The main results of this research can be summarized as the following:
  • In the Hablehroud watershed, the APHRODITE precipitation dataset had better performance than the PERSIANN-CDR and ERA5-Land. This was due to the nature of this precipitation dataset, which is based on the interpolation of precipitation over ground stations. Although the ERA5-Land precipitation dataset had better accuracy in detecting rainfall events, it had a high deviation rate, which reached more than 200% in one case, making it rank third, and the PERSIANN-CDR precipitation dataset ranked second in terms of its performance.
  • The VIC hydrological model of the northern Hablehroud watershed showed good performance in the runoff simulations at the daily and monthly scales using precipitation datasets from rain gauge stations operated by the Ministry of Energy. Also, the results showed that the APHRODITE and PERSIANN-CDR precipitation datasets had a similar performance, with interpolated observed precipitation data in the runoff simulation, despite the differences in their accuracy in precipitation estimation. The ERA5-Land precipitation data largely overestimated runoff estimation due to high deviation in precipitation estimation.
  • Although the APHRODITE precipitation dataset had a better performance in estimating the amount of precipitation and also in detecting the actual rainfall, the PERSIANN-CDR performed better in simulating runoff in both the calibration and validation periods, on a daily scale. This result is similar to the result presented by Shayeghi et al. (2020), which showed that although the ERA-Interim reanalysis precipitation dataset is more accurate in estimating precipitation itself, the PERSIANN dataset performs better in estimating runoff [31]. Therefore, the superiority of a precipitation dataset compared to rain gauges cannot be the sole reason for the superiority of those data in runoff simulation, and their hydrological performance can be different.
  • Based on the sensitivity analysis of the precipitation datasets, it can be concluded that not only did each of the precipitation datasets have different sensitivity values for their parameters, they also had varying numbers of sensitive parameters. It appears that the precipitation dataset with higher errors had more sensitive parameters, and in order to achieve better calibration results, more parameters of a model may need to be adjusted. However, the results showed that even a precipitation dataset with a lower accuracy may still provide acceptable results in simulating runoff.

Supplementary Materials

The following supporting information can be downloaded at: https://www.mdpi.com/article/10.3390/w16071028/s1, Figure S1: Monthly average rainfall during 1992–1996 over the Hablehroud basin; Figure S2: Scatter plot of monthly observation streamflow (horizontal axis) and simulated daily streamflow using: (a) Observed rain gauge stations (vertical axis); (b) APHRODITE dataset (vertical axis); (c) PERSIANN-CDR dataset (vertical axis); (d) ERA5-Land (vertical axis) in calibration period; Figure S3: Scatter plot of monthly observation streamflow (horizontal axis) and simulated daily streamflow using: (a) Observed rain gauge stations (vertical axis); (b) APHRODITE dataset (vertical axis); (c) PERSIANN-CDR dataset (vertical axis); (d) ERA5-Land (vertical axis) in validation period; Figure S4: Scatter plot of monthly observation streamflow (horizontal axis) and simulated monthly streamflow using: (a) Observed rain gauge stations (vertical axis); (b) APHRODITE dataset (vertical axis); (c) PERSIANN-CDR dataset (vertical axis); (d) ERA5-Land (vertical axis) in calibration period; Figure S5: Scatter plot of monthly observation streamflow (horizontal axis) and simulated monthly streamflow using: (a) Observed rain gauge station (vertical axis); (b) APHRODITE dataset (vertical axis); (c) PERSIANN-CDR dataset (vertical axis); (c) ERA5-Land (vertical axis) in validation period; Figure S6: Distribution of CC, PBias, RMSE, KGE, POD, FAR, and CSI of APHRPDATE (column 1), ERA5-Land (column 2), and PERSIANN-CDR (column 3) datasets over the Hablehroud watershed; Table S1: Statistical metrics used for evaluating of precipitation datasets and simulated runoff.

Author Contributions

Conceptualization, H.S., S.G. (Saeid Gharechelou) and S.G. (Saeed Golian); methodology, H.S., S.G. (Saeid Gharechelou) and S.G. (Saeed Golian); software, H.S.; validation, H.S., S.G. (Saeid Gharechelou) and S.G. (Saeed Golian); formal analysis, H.S.; investigation, H.S. and S.G. (Saeid Gharechelou); resources, H.S. and S.G. (Saeid Gharechelou); data curation, H.S.; writing—original draft preparation, H.S., S.G. (Saeid Gharechelou) and S.G. (Saeed Golian); writing—review and editing, H.S., S.G. (Saeid Gharechelou), M.R. and B.G.; visualization, H.S.; supervision, S.G. (Saeid Gharechelou) and S.G. (Saeed Golian); project administration, S.G. (Saeid Gharechelou). All authors have read and agreed to the published version of the manuscript.

Funding

This research received no external funding.

Data Availability Statement

The PERSIANN-CDR, ERA5- Land, and APHRODITE datasets are publicly available at https://chrsdata.eng.uci.edu (accessed on 30 September 2023), https://cds.climate.copernicus.eu/cdsapp#!/dataset/reanalysis-era5-land?tab=form (accessed on 23 March 2024), and http://aphrodite.st.hirosaki-u.ac.jp/index.html (accessed on 31 December 2007), respectively.

Conflicts of Interest

Author Saeed Golian was employed by the company SRK Consulting (UK) Ltd. The remaining authors declare that the research was conducted in the absence of any commercial or financial relationships that could be construed as a potential conflict of interest.

References

  1. Gemechu, T.M.; Zhao, H.; Bao, S.; Yangzong, C.; Liu, Y.; Li, F.; Li, H. Estimation of hydrological components under current and future climate scenarios in guder catchment, upper Abbay Basin, Ethiopia, using the swat. Sustainability 2021, 13, 9689. [Google Scholar] [CrossRef]
  2. Zhao, Q.; Tan, X.; Zeng, Q.; Zhao, H.; Wu, J.-W.; Huang, J.-S. Combined effects of temperature and precipitation on the spring runoff generation process in a seasonal freezing agricultural watershed. Environ. Earth Sci. 2021, 80, 490. [Google Scholar] [CrossRef]
  3. Meyer Oliveira, A.; Fleischmann, A.; Cauduro Dias de Paiva, R. On the contribution of remote sensing-based calibration to model hydrological and hydraulic processes in tropical regions. J. Hydrol. 2021, 597, 126184. [Google Scholar] [CrossRef]
  4. Abdi, D.; Ayenew, T. Evaluation of the WEAP model in simulating subbasin hydrology in the Central Rift Valley basin, Ethiopia. Ecol. Process. 2021, 10, 41. [Google Scholar] [CrossRef]
  5. Li, M.; Di, Z.; Duan, Q. Effect of sensitivity analysis on parameter optimization: Case study based on streamflow simulations using the SWAT model in China. J. Hydrol. 2021, 603, 126896. [Google Scholar] [CrossRef]
  6. Zhang, Y.; Ju, Q.; Zhang, L.; Xu, C.-Y.; Lai, X. Evaluation and hydrological application of four gridded precipitation datasets over a large Southeastern Tibetan Plateau Basin. Remote Sens. 2022, 14, 2936. [Google Scholar] [CrossRef]
  7. Fallah, A.; Rakhshandehroo, G.R.; Berg, P.; O, S.; Orth, R. Evaluation of precipitation datasets against local observations in southwestern Iran. Int. J. Climatol. 2020, 40, 4102–4116. [Google Scholar] [CrossRef]
  8. Zhu, B.; Xie, X.; Lu, C.; Lei, T.; Wang, Y.; Jia, K.; Yao, Y. Extensive evaluation of a continental-scale high-resolution hydrological model using remote sensing and ground-based observations. Remote Sens. 2021, 13, 1247. [Google Scholar] [CrossRef]
  9. Xu, R.; Tian, F.; Yang, L.; Hu, H.; Lu, H.; Hou, A. Ground validation of GPM IMERG and TRMM 3B42V7 rainfall products over southern Tibetan Plateau based on a high-density rain gauge network. J. Geophys. Res. Atmos. 2017, 122, 910–924. [Google Scholar] [CrossRef]
  10. Mosaffa, H.; Sadeghi, M.; Hayatbini, N.; Afzali Gorooh, V.; Akbari Asanjan, A.; Nguyen, P.; Sorooshian, S. Spatiotemporal Variations of Precipitation over Iran Using the High-Resolution and Nearly Four Decades Satellite-Based PERSIANN-CDR Dataset. Remote Sens. 2020, 12, 1584. [Google Scholar] [CrossRef]
  11. Salmani-Dehaghi, N.; Samani, N. Development of bias-correction PERSIANN-CDR models for the simulation and completion of precipitation time series. Atmos. Environ. 2021, 246, 117981. [Google Scholar] [CrossRef]
  12. Sun, Q.; Miao, C.; Duan, Q.; Ashouri, H.; Sorooshian, S.; Hsu, K.L. A review of global precipitation data sets: Data sources, estimation, and intercomparisons. Rev. Geophys. 2018, 56, 79–107. [Google Scholar] [CrossRef]
  13. He, Z.; Yang, L.; Tian, F.; Ni, G.; Hou, A.; Lu, H. Intercomparisons of rainfall estimates from TRMM and GPM multisatellite products over the Upper Mekong River Basin. J. Hydrometeorol. 2017, 18, 413–430. [Google Scholar] [CrossRef]
  14. He, Z.; Hu, H.; Tian, F.; Ni, G.; Hu, Q. Correcting the TRMM rainfall product for hydrological modelling in sparsely-gauged mountainous basins. Hydrol. Sci. J. 2017, 62, 306–318. [Google Scholar] [CrossRef]
  15. Yatagai, A.; Kamiguchi, K.; Arakawa, O.; Hamada, A.; Yasutomi, N.; Kitoh, A. APHRODITE: Constructing a Long-Term Daily Gridded Precipitation Dataset for Asia Based on a Dense Network of Rain Gauges. Bull. Am. Meteorol. Soc. 2012, 93, 1401–1415. [Google Scholar] [CrossRef]
  16. Ashouri, H.; Hsu, K.-L.; Sorooshian, S.; Braithwaite, D.K.; Knapp, K.R.; Cecil, L.D.; Nelson, B.R.; Prat, O.P. PERSIANN-CDR: Daily precipitation climate data record from multisatellite observations for hydrological and climate studies. Bull. Am. Meteorol. Soc. 2015, 96, 69–83. [Google Scholar] [CrossRef]
  17. Santos, C.A.G.; Neto, R.M.B.; do Nascimento, T.V.M.; da Silva, R.M.; Mishra, M.; Frade, T.G. Geospatial drought severity analysis based on PERSIANN-CDR-estimated rainfall data for Odisha state in India (1983–2018). Sci. Total Environ. 2021, 750, 141258. [Google Scholar] [CrossRef]
  18. Alijanian, M.; Rakhshandehroo, G.R.; Mishra, A.; Dehghani, M. Evaluation of remotely sensed precipitation estimates using PERSIANN-CDR and MSWEP for spatio-temporal drought assessment over Iran. J. Hydrol. 2019, 579, 124189. [Google Scholar] [CrossRef]
  19. Yang, N.; Yu, H.; Lu, Y.; Zhang, Y.; Zheng, Y. Evaluating the Applicability of PERSIANN-CDR Products in Drought Monitoring: A Case Study of Long-Term Droughts over Huaihe River Basin, China. Remote Sens. 2022, 14, 4460. [Google Scholar] [CrossRef]
  20. Sobral, B.S.; de Oliveira-Júnior, J.F.; Alecrim, F.; Gois, G.; Muniz-Júnior, J.G.; de Bodas Terassi, P.M.; Pereira-Júnior, E.R.; Lyra, G.B.; Zeri, M. PERSIANN-CDR based characterization and trend analysis of annual rainfall in Rio De Janeiro State, Brazil. Atmos. Res. 2020, 238, 104873. [Google Scholar] [CrossRef]
  21. Arvor, D.; Funatsu, B.; Michot, V.; Dubreuil, V. Monitoring Rainfall Patterns in the Southern Amazon with PERSIANN-CDR Data: Long-Term Characteristics and Trends. Remote Sens. 2017, 9, 889. [Google Scholar] [CrossRef]
  22. Hersbach, H.; Bell, B.; Berrisford, P.; Hirahara, S.; Horányi, A.; Muñoz-Sabater, J.; Nicolas, J.; Peubey, C.; Radu, R.; Schepers, D. The ERA5 global reanalysis. Q. J. R. Meteorol. Soc. 2020, 146, 1999–2049. [Google Scholar] [CrossRef]
  23. Bhattacharya, T.; Khare, D.; Arora, M. Evaluation of reanalysis and global meteorological products in Beas river basin of North-Western Himalaya. Environ. Syst. Res. 2020, 9, 24. [Google Scholar] [CrossRef]
  24. Tang, G.; Clark, M.P.; Papalexiou, S.M.; Newman, A.J.; Wood, A.W.; Brunet, D.; Whitfield, P.H. EMDNA: An Ensemble Meteorological Dataset for North America. Earth Syst. Sci. Data 2021, 13, 3337–3362. [Google Scholar] [CrossRef]
  25. Guo, J.; Zhang, J.; Yang, K.; Liao, H.; Zhang, S.; Huang, K.; Lv, Y.; Shao, J.; Yu, T.; Tong, B. Investigation of near-global daytime boundary layer height using high-resolution radiosondes: First results and comparison with ERA-5, MERRA-2, JRA-55, and NCEP-2 reanalyses. Atmos. Chem. Phys. Discuss. 2021, 21, 17079–17097. [Google Scholar] [CrossRef]
  26. Dullaart, J.C.M.; Muis, S.; Bloemendaal, N.; Aerts, J.C.J.H. Advancing global storm surge modelling using the new ERA5 climate reanalysis. Clim. Dyn. 2020, 54, 1007–1021. [Google Scholar] [CrossRef]
  27. Harrigan, S.; Zsoter, E.; Alfieri, L.; Prudhomme, C.; Salamon, P.; Wetterhall, F.; Barnard, C.; Cloke, H.; Pappenberger, F. GloFAS-ERA5 operational global river discharge reanalysis 1979–present. Earth Syst. Sci. Data 2020, 12, 2043–2060. [Google Scholar] [CrossRef]
  28. Lee, S.; Lee, S.-J.; Jang, K.; Chun, J.-H. Drought Monitoring Based on Vegetation Type and Reanalysis Data in Korea. Atmosphere 2021, 12, 170. [Google Scholar] [CrossRef]
  29. Tsering, K.; Shrestha, M.; Shakya, K.; Bajracharya, B.; Matin, M.; Lozano, J.L.S.; Nelson, J.; Wangchuk, T.; Parajuli, B.; Bhuyan, M.A. Verification of two hydrological models for real-time flood forecasting in the Hindu Kush Himalaya (HKH) region. Nat. Hazards 2021, 110, 1821–1845. [Google Scholar] [CrossRef]
  30. Wei, L.; Jiang, S.; Ren, L.; Wang, M.; Zhang, L.; Liu, Y.; Yuan, F.; Yang, X. Evaluation of seventeen satellite-, reanalysis-, and gauge-based precipitation products for drought monitoring across mainland China. Atmos. Res. 2021, 263, 105813. [Google Scholar] [CrossRef]
  31. Tan, M.L.; Gassman, P.W.; Cracknell, A.P. Assessment of three long-term gridded climate products for hydro-climatic simulations in tropical river basins. Water 2017, 9, 229. [Google Scholar] [CrossRef]
  32. Ajaaj, A.A.; Mishra, A.K.; Khan, A.A. Evaluation of Satellite and Gauge-Based Precipitation Products through Hydrologic Simulation in Tigris River Basin under Data-Scarce Environment. J. Hydrol. Eng. 2019, 24, 05018033. [Google Scholar] [CrossRef]
  33. Wedyan, A.; Whalley, J.; Narayanan, A. Hydrological cycle algorithm for continuous optimization problems. J. Optim. 2017, 2017, 3828420. [Google Scholar] [CrossRef]
  34. Braga, R.C.; Rosenfeld, D.; Krüger, O.O.; Ervens, B.; Holanda, B.A.; Wendisch, M.; Krisna, T.; Pöschl, U.; Andreae, M.O.; Voigt, C.; et al. Linear relationship between effective radius and precipitation water content near the top of convective clouds: Measurement results from ACRIDICON–CHUVA campaign. Atmos. Chem. Phys. 2021, 21, 14079–14088. [Google Scholar] [CrossRef]
  35. Shayeghi, A.; Azizian, A.; Brocca, L. Reliability of reanalysis and remotely sensed precipitation products for hydrological simulation over the Sefidrood River Basin, Iran. Hydrol. Sci. J. 2020, 65, 296–310. [Google Scholar] [CrossRef]
  36. Adam, J.C.; Lettenmaier, D.P. Adjustment of global gridded precipitation for systematic bias. J. Geophys. Res. Atmos. 2003, 108. [Google Scholar] [CrossRef]
  37. Lin, X.; Hubbard, K.G. Sensor and Electronic Biases/Errors in Air Temperature Measurements in Common Weather Station Networks. J. Atmos. Ocean. Technol. 2004, 21, 1025–1032. [Google Scholar] [CrossRef]
  38. Scaff, L.; Yang, D.; Li, Y.; Mekis, E. Inconsistency in precipitation measurements across the Alaska–Yukon border. Cryosphere 2015, 9, 2417–2428. [Google Scholar] [CrossRef]
  39. Beck, H.E.; Vergopolan, N.; Pan, M.; Levizzani, V.; Van Dijk, A.I.; Weedon, G.P.; Brocca, L.; Pappenberger, F.; Huffman, G.J.; Wood, E.F. Global-scale evaluation of 22 precipitation datasets using gauge observations and hydrological modeling. Hydrol. Earth Syst. Sci. 2017, 21, 6201–6217. [Google Scholar] [CrossRef]
  40. Strauch, M.; Bernhofer, C.; Koide, S.; Volk, M.; Lorz, C.; Makeschin, F. Using precipitation data ensemble for uncertainty analysis in SWAT streamflow simulation. J. Hydrol. 2012, 414, 413–424. [Google Scholar] [CrossRef]
  41. Huffman, G.J.; Bolvin, D.T.; Nelkin, E.J.; Wolff, D.B.; Adler, R.F.; Gu, G.; Hong, Y.; Bowman, K.P.; Stocker, E.F. The TRMM multisatellite precipitation analysis (TMPA): Quasi-global, multiyear, combined-sensor precipitation estimates at fine scales. J. Hydrometeorol. 2007, 8, 38–55. [Google Scholar] [CrossRef]
  42. Sheridan, S.C.; Lee, C.C.; Smith, E.T. A comparison between station observations and reanalysis data in the identification of extreme temperature events. Geophys. Res. Lett. 2020, 47, e2020GL088120. [Google Scholar] [CrossRef]
  43. Fan, W.; Liu, Y.; Chappell, A.; Dong, L.; Xu, R.; Ekström, M.; Fu, T.-M.; Zeng, Z. Evaluation of global reanalysis land surface wind speed trends to support wind energy development using in situ observations. J. Appl. Meteorol. Climatol. 2021, 60, 33–50. [Google Scholar] [CrossRef]
  44. Seyed Ali, S.; Rahimi, m.; Dastourani, J.; Khosroshahi, M. Trend Analysis of Hydroclimatological Parameters and Detection of Manageral Changes in Water Resources Conditions of Hablerood Watershed. Iran. J. Range Desert Res. 2016, 23, 555–566. [Google Scholar] [CrossRef]
  45. Liang, X.; Lettenmaier, D.P.; Wood, E.F.; Burges, S.J. A simple hydrologically based model of land surface water and energy fluxes for general circulation models. J. Geophys. Res. Atmos. 1994, 99, 14415–14428. [Google Scholar] [CrossRef]
  46. Gao, H.; Tang, Q.; Shi, X.; Zhu, C.; Bohn, T.; Su, F.; Pan, M.; Sheffield, J.; Lettenmaier, D.; Wood, E. Water Budget Record from Variable Infiltration Capacity (VIC) Model. 2010. Available online: https://www.researchgate.net/profile/John-Xiaogang-Shi/publication/268367169_Water_Budget_Record_from_Variable_Infiltration_Capacity_VIC_Model/links/55715dee08aee701d61cc286/Water-Budget-Record-from-Variable-Infiltration-Capacity-VIC-Model.pdf (accessed on 27 March 2024).
  47. Lohmann, D.; Nolte-Holube, R.; Raschke, E. A large-scale horizontal routing model to be coupled to land surface parametrization schemes. Tellus A 1996, 48, 708–721. [Google Scholar] [CrossRef]
  48. Liang, X.; Lettenmaier, D.P.; Wood, E.F. One-dimensional statistical dynamic representation of subgrid spatial variability of precipitation in the two-layer variable infiltration capacity model. J. Geophys. Res. Atmos. 1996, 101, 21403–21422. [Google Scholar] [CrossRef]
  49. Wagener, T.; Boyle, D.P.; Lees, M.J.; Wheater, H.S.; Gupta, H.V.; Sorooshian, S. A framework for development and application of hydrological models. Hydrol. Earth Syst. Sci. 2001, 5, 13–26. [Google Scholar] [CrossRef]
  50. Foglia, L.; Hill, M.C.; Mehl, S.W.; Burlando, P. Sensitivity analysis, calibration, and testing of a distributed hydrological model using error-based weighting and one objective function. Water Resour. Res. 2009, 45. [Google Scholar] [CrossRef]
  51. Zhang, C.; Chu, J.; Fu, G. Sobol′s sensitivity analysis for a distributed hydrological model of Yichun River Basin, China. J. Hydrol. 2013, 480, 58–68. [Google Scholar] [CrossRef]
  52. Stein, M. Large sample properties of simulations using Latin hypercube sampling. Technometrics 1987, 29, 143–151. [Google Scholar] [CrossRef]
  53. Liu, H.; Clark, M.P.; Gharari, S.; Sheikholeslami, R.; Freer, J.; Knoben, W.J.; Papalexiou, S.M. pyVISCOUS: An open-source tool for computationally frugal global sensitivity analysis. Authorea Prepr. 2022. [Google Scholar] [CrossRef]
  54. Deb, K.; Pratap, A.; Agarwal, S.; Meyarivan, T. A fast and elitist multiobjective genetic algorithm: NSGA-II. IEEE Trans. Evol. Comput. 2002, 6, 182–197. [Google Scholar] [CrossRef]
  55. Banikhedmat, A.; Salehi, H.; Golian, S.; Koohian Afzal, F.; Ezati Boorestan, N. Evaluation of the impact of non-aligned objective functions in multi-objective calibration of SWAT hydrological model, case study: Qarasu watershed, Kermanshah. Watershed Eng. Manag. 2023, 15, 639–654. [Google Scholar]
  56. Vu, D.T.; Dang, T.D.; Pianosi, F.; Galelli, S. Calibrating macro-scale hydrological models in poorly gauged and heavily regulated basins. Hydrol. Earth Syst. Sci. Discuss. 2023, 27, 3485–3504. [Google Scholar] [CrossRef]
  57. Yeste, P.; Melsen, L.A.; García-Valdecasas Ojeda, M.; Gámiz-Fortis, S.R.; Castro-Díez, Y.; Esteban-Parra, M.J. A Pareto-based sensitivity analysis and multi-objective calibration approach for integrating streamflow and evaporation data. Water Resour. Res. 2023, 59, e2022WR033235. [Google Scholar] [CrossRef]
  58. Dang, T.D.; Chowdhury, A.; Galelli, S. On the representation of water reservoir storage and operations in large-scale hydrological models: Implications on model parameterization and climate change impact assessments. Hydrol. Earth Syst. Sci. 2020, 24, 397–416. [Google Scholar] [CrossRef]
  59. Nachtergaele, F.; Velthuizen, H.; Verelst, L.; Wiberg, D. Harmonized World Soil Database (HWSD). Food Agric. Organ. U. N. Rome 2009. [Google Scholar]
  60. Friedl, M.; Sulla-Menashe, D. MCD12Q1 MODIS/Terra+ aqua land cover type yearly L3 global 500m SIN grid V006. NASA EOSDIS Land Process. DAAC 2019, 10, 200. [Google Scholar]
  61. Farr, T.G.; Rosen, P.A.; Caro, E.; Crippen, R.; Duren, R.; Hensley, S.; Kobrick, M.; Paller, M.; Rodriguez, E.; Roth, L. The shuttle radar topography mission. Rev. Geophys. 2007, 45. [Google Scholar] [CrossRef]
  62. Longo-Minnolo, G.; Vanella, D.; Consoli, S.; Pappalardo, S.; Ramírez-Cuesta, J.M. Assessing the use of ERA5-Land reanalysis and spatial interpolation methods for retrieving precipitation estimates at basin scale. Atmos. Res. 2022, 271, 106131. [Google Scholar] [CrossRef]
  63. Khouni, I.; Louhichi, G.; Ghrabi, A. Use of GIS based Inverse Distance Weighted interpolation to assess surface water quality: Case of Wadi El Bey, Tunisia. Environ. Technol. Innov. 2021, 24, 101892. [Google Scholar] [CrossRef]
  64. Crespi, A.; Matiu, M.; Bertoldi, G.; Petitta, M.; Zebisch, M. A high-resolution gridded dataset of daily temperature and precipitation records (1980–2018) for Trentino-South Tyrol (north-eastern Italian Alps). Earth Syst. Sci. Data 2021, 13, 2801–2818. [Google Scholar] [CrossRef]
  65. Javari, M. Comparison of interpolation methods for modeling spatial variations of Precipitation in Iran. Comp. Interpolat. Methods Model. Spat. Var. Precip. Iran 2017, 12, 1037–1054. [Google Scholar]
  66. Gong, G.; Mattevada, S.; O’Bryant, S.E. Comparison of the accuracy of kriging and IDW interpolations in estimating groundwater arsenic concentrations in Texas. Environ. Res. 2014, 130, 59–69. [Google Scholar] [CrossRef] [PubMed]
  67. Borges, P.d.A.; Franke, J.; da Anunciação, Y.M.T.; Weiss, H.; Bernhofer, C. Comparison of spatial interpolation methods for the estimation of precipitation distribution in Distrito Federal, Brazil. Theor. Appl. Climatol. 2016, 123, 335–348. [Google Scholar] [CrossRef]
  68. Di Piazza, A.; Conti, F.L.; Noto, L.V.; Viola, F.; La Loggia, G. Comparative analysis of different techniques for spatial interpolation of rainfall data to create a serially complete monthly time series of precipitation for Sicily, Italy. Int. J. Appl. Earth Obs. Geoinf. 2011, 13, 396–408. [Google Scholar] [CrossRef]
  69. Huffman, G.; Bolvin, D. GPCP Version 2 Combined Precipitation Data Set Documentation. 2007. Available online: https://iridl.ldeo.columbia.edu/documentation/NASA/GPCP/V2p2/V2.2_doc.pdf (accessed on 1 November 2015).
  70. Ghajarnia, N.; Akbari, M.; Saemian, P.; Ehsani, M.R.; Hosseini-Moghari, S.M.; Azizian, A.; Kalantari, Z.; Behrangi, A.; Tourian, M.J.; Klöve, B. Evaluating the evolution of ECMWF precipitation products using observational data for Iran: From ERA40 to ERA5. Earth Space Sci. 2022, 9, e2022EA002352. [Google Scholar] [CrossRef]
  71. Muñoz-Sabater, J.; Dutra, E.; Agustí-Panareda, A.; Albergel, C.; Arduini, G.; Balsamo, G.; Boussetta, S.; Choulga, M.; Harrigan, S.; Hersbach, H. ERA5-Land: A state-of-the-art global reanalysis dataset for land applications. Earth Syst. Sci. Data 2021, 13, 4349–4383. [Google Scholar] [CrossRef]
  72. Schulzweida, U.; Kornblueh, L.; Quast, R. CDO user’s guide. Clim. Data Oper. Version 2006, 1, 205–209. [Google Scholar]
  73. Gupta, H.V.; Kling, H.; Yilmaz, K.K.; Martinez, G.F. Decomposition of the mean squared error and NSE performance criteria: Implications for improving hydrological modelling. J. Hydrol. 2009, 377, 80–91. [Google Scholar] [CrossRef]
  74. Song, L.; Xu, C.; Long, Y.; Lei, X.; Suo, N.; Cao, L. Performance of Seven Gridded Precipitation Products over Arid Central Asia and Subregions. Remote Sens. 2022, 14, 6039. [Google Scholar] [CrossRef]
  75. Santra Mitra, S.; Santra, A.; Kumar, A. Catchment specific evaluation of Aphrodite’s and TRMM derived gridded precipitation data products for predicting runoff in a semi gauged watershed of Tropical India. Geocarto Int. 2021, 36, 1292–1308. [Google Scholar] [CrossRef]
  76. Ang, R.; Kinouchi, T.; Zhao, W. Evaluation of daily gridded meteorological datasets for hydrological modeling in data-sparse basins of the largest lake in Southeast Asia. J. Hydrol. Reg. Stud. 2022, 42, 101135. [Google Scholar] [CrossRef]
  77. Lei, H.; Li, H.; Zhao, H.; Ao, T.; Li, X. Comprehensive evaluation of satellite and reanalysis precipitation products over the eastern Tibetan plateau characterized by a high diversity of topographies. Atmos. Res. 2021, 259, 105661. [Google Scholar] [CrossRef]
  78. Wang, W.; Sun, L.; Cai, Y.; Yi, Y.; Yang, W.; Yang, Z. Evaluation of multi-source precipitation data in a watershed with complex topography based on distributed hydrological modeling. River Res. Appl. 2021, 37, 1115–1133. [Google Scholar] [CrossRef]
  79. Moriasi, D.N.; Arnold, J.G.; Liew, M.; Bingner, R.L.; Harmel, R.D.; Veith, T.L. Model Evaluation Guidelines for Systematic Quantification of Accuracy in Watershed Simulations. Trans. ASABE 2007, 50, 885–900. [Google Scholar] [CrossRef]
  80. Jahanshahi, A.; Roshun, S.H.; Booij, M.J. Comparison of satellite-based and reanalysis precipitation products for hydrological modeling over a data-scarce region. Clim. Dyn. 2024. [Google Scholar] [CrossRef]
  81. Ougahi, J.H.; Mahmood, S.A. Evaluation of satellite-based and reanalysis precipitation datasets by hydrologic simulation in the Chenab river basin. J. Water Clim. Change 2022, 13, 1563–1582. [Google Scholar] [CrossRef]
  82. Usman, M.; Ndehedehe, C.E.; Ahmad, B.; Manzanas, R.; Adeyeri, O.E. Modeling streamflow using multiple precipitation products in a topographically complex catchment. Model. Earth Syst. Environ. 2022, 8, 1875–1885. [Google Scholar] [CrossRef]
Figure 1. The geographical location of the Hablehroud watershed in Iran and the central desert of Iran, river network, and location of rain gauge stations of the basin.
Water 16 01028 g001
Figure 2. Information layers used in the VIC hydrological model: (a) soil type, (b) vegetation, (c) DEM.
Water 16 01028 g002
Figure 3. Daily average rainfall during 1992–1996 over the Hablehroud Basin.
Water 16 01028 g003
Figure 4. Daily hydrographs of observed and simulated runoff during the calibration and validation periods using the following: (a) observed rain gauge stations, (b) APHRODITE dataset, (c) PERSIANN-CDR dataset, (d) ERA5-Land dataset.
Water 16 01028 g004
Figure 5. Monthly hydrographs of observed and simulated runoff during the calibration and validation periods using the following: (a) observed rain gauge stations, (b) APHRODITE dataset, (c) PERSIANN-CDR dataset, (d) ERA5-Land dataset.
Water 16 01028 g005
Figure 6. (a) The average precipitation for different months throughout the 1992–1996 period and (b) the observed and modeled runoff averages by various precipitation datasets during the same period.
Water 16 01028 g006
Figure 7. Normalized sensitivity analysis results of the calibration model parameters with precipitation data. The symbols represent the numerical values of sensitivity and the dashed lines indicate the rank of each parameter in the sensitivity analysis.
Water 16 01028 g007
Table 1. Calibration parameters of the VIC model.
DescriptionUnitRange
BinfVariable infiltration curve parameterN/A0–0.4
DsFraction of Dsmax where non-linear baseflow beginsFraction0–1
DsmaxMaximum velocity of baseflowmm/day0–30
WsFraction of maximum soil moisture where non-linear baseflow occursN/A0–1
CExponent used in baseflow curve, normally set to 2Fraction1–4
D1Thickness of soil moisture of first layerm0.05–0.25
D2Thickness of soil moisture of second layerm0.25–2.5
D3Thickness of soil moisture of third layerm0.25–2.5
Table 2. Information on the used precipitation datasets in this research.
WebsiteSpatial CoverageTemporal CoverageSpatial ResolutionTemporal ResolutionDataset
CHRS Data PortalGlobal1983–present0.25° × 0.25°Daily, Monthly, YearlyPERSIANN-CDR
Copernicus Climate Data StoreGlobal1950–present9 km × 9 kmHourly, MonthlyERA5-Land
APHRODITE homepageAsia1951–20070.25° × 0.25°DailyAPHRODITE
Table 3. Comparison of climatological datasets with interpolated ground station precipitation data.
ERA5-LandPERSIANN-CDRAPHRODITE
MaxMeanMinMaxMeanMinMaxMeanMinIndex
0.590.410.100.330.240.090.780.540.18CC
208.366.9012.4876.2919.58−12.4930.11−0.49−16.29PBIAS
0.540.05−1.260.320.18−0.110.650.400.05KGE
0.890.820.760.620.510.420.960.850.75POD
0.870.730.570.850.690.530.830.670.47FAR
0.380.250.130.330.230.130.480.310.16CSI
6.063.631.793.531.861.124.652.971.56FBI
0.410.220.030.350.250.140.540.330.10HSS
Table 4. Comparison results of daily simulated runoff by using different datasets based on Bonekoh station discharge for the calibration and validation periods.
1992–1994 (Calibration)
αβCCKGERMSENSE
Observation0.930.900.810.783.400.64
APHRODITE0.980.740.720.623.950.52
PERSIANN-CDR1.010.730.760.643.640.59
ERA5-Land0.90.670.640.54.360.41
1995–1996 (Validation)
αβCCKGERMSENSE
Observation0.930.920.790.763.300.59
APHRODITE1.081.030.770.753.620.50
PERSIANN-CDR1.051.140.830.773.420.56
ERA5-Land1.240.930.780.664.640.18
Table 5. Results of the comparison of the monthly simulated runoff using different datasets with Bonekoh station discharge for the calibration and validation periods.
1992–1994 (Calibration)
αβCCKGERMSENSE
Observation0.930.990.870.862.420.73
APHRODITE0.980.810.780.712.930.61
PERSIANN-CDR1.010.820.830.762.610.69
ERA5-Land0.900.740.700.593.460.46
1995–1996 (Validation)
αβCCKGERMSENSE
Observation0.930.980.840.832.530.72
APHRODITE1.081.100.830.792.840.60
PERSIANN-CDR1.051.200.900.772.360.68
ERA5-Land1.240.970.860.723.100.52
Disclaimer/Publisher’s Note: The statements, opinions and data contained in all publications are solely those of the individual author(s) and contributor(s) and not of MDPI and/or the editor(s). MDPI and/or the editor(s) disclaim responsibility for any injury to people or property resulting from any ideas, methods, instructions or products referred to in the content.

