Article

Evaluating Groundwater Metal and Arsenic Content in Piatra, North-West of Romania

1
Faculty of Sciences, Technical University of Cluj-Napoca, 76 Victoriei Street, 430122 Baia Mare, Romania
2
Faculty of Chemistry and Chemical Engineering, Babes-Bolyai University, 11 Arany Janos Street, 400028 Cluj-Napoca, Romania
*
Author to whom correspondence should be addressed.
Water 2024, 16(4), 539; https://doi.org/10.3390/w16040539
Submission received: 2 January 2024 / Revised: 4 February 2024 / Accepted: 7 February 2024 / Published: 9 February 2024

Abstract

:
The present study introduces a monitoring initiative focused on the quality of groundwater in the Piatra locality, situated in the North-West region of Romania. This paper employs an evaluation of 21 physico-chemical parameters, encompassing factors such as electrical conductivity, pH, chemical oxygen demand, turbidity, total hardness, NH4+, NO3, Cl, PO43−, Li, Na, K, Ca, Mg, Ba, Sr, Al, Fe, Mn, Sn, and Ti. Additionally, it examines five heavy metals (Cr, Cu, Ni, Pb, and Zn) and arsenic in water sourced from six distinct private wells. Each well, with its characteristics, serves as a unique drinking water source. The assessment encompassed the evaluation of pollution levels, quality status, and risk factors for all drinking water sources, utilizing pollution, quality, and risk indices. The aim of this study was to establish the level of toxicity in water, assess its impact on human health, and disseminate information to the public about the appropriate utilization of individual water sources. The results indicated a general contamination with chloride, ammonium, manganese, chromium, and iron. Human health risk assessment indices revealed that the consumption of studied waters presented non-carcinogenic risks associated with Cr for adults and with Cr, As, Pb, and Cu for children for some of the groundwater sources. The water quality index (WQI) categorizes the samples as possessing excellent and good quality. This research represents one of the initial endeavors to assess the groundwater source quality in connection with the potential human health risks posed by the metals studied within the protected area of the Tisa River Basin.

1. Introduction

Groundwater, found underground in soil, sand, and rock spaces known as aquifers, represents 97% of the world’s drinking water [1]. Worldwide, approximately 2.5 billion people depend solely on groundwater to meet their daily drinking requirements [2]. According to the UNESCO Water Report 2023, over the last 40 years, a 1% water consumption increase per year has been estimated [3]. A projection by Burek et al. [4] states that this trend could eventually lead to a 20–30% increase by the year 2050.
In the case of Romania, according to the National Administration of Romanian Waters, there is around 9.6 billion m3 of water beneath the surface, with almost half as part of the water table and the rest as part of deep-sea reserves [5]. Groundwater’s advantage lies in its natural renewal through recharge, where precipitation infiltrates the soil to refill aquifers, ensuring a sustainable and dependable supply [6]. However, continental-scale projections for Europe suggest a probable 5–20% decrease in annual mean precipitation in southern Europe and the Mediterranean from 2071 to 2100, with precipitations for Romania already having decreased to 30 mm/decade [5]. In numerous rural regions of Romania, the primary concern is not merely the availability of water but rather the accessibility of potable water. The 2030 Agenda prioritizes developing water and sanitation infrastructure for an improved quality of life and health in Romania. Even with this being a strategic priority, in 2016, only 65.2% of the population had water access, making Romania the least-developed EU country in this aspect, with significant rural disparities and limited national infrastructure and investment contributing to low wastewater collection (63.46%) and sewage treatment (56.71%) rates [7]. Despite the European Union’s (EU) drinking water legislation, the quality of drinking water from both private and numerous public wells remains unregulated and frequently lacks protection against contaminants. The 98/83/EC Council Directive exempts drinking water systems catering to fewer than 50 individuals or producing less than 10 m3 per day [8]. In rural areas, individual well digging risks water quality and quantity due to expertise and design issues, especially during high-demand or drought periods [9]. The Piatra area, where the groundwater quality study was conducted, lies within the Upper Tisa region near the Ukrainian border and is intersected by the Tisa River and its tributary, Șugătag. This region, including the Upper Tisa River and Tisa meadow, is designated as a Natura 2000 protected area due to its rich biodiversity, housing various species such as amphibians, fish, and migratory birds like wild ducks, storks, and swans. The primary occupations of Piatra residents include agriculture, animal husbandry, and wood processing. The area offers picturesque landscapes and opportunities for recreational fishing. Geologically, it features Quaternary formations from the Pleistocene and Holocene periods, influenced by alluvium from flood periods. The protected area spans low terrace formations of the Tisa River, characterized by alluvial/proluvial materials like gravels, boulders, and sands [10]. Land use in Piatra includes forests, meadows, pastures, arable lands, and residential areas, with predominant alluvial, well-drained soils supporting diverse natural vegetation. The area experiences a temperate-continental climate, with increased humidity and cold temperatures influenced by the Baltic and Scandinavian regions [11].
According to soil taxonomic classifications, the area possesses diverse soil types: alluvisols dominate the meadows along the Tisa River with well-drained properties and a pH range from moderately acidic to weakly alkaline, while Regosols are found along the Săpânța River on gravel/boulder deposits with slightly acidic pH levels; Gleysols occur in depressions between Teceu and Remeți and Săpânța and Câmpulung la Tisa, influenced by a prolonged water table presence and poor-quality humus; and Luvisols range from gelic luvosols to stagno-gleic luvisols, present in terraces and settlement areas, with varying pH levels from strongly acidic to moderately acidic [12,13,14]. Shallow dug wells pose contamination risks due to their wide diameter, shallow depth, and inadequate regulation, elevating their vulnerability to environmental shifts and fostering well deterioration. All the soils in the area exhibit unique behaviors from a pedological perspective [15]. Alluvisols, though well-drained, pose risks if surface runoff or contamination seeps through soil layers, which can be mitigated by proper well construction. Regosols, which are slightly acidic, may lead to heavy metal leaching if not lined adequately. Gleysols, which are waterlogged, risk contamination from stagnant water and humus, necessitating well construction vigilance. Luvisols, with varying acidity, can affect water purity and surface contamination if not properly sealed or protected.
Thus, the assessment of groundwater quality considers biological, hydrological, and physico-chemical factors. Prolonged environmental interactions influence its chemical composition, with agricultural waste like fertilizers, insecticides, and pesticides threatening quality through infiltration [16]. Despite purification through evaporation and precipitation, water needs rely on limited rainwater and groundwater, facing persistent pollution driven by rapid resource degradation [17]. Contaminants impacting natural water sources comprise heavy metals (Cu, Ag, Zn, Cd, Hg, Cr, Mo, Mn, Co, and Ni), inorganic pollutants (PO42−, NO3, and NH4+), metalloids (B, Si, and Te), organic pollutants (benzene, phenol, toluene, chloroaniline, and methylene blue), and microorganisms (S. aureus, E. coli) [18]. Certain heavy metals, such as Cr, Pb, Ni, and Cd, carry potential risks due to their toxic, genotoxic, and carcinogenic effects, while others like Se, Mo, Mn, Co, Cu, and Fe are essential micronutrients for various biological functions [18,19,20,21,22,23,24,25,26,27]. However, excessive intake of these metals can result in neurotoxic effects. Additionally, it has been reported that approximately 20% of global cancer cases result from improper water consumption, and in 2022, 829,000 deaths worldwide were attributed to inadequate sanitation and various human activities near groundwater sources [28]. Evaluating the degree of heavy metal pollution through pollution indices—PI (pollution index) and HEI (heavy metal evaluation index)—is essential for safe water consumption. The overall quality of water can be assessed using chronic daily intake (CDI). The hazard quotient (HQ) and the hazard index (HI) are employed for the evaluation of non-carcinogenic health risks based on the consumption of water contaminated with metals [29]. Heavy metals, pesticides, and detergents, due to their accumulation in vital organs, are major pollutants, impacting key human body systems [30]. Human health risk assessment is vital for estimating the harmful effects and likelihood of health risks to ecosystems and human health [31]. In this process, spatial modeling of heavy metals in groundwater plays a crucial role, considering factors such as chronic daily intake, hazard quotient, and hazard index [32,33]. To prevent potential health risks, it is essential to implement risk factors for water sources characterized by high concentrations of contaminants [34]. Recent investigations in Nigeria, Algeria, Iran, Kenya, Thailand, Bulgaria, Slovakia, and Romania have shown high levels of non-carcinogenic outcomes for chemical elements including Ni, Hg, Cd, Pb, As, and nitrogen pollutants (NO3, NO2, and NH4+), which are prevalent in groundwater due to activities like household, agricultural, and industrial processes, carrying the potential to trigger cancer or methemoglobinemia [35].
The primary objectives of this investigation centered on assessing the quality and pollution levels of groundwater drawn from dug wells, specifically used for drinking purposes, aiming to ascertain its suitability for consumption and its potential impact on human health. Another objective is to identify the extent of the anthropogenic pressures and, implicitly, to elaborate measurements in order to reduce the negative anthropogenic influences. What sets this study apart is its comprehensive approach to evaluating groundwater quality in Piatra town, situated within the Plain of Tisa River. This method involves diverse methodologies, including statistical analysis of key physicochemical indicators, cluster analysis identifying wells influenced by similar pollution sources, human risk assessment, and the calculation and interpretation of water quality indices. By introducing innovative perspectives and methodologies, this study contributes to existing literature, aiming to enhance knowledge in the field. The findings are expected to provide insights into how groundwater responds to stress from human activities, offering valuable recommendations for population health risk prevention and sustainable practices.

2. Materials and Methods
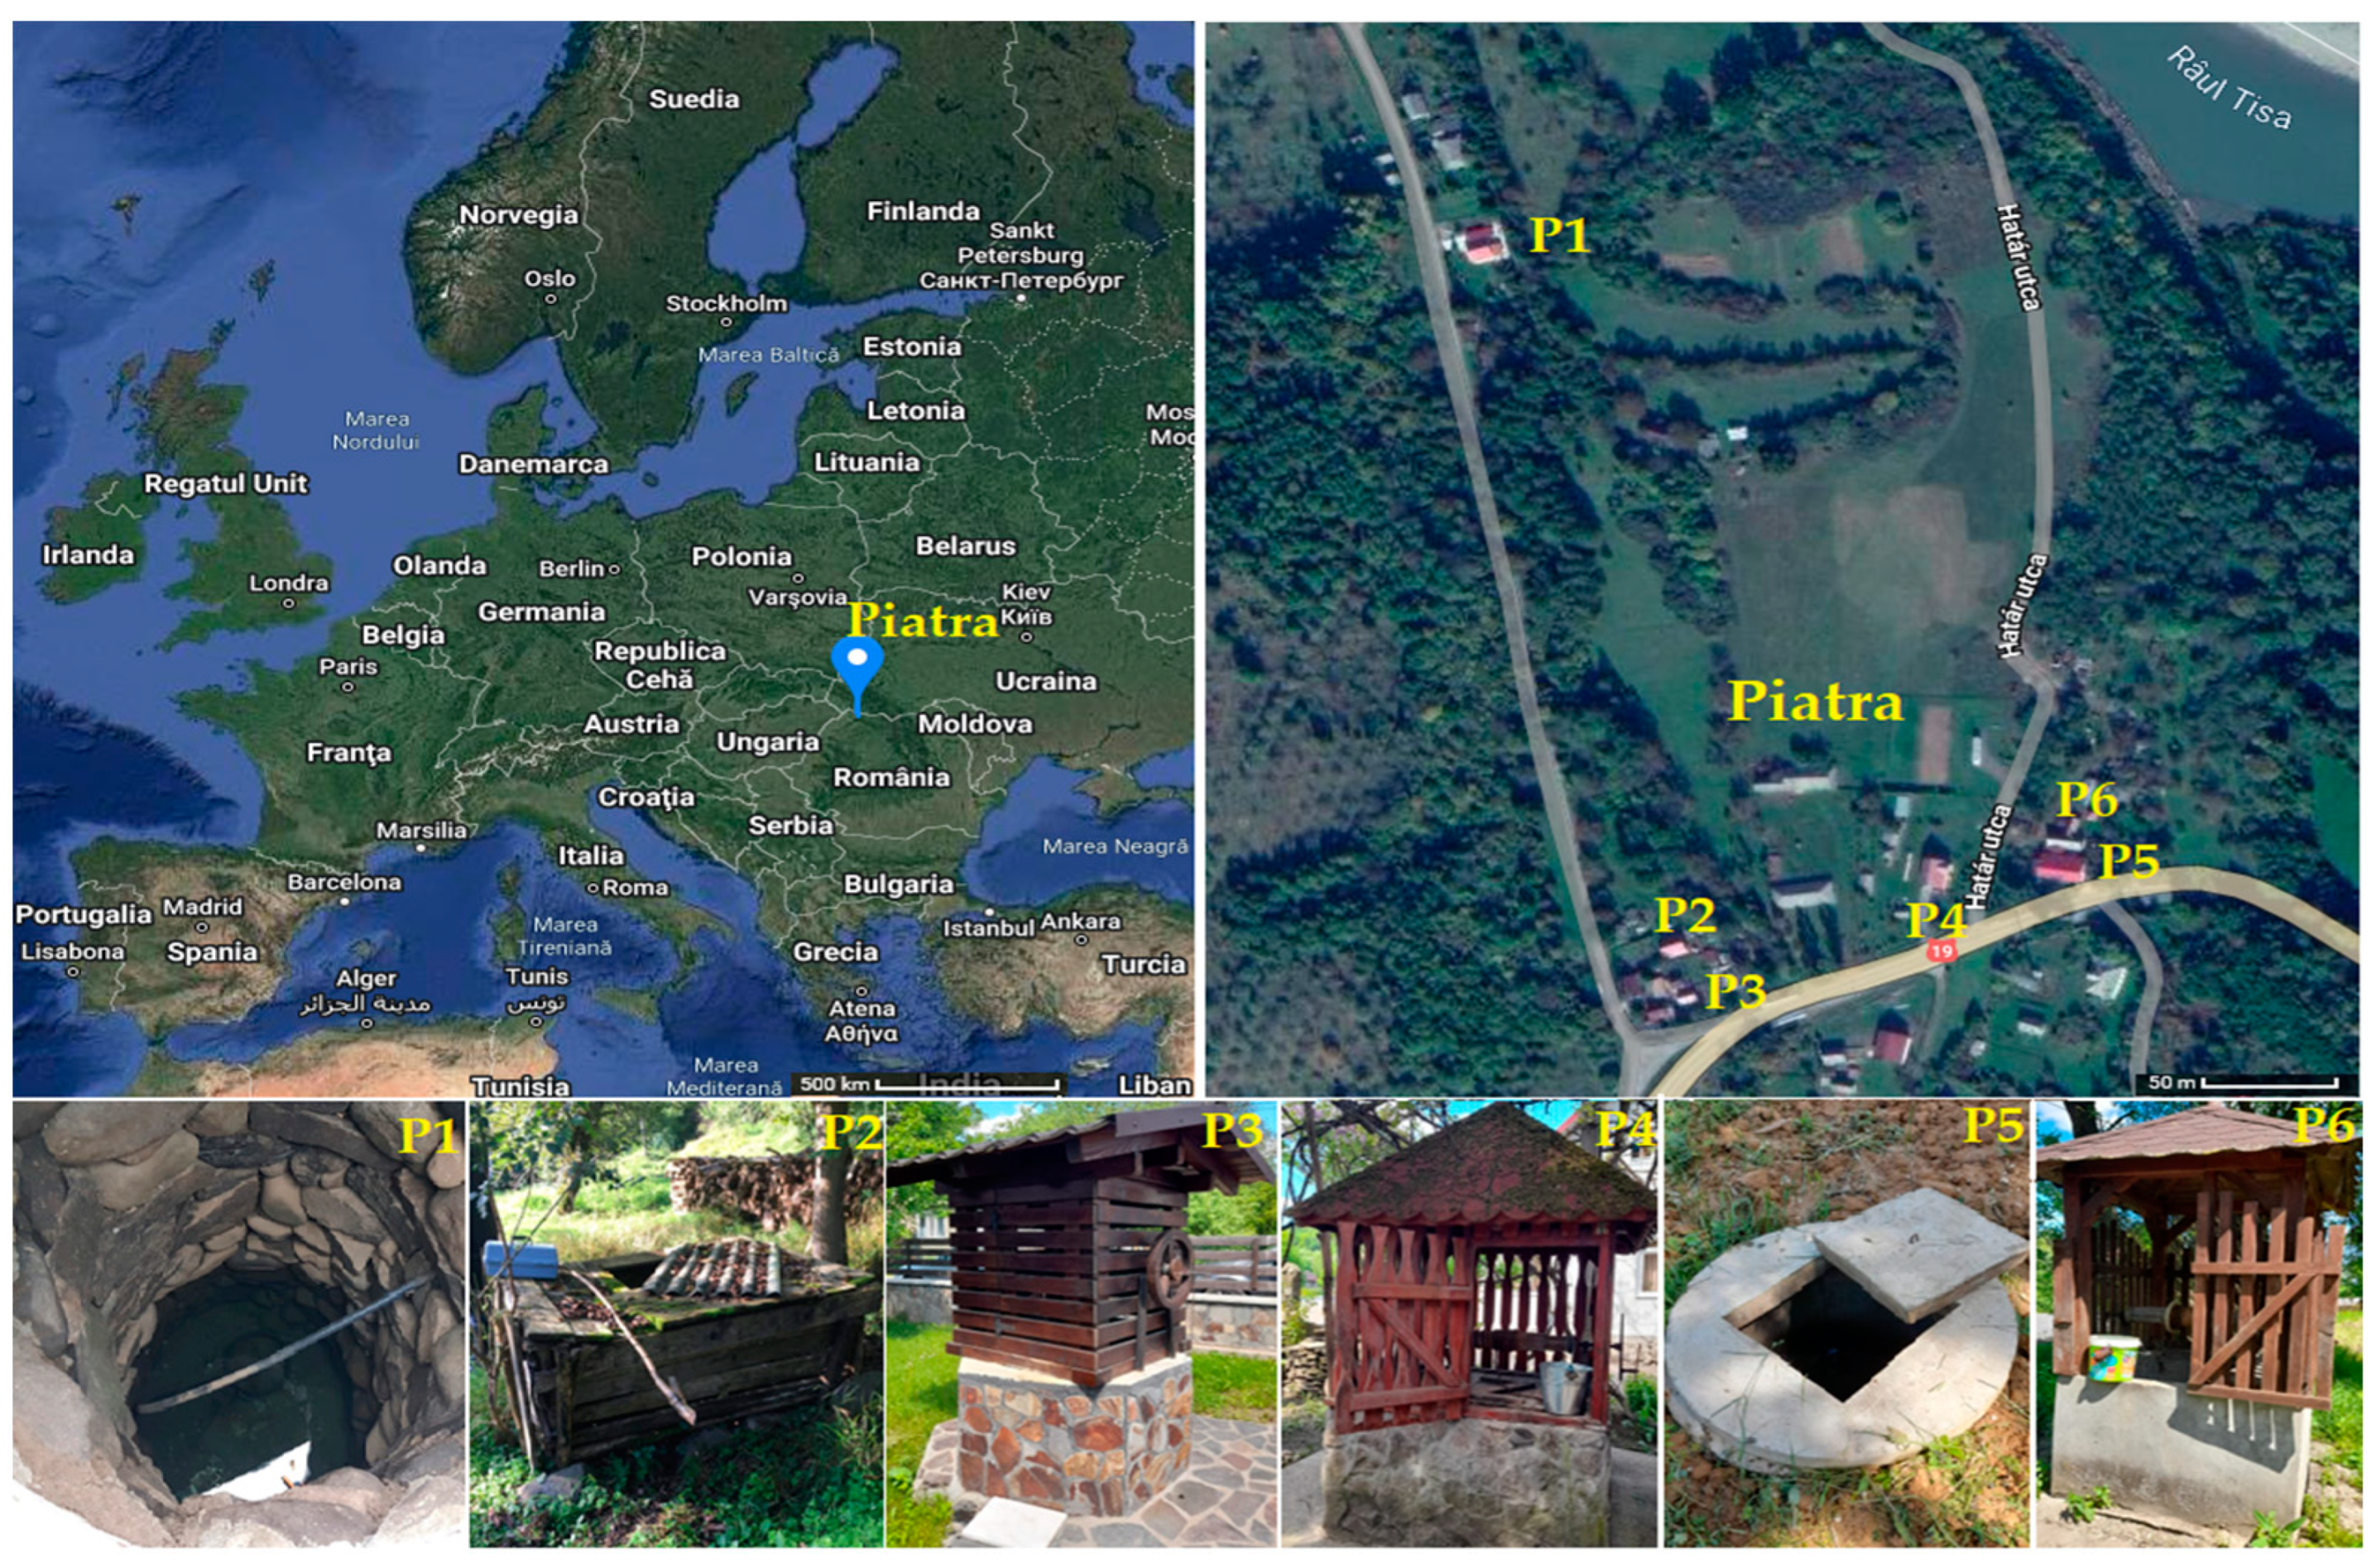
2.1. Water Sampling

The samples of groundwater were gathered from six distinct locations within the town of Piatra, Romania, throughout all seasons in the year 2023. Figure 1 illustrates the locations of all six sampling points comprised exclusively of dug wells. The open dug wells, situated on residents’ properties, are excavated to a depth of 4–10 m with an 80 cm diameter. They are constructed using cement/asbestos or rock tubes and equipped with a pulley system for water extraction. Sampling points were chosen randomly to ensure a comprehensive coverage of the town’s entire area, encompassing potential sources of contaminated groundwater. Physicochemical parameter analysis was conducted within 48 h of sampling. Adhering to SR ISO 5667-3/2018 [36] guidelines, collected water samples were stored in clean polyethylene containers and refrigerated until analyzed in triplicate [37].

2.2. Methods of Analysis

Field investigations and sample analysis were conducted over 2022 using portable devices. Electrical conductivity (EC) and pH were measured with a WTW INOLAB 740 conductometer (WTW, Weilheim in Oberbayern, Germany) and an HI 253 Hanna Instruments pH meter (Hanna Instruments, Woonsocket, RI, USA), respectively, following SR EN ISO 7888/1985 [38] and SR EN ISO 10523/2012 [39] standards [37]. Dissolved oxygen, chloride concentration, total hardness (ht), and aluminum were assessed using specified methods and instruments [37]. The measurement of Al3+ was conducted using a Specord 50 UV–VIS spectrophotometer (Analytik Jena, Jena, Germany) [37]. Ammonium, nitrates, phosphates, dissolved iron, and water turbidity were also measured following relevant standards and using appropriate devices, such as the WTW 355 IR portable turbidimeter (WTW, Weilheim in Oberbayern, Germany) [37]. The portable devices underwent calibration before each measurement [37]. The preservation of water samples involved the addition of nitric acid (HNO3, 65%, Merck, Darmstadt, Germany) in a 1:1 ratio until reaching an acidic pH range of 1–2. Following this, the samples underwent digestion with concentrated HNO3 (70%, Merck, Germany) and H2O2 (30%, Merck, Germany), then were dissolved in concentrated HNO3, diluted with filtered ultrapure water, further diluted to a volume of 100 mL using an acid solution, and stored at 4 °C until the analysis [37]. All reagents utilized were analytical-grade (PA), with deionized water employed for their preparation.
In the case of samples investigated using the graphite furnace, preparation involved a filtration step followed by an acidification with concentrated HNO3, 0.5 mL for 100 mL of the water sample, excluding the mineralization stage [37]. Elements such as Mg, Ca, Mn, Fe, and Zn at parts per million (ppm) levels were examined through flame absorption atomic spectrometry (FAAS) using a Perkin Elmer NexION 300S spectrophotometer equipped with flame and graphite furnace atomizers (Perkin Elmer, Norwalk, CT, USA). An in-depth analysis was conducted on trace metals (µg/L), including Cu and Ni, through the utilization of graphite furnace atomic absorption spectrometry (GFAAS) employing a pyrolytic platform [37]. The spectrophotometer, featuring hollow cathode lamps tailored to individual metals and a continuous background correction system, employed an air-acetylene flame for samples at the ppm level and a graphite furnace for samples at the trace level [37]. Calibration, quality control of data, and assurance adhered to established standard operating procedures, which included conducting triplicate analyses and measuring blanks in parallel. The findings were presented as the average values derived from three distinct replicates, employing analytical-grade reagents and certified 1000 ppm standard metal solutions for both calibration and standard preparation [37].

2.3. Statistical Analysis

Descriptive statistics of the registered data were accomplished by computing the mean, standard deviation, coefficients of variation, standardized skewness, and kurtosis for each water parameter with the help of Excel (Microsoft Office 2021, Microsoft Corporation, Washington, DC, USA). Cluster analysis, a classification method applied to environmental data, was employed to illustrate the similarity or dissimilarity of observation points or analyzed parameters using the Statgraphic program (version Centurion 19, 2023, The Plains, VA, USA).

2.4. Heavy Metal Evaluation Index (HEI)

The heavy metal evaluation index method was employed to investigate the overall quality of water based on the concentrations of heavy metals. The HEI values were calculated for the elements Zn, Pb, Ni, Cu, Cr, As, Mn, Fe, and Sr. Only the heavy metals with a maximum allowable limit were considered. As was also considered due to its high toxicity. HEI was calculated according to Equation (1) [40,41].
H E I = t = 1 n C M i C ( M A C ) i
where CMi is the measured concentration of the “i” considered a heavy metal and C(MAC)i is the maximum admissible concentration in drinking water, according to Romanian legislation or another standard for drinking water quality. By using HEI, the water samples can be classified into the following pollution degrees: low pollution degree when HEI < 40, medium degree of pollution for 40 < HEI < 80, and high degree of pollution when HEI > 80.

2.5. Water Quality Index (WQI)

The water quality index (WQI) is an approach to assessing the quality of diverse water samples, consolidating various indicators of water composition into a singular representative value that conveys comprehensive information about water quality [29,40,42,43,44,45,46]. The WQI method was used to assess the overall quality of groundwater samples based on a weighted arithmetic technique, considering 23 indicators of water quality: EC, pH, turbidity, NH4+, NO3, PO43−, and the metals: Li, Na, K, Ca, Mg, Ba, Sr, Al, Fe, Mn, Cr, Cu, Ni, Pb, Zn, and As. For each water quality parameter, a weight (wi) and a relative weight (Wi) were assigned based on Equations (2) and (3):
w i = 1 S i
where Si is the maximum allowable concentration in potable water (MAC), according to Law 311/2004 458/2002 Law M.O. No. 552/29 July 2002—law on the quality of drinking water, as shown in Table 1.
W i = w i i = 1 n w i
where n is the number of the assessed water indicators; n was 23 in the present study.
WQI were computed following Equations (4) and (5) according to the literature [29,47,48,49,50,51,52,53]:
W Q I = i = 1 n Q i × W i i = 1 n W i
Qi is the quality rating of each physico-chemical indicator determined following Equation (4):
Q i = C i V i S i V i × 100
In this context, Ci represents the measured value of each physico-chemical parameter or metal concentration, while Vi stands for the ideal value of the chemical indicator. The ideal value, Vi was zero for the considered indicators, with the exception of pH. The optimal value for pH was considered to be 7 [47,52,53].

2.6. Human Health Risk Assessment

Human health risk assessment by groundwater consumption was established according to the method described in the literature [46,54,55,56], by computing the chronic daily intake of water contaminants, CDI (mg/kg·day), hazard quotients (HQ) for each water contaminant, and the hazard index (HI). Nutrients such as NH4+ and NO3, metals (Al, Sr, Ba, Fe, Mn, Cr, Cu, Ni, Pb, and Zn), and As were considered to compute the hazard index, HI. The human health risk due to groundwater consumption was evaluated by calculating the chronic daily intake of water, CDI (mg/kg∙day), hazard quotients (HQ), and the hazard index (HI), according to Equations (6) and (7) for adults (male and female) and children.
C D I = C × I R × E F × E D B W × A T
where C is the measured pollutant concentration in the groundwater sample (mg/L); IR is the ingestion rate per unit time (1.5 L/day for a child and 2 L/day for an adult); EF: exposure frequency (350 days/year considering 15 days of holidays or visits); ED: exposure duration (6 years in the case of children; 30 years in the case of adults); BW: body weight; the average body weight for Romanian males is 85 kg, while for females, it is 72 kg [57], and an average body weight of 15 kg was considered for children [55].
The hazard quotients, HQi, for the considered pollutants in water were calculated according to Equation (7):
H Q i = C D I i R f D i
where RfDi is the chronic oral reference dose, an estimate of the daily oral exposure level for the population, and the highest acceptable daily intake level for a specific element or pollutant that does not lead to adverse health effects [47,52,53].
The RfD values expressed in mg/kg/day are 0.97 NH4+; 1.60 NO3; 0.6 Sr; 0.7 Fe; 0.14 Mn; 0.0003 As; 0.0003 Cr; 0.0005 Cu; 0.0054 Ni; 0.0003 Pb; 0.3 Zn; 7 Al; and 0.2 Ba [58,59,60,61].
The hazard risk, HI, which aims to assess the human health risk through more toxic elements, was computed as the sum of all HQ, calculated for each particular pollutant according to Equation (8). HI values greater than one, HI ≥ 1, are associated with considerable non-carcinogenic health hazards [47,53,62].
H I = i = 1 n H Q

3. Results and Discussion

3.1. Physico-Chemical Characteristics of Groundwater Samples

The results for the physico-chemical content of the examined water samples (P1–P6) are presented in Table 1. As seen from Table 1, the electrical conductivity (EC) values for wells P1 to P6 exhibit a notable variation, suggesting diverse levels of ion concentration in the respective groundwater sources. Well P4 stands out with the highest conductivity at 1205 μS/cm, potentially indicating a higher concentration of dissolved ions or minerals. In contrast, wells P3 and P6 demonstrate the lowest conductivity values at 172 μS/cm and 252 μS/cm, respectively, suggesting a lower presence of dissolved ions. Wells P2, P5, and P1 fall in between, showcasing moderate electrical conductivity values of 398 μS/cm, 192 μS/cm, and 736 μS/cm, respectively. These variations could be attributed to geological factors, such as differing soil compositions or proximity to potential contamination sources, influencing the conductivity of the groundwater in each well. A previous study [46] on another well within the region registered much higher values (1575–2480 μS/cm), attributed to the interaction with aquifer rocks. EC serves as evidence of salt content in water, and the ingestion of water with elevated EC levels may contribute to a range of health issues, including but not limited to cancer, diarrhea, hepatitis, and gastroenteritis, impacting vital organs such as the heart, kidneys, and stomach [48].
Dissolved oxygen (DO) indicates water stratification and the contamination degree [49]. In this study, DO varied between 5.33 and 9.77 mg/L. Wells P3, P5, and P6 have relatively high DO concentrations, measuring 9.06 mg/L, 9.77 mg/L, and 9.55 mg/L, respectively. These elevated levels suggest favorable conditions for aerobic organisms and may indicate well-oxygenated water. Conversely, wells P2 and P4 show lower DO values at 5.65 mg/L and 5.33 mg/L, possibly indicating reduced oxygen availability in these wells. Well P1 falls in between, with a dissolved oxygen level of 6.79 mg/L. Discrepancies in these values may be ascribed to a variety of factors, including groundwater flow patterns, biological activities, and environmental conditions. The low amounts of DO (P2 and P4) lead to a lack of freshness, a fad taste, and unfriendly conditions of microorganisms that make the water not potable [50]. High amounts of DO (P3, P5, and P6) increase the organic suspended matter rich in pathogens [49,50].
pH ranged between 6.98 and 7.61, within the thresholds established for drinking water, indicating a weak acidic to weak basic character, which can indicate a low pollution level with organic and inorganic compounds [51]. Due to rock interaction and rich amounts of carbonates, pH has a basic character and changes the taste of water, possibly leading to skin and eye rashes [52]. Turbidity ranged between 1.14 and 8.75 NTU. Such variations in the turbidity levels across the six wells indicate differences in water clarity. Well P3 exhibits the highest turbidity at 8.75 NTU, suggesting a higher concentration of suspended particles or sediments in the water. P6 follows closely with a turbidity of 5.48 NTU, indicating moderately cloudy water. Wells P2 and P5 demonstrate moderate turbidity levels at 3.92 NTU and 2.56 NTU, respectively. P1 and P4 exhibit lower turbidity levels at 1.31 NTU and 1.14 NTU, suggesting relatively clear water. These variations in turbidity may be influenced by factors such as land use, soil composition, and human activities in the vicinity of each well. High turbidity levels can indicate potential contamination or natural sedimentation processes. Higher values may be caused by the presence of bacteria, plankton, iron and aluminum hydroxide, sludge, and colloidal matter. Water characterized by elevated turbidity posed an epidemiological threat because it facilitated the suspension of particles, serving as a medium for pathogens [40]. The consumption of water with high turbidity levels may result in health issues, particularly intestinal diseases, and can also induce distortion in aquatic ecosystems [53].
With the exception of P1, P4, and P6, all other samples are highly rich in NH4+, almost two times the MAC established for the drinking water. The high amount is related to anthropogenic activities, for example, the intense use of fertilizers or fecal deposits. If consumed, water with NH4+ in high amounts might cause convulsion, hepatic encephalopathy, coma, and death. Such water contaminated with NH4+ can be treated through energetic chlorination and filtration process [63]. The NO3 concentrations are below the MAC (50 mg/L), between 1.28 and 4.21 mg/L (Table 1). The sources of NO3 include intensive agricultural practices, sewage and septic tank leakage, manure and contaminated sludge deposits, as well as microbial decomposition. Groundwater contamination with NO3 is influenced by the geological and hydrogeological structure. Consuming water rich in NO3 is linked to the onset of illnesses like cancer and methemoglobinemia [62]. As for chlorides, all wells are within the allowable limit, except for well P4, which has more than double the maximum allowable limit of 250 mg/L. The anomalous presence of heightened chlorine levels in a singular well, as opposed to others within the same town, underscores the complexity of localized water quality dynamics. Chlorides (salts of metals with hydrochloric acid), indicative of water salinity, are essential for the body’s electrolyte balance, but excessive salinity renders water unsuitable for drinking due to potential chemical aggressiveness [35]. PO43− are lower than 0.4 mg/L, with potential sources represented by the intense use of fertilizers and detergents, but also with geogenic origin. An elevated phosphate concentration can change both the flavor and color of water [64]. Variations in the levels of ammonium, chlorides, nitrates, and phosphates among wells in the same close region or town can be attributed to diverse factors, including differences in geological formations, land use practices, and proximity to pollution sources. Additionally, variations in well construction, depth, and maintenance practices may influence the vulnerability of wells to contamination. These local factors influence the interaction of water with surrounding soils, rocks, and contaminants, contributing to the unique composition of each well and the resulting differences in water quality parameters. For example, one study [65] focuses on 10 wells from Remeti locality in very close proximity to Piatra town (the locale housing the six wells analyzed in the present paper). The ammonium levels reported in Remeti wells were up to more than four times higher than the MAC, presenting a maximum of 2.38 mg/L compared to the maximum in Piatra, which is P4 = 1.09 mg/L; also, in Remeti, phosphates were within admissible limits except for one well (0.78 mg/L) comparable to the ones in this study. Nitrate amounts were also excessively higher in wells from Remeti than in the P1–P6 samples in this study. This could be explained by more intense agricultural practices in the former compared to the latter, coupled also with the heavy practice in Romanian countryside involving the application of animal manure. Teceu locality is also in close proximity to Piatra town, and water analysis on a well in Teceu [46] revealed values for ammonium, chlorides, nitrates, and phosphates within the legal limits for potable water. However, it should be stated that [46] only analyzed one well in that specific town, which would be a limitation for stating the pollution levels for wells in the area.

3.2. Metal and as Content in Groundwater Samples

The concentrations of major metals (Ca, Mg, Na, and K), of metals found at lower concentrations (Li, Al, Ba, and Sr), of heavy metals (Fe, Mn, Sn, Ti, Cr, Cu, Ni, Pb, and Zn), and As are shown in Table 2.
The average values for the metal concentrations in the groundwater samples were as follows: Na > Mg > Ca > K > Sr > Fe > Sn > Ba > Al > Ti > Cr > Zn > Pb > Ni > As > Cu > Li > Mn.
Calcium and magnesium are essential elements for the human body; thus, their presence in water is not typically a cause for concern, unless there are underlining medical conditions (i.e., kidneys). While their presence in high amounts leads to hard water, which is organoleptically changed, the World Health Organization (WHO) acknowledges that hard water has no known adverse health effects and may even contribute to the intake of essential minerals. However, the WHO does report that the taste sensitivity threshold for Ca2+ within the range of 100–300 mg/L, contingent on the accompanying anion, and it is likely that the taste threshold for magnesium is lower than that for calcium. In certain cases, consumers are known to tolerate water hardness exceeding 500 mg/L [66]. Here, the highest magnesium value is found in fountain P4, while the lowest value is found in well P3. All values fall within the maximum allowable limit of 50,000 μg/L. The presence of such ions, the presence of calcium- and magnesium-rich minerals in rocks and soils, and the characteristics of aquifers through which water flows. Also derived from geological source is potassium, with the highest level being observed in the water from fountain P4, while the lowest value is in the water from fountain P2. However, all values fall within the maximum allowable limit of 10,000 μg/L.
Aluminum (Al) stands out as the most prevalent metallic element found in the Earth’s crust. While poorly absorbed in the gastrointestinal tract, its bioavailability increases in drinking water, potentially impacting human health. According to Law 311/2004, the legal limit for aluminum content is 200 µg/L. One potential origin of aluminum is the application of Al2(SO4)3 during the water treatment procedure [29]. Recognized as a neurotoxin on a broad scale, exposure to aluminum has been associated with neurodegenerative conditions, including Parkinson’s, Alzheimer’s, and multiple sclerosis. Studies indicate cognitive decline at Al intake ≥0.1 mg/day from water, with elevated levels posing an increased risk of cognitive impairment in the elderly, leading to heightened vulnerability to hip fractures and adverse health effects [67].
Manganese is also naturally abundant, and water rich in Mn is characterized by an unpleasant metallic taste and a muddy odor. The presence of manganese in the water distribution system forms deposits that can settle as a black precipitate [29]. According to Water Law 311/2004, the permitted limit for manganese content should not exceed 50 µg/L. The values obtained in the studied wells are low, ranging from 1.4 to 8.5 µg/L. Manganese originates from diverse sources, encompassing industrial practices like alkaline battery and cleaning product manufacturing, agricultural activities involving the application of fungicides, fertilizers, and pesticides, as well as mining operations.
Barium is a naturally occurring element that can be found in groundwater, including well water. While low levels of barium are generally considered to be naturally present and not harmful, elevated concentrations can pose health risks. Barium can enter groundwater through the weathering of certain rocks and minerals. Barium can deposit in muscles, lungs, and bones because it resembles calcium but is absorbed more quickly [41]. The highest barium value was observed in the water from fountain P4, while the lowest value was observed in the water from fountain P3. All values fell within the permissible limit, which is 7000 µg/L.
Arsenic is a toxic contaminant that is colorless, odorless, and tasteless and is commonly found in high concentrations in groundwater. Arsenic found in groundwater is susceptible to abrupt variations [29]. For this study, the measured values in groundwater vary between 0.22 and 9.8 µg/L. Wells P1, P3, and P6 exhibit arsenic concentrations well below the permissible limit at 5.4 µg/L, 0.22 µg/L, and 0.55 µg/L, respectively. Wells P2 and P5 approach the threshold with values of 8.5 µg/L and 6.3 µg/L, suggesting a moderate risk of arsenic exposure. P4 records the highest arsenic level at 9.8 µg/L, nearing the maximum limit and indicating a potential health concern. Communities relying on well water for drinking, particularly in rural areas, face heightened vulnerability to arsenic contamination. Geological conditions, often prevalent in rural regions, may lead to naturally occurring arsenic in aquifers. Limited resources for water monitoring and regulatory oversight contribute to the unknowing consumption of arsenic-contaminated water. Rural populations, dependent on wells and lacking alternative water sources, are at direct risk of health issues associated with arsenic exposure. Challenges in accessing clean water alternatives, agricultural practices, and a lack of awareness further compound the issue. Ingesting water containing a substantial amount of arsenic can result in significant immediate and/or prolonged health issues, including but not limited to vomiting, diabetes, heart diseases, cancer, spontaneous abortion, childhood cancer, and potential fatality [68]. Following ingestion, arsenic is swiftly absorbed by the gastrointestinal tract and undergoes metabolism. As for chromium, according to Water Law 311/2004, the legal limit is 50 µg/L. In this study, the obtained values varied between 1.7 and 55.8 µg/L. Sample P3 exceeds the legal limit of 50 µg/L, highlighting the need for immediate attention and remediation to ensure compliance with established water quality standards. The other samples, while below the legal limit, may still warrant monitoring and preventive measures to maintain water quality within acceptable levels. The variation in chromium levels, with higher concentrations in sample P3 compared to others in the same village, may stem from localized geological, anthropogenic, or hydrogeological factors. Chromium, a highly toxic heavy metal, is linked to health risks such as cancer, DNA damage, and oxidative stress. It is present in water in hexavalent (Cr(VI)) and trivalent (Cr(III)) forms, and Cr(VI) is especially toxic for individuals with respiratory issues [69].
In compliance with Water Law 311/2004, the permissible limit for nickel content stands at 20 µg/L. Recorded nickel values, ranging from 2.2 to 12.4 µg/L, are influenced by factors like pH, soil composition, and depth [29]. Acknowledged as a significant contributor to groundwater pollution by the U.S. Environmental Protection Agency, nickel’s potential toxic and health risks necessitate a comprehensive understanding of public safety [70]. Despite being a crucial element for the good functioning of enzymes, blood, the endocrine system, and gene synthesis, various studies highlight nickel’s disruptive impact on glucose metabolism and insulin secretion through biological mechanisms [70]. The presence of nickel in drinking water from wells can exert various influences on the surrounding environment. Nickel concentrations, when used for irrigation, may result in soil contamination, impacting plant health and altering the overall ecosystem in the well area. Interactions with the aquifer and subsurface geology can lead to the leaching of nickel into the well water from surrounding rock formations or anthropogenic sources. The overall groundwater quality in the well area is affected, posing concerns for both human consumption and agricultural use. Persistent contact with heightened nickel concentrations in drinking water poses health concerns, while the potential for corrosion or deterioration of well infrastructure adds another layer of concern.
According to Water Law 311/2004, the legal limit for lead content is 10 µg/L. The obtained lead content values ranged between 3.7 and 9.3 µg/L. Lead is one of the 275 priority-controlled pollutants by the U.S. and Chinese Environmental Protection Agencies [68]. Lead and its compounds can enter groundwater through mining activities. Lead is challenging to eliminate after its accumulation in the human or animal body because it can cause a diverse array of physical and mental issues [71,72]. The accumulation of lead in the human body causes damage to all organs, including the central nervous system, affects the liver, thyroid, and bones, and causes brain injuries and infertility [29,72]. Due to the physiology of the body, children, being more vulnerable than adults to lead contamination, suffer from constant brain damage, with approximately 18 million affected by lead poisoning [72]. Controlling lead pollution in drinking water is of vital importance [71].
As for copper, according to Water Law 311/2004, the legal limit is 100 µg/L. The highest value was found in well P6 (6.4 µg/L). Increased copper levels can arise from natural processes, like the breakdown of rocks, and human activities, including mining, industry, and agriculture. Drinking water containing elevated copper levels may result in stomach and headache discomfort, along with irritation of the eyes and nose [73]. Hence, monitoring the copper content is essential.
According to Water Law 311/2004, the legal limit for zinc content is 5000 µg/L. The zinc content at the sampling points is low. Sampling point P3 recorded double the zinc content (21.3 µg/L) compared to other points, probably due to a higher interaction of groundwater with rocks. Zinc, a naturally occurring element, undergoes slow enrichment in groundwater through interactions with rocks, influenced by inorganic carbon content and pH, and it is recognized for its significant mobility within water systems. Zinc exhibits opalescence and an astringent taste [29]. The mobility of Zn in water is predominantly affected by pH, with other factors like clay content, phosphorus availability, concentration of organic matter, and redox conditions also contributing to its behavior [74].
The strontium content in well water samples falls within the admissible limits of 200 µg/L for four of the six samples, namely P1, P2, P3, and P5. Wells P4 and P6 notably surpass the permissible limit, with sample P4 reading almost twice the legal amount, raising concerns about potential health risks associated with elevated strontium levels. The variations in strontium concentrations among wells in the same village could be attributed to geological factors, such as the composition of the subsurface rocks, which may contain higher concentrations of strontium. As this element is essential for general human health, it may be neglected in the overall water assessment. However, Sr has the potential to substitute for calcium and magnesium in bone, potentially impacting bone growth and strength. One study [75] emphasizes the noteworthy inverse correlation between the incidence of rickets in children and the Ca/Sr ratio in the potable water available for public consumption in China. A lower Ca/Sr ratio is associated with a higher incidence of rickets, suggesting a potential link between the calcium-to-strontium ratio and bone health in children. This finding underscores the importance of considering the Ca/Sr ratio in assessing the overall effect of strontium in the water supply for public consumption, particularly in regions with high strontium concentrations, to ensure adequate management and supervision of water quality.
Iron is the most problematic element in water. The water samples from 5 of the 6 wells analyzed fall below the legal limit of 200 µg/L, with values ranging from 132 (P5) to 195 (P2) µg/L. Sample P3, however, registers iron values of 225 µg/L, thus surpassing the allowed amount. These values indicate a potential issue with iron contamination in the well water. Elevated iron levels in drinking water can lead to several problems, including unpleasant taste, discoloration, and staining of plumbing fixtures. Additionally, high iron concentrations may indicate the presence of other contaminants or geological conditions that contribute to the contamination. The presence of higher iron levels could likely be attributed to the historical mining activities in Maramures County (different metalliferous resources including iron, copper, and manganese [76]), home to Piatra town and the six analyzed wells.

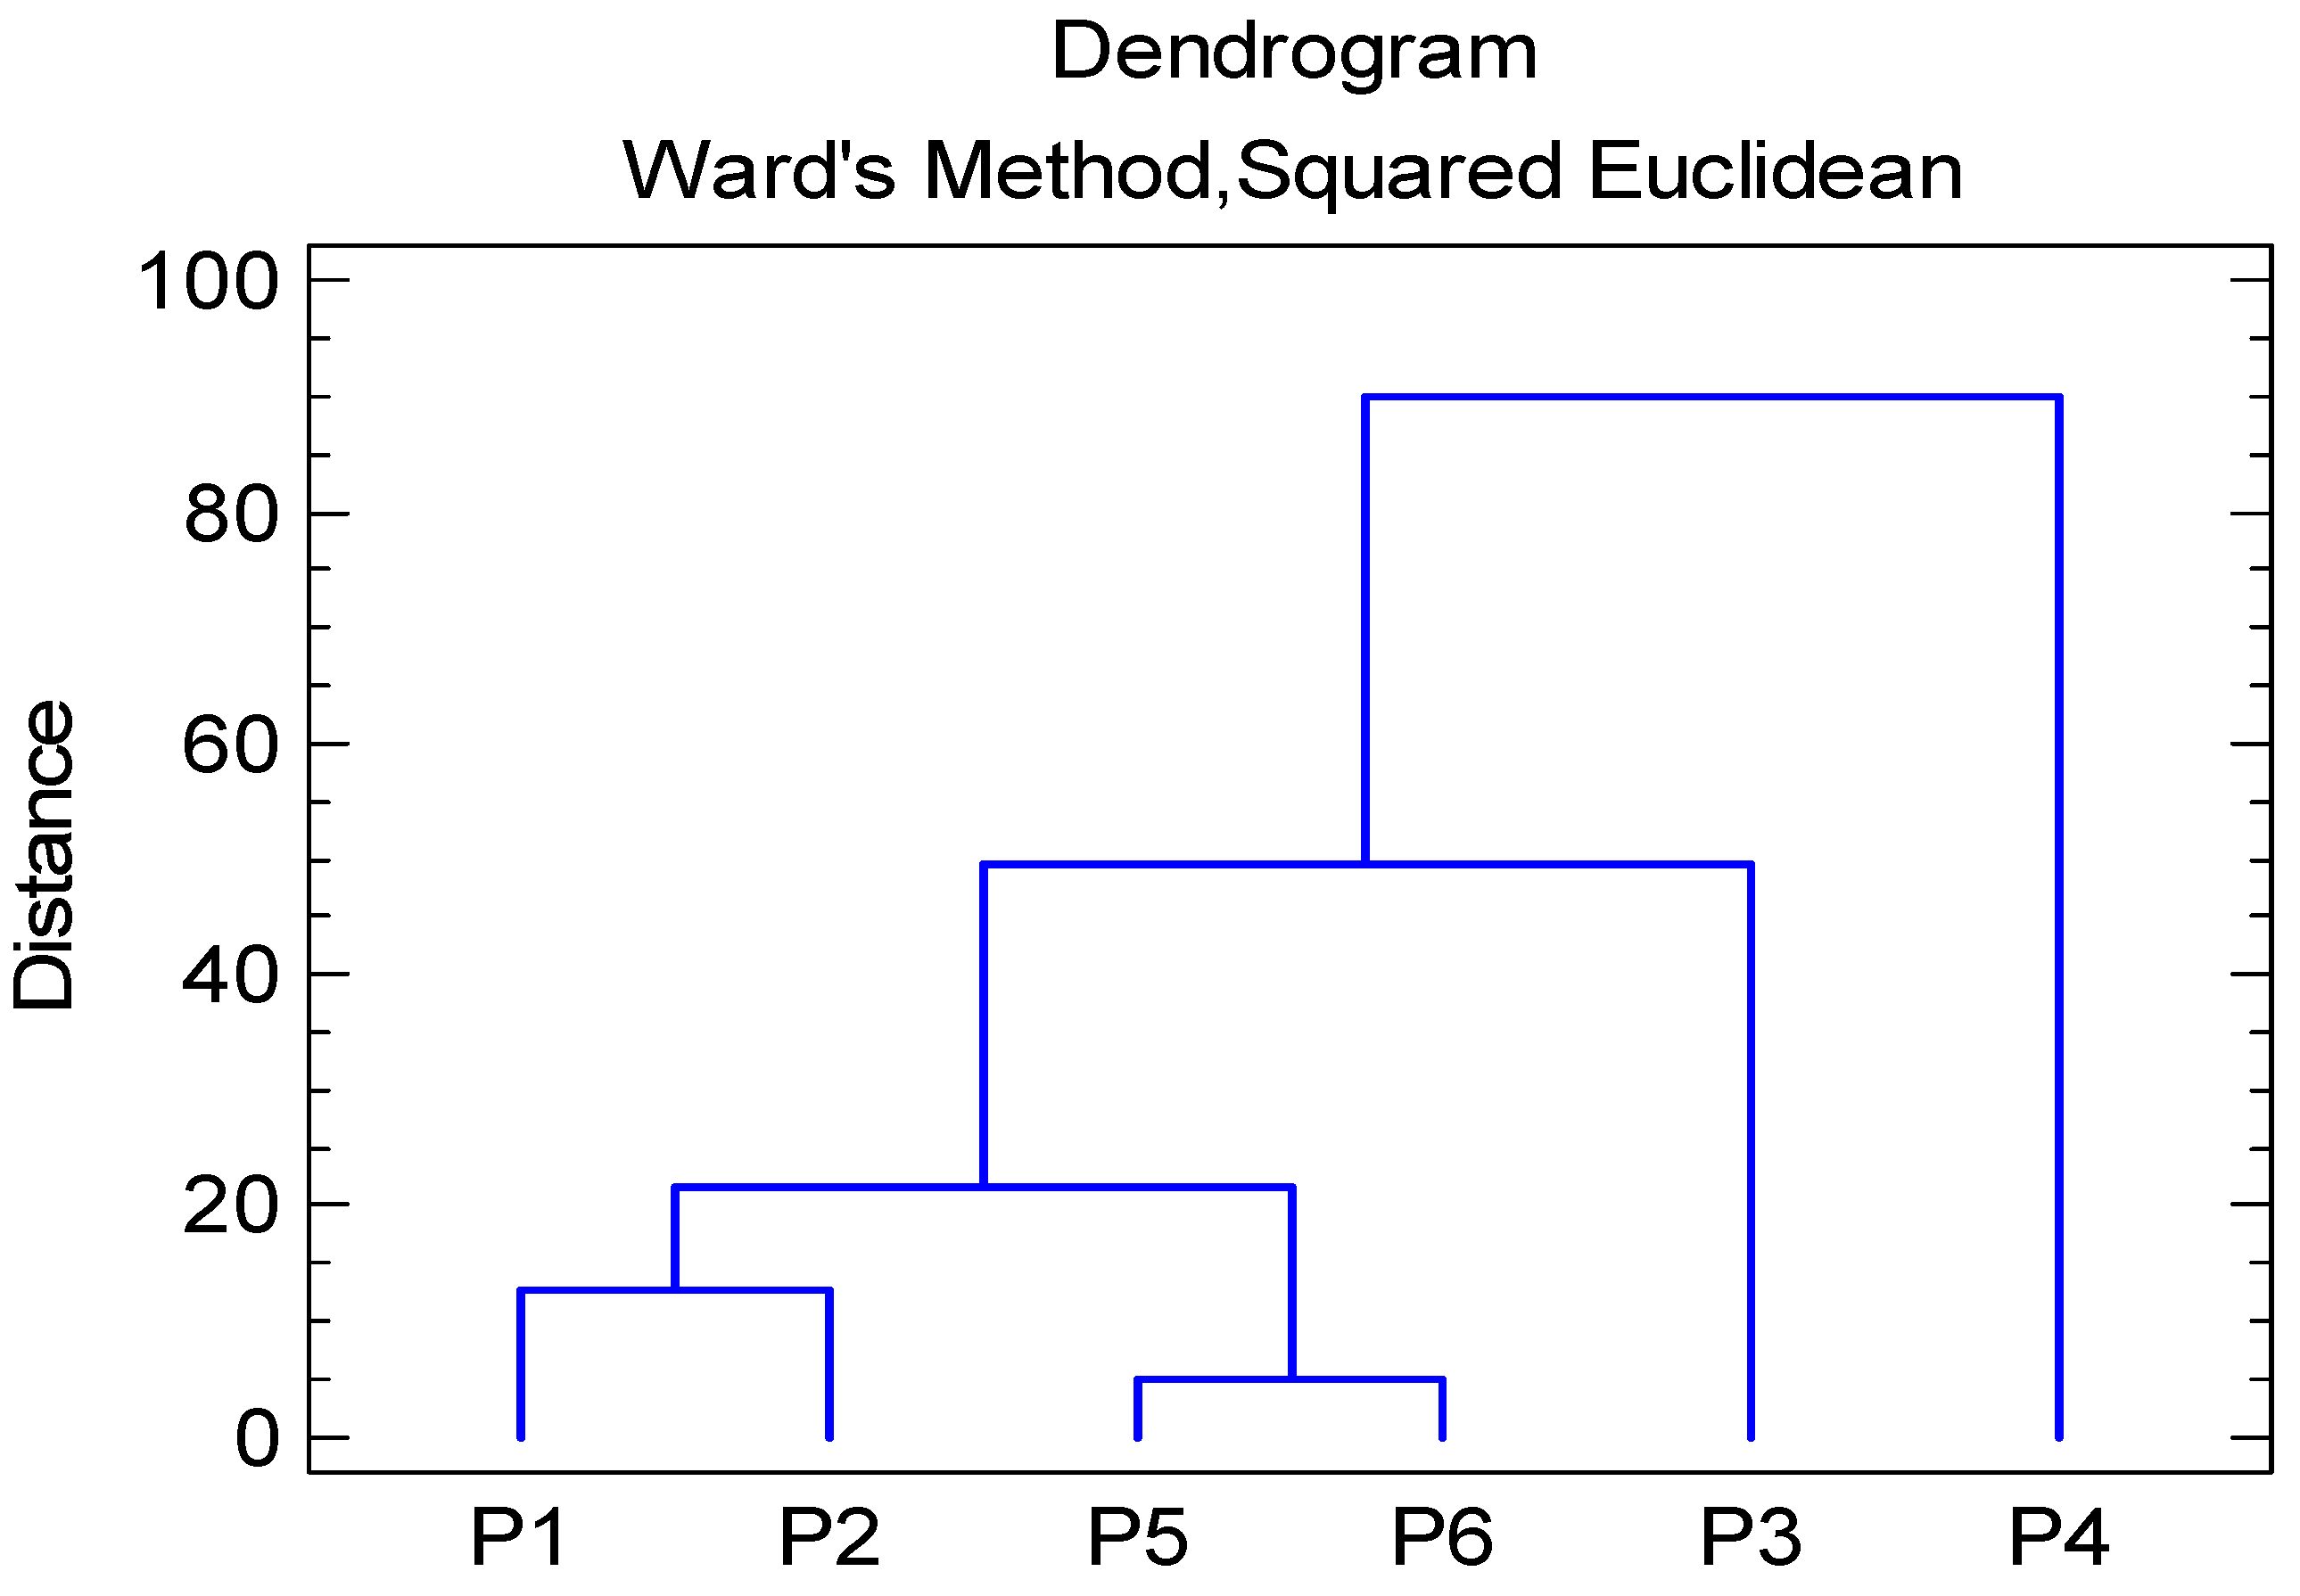
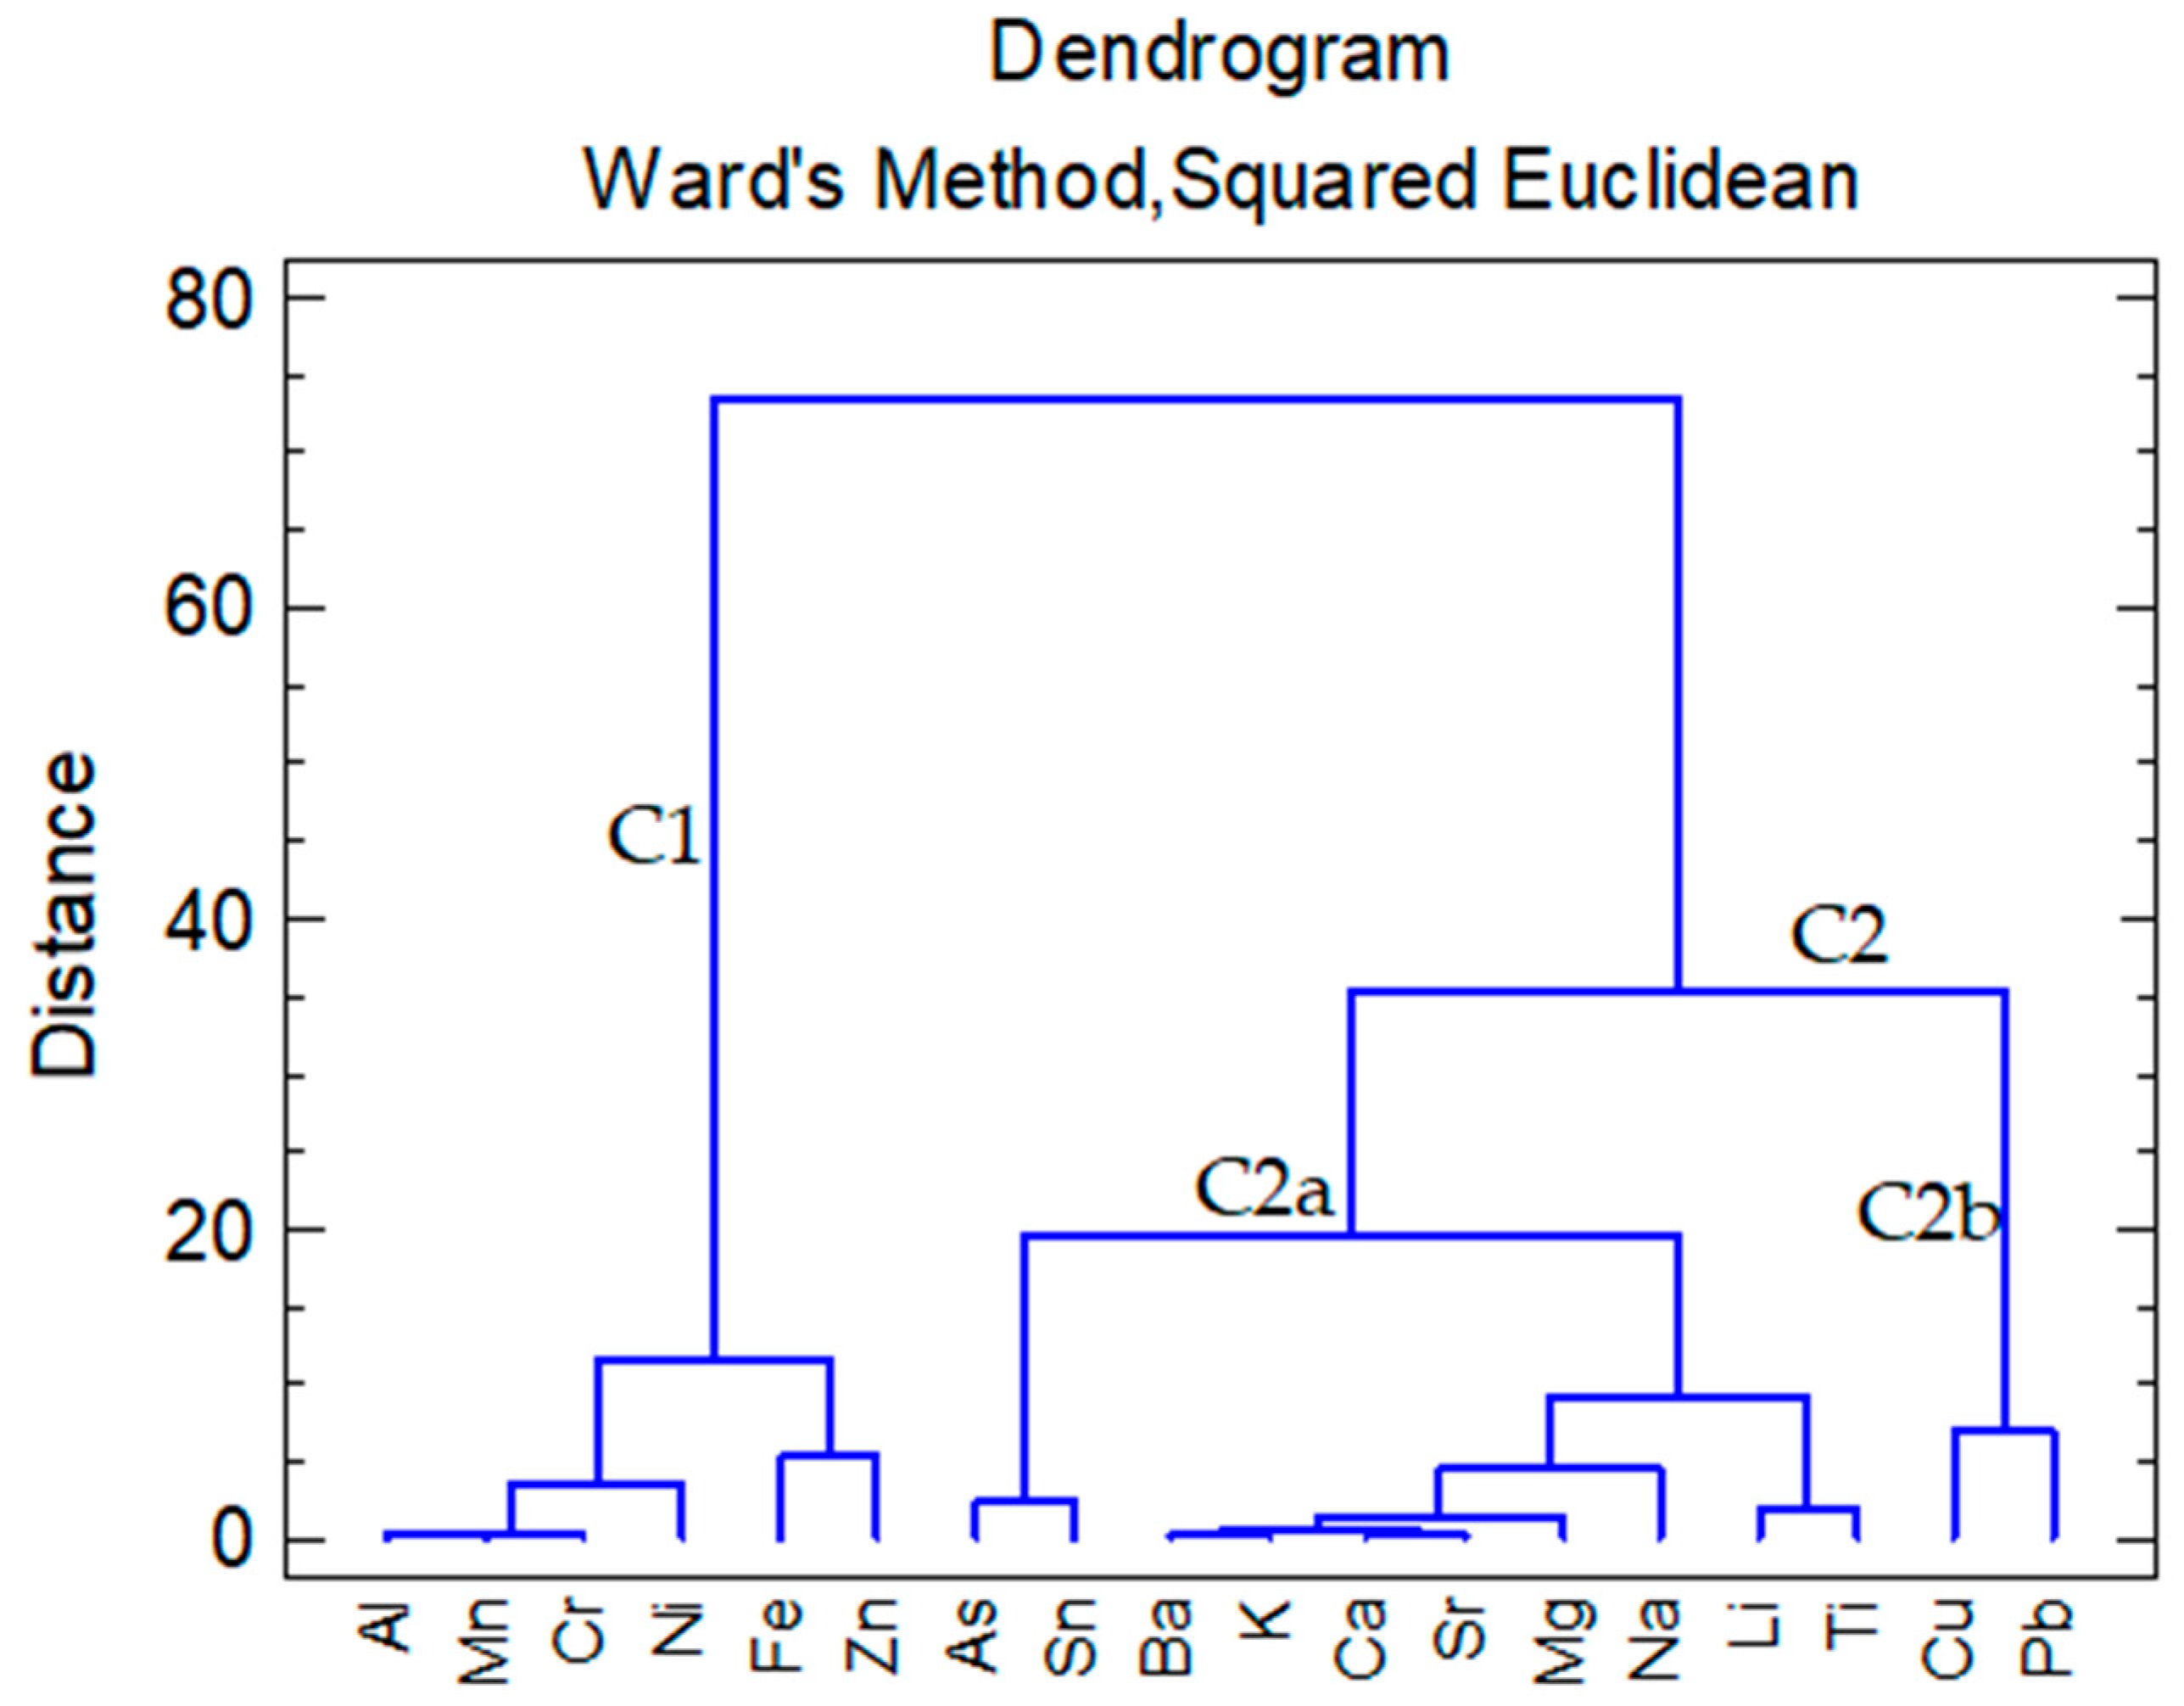
3.3. Cluster Analysis of Water Samples

Figure 2 shows the cluster analysis in the Q mode for groundwater sampling points based on the metal and As concentrations. The pairs of wells P5–P6 and P1–P2 showed the highest similarity, while the highest dissimilarity was found for well P4, one of the deepest wells (740 cm). The water from the P4 well exhibited the highest concentrations of several elements, including Na, K, Ca, Mg, Ba, Sr, Ti, As, and Zn, while the level of Ni was found to be the lowest. P3 also showed high dissimilarity from the samples P1, P2, P5, and P6. P3 registered the highest concentrations of Cr, Al, and Zn compared to the average values of the other groundwater sources. In the case of the pair of wells P5 and P6, the lowest levels of Cu, Al, Pb, Ti, and Mn were measured. P1 and P2 are wells with low depths (210 and 200 cm) while the depths of P5 and P6 are medium (550 cm and 400 cm).
Cluster analysis was also performed in the R mode (Figure 3), showing the similarities or dissimilarities between the metals and As concentrations in groundwater samples.
The R mode cluster analysis reveals two primary clusters, namely C1 and C2. C1 contains the group of Al-Mn-Cr linked to Ni and also to the Fe-Zn pair of heavy metals. This element is derived from the alumino-silicates that include Al, Mn, Cr, Fe, and Zn. Cluster C2 comprises two subclusters: C2a and C2b. C2a includes the pair As-Sn and a group of eight alkaline and alkaline earth metals (K, Na, Li, Ba, Ca, Sr, and Mg), along with Ti, the element ranking as the Earth’s ninth most prevalent [77,78]. Conversely, C2b encompasses the heavy metals Cu and Pb, nonferrous heavy metals naturally occurring in volcanic rocks.

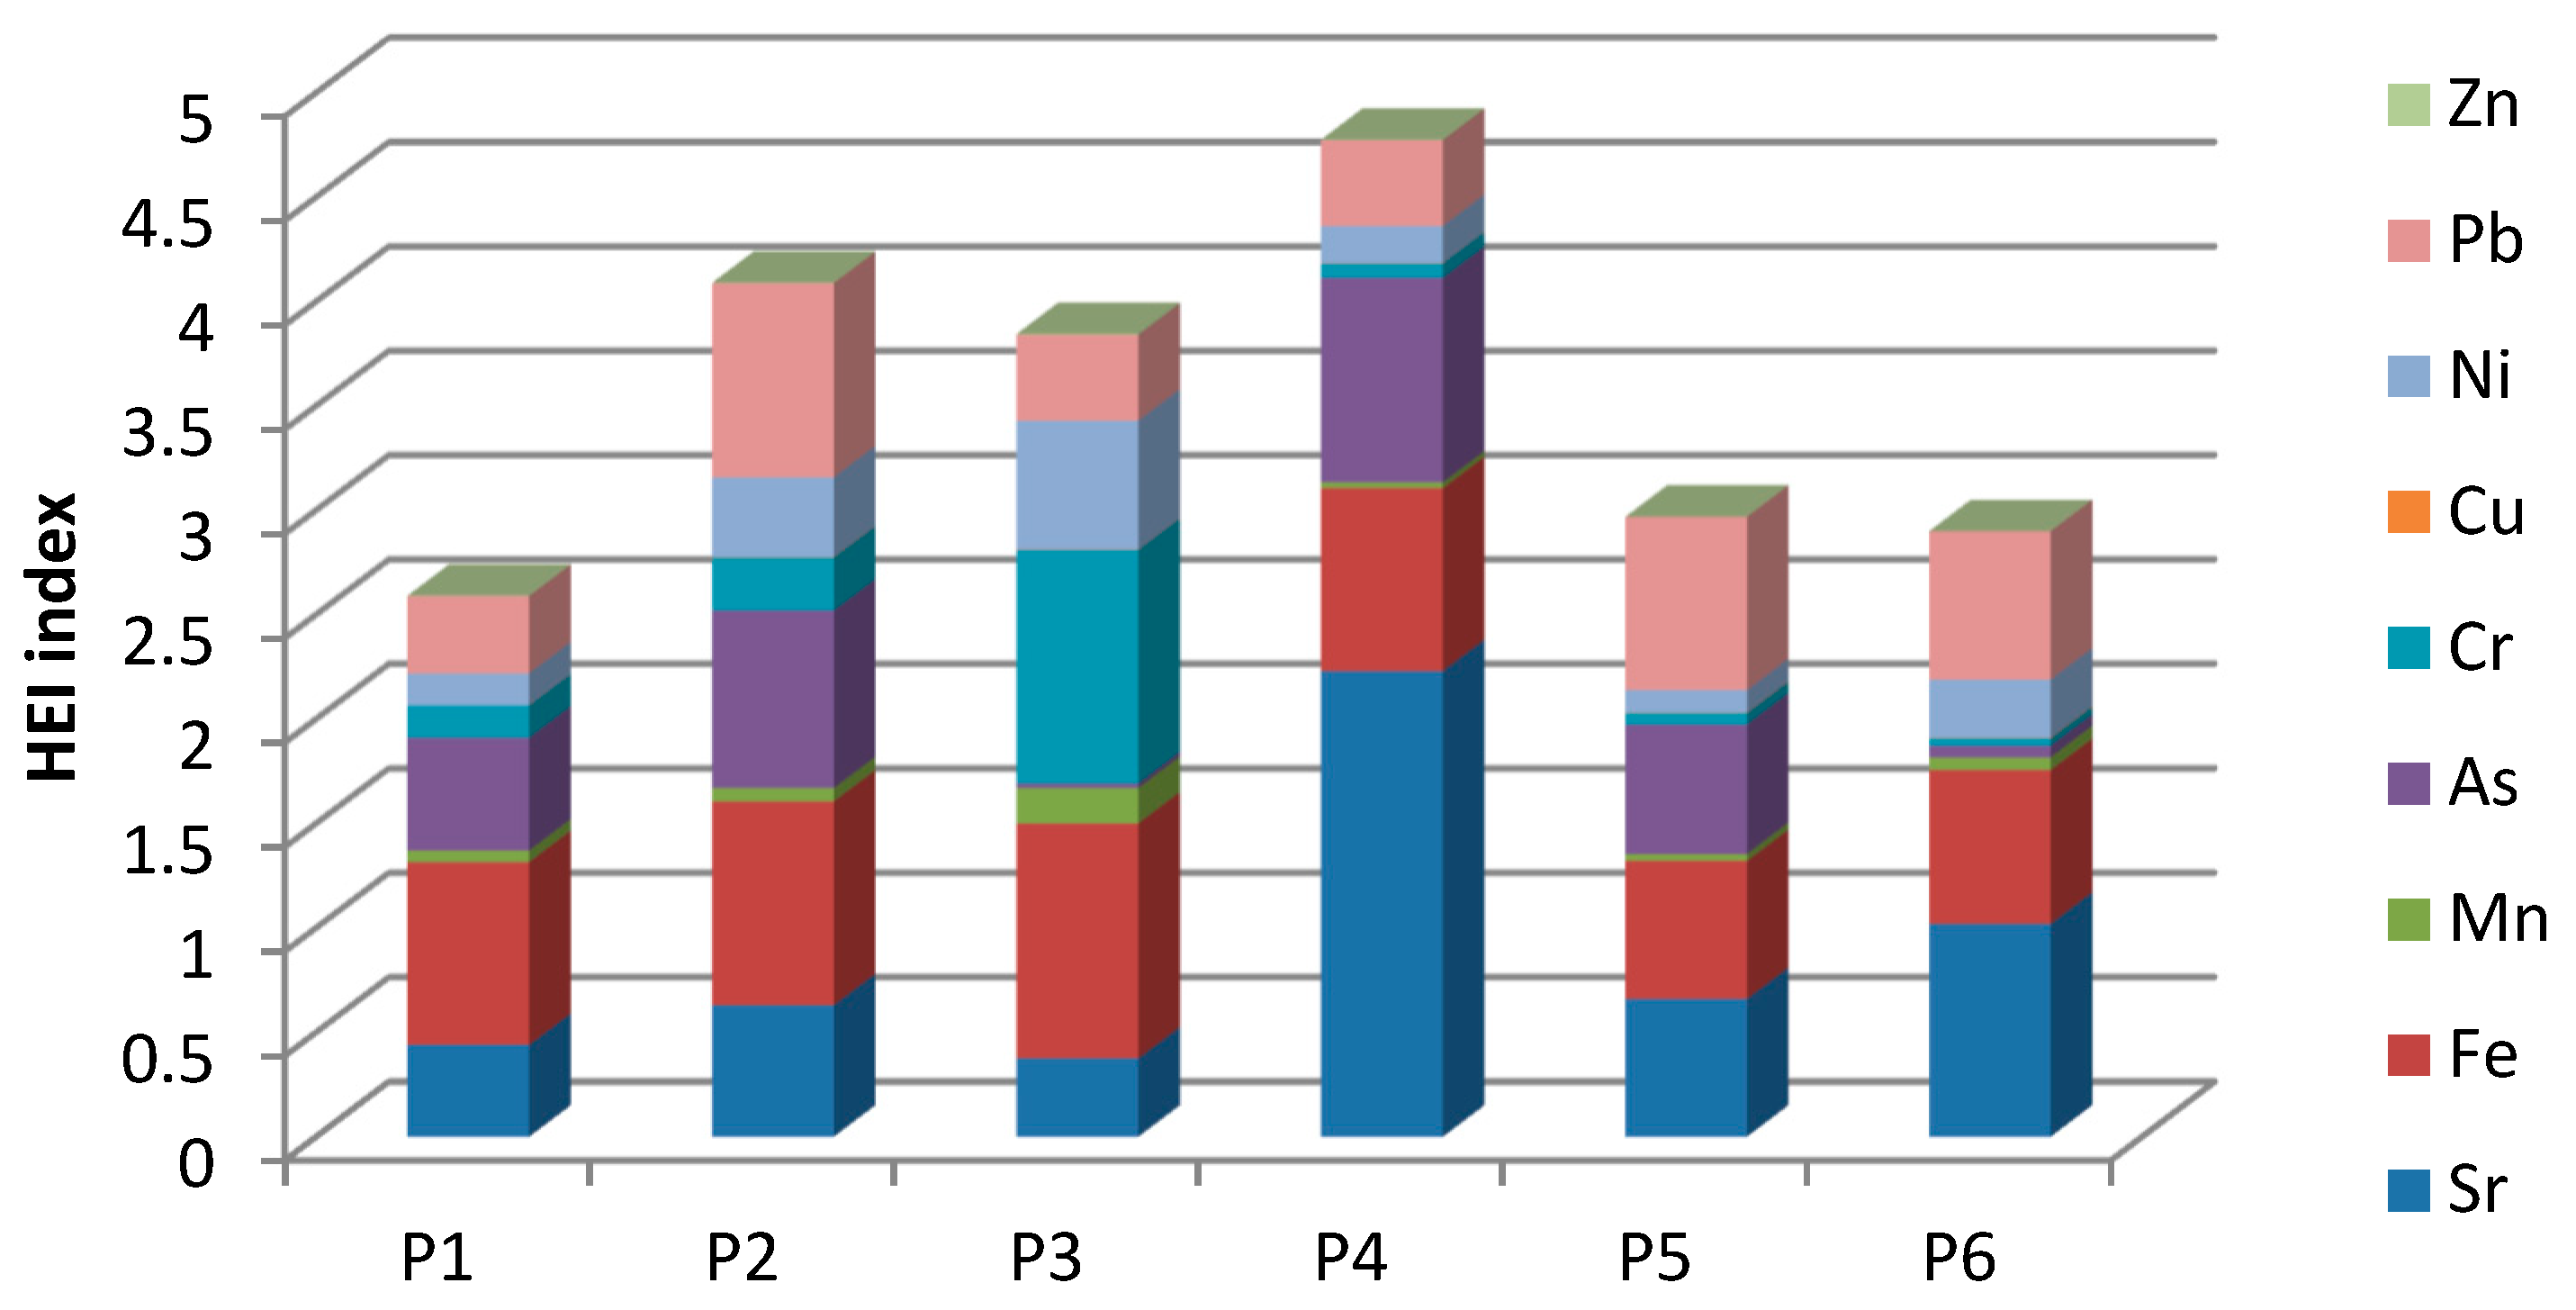
3.4. Heavy Metals Evaluation Index (HEI)

The HEI values depicted in Figure 4 varied in the range of 2.59 and 4.77 and can be classified as having a low pollution degree. The highest HEI value was calculated for P4 with 4.77, followed by P2 with 4.09, and the well with the lowest value of HEI was P1 (2.59). In the case of P4, Sr contributed the most to the HEI value (2.23), followed by As (0.98), Fe (0.88), and Pb (0.41).
The highest values of elemental HEI values were due to Sr (P4, P6), As (P4, P2), Fe (P1–P4), Pb (P2, P5), and Cr (P3).
An investigation into the extent of heavy metal contamination of dug and drilled wells in Seini town, NW Romania, reported higher HEI values than in the present study, ranging values between 1.5 and 14, still below 40, showing a low degree of pollution due to anthropic influences [40].
In areas impacted by industrial operations, the health risk index (HEI) demonstrated significantly elevated values. For instance, in a plain located in western Iran, influenced by an industrial town, the HEI values varied from 21.4 to 133.3.
The computation of HEI provides a quick evaluation of the comprehensive quality of drinking water [79].

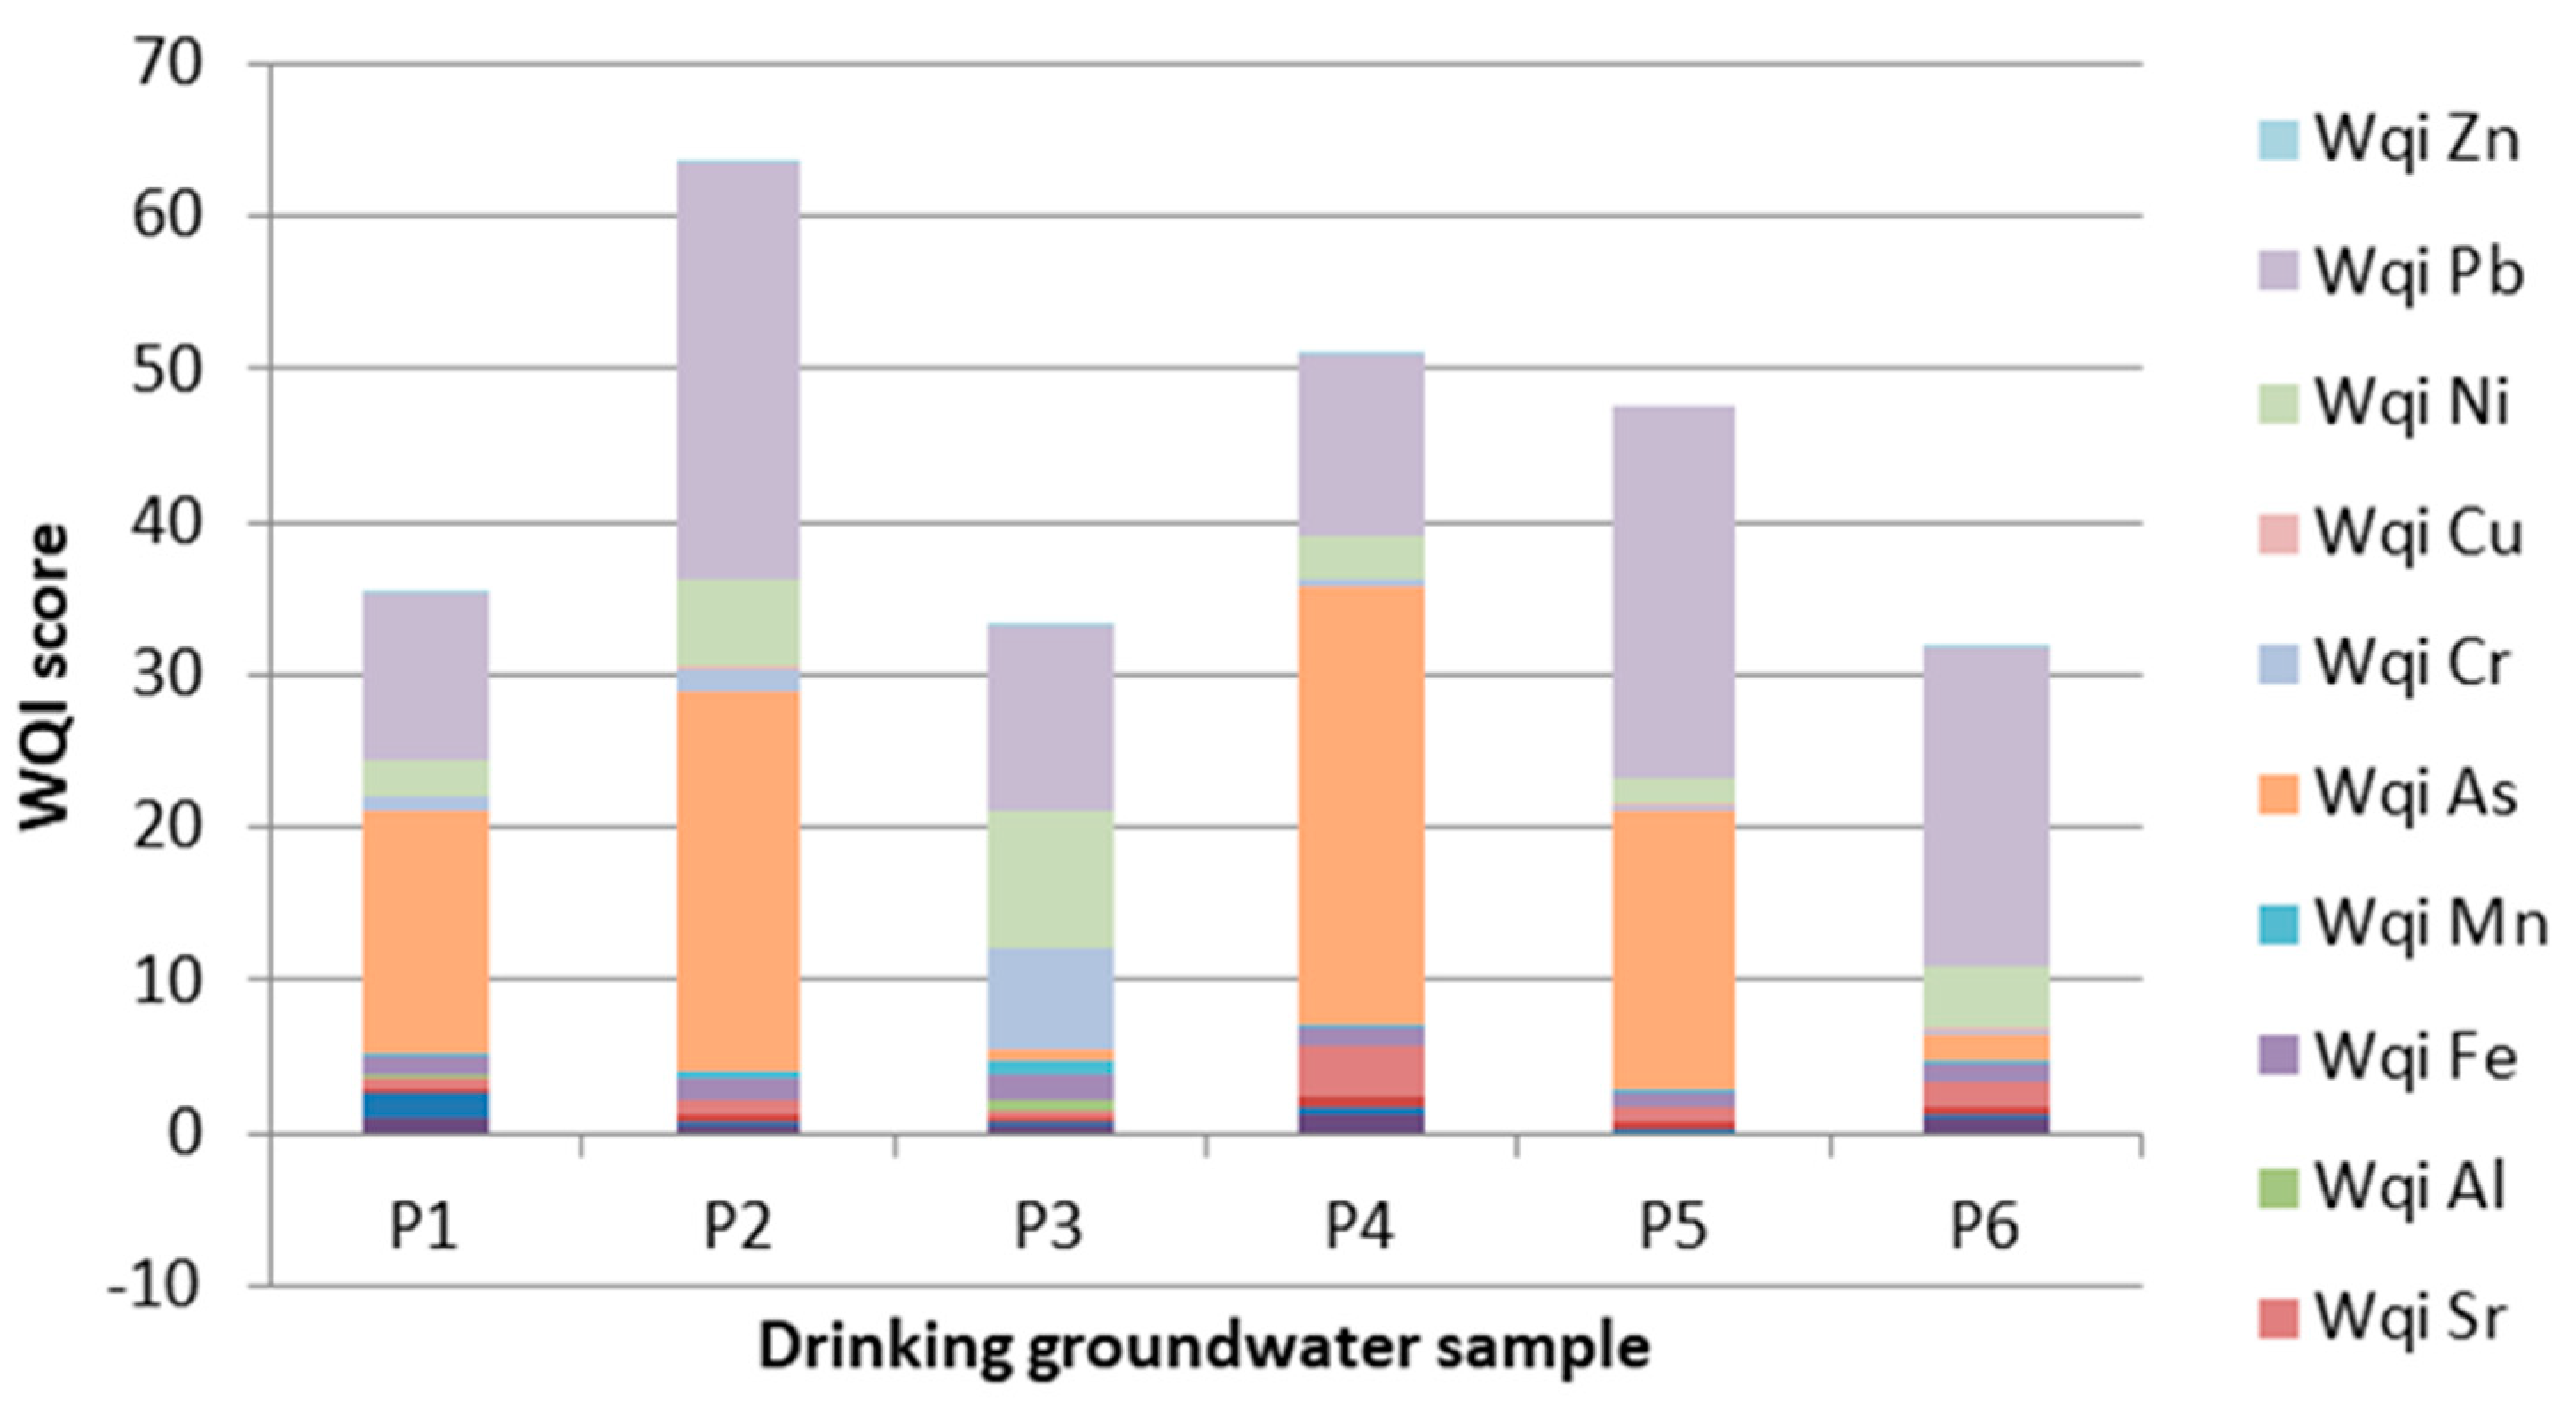
3.5. Water Quality Assessment by WQI

Table 3 displays the physico-chemical parameters employed in WQI computation, along with the corresponding parametric values, weights, relative weights, and the Qi range.
Figure 5 illustrates the assessment of groundwater quality for wells P1–P6 using the WQI method. WQI scores ranged from 31.75 to 63.43, with a mean value of 43.68 ± 12.50. P1, P3, P5, and P6 were classified as having excellent water quality. P4, having a 50.97 score, was very close to being classified as excellent quality, and P2 water was in the good quality class.
The main contributors to the WQI scores were As with a score of WQIAs in the range of 0.64–24.88 with the highest value found for the P2 sample, Ni (1.6–9.08) with the highest value for P3, and Pb (10.83–27.23) with the highest value for P2. The high value of WQI for Cr was calculated for P3 (6.53) while P4 registered a high value for WQISr (3.26). One study [46] stated that WQI indices, utilizing physico-chemical parameters of water, were employed to evaluate the water quality evolution of Teceu Lake. This lake is situated in the Upper Tisa protected area in the northwest of Romania, along with a groundwater source in close proximity. The assessment was conducted using WQI indices for the period spanning January to December 2022, presenting WQI in the range of 17.71–37.94 for groundwater source (excellent quality) while the WQI score of Teceu Lake water was between 22.95 and 146.31 and indicated excellent-quality, good-quality, and poor-quality water depending on the month in which the water samples were collected [46]. The WQI values showed an increasing trend during the month of the year, with maximum values in October and November, especially due to nutrient content, ammonium, and phosphates. In another investigation [40], focusing on Seini town in the northwest of Romania, WQI indices were derived from sixteen chemical indicators, encompassing key physico-chemical parameters, Al, and heavy metals. The findings revealed that 65% of the groundwater samples exhibited excellent quality, while the remaining samples demonstrated poor and very poor quality. This was attributed to elevated concentrations of NH4+, NO3, Fe, Cu, and Pb surpassing the maximum allowable concentrations (MAC). Globally, WQI values ranging from 51.84 to 159.41 indicate that the water quality of four lakes situated in the Bangalore Urban district, the most densely populated district in the Indian state of Karnataka, falls within poor, very poor, and unsuitable categories. This assessment is based on the consideration of 10 parameters: pH, turbidity, total alkalinity, total acidity, total phosphorus, chemical oxygen demand (COD), biochemical oxygen demand (BOD), dissolved oxygen (DO), nitrates, and total nitrogen [81]. Moreover, in Cameroon, the WQI scores of groundwater in the Ngoua watershed, the primary water supply source for Douala city, located at the shore of the Atlantic Ocean, vary between 2.12 and 187.21. In the computation of the WQI, the main physico-chemical indicators of water were considered: pH, turbidity, EC, total dissolved solids, salinity, and the concentrations of major cations and anions. The main contaminants in groundwater in the area were sulfates and nitrates [82].

3.6. Human Health Risk Assessment

The human health risk associated with P1–P6 groundwater consumption was assessed for adults (men and women) and children. The average CDI results of nitrogen compounds (NO3 and NH4+), metals, and As were obtained in the following order: NO3 > NH4+ > Sr > Fe > Cr > Pb > Ni > As > Cu. The highest values of CDI were found for NO3 in P6, with 0.12 mg/kg∙day for adults (men and women) and 0.51 mg/ kg∙day for children. High CDI values were calculated for NH4+ in P4: 0.0245 mg/kg∙day for men and women and in P1 (0.0198 mg/kg∙day) in the case of men and women, while for children the CDI was 0.105 mg/kg∙day. Between metals and As, the highest CDI was obtained for Sr in P4, with 0.01 mg/kg∙day for adults and 0.042 mg/kg∙day for children. CDI for Cr in P3 was 0.0013 mg/kg∙day for men and women and 0.005 mg/kg∙day for children. A high value of CDI was obtained for As in P4: 0.00022 and 0.00094 mg/kg∙day for adults and children, and in P2: 0.00019 and 0.00081 mg/kg∙day for adults and children. The hazard quotients and hazard index due to groundwater intake are shown in Table 4.
The risk indices were applied for NH4+, NO3, Sr, Fe, As, Cr, Cu, Ni, and Pb, for which the studied groundwater sources indicated high concentrations of these constituents around the MACs. Hazard quotient (HQ) values exceeded one for chromium in well P3 for both adults and children, as well as for children in groundwater sources P1–P4. High HQ Pb values for children showed that they are exposed to health risks due to water ingestion from all the groundwater sources investigated. The lowest HI values were assessed in the case of P6 (1.02 for adults and 4.74 for children), while the highest values were calculated for P3 groundwater. In the case of children, HQ values higher than one were computed for Cr in P1–P4, for Pb in all the groundwater sources, and for As in P1, P2, P4, and P5, and for Cu in P6. Other research indicated significantly higher HQ values for children compared to those calculated for adults [56,83,84].
Conversely, the health risk assessment of the groundwater sample in Seini town, NW of Romania, indicated HQ > 1 for NO3 in some of the samples but low values of HQ for Cu, Pb, and Mn [40]. Napo et al., 2021 [56], assessed the health risk associated with oral exposure to groundwater in Togo’s coastal sedimentary basin for males, women, and children, with a mean value of HQ of 0.963, 1.226, and 2.098, especially due to manganese, nitrate, arsenic, fluoride, and cadmium. The groundwater sources were affected by seawater intrusion, evaporite dissolution, and anthropogenic contamination. Moreover, groundwater in the Xinzhou Basin, situated in the semiarid region of central-eastern Shanxi Province in North China [83], was evaluated by computing the health risk posed by the contaminants NO3, NO2, and F, which exceeded the standard limits in some of the samples and found HQ oral values of 0.02 to 2.14 for men, 0.02 to 2.72 for women, and 0.04 to 4.66 for children. Health indices provide a precise evaluation of water quality risks for human consumption. Examining multiple parameters enhances the accuracy of identifying contaminants and health concerns. Utilizing these indices guides effective mitigation strategies, facilitates informed decision-making, and ultimately safeguards the well-being of communities relying on well water sources for multiple purposes.

4. Conclusions

This study delves into the assessment of water quality using pollution and quality indices, with a specific emphasis on evaluating potential human health risks linked to water consumption. The emphasis is on toxicological aspects that may impact human health, examining the correlation among chemical indicators that collectively influence well-being. The results indicate that groundwater specimens sourced from the safeguarded Tisa River Basin exhibit elevated levels of NH4+, Fe, Cl, and Mn, surpassing maximum allowable concentrations (MACs). Additionally, Cr concentrations exceed the MACs. Notably, ammonium concentrations were highest in P1, P4, and P6, resulting from the melting of snow, seepage with organic content, and the breakdown of vegetation and phytoplankton. The HEI values showed low levels of pollution. The WQI method indicated P1, P2, P4, and P6 as excellent-quality water, while the groundwater in P4 and P2 was classified as good quality. However, health risk assessment indicated a risk associated with water consumption higher than one in the case of all the groundwater sources, but the highest HQ value was computed for Cr in the P3 groundwater source. HI values were greater than 1 for all groundwater samples whose ingestion poses a health risk to consumers. The highest health risk assessed was computed for children, who are more vulnerable to the water pollutant due to their low mass. The findings underscore the need for sustainable and protective policies to mitigate potential adverse effects on human health. This research serves as a valuable foundation for future studies, particularly in areas with industrial and agricultural activities. Furthermore, it provides crucial information for water treatment specialists to design centralized water supply systems, ensuring that residents are informed about water quality and the potential health implications associated with their consumption.

Author Contributions

Conceptualization, T.D.; methodology, T.D. and A.A.; software, C.M.; validation, T.D. and C.M.; formal analysis, T.D., C.M. and A.A.; investigation, T.D., C.M. and A.A.; resources, T.D.; data curation, T.D. and A.A.; writing—original draft preparation, T.D. C.M. and A.A.; writing—review and editing, T.D., C.M. and A.A.; visualization, T.D., C.M. and A.A.; supervision, T.D. All authors have read and agreed to the published version of the manuscript.

Funding

This research received no external funding.

Data Availability Statement

Data is contained within the article.

Conflicts of Interest

The authors declare no conflicts of interest.

References

  1. Abanyie, S.K.; Apea, O.B.; Abagale, S.A.; Amuah, E.E.Y.; Sunkari, E.D. Sources and factors influencing groundwater quality and associated health implication: A review. Emerg. Contam. 2023, 9, 100207. [Google Scholar] [CrossRef]
  2. Grönwall, J.; Danert, K. Regarding Groundwater and DrinkingWater Access through A Human Rights Lens: Self-Supply as A Norm. Water 2020, 12, 419. [Google Scholar] [CrossRef]
  3. UNESCO World Water Assessment Programme. The United Nations World Water Development Report. 2023. Available online: https://unesdoc.unesco.org/ark:/48223/pf0000384659 (accessed on 3 December 2023).
  4. Burek, P.; Satoh, Y.; Fischer, G.; Kahil, M.T.; Scherzer, A.; Tramberend, S.; Nava, L.F.; Wada, Y.; Eisner, S.; Flörke, M.; et al. Water Futures and Solution: Fast Track Initiative (Final Report); IIASA Working Paper; International Institute for Applied Systems Analysis (IIASA): Laxenburg, Austria, 2016; Available online: https://pure.iiasa.ac.at/id/eprint/13008/ (accessed on 3 December 2023).
  5. Romania ClimThe World Bank Europe and Central Asia region. Romania Climate Change and Low Carbon Green Growth Program, Component B Sector Report, Integrated Water Resources Rapid Assessment, January 2014. Available online: https://documents1.worldbank.org/curated/en/675851468094456585/pdf/842640WP0P14660Box0382136B00PUBLIC0.pdf (accessed on 3 December 2023).
  6. Hussain, F.; Hussain, R.; Wu, R.-S.; Abbas, T. Rainwater Harvesting Potential and Utilization for Artificial Recharge of Groundwater Using Recharge Wells. Processes 2019, 7, 623. [Google Scholar] [CrossRef]
  7. Firoiu, D.; Ionescu, G.H.; Bandoi, A.; Florea, N.M.; Jianu, E. Achieving Sustainable Development Goals (SDG): Implementation of the 2030 Agenda in Romania. Sustainability 2019, 11, 2156. [Google Scholar] [CrossRef]
  8. Council Directive. 98/83/EC—On the Quality of Water Intended for Human Consumption. Available online: https://eur-lex.europa.eu/legal-content/EN/TXT/?uri=celex%3A31998L0083 (accessed on 20 December 2023).
  9. Schuteima, G.; Hooks, T.; McDermott, F. Water quality perceptions and private well management: The role of perceived risks, worry and control. J. Environ. Manag. 2020, 267, 110654. [Google Scholar] [CrossRef]
  10. Sandulescu, M. Geotectonics of Romania; Editura Tehnică: București, Romania, 1984. (In Romanian) [Google Scholar]
  11. Cioruta, B.-V.; Coman, M. Definition, Role, and Functions of Soil Related to the Knowledge Society and the Somes,-Tisa Hydrographic Area (Romania). Sustainability 2022, 14, 8688. [Google Scholar] [CrossRef]
  12. Florea, N.; Munteanu, I. Sistemul Român de Taxonomie a Solurilor (SRTS); Institutul Naţional de Cercetare-Dezvoltare Pentru Pedologie, Agrochimie şi Protecţia Mediului–ICPA: Bucureşti, Romania, 2012. (In Romanian) [Google Scholar]
  13. Toth, G.; Montanarella, L.; Stolbovoy, V.; Mate, F.; Bodis, K.; Jones, A.; Panagos, P.; Liedekerke, M.V. Soils of the European Union. JCR–Scientific and Technical Reports, European Commision Joint Research Centre Institute for Environment and Sustainability. 2012. Available online: https://data.europa.eu/doi/10.2788/87029 (accessed on 2 December 2023).
  14. Stanila, A.-L.; Dumitru, M. Soil zones in Romania and pedogenetic processes. Agric. Agric. Sci. Procedia 2016, 10, 135–139. [Google Scholar] [CrossRef]
  15. Oprea, R. Compendiu de Pedologie, 2nd ed.; Editura Universitara: Bucharest, Romania, 2013; ISBN 978-606-591-832-0. (In Romanian) [Google Scholar]
  16. Todd, D.K.; Mays, L.W. A Review Study on “Quality Assessment of Groundwater Resource in Centre India Region”. Int. J. Innov. Res. Technol. 2004, 4, 968–972. [Google Scholar]
  17. Arulnangai, R.; Sihabudeen, M.M.; Vivekanand, P.A.; Kamaraj, P. Influence of physico chemical parameters on potability of groundwater water in ariyalur of Tamil Nadu, India. Mater. Today Proc. 2021, 36, 923–928. [Google Scholar] [CrossRef]
  18. Velarde, L.; Nabavi, M.S.; Escalera, E.; Antti, M.L.; Akhtar, F. Adsorption of heavy metals on natural zeolites: A review. Chemosphere 2023, 328, 138508. [Google Scholar] [CrossRef] [PubMed]
  19. Hussain, T.S.; Faisal, A.A.H. Nanoparticles of (calcium/aluminium/CTAB) layered double hydroxide immobilization onto iron slag for removing of cadmium ions from aqueous environment. Arab. J. Chem. 2023, 16, 105031. [Google Scholar] [CrossRef]
  20. Khan, Z.I.; Ahmed, K.; Ahmed, T.; Zafar, A.; Alrefaei, A.F.; Ashfaq, A.; Akhtar, S.; Mahpara, S.; Mehmood, N.; Ugulu, I. Evaluation of nickel tixicity and potential health implications of agriculturally diversely irrigated wheat crop varieties. Arab. J. Chem. 2023, 16, 104934. [Google Scholar] [CrossRef]
  21. Senze, M.; Kowalska-Goralska, M.; Czyz, K. Availability of aluminum in river water supplying dam reservoirs in Lower Silesia considering the hydrochemical conditions. Environ. Nanotechnol. Monit. Manag. 2021, 16, 100535. [Google Scholar] [CrossRef]
  22. Mohanty, S.; Benya, A.; Hota, S.; Kumar, M.S.; Singh, S. Eco-toxicity of hexavalent chromium and its adverse impact on environment and human health in Sukinda Valley of India: A review on pollution and prevention strategies. Environ. Chem. Ecotox. 2023, 5, 46–54. [Google Scholar] [CrossRef]
  23. Siraj, K.; Kitte, S.A. Analysis of Copper, Zinc and Lead using Atomic Absorption Spectrophotometer in ground water of Jimma town of Southwestern Ethiopia. Int. J. Chem. Anal. Sci. 2013, 4, 201–204. [Google Scholar] [CrossRef]
  24. Hossain, M.; Bhattacharya, P.; Frape, S.K.; Ahmed, K.M.; Jacks, G.; Hasan, M.A.; Bromssen, M.; Shahiruzzaman, M.; Morth, C.M. A potential source of low-manganese, arsenic-safe drinking water from Intermediate Deep Aquifers (IDA), Bangladesh. Groundw. Sustain. Dev. 2023, 21, 100906. [Google Scholar] [CrossRef]
  25. Markeb, A.A.; Moral-Vico, J.; Sanchez, A.; Font, X. Optimization of lead (II) removal from water and wastewater using a novel magnetic nanocomposite of aminopropyl triethoxysilane coated with carboxymethyl cellulose cross-linked with shitosan nanoparticles. Arab. J. Chem. 2023, 16, 105022. [Google Scholar] [CrossRef]
  26. Wei, Z.; Gu, H.; Le, Q.V.; Peng, W.; Lam, S.S.; Yang, Y.; Li, C.; Sonne, C. Perspectives on phytoremediation of zinc pollution in air, water and soil. Sustain. Chem. Pharm. 2021, 24, 100550. [Google Scholar] [CrossRef]
  27. Beinabaj, S.M.H.; Heydariyan, H.; Aleii, H.M.; Hosseinzadeh, A. Concentration of heavy metals in leachate, soil, and plants in Teheran`s landfill: Investigation of the effect of landfill age on the intesity of polluation. Heliyon 2023, 9, e13017. [Google Scholar] [CrossRef]
  28. Chorol, L.; Gupta, S.K. Evalution of groudwater metal pollution index through analytical hierarchy process and its health risk assement via Monte Carlo simulation. Process Saf. Environ. Prot. 2023, 170, 855–864. [Google Scholar] [CrossRef]
  29. Rupias, O.J.B.; Pereira, S.Y.; Silva de Abreu, A.E. Hydrogeochemistry and groundwater quality assessment using the water quality index and heavy-metal pollution index in the alluvial plain of Atibaia river—Campinas/SP, Brazil. Groundw. Sustain. Dev. 2020, 15, 100661. [Google Scholar] [CrossRef]
  30. Alengebawy, A.; Abdelkhalek, S.T.; Qureshi, S.R.; Wang, M.-Q. Heavy metals and pesticides toxicity in agricultural soil and plants: Ecological risks and human health implications. Toxics 2021, 9, 42. [Google Scholar] [CrossRef] [PubMed]
  31. Zhang, S.; Han, Z.; Peng, J.; Chen, Y.; Zhan, L.; Li, J. Human health risk assessment for contaminated sites: A retrospective review. Environ. Int. 2023, 171, 107700. [Google Scholar] [CrossRef] [PubMed]
  32. Badeenezhad, A.; Soleimani, H.; Shahsavani, S.; Parseh, I.; Mohammadpour, A.; Azadbakht, O.; Javanmardi, P.; Faraji, H.; Nalosi, K.B. Comprehensive health risk analysis of heavy metal pollution using water quality indices and Monte Carlo simulation in R software. Sci. Rep. 2023, 13, 15817. [Google Scholar] [CrossRef] [PubMed]
  33. Munene, E.N.; Hashim, N.O.; Ambusso, W.N. Human health risk assessment of heavy metal concentration in surface water of Sosian river, Eldoret town, Uasin-Gishu County Kenya. MothodsX 2023, 11, 102298. [Google Scholar] [CrossRef] [PubMed]
  34. Li, P.; Karunanidhi, D.; Subramani, T.; Srinivasamoorthy, K. Sources and consequences of groundwater contamination. Arch. Environ. Contam. Toxicol. 2021, 80, 1–10. [Google Scholar] [CrossRef] [PubMed]
  35. Huang, G.; Hou, Q.; Han, D.; Liu, R.; Song, J. Large scale occurrence of aluminium-rich shallow groundwater in the Pearl River Delta after the rapid urbanization: Co-effects of anthropogenic and geogenic factors. J. Contam. Hydrol. 2023, 254, 104130. [Google Scholar] [CrossRef] [PubMed]
  36. SR EN ISO 5667-3:2018; Calitatea apei. Prelevare. Partea 3: Conservarea ¸si Manevrarea Probelor de Apa. ISO: Geneva, Switzerland, 2018. (In Romanian)
  37. Dippong, T.; Mihali, C.; Cical, E. Metode de Determinare a Proprietatilor Fizico-Chimice ale Alimentelor; Risoprint: Cluj-Napoca, Romania, 2016; ISBN 978-973-53-1773-7. (In Romanian) [Google Scholar]
  38. ISO 7888:1985; Water Quality—Determination of Electrical Conductivity. ISO: Geneva, Switzerland, 1985.
  39. SR EN ISO 10523:2012; Calitatea apei. Determinarea pH-ului. ISO: Geneva, Switzerland, 2012. (In Romanian)
  40. Dippong, T.; Mihali, C.; Hoaghia, A.M.; Cical, E.; Cosma, A. Chemical modeling of groundwater quality in the aquifer of Seini town-Somes Plain, Northwestern Romania. Ecotoxicol. Environ. Saf. 2019, 168, 88–101. [Google Scholar] [CrossRef] [PubMed]
  41. Bhuiyan, M.A.H.; Islam, M.A.; Dampare, S.B.; Parvez, L.; Suzuki, S. Evaluation of hazardous metal pollution in irrigation and drinking water systems in the vicinity of a coal mine area of northwestern Bangladesh. J. Hazard. Mater. 2010, 179, 1065–1077. [Google Scholar] [CrossRef]
  42. Varol, M.; Gökot, B.; Bekleyem, A. Dissolved heavy metals in the Tigris River (Turkey): Spatial and temporal variations. Environ. Sci. Pollut. Res. 2013, 20, 6096–6108. [Google Scholar] [CrossRef]
  43. González, S.O.; Almeida, C.; Calderón, M.; Mallea, M.A.; González, P. Assessment of the water self-purification capacity on a river affected by organic pollution: Application of chemometrics in spatial and temporal variations. Environ. Sci. Pollut. Res. 2014, 21, 10583–10593. [Google Scholar] [CrossRef]
  44. Uddin, M.G.; Nash, S.; Agnieszka, I.; Olbert, A.I. A review of water quality index models and their use for assessing surface water quality. Ecol. Ind. 2021, 122, 107218. [Google Scholar] [CrossRef]
  45. Mare Roșca, O.; Dippong, T.; Marian, M.; Mihali, C.; Mihalescu, L.; Hoaghia, M.A.; Jelea, M. Impact of anthropogenic activities on water quality parameters of glacial lakes from Rodnei mountains, Romania. Environ. Res. 2020, 182, 109136. [Google Scholar] [CrossRef] [PubMed]
  46. Dippong, T.; Mihali, C.; Avram, A. Water Physico-Chemical Indicators and Metal Assessment of Teceu Lake and the Adjacent Groundwater Located in a Natura 2000 Protected Area, NW of Romania. Water 2023, 15, 3996. [Google Scholar] [CrossRef]
  47. Manoj, K.; Ghosh, S.; Padhy, P.K. Characterization and classification of hydrochemistry using multivariate graphical and hydrostatistical techniques. Res. Chem. Sci. 2013, 3, 32–42. [Google Scholar]
  48. Harter, T.; Davis, H.; Mathews, M.C.; Meyer, R.D. Shallow groundwater quality on dairy farms with irrigated forage crops. J. Contam. Hydrol. 2022, 55, 287–315. [Google Scholar] [CrossRef] [PubMed]
  49. Chen, M.; Al-Maktoumi, A.; Al-Mamari, H.; Izady, A.; Nikoo, M.R.; Al-Busaidi, H. Oxygenation of aquifers with fluctuating water table: A laboratory and modeling study. J. Hydrol. 2020, 590, 125261. [Google Scholar] [CrossRef]
  50. Dimri, D.; Daverey, A.; Kuman, A.; Sharma, A. Monitoring water quality of River Ganga using multivariate techniques and WQI (Water Quality Index) in Western Himalayan region of Uttarakhand, India. Environ. Nanotechnol. Monit. Manag. 2021, 15, 100375. [Google Scholar] [CrossRef]
  51. Lu, B.T.; Luo, J.L.; Norton, P.R. Environmentally assisted cracking mechanism of pipeline steel in near-neutral pH groundwater. Corros. Sci. 2010, 52, 1787–1795. [Google Scholar] [CrossRef]
  52. Wilkin, R.T.; DiGiulio, D.C. Geochemical impacts to groundwater from geologic carbon sequestration: Controls on pH and inorganic carbon concentrations from reaction path and kinetic modelling. Environ. Sci. Technol. 2010, 44, 4821–4827. [Google Scholar] [CrossRef]
  53. Mohammed, I.; Al-Khalaf, S.K.H.; Alwan, H.H.; Naje, A.S. Environmental assessment of Karbala water treatment plant using water quality index (WQI). Mater. Today Proc. 2022, 60, 1554–1560. [Google Scholar] [CrossRef]
  54. Nawaz, R.; Nasim, I.; Irfan, A.; Islam, A.; Naeem, A.; Ghani, N.; Irshad, M.A.; Latif, M.; Un Nisa, B.; Ullah, R. Water Quality Index and Human Health Risk Assessment of Drinking Water in Selected Urban Areas of a Mega City. Toxics 2023, 11, 577. [Google Scholar] [CrossRef] [PubMed]
  55. Emmanuel, U.C.; Chukwudi, M.I.; Monday, S.S.; Anthony, A.I. Human health risk assessment of heavy metals in drinking water sources in three senatorial districts of Anambra State, Nigeria. Toxicol. Rep. 2022, 9, 869–875. [Google Scholar] [CrossRef]
  56. Napo, G.; Akpataku, K.V.; Seyf-Laye, A.S.M.; Gnazou, M.D.T.; Bawa, L.M.; Djaneye-Boundjou, G. Assessment of Shallow Groundwater Quality Using Water Quality Index and Human Risk Assessment in the Vogan-Attitogon Plateau, Southeastern (Togo). J. Environ. Poll. Hum. Health 2021, 9, 50–63. [Google Scholar] [CrossRef]
  57. Average Height and Weight by Country. Available online: https://www.worlddata.info/average-bodyheight.php (accessed on 2 December 2023).
  58. United States Environmental Protection Agency. IRIS (Integrated Risk Information System). A–Z List of Substances; United States Environmental Protection Agency: Washington, DC, USA, 1987. Available online: https://www.epa.gov/iris (accessed on 3 December 2023).
  59. Qaiyum, M.S.; Shaharudin, M.S.; Syazwan, A.I.; Muhaimin, A. Health Risk Assessment after Exposure to Aluminium in Drinking Water between Two Different Villages. J. Water Resour. Prot. 2011, 3, 268–274. [Google Scholar] [CrossRef]
  60. Tsuji, S.J.; Perez, V.; Garry, M.R.; Alexander, D.D. Association of low-level arsenic exposure in drinking water with cardiovas-cular disease: A systematic review and risk assessment. Toxicology 2014, 323, 78–94. [Google Scholar] [CrossRef]
  61. Mawari, G.; Kumar, N.; Sarkar, S.; Frank, A.L.; Daga, M.K.; Singh, M.M.; Joshi, T.K.; Singh, I. Human Health Risk Assessment due to Heavy Metals in Ground and Surface Water and Association of Diseases With Drinking Water Sources: A Study from Maharashtra, India. Environ. Health Insights 2022, 16, 1–11. [Google Scholar] [CrossRef]
  62. Rivett, M.O.; Buss, S.R.; Morgan, P.; Smith, J.W.; Bemment, C.D. Nitrate attenuation in groundwater: A review of biogeochemical controlling processes. Water Res. 2008, 42, 4215–4232. [Google Scholar] [CrossRef]
  63. Laha, F.; Gashi, F.; Cadraku, H. Variations in the physico-chemical parameters of Grinaja catchment groundwater. IFAC-PapersOnLine 2019, 49, 200–205. [Google Scholar]
  64. Adesakin, T.A.; Oyewale, A.T.; Bayero, U.; Mohammed, A.N.; Aduwo, I.A.; Ahmed, P.Z.; Abubakar, N.D.; Barje, I.B. Assessment of bacteriological quality and physico-chemical parameters of domestic water sources in Samaru community, Zaria, Northwest Nigeria. Heliyon 2020, 6, e04773. [Google Scholar] [CrossRef]
  65. Dippong, T.; Mihali, C.; Mare Rosca, O.; Marian, M.; Payer, M.M.; Tîbîrnac, M.; Bud, S.; Coman, G.; Kovacs, E.; Hoaghia, M.-A. Physico-chemical characterization of water wells from Remeti, Maramures. Stud. Univ. Babes-Bolyai Chem. 2021, 66, 197–211. [Google Scholar] [CrossRef]
  66. World Health Organization. Guidelines for Drinking-Water Quality, 4th ed.; WHO: Geneva, Switzerland, 2011; pp. 1–541. ISBN 978-92-4-154815-1. [Google Scholar]
  67. Weisner, M.L.; Harris, M.S.; Mitsova, D.; Liu, W. Drinking water disparities and aluminum concentrations: Assessing socio-spatial dimensions across an urban landscape. Soc. Sci. Humanit. Open 2023, 8, 100536. [Google Scholar] [CrossRef]
  68. Nguyen, P.M.; Mulligan, G.N. Study on the influence of water composition on iron nail corrosion and arsenic removal performace of the Kanchan arsenic filter (KAF). J. Hazard. Mater. Adv. 2023, 10, 100285. [Google Scholar] [CrossRef]
  69. Khan, M.; Din, I.; Aziz, F.; Qureshi, I.U.; Zahid, M.; Mustafa, G.; Sher, A.; Hakim, S. Chromium adsorption from water using mesoporous magnetic iron oxide-aluminum silicate absorbent: An investigation of adsorbtion isotherms and kinetics. Curr. Res. Green Sustain. Chem. 2023, 7, 100368. [Google Scholar] [CrossRef]
  70. Qu, Y.; Ji, S.; Sun, Q.; Zhao, F.; Li, Z.; Zhang, M.; Li, Y.; Zheng, L.; Song, H.; Zhang, W.; et al. Association of urinary nickel levels with diabetes and fasting blood glucose levels: A nationwide Chine population-based study. Ecotox. Environ. Saf. 2023, 252, 114601. [Google Scholar] [CrossRef] [PubMed]
  71. Li, L.; Sun, F.; Liu, Q.; Zhao, X.; Song, K. Development of regional water quality criteria of lead for protecting aquatic organism in Taihu Lake, China. Ecotox. Environ. Saf. 2021, 222, 112479. [Google Scholar] [CrossRef] [PubMed]
  72. Abbaszade, G.; Tserendorj, D.; Salazar-Yanez, N.; Zachary, D.; Volgyesi, P.; Toth, E. Lead and stable lead isotopes as tracers of soil pollution and human health risk assessment in former industrail citisen of Hungary. Appl. Geochem. 2022, 145, 105397. [Google Scholar] [CrossRef]
  73. Obasi, P.N.; Akudinobi, B.B. Potential health risk and levels of heavy metals in water resources of lead–zinc mining communities of Abakaliki, southeast Nigeria. Appl. Water Sci. 2020, 10, 184. [Google Scholar] [CrossRef]
  74. Krok, B.; Mohammadian, S.; Noll, H.M.; Surau, C.; Markwort, S.; Fritzsche, A.; Nachev, M.; Sures, B.; Meckenstock, R.U. Remediation of zinc-contaminated groundwater by iron oxide in situ adsorption barriers—From lab to the field. Sci. Total Environ. 2022, 897, 151066. [Google Scholar] [CrossRef]
  75. Peng, H.; Yao, F.; Xiong, S.; Wu, Z.; Niu, G.; Lu, T. Strontium in public drinking water and associated public health risks in Chinese cities. Environ. Sci. Pollut. Res. 2021, 28, 23048–23059. [Google Scholar] [CrossRef]
  76. Manea, A.; Dumitru, M.; Vrinceanu, N.; Eftene, A.; Anghel, A.; Vrinceanu, A.; Ignat, P.; Dumitru, S.; Mocanu, V. Soil heavy metal status from Maramures county, Romania. In Proceedings of the GLOREP 2108 Conference, Timisoara, Romania, 15–17 November 2018. [Google Scholar]
  77. La Maestra, S.; D’Agostini, F.; Sanguineti, E.; González, A.Y.; Annis, S.; Militello, G.M.; Giovanni Parisi, G.; Scuderi, A.; Gaggero, L. Dispersion of Natural Airborne TiO2 Fibres in Excavation Activity as a Potential Environmental and Human Health Risk. Int. J. Environ. Res. Public Health 2021, 18, 6587. [Google Scholar] [CrossRef]
  78. Shi, H.; Magaye, R.; Castranova, V.; Zhao, J. Titanium dioxide nanoparticles: A review of current toxicological data. Part. Fibre Toxicol. 2013, 10, 15. [Google Scholar] [CrossRef]
  79. Lorestani, B.; Merrikhpour, H.; Cheraghi, M. Assessment of heavy metals concentration in groundwater and their associated health risks near an industrial area. Environ. Health Eng. Manag. 2020, 7, 67–77. [Google Scholar] [CrossRef]
  80. Law 311 from 6rd June 2004 That Improves and Complements Law 458 from 29 July 2002 Regarding the Quality of Drinking Water. Official Gazette. Part I, no. 582/30.06.2004. (In Romanian). Available online: https://www.lege-online.ro/lr-LEGE-311%20-2004-(53106)-(1).html (accessed on 3 December 2023).
  81. Mishra, M.; Singhal, A.; Sriniva, R. Effect of urbanization on the urban lake water quality by using water quality index (WQI). Mater. Today Proc. 2023. [Google Scholar] [CrossRef]
  82. Billong, P.T.N.; Feumba, R.; Ndjigui, P.-D. Hydrogeochemical appraisal of groundwater quality in Ngoua watershed (Doua-la-Cameroon): Implication for domestic purposes. Sci. Afr. 2023, 22, e01910. [Google Scholar] [CrossRef]
  83. Chen, F.; Yao, L.; Mei, G.; Shang, Y.; Xiong, F.; Ding, Z. Groundwater Quality and Potential Human Health Risk Assessment for Drinking and Irrigation Purposes: A Case Study in the Semiarid Region of North China. Water 2021, 13, 783. [Google Scholar] [CrossRef]
  84. Hopenhayn, C.; Ferreccio, C.; Browning, S.R.; Huang, B.; Peralta, C.; Gibb, H.; Hertz-Picciotto, I. Arsenic Exposure from Drinking Water and Birth Weight. Epidemiology 2003, 14, 593–602. [Google Scholar] [CrossRef] [PubMed]
Figure 1. Sampling point (P1–P6) in the studied area.
Water 16 00539 g001
Figure 2. Cluster analysis in Q mode for groundwater sampling points based on the metal and As concentrations.
Water 16 00539 g002
Figure 3. Cluster analysis in R mode for groundwater sampling points based on metal and As concentrations.
Water 16 00539 g003
Figure 4. HEI values of the groundwater sources in Piatra locality based on As and metal concentrations (Sr, Fe, Mn, Cr, Cu, Ni, Pb, and Zn).
Water 16 00539 g004
Figure 5. The water quality indices (WQI) of groundwater samples P1–P6 are shown as a stacked graphic, showing the main contribution to the WQI score.
Water 16 00539 g005
Table 1. Physico-chemical composition of groundwater sources in Piatra locality, a Natura 2000 protected area, and standards (maximum allowable concentration—MAC) in accordance with Council Directive 98/83/EC [8].
Element Content in Water, μg/LP1P2P3P4P5P6MeanSDCV, %Stnd.
Skewness
Stnd.
Kurtosis
MAC
EC (μS/cm)763398172120519225249741082.491.290.342500
pH7.087.127.557.186.987.617.250.263.610.72−0.846.5–9.5
DO (mg/L)6.795.659.065.339.779.557.692.0126.13−0.16−1.34
T (NTU)1.313.928.751.142.565.483.862.9075.201.010.225
NH4+ (mg/L)0.880.480.281.090.040.770.590.3966.82−0.21−0.640.5
NO3 (mg/L)4.212.381.282.230.155.322.601.8972.950.33−0.3850
ht (og)24.710.22.7525.64.422.1611.6410.8593.220.71−0.99min 5
Cl (mg/L)41.566.539.5565.262.829.2134.12211.67157.832.422.95250
PO43− (mg/L)0.860.130.150.190.170.140.270.29105.442.422.940.4
Notes: The maximum allowable concentration (MAC) for drinking water, as stipulated by Law 311/2004 and Law M.O. No. 458/2002, in accordance with the law on the quality of drinking water (552/29 July 2002). SD represents the standard deviation; CV denotes the coefficient of variance; and Stnd signifies standardized. The values highlighted in bold surpassed the MAC.
Table 2. The metal and As content of groundwater sources in Piatra locality, a Natura 2000 protected area and standards (maximum allowable concentration—MAC) in accordance with Council Directive 98/83/EC [8].
Element Content in Water, μg/LP1P2P3P4P5P6MeanSDCV, %Stnd.
Skewness
Stnd.
Kurtosis
MAC
Li2.33.12.56.12.44.73.521.5544.071.17−0.0150
Na18,34516,88925,45559,74524,33211,04525,96917,36166.851.952.12200,000
K2077204521057245272630443207202062.992.232.5710,000
Ca1890355813458921243237793654274675.151.831.86100,000
Mg10,12420,144814245,224688512,78417,21714,50584.251.931.9050,000
Ba17.220.115.580.231.627.331.9324.4176.312.122.35700
Sr8812675446132204178.5138.677.641.921.92200
Al27.318.388.34.319.117.529.1329.91102.682.112.42200
Fe175195225175132147174.8333.2719.030.28−0.13200
Mn2.83.28.51.41.73.13.452.5874.891.992.2050
Sn22.194.518.368.957.411.345.4233.3173.340.49−0.76-
Ti14.319.410.348.631.041.227.4715.3755.950.35−0.89-
As5.48.50.229.86.20.555.113.9977.99−0.33−0.8810
Cr7.612.655.83.42.61.713.9520.90149.812.252.6050
Cu2.54.13.32.55.16.43.981.5538.840.70−0.34100
Ni3.17.712.43.62.25.65.773.8065.941.220.5320
Pb3.79.34.14.18.37.16.102.4440.050.30−1.2110
Zn4.25.321.315.31.21.88.188.20100.231.04−0.305000
Notes: The maximum allowable concentration (MAC) for drinking water, as stipulated by Law 311/2004 and Law M.O. No. 458/2002, in accordance with the law on the quality of drinking water (552/29 July 2002). SD represents standard deviation; CV denotes the coefficient of variance; and Stnd signifies standardized. The values highlighted in bold surpassed the MAC.
Table 3. The physico-chemical parameters employed in WQI computation; the values and weights used; and the variation of Qi.
Physico-Chemical Parameter, Measure UnitsSi * Value (pvi)Weight, wiRelative Weight, WiVariation of Q
EC (μS/cm)25004 × 10−40.17 × 10−66.88–48.2
pH (pH units)9.50.110.0003220.8–24.4
Turbidity, NTU50.20.00058522.8–175
NH4+ mg/L0.520.005858–218
NO3, mg/L500.025.85 × 10−50.3–10.64
Cl, mg/L2500.041.17 × 10−511.68–226.08
PO43−, mg/L0.42.50.00731932.5–215
Li, mg/L0.05200.0585484.6–12.2
Na, mg/L2000.0051.46 × 10−55.52–29.87
K, mg/L100.10.00029320.45–72.45
Ca, mg/L1000.012.93 × 10−51.35–8.92
Mg, mg/L500.025.85 × 10−513.77–90.45
Ba, mg/L0.71.4290.0041822.21–11.46
Sr, mg/L0.250.01463737.5–223.0
Al, mg/L0.250.0146372.15–44.15
Fe, mg/L0.250.01463766.0–112.5
Mn, mg/L0.05200.0585482.8–17.0
As, mg/L0.011000.2927422.2–98
Cr, mg/L0.05200.0585483.4–111.6
Cu, mg/L0.1100.0292742.5–6.4
Ni, mg/L0.02500.14637111–62
Pb, mg/L0.011000.29274237–93
Zn, mg/L50.20.0005850.024–0.426
Notes: * according to Law 311/2004 458/2002; Council Directive. 98/83/EC; WHO, 2011 [8,66,80].
Table 4. Hazard quotients, HQ, and hazard index, HI.
Groundwater Sample/PollutantP1P2P3P4P5P6
NH4+
Male0.02040.011160.00650.02540.00090.0179
Female0.02060.01120.00650.02550.00090.0180
Children0.08700.04750.02770.10780.00400.0761
NO3
Male0.05940.03360.01800.03140.00210.0750
Female0.05960.03370.01810.03160.00210.0754
Children0.25230.14260.07670.13360.00900.3188
Sr
Male0.00330.00470.00280.01680.00500.0077
Female0.00330.00480.00280.01680.00500.0077
Children0.00550.00790.00470.02790.00830.0128
Fe
Male0.00560.00630.00730.00560.00430.0047
Female0.00570.00630.00730.00570.00430.0048
Children0.02400.02670.03080.02400.01810.0201
As
Male0.40610.63920.01650.73700.46620.0414
Female0.40800.64210.01660.74040.46840.0416
Children1.72602.71690.07033.13241.98170.1758
Cr
Male0.57150.94754.19620.25570.19550.1278
Female0.57420.95194.21550.25690.19640.1284
Children2.42924.027417.83551.08680.83100.5434
Cu
Male0.11280.18500.14890.11280.23010.2888
Female0.11330.18580.14960.11330.23120.2901
Children0.47950.78630.63290.47950.97811.2274
Ni
Male0.01300.03220.05180.01500.00920.0234
Female0.01300.03230.05200.01510.00920.0235
Children0.05500.13670.22020.06390.03910.0994
Pb
Male0.27820.69940.30830.30830.62420.5339
Female0.27950.70260.30970.30970.62700.5364
Children1.18262.97261.31051.31052.65302.2694
HI
Male1.382.504.721.431.531.02
Female1.392.514.741.441.531.02
Children6.2410.8620.216.376.524.74
Disclaimer/Publisher’s Note: The statements, opinions and data contained in all publications are solely those of the individual author(s) and contributor(s) and not of MDPI and/or the editor(s). MDPI and/or the editor(s) disclaim responsibility for any injury to people or property resulting from any ideas, methods, instructions or products referred to in the content.

