
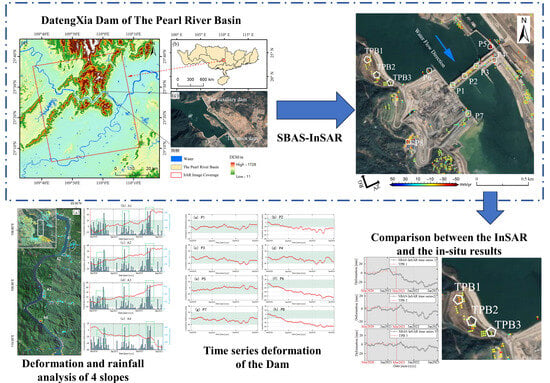
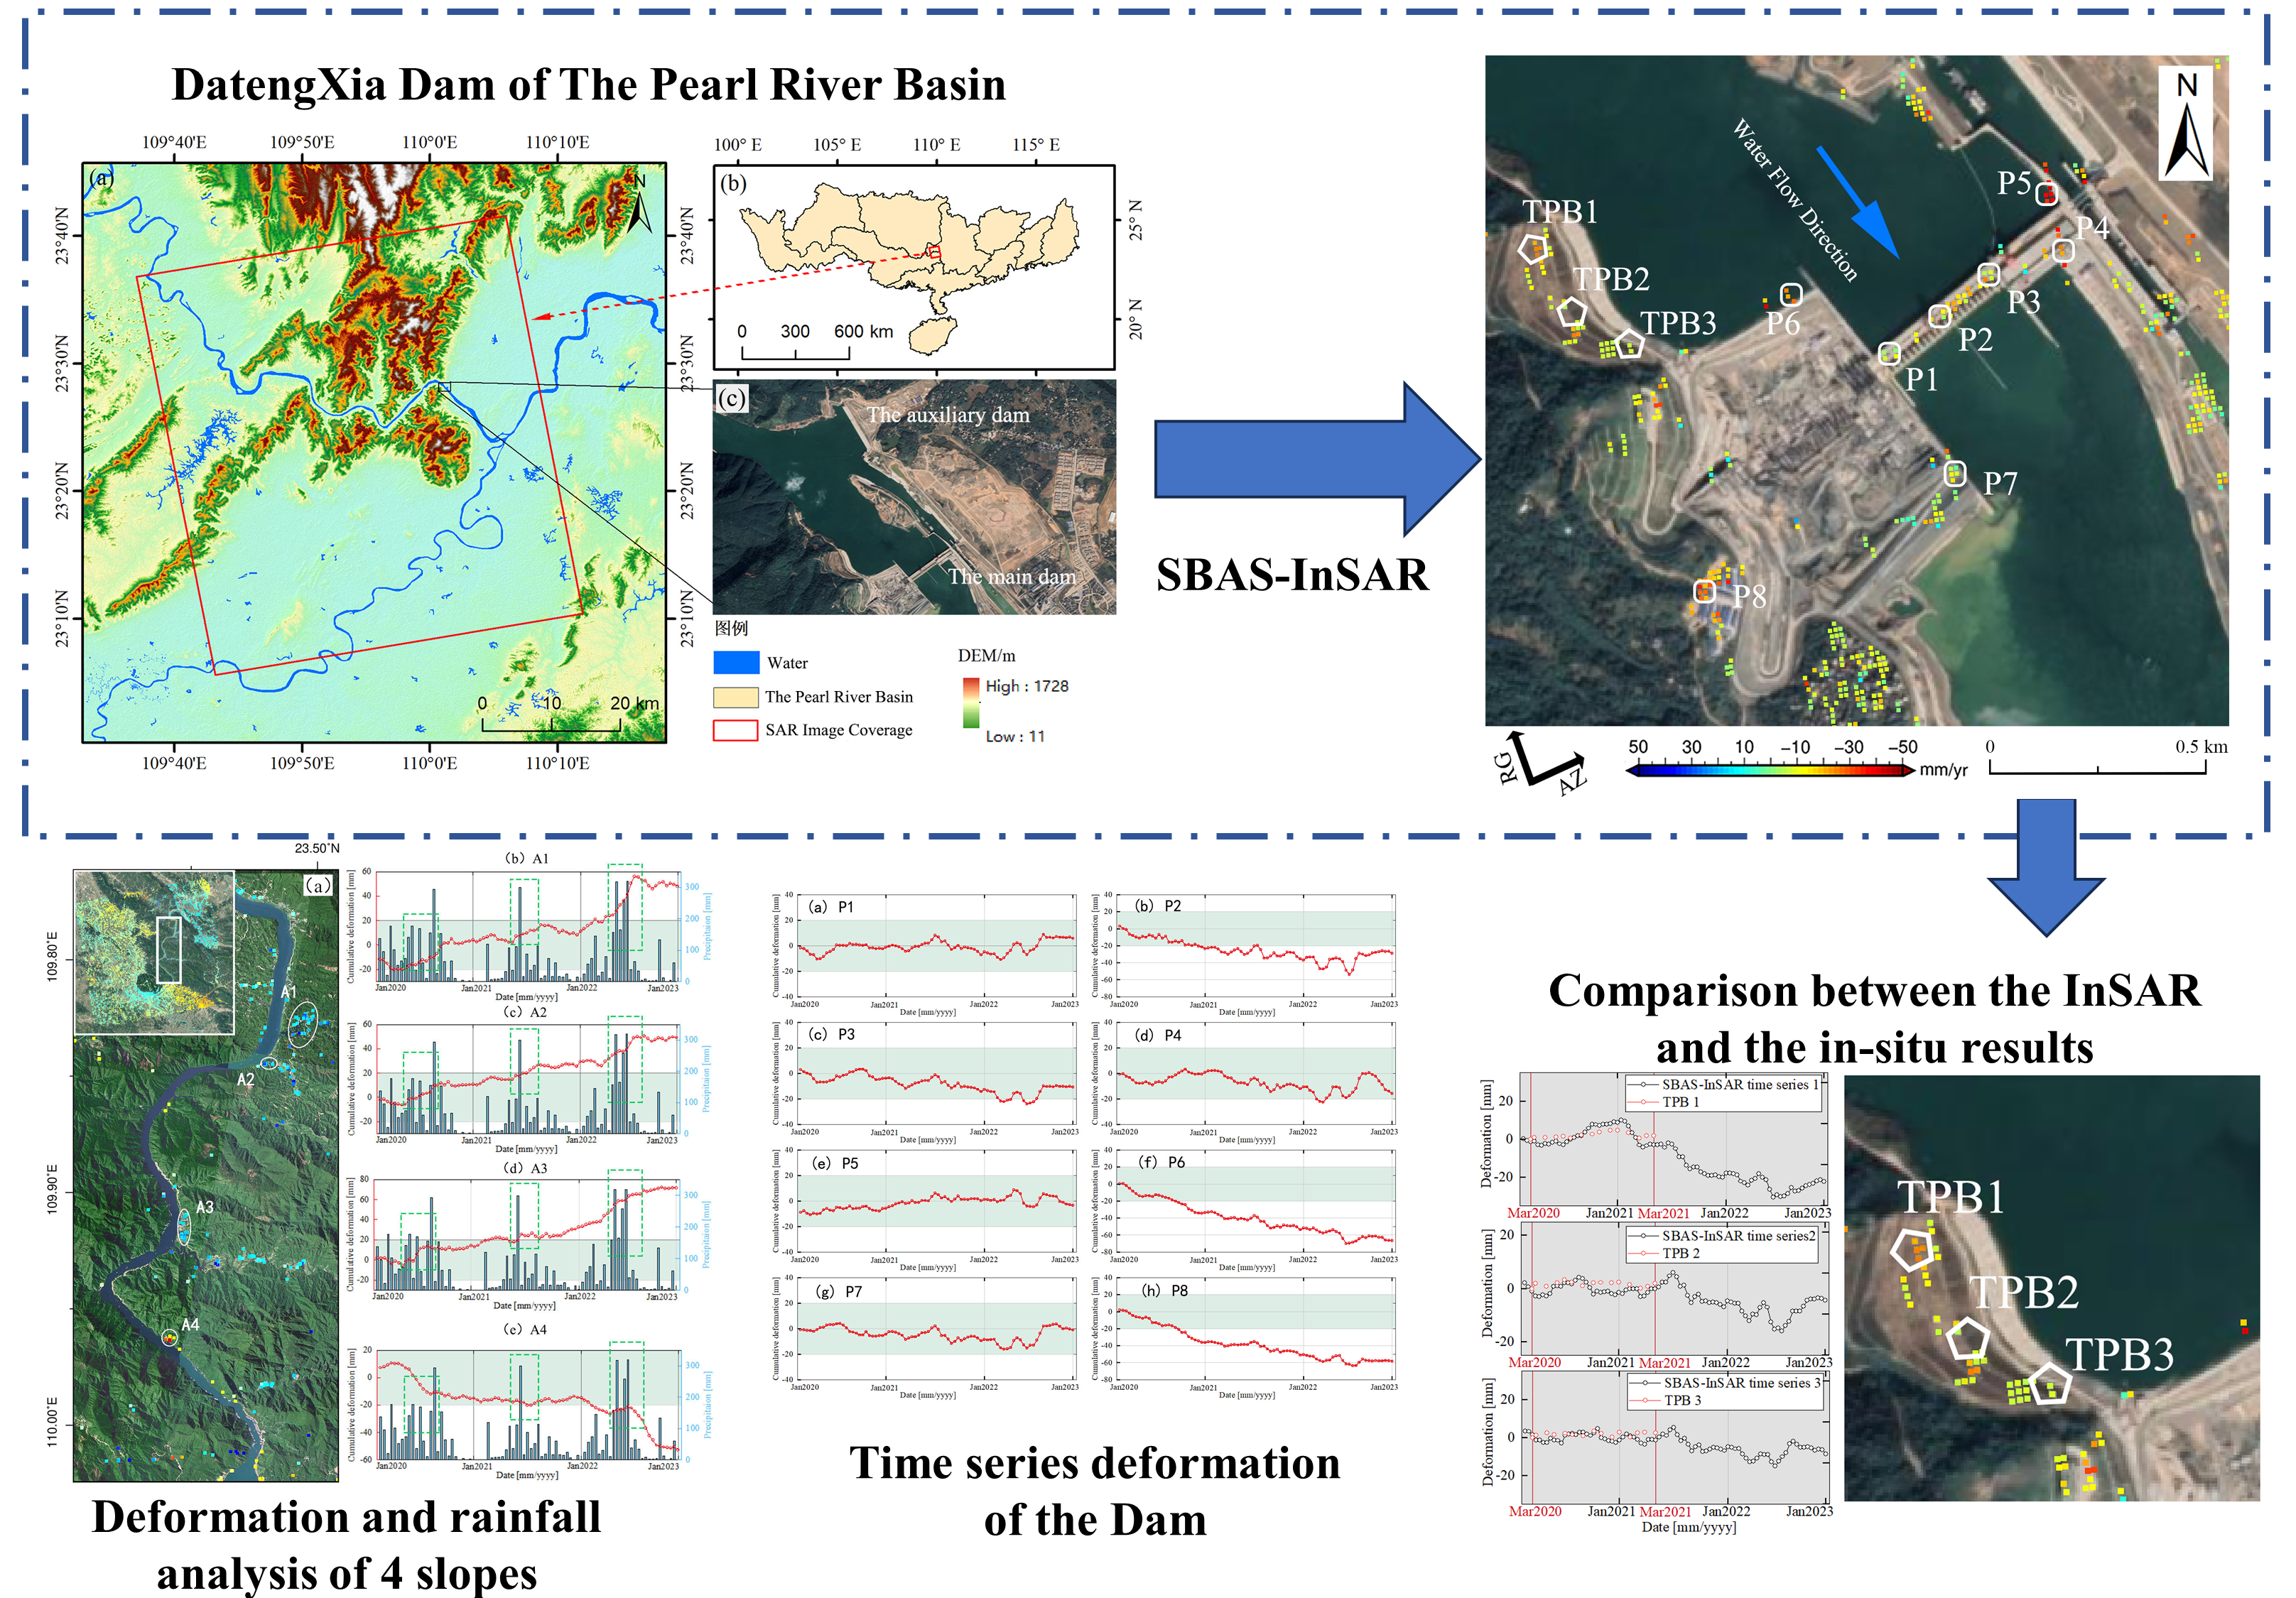
Deformation Monitoring and Potential Risk Detection of In-Construction Dams Utilizing SBAS-InSAR Technology—A Case Study on the Datengxia Water Conservancy Hub


Abstract
1. Introduction
2. Study Area and Data
2.1. Study Area
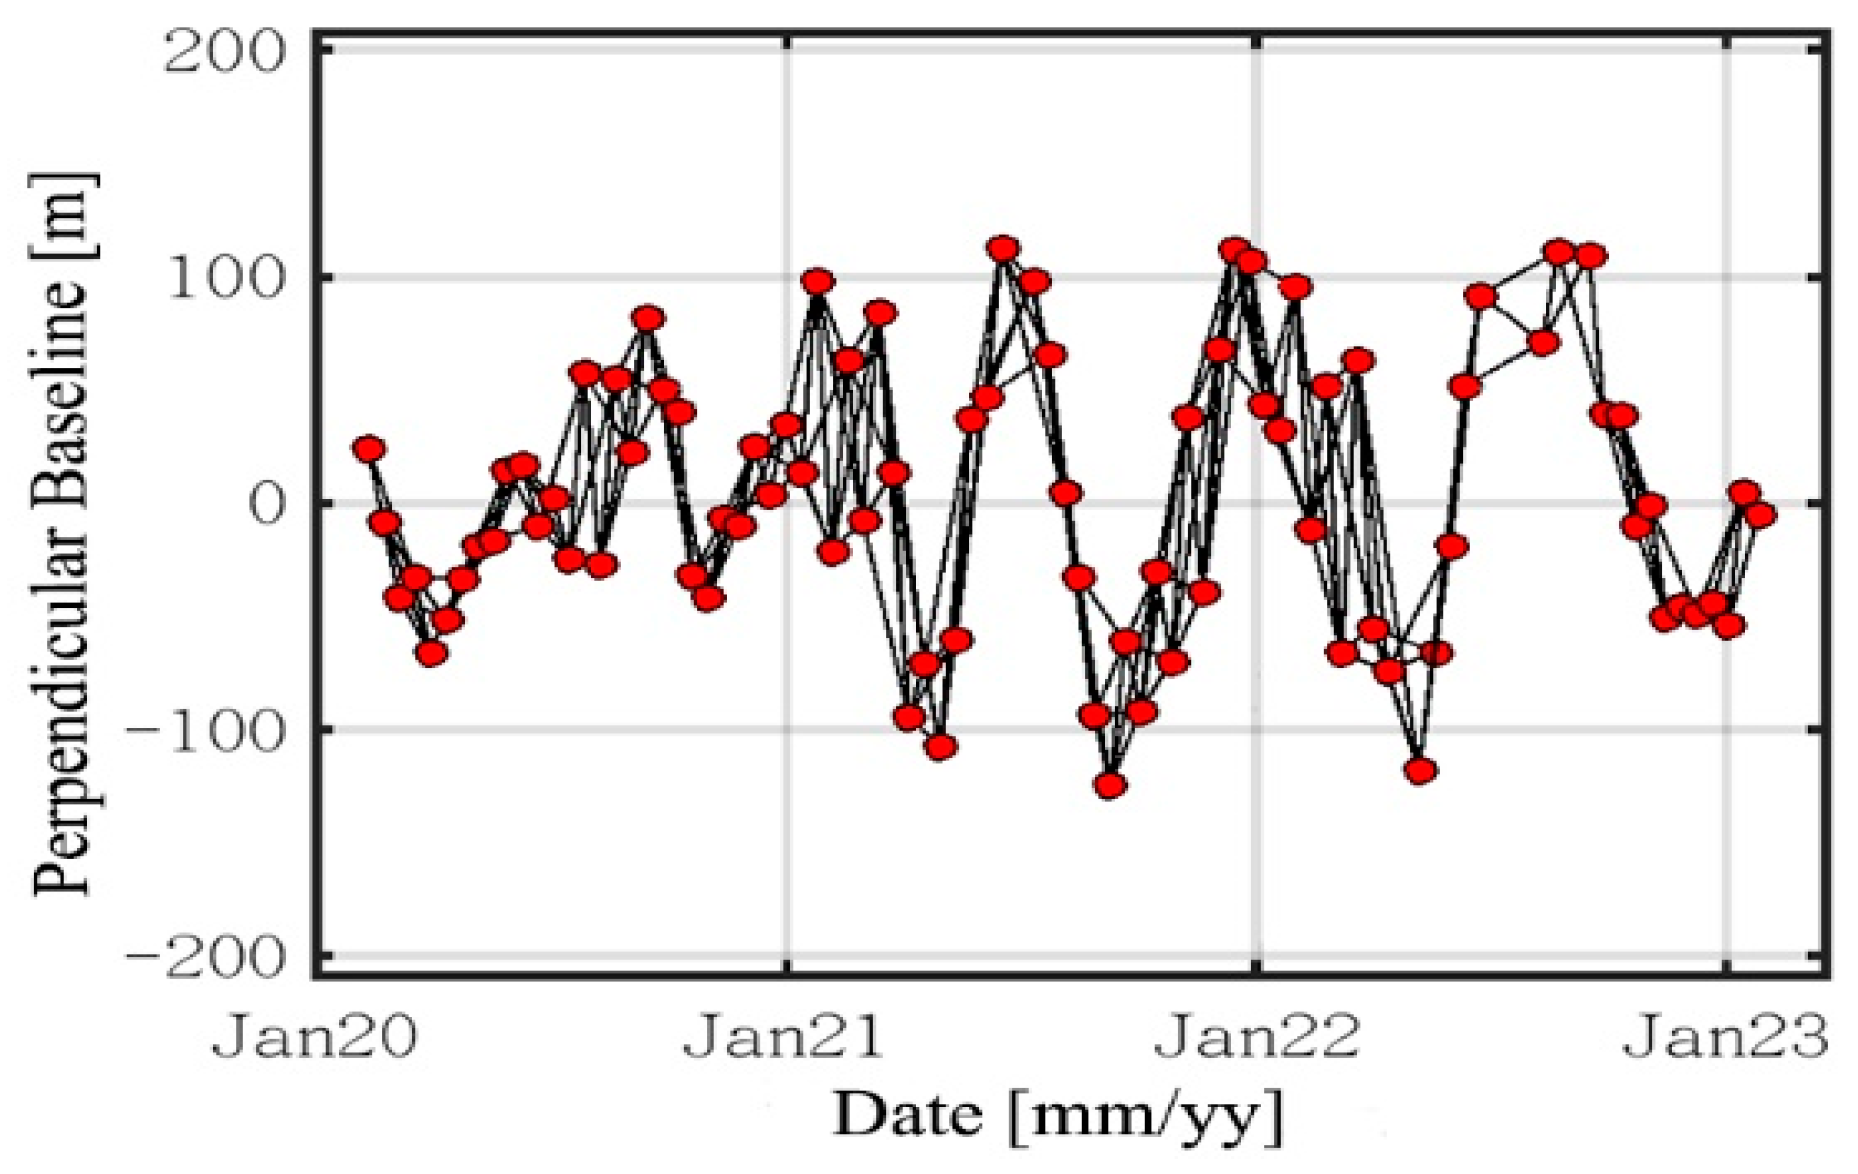
2.2. SAR Data
3. Methods
3.1. Data Preprocessing
3.2. SBAS InSAR Processing
3.3. Covert the In-Suit Monitoring Results to Radar LOS Direction
4. Results and Discussion
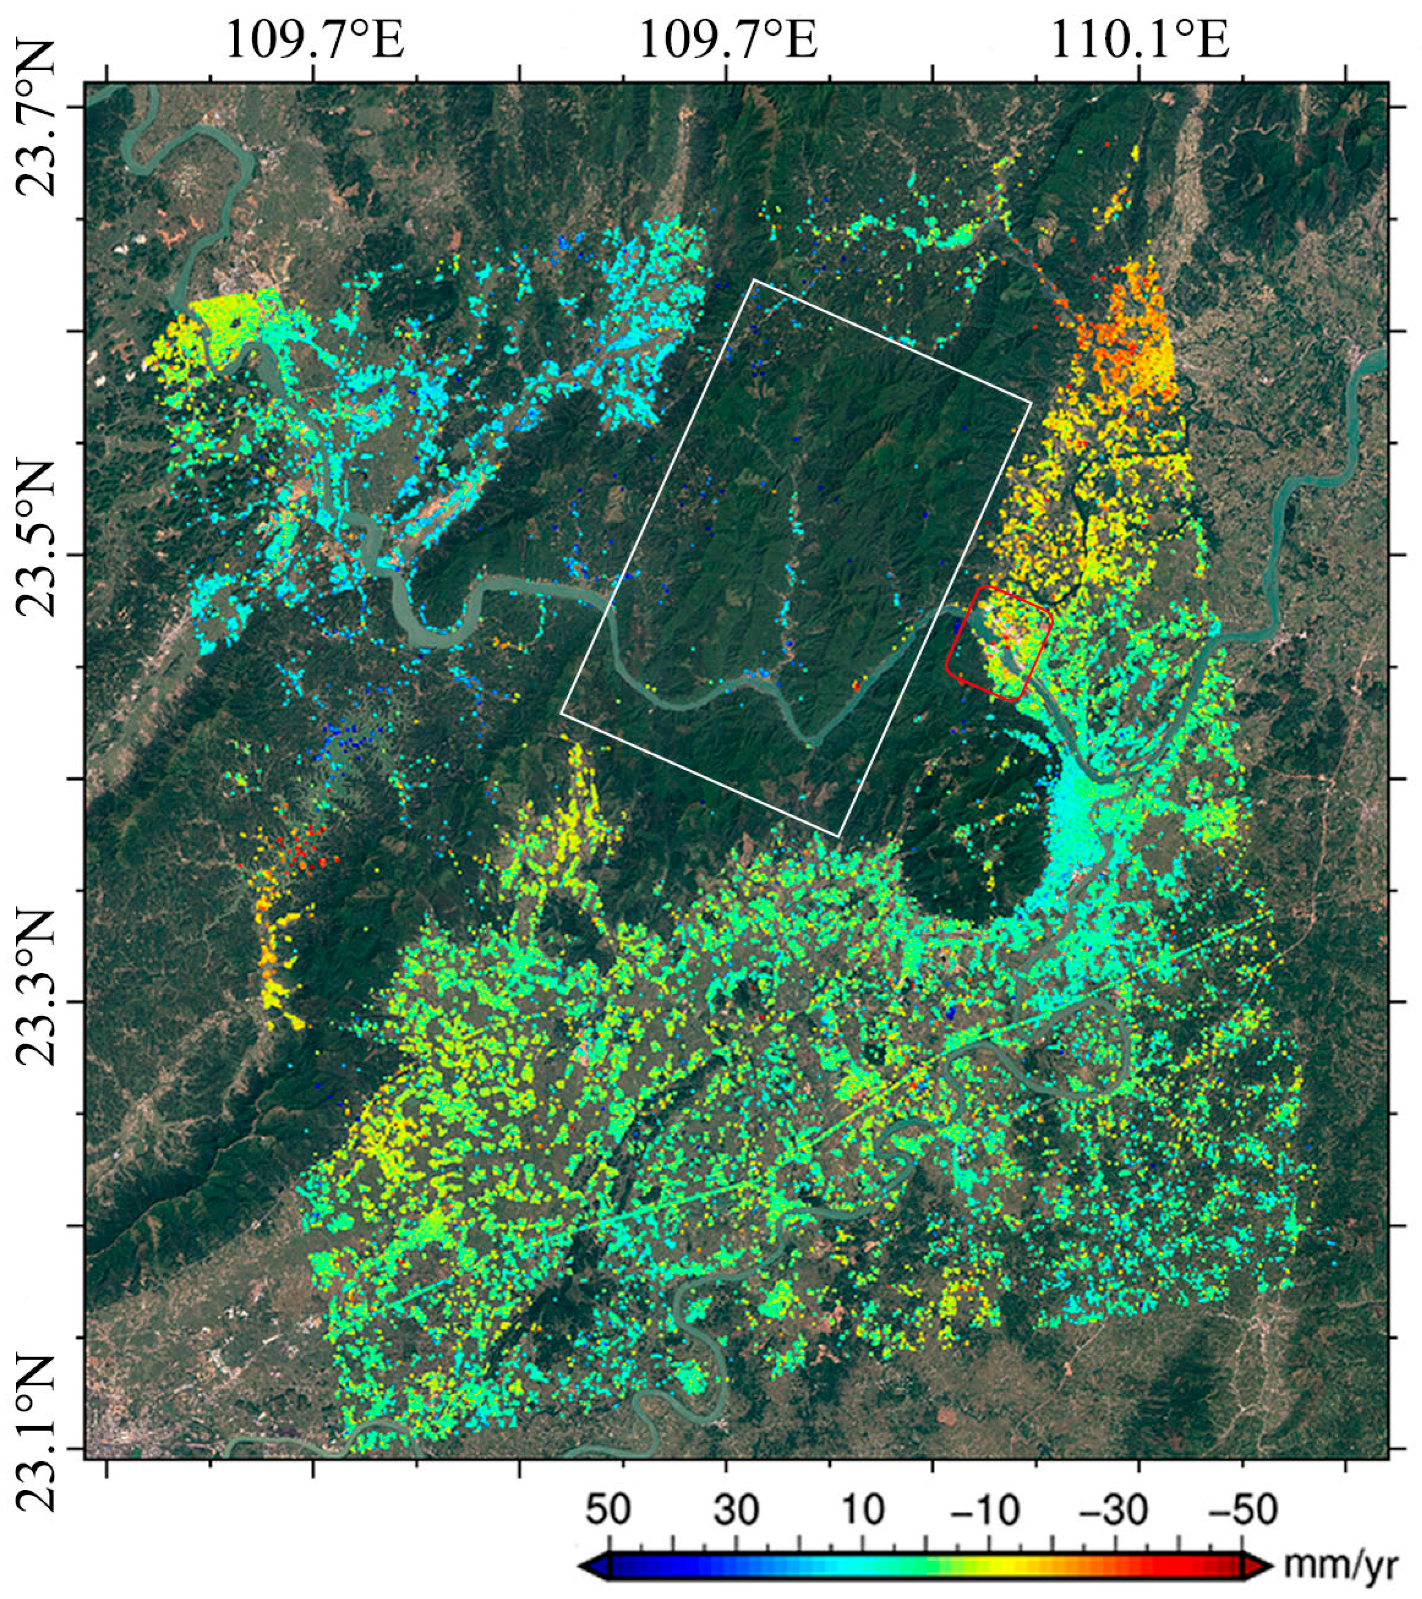
4.1. Average Deformation Rate of the Study Area
4.2. Time Series Deformation Analysis of the Main Dam of Datengxia
4.3. Deformation Analysis of River Bank Slopes
5. Conclusions
- (1)
- The utilization of SBAS-InSAR technology together with Sentinel-1 imagery has facilitated the accomplishment of time series deformation monitoring over the Datengxia reservoir. By comparison with the in situ data, the SBAS-InSAR monitoring results have been proved to be reliable and effective. However, the limitations inherent in Sentinel-1 data, i.e., the shorter wavelength and low resolution, result in sparser monitoring points over densely vegetated mountainous areas. Using high-resolution, long-wavelength SAR datasetss in collaboration with other geodetic techniques would be an effective solution for this problem;
- (2)
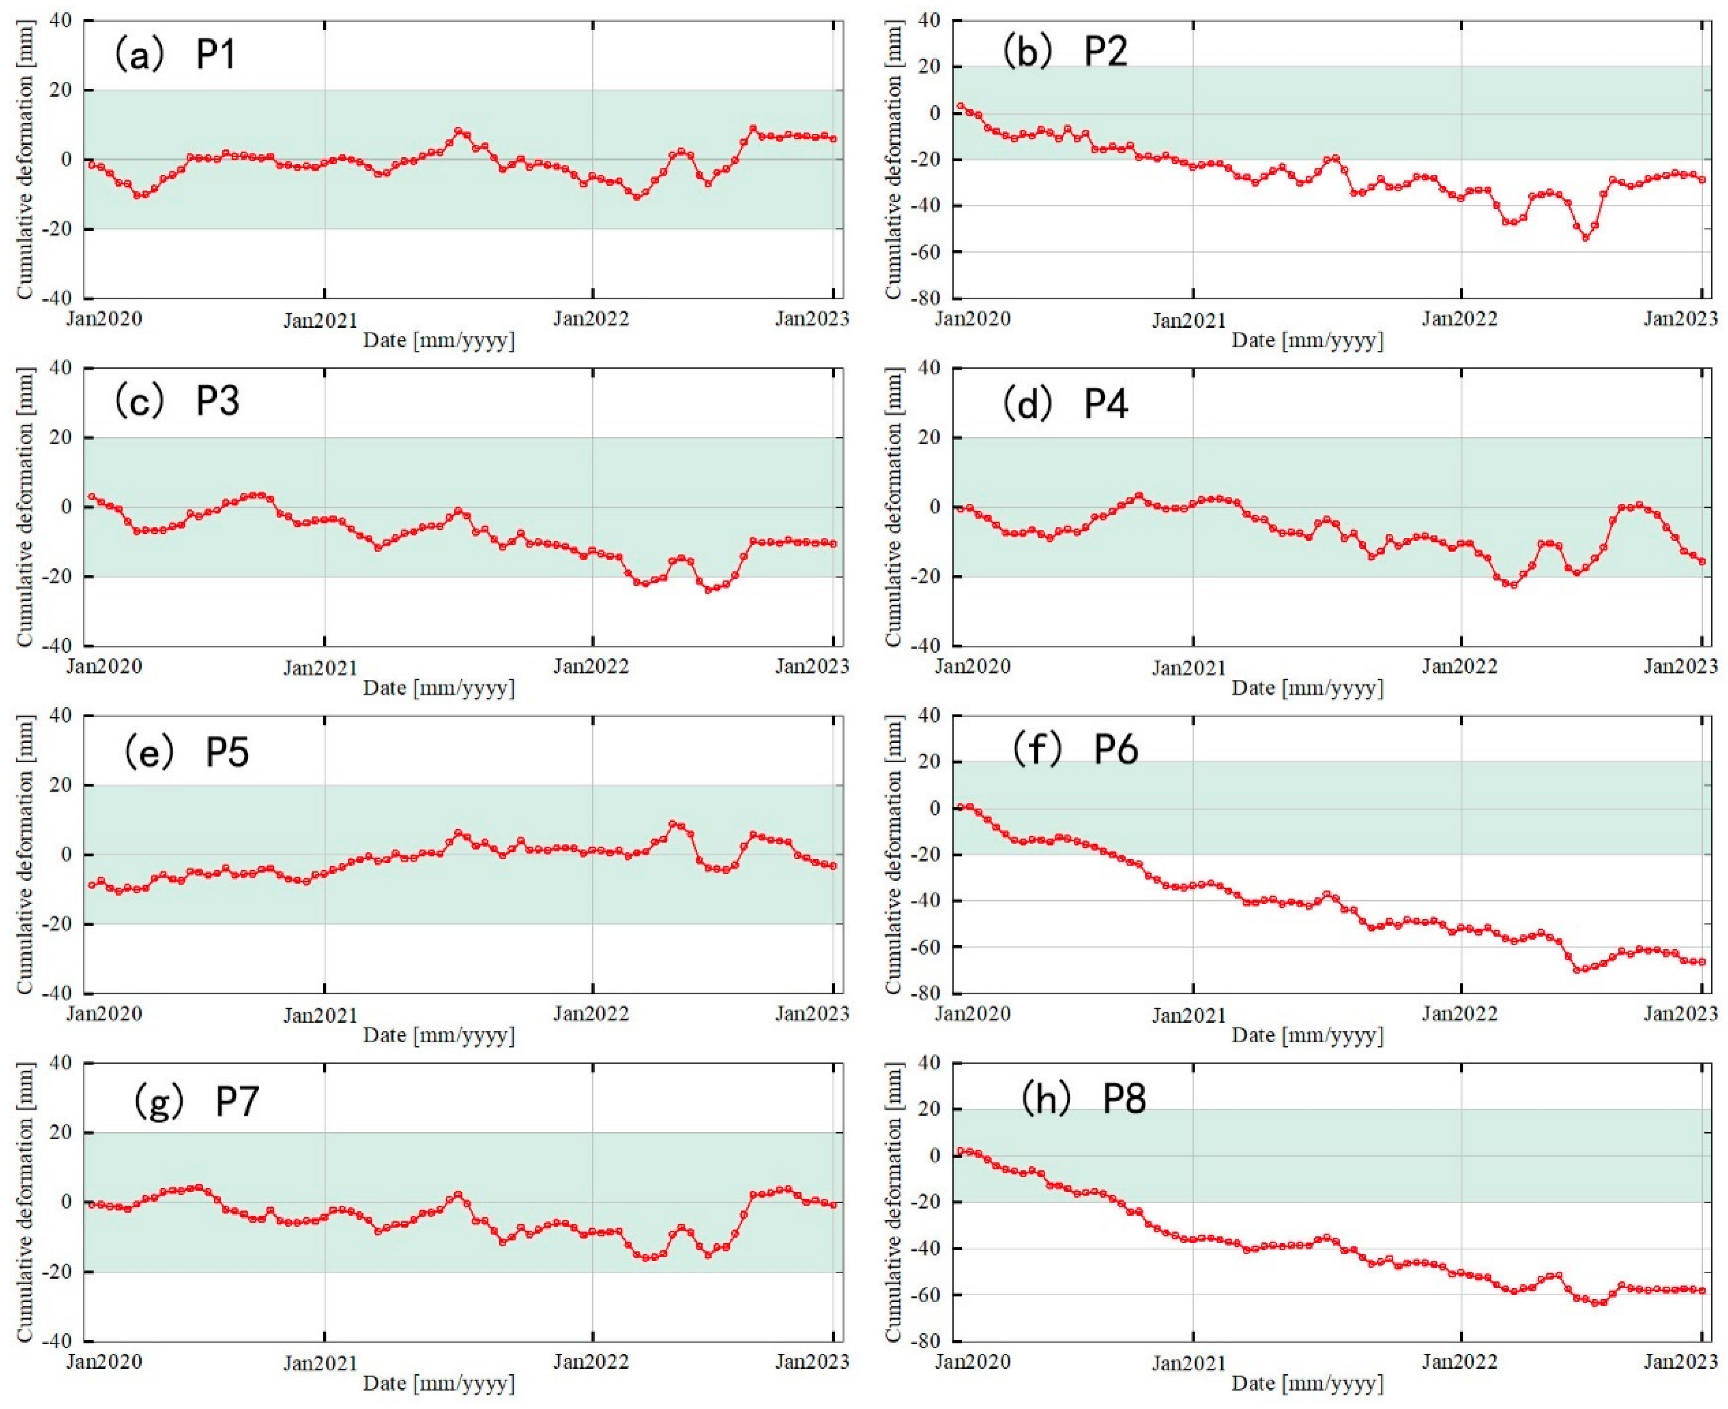
- Due to the maximal water pressure, the central section of the dam exhibits the most substantial cumulative deformation, approximately 30 mm. Furthermore, the left end of that dam reflects a similar but smaller deformation, coalescing into a cumulative deformation nearing −10 mm. However, the in-construction cofferdam facilities make the right-end section of the left dam more robust, and the deformation is the most stable and almost always stable at around 0 mm. Overall, the deformation results demonstrate the stability of the main structure of the left dam. Additionally, a notable deformation slope near the right dam has experienced a cumulative deformation of about 60 mm, showing a clear trend of linear deformation and a relatively high level of risk;
- (3)
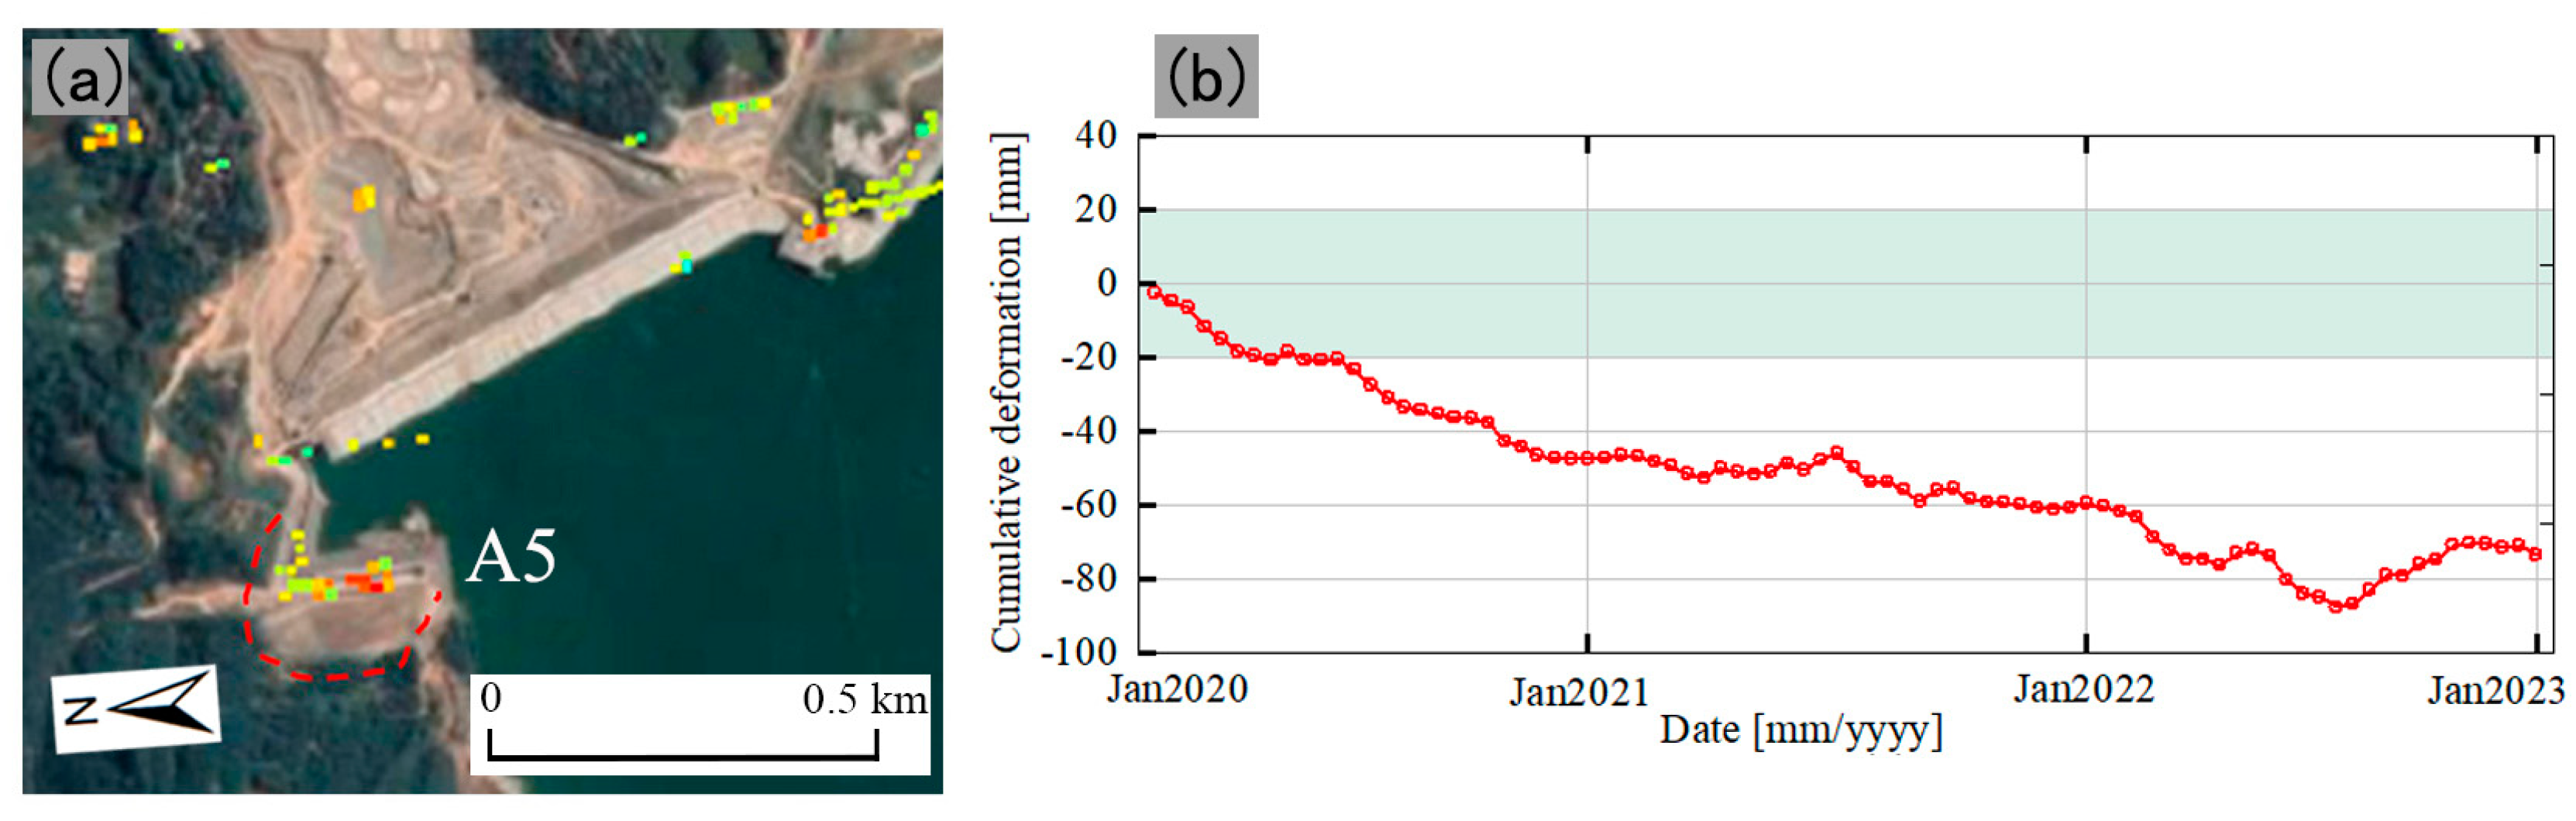
- Four distinct slopes exhibiting linear deformation trends along the banks have been recognized, and the correlation analysis of the four slopes’ deformation time series with the rainfall suggests their deformation is mainly affected by precipitation. Furthermore, a reservoir slope within the auxiliary dam precinct has also exhibited a significant deformation, with the cumulative deformation of approximately 80 mm, thus, more attention should be paid to its stability.
Author Contributions
Funding
Data Availability Statement
Acknowledgments
Conflicts of Interest
Appendix A
| Parameter | Value |
| Frame | 72 |
| Path | 157 |
| Angle of flight direction | −10.19 (°) |
| Incident angle | 43.98 (°) |
| Range resolution | 2.33 (m) |
| Azimuth Resolution | 13.99 (m) |
| Wavelength | 5.55 (cm) |
| Collection time | 10:50 UTC |
Appendix B

References
- Szostak-Chrzanowski, A.; Chrzanowski, A.; Massiéra, M. Use of deformation monitoring results in solving geomechanical problems—Case studies. Eng. Geol. 2005, 79, 3–12. [Google Scholar] [CrossRef]
- Hunter, G.; Fell, R. The Deformation Behaviour of Embankment Dams; The University of New South Wales: Sydney, Australia, 2003; ISBN 978-0-85841-383-2. [Google Scholar]
- He, X.; Hua, X.; Ding, X.; Chen, Y.; Sun, Y. Development of GPS Multi-antenna based deformation monitoring system. Hydropower Autom. Dam Monit. 2002, 26, 34–36. (In Chinese) [Google Scholar]
- Cui, P. Research on Dam Safety Monitoring Based on GNSS and Measuring Robots:A Case Study of the Pillow Dam Hydropower Station. Yangtze River 2020, 51, 132–134. (In Chinese) [Google Scholar]
- Kalkan, Y. Geodetic deformation monitoring of Ataturk Dam in Turkey. Arab. J. Geosci. 2012, 7, 397–405. [Google Scholar] [CrossRef]
- Wang, R.; Yang, T.; Yang, T.; Liao, M. A safety analysis of elevated highways in Shanghai linked to dynamic load using long-term time-series of InSAR stacks. Remote Sens. Lett. 2019, 10, 1133–1142. [Google Scholar] [CrossRef]
- Gili, J.A.; Moya, J.; Corominas, J.; Crosetto, M.; Monserrat, O. Past, Present and Future Monitoring at the Vallcebre Landslide (Eastern Pyrenees, Spain). Appl. Sci. 2021, 11, 571. [Google Scholar] [CrossRef]
- Wang, T.; Perissin, D.; Rocca, F.; Liao, M.-S. Three gorges dam stability monitoring with time-series InSAR image analysis. Sci. China Earth Sci. 2011, 54, 720–732. [Google Scholar] [CrossRef]
- Zhao, F.; Wang, T.; Zhang, L.; Feng, H.; Yan, S.; Fan, H.; Xu, D.; Wang, Y. Polarimetric Persistent Scatterer Interferometry for Ground Deformation Monitoring with VV-VH Sentinel-1 Data. Remote Sens. 2022, 14, 309. [Google Scholar] [CrossRef]
- Liu, J.; Wang, Y.; Yan, S.; Zhao, F.; Li, Y.; Dang, L.; Liu, X.; Shao, Y.; Peng, B. Underground coal fire detection and monitoring based on Landsat-8 and Sentinel-1 data sets in Miquan fire area, XinJiang. Remote Sens. 2021, 13, 1141. [Google Scholar] [CrossRef]
- Wang, T.; Wang, Y.; Zhao, F.; Feng, H.; Liu, J.; Zhang, L.; Zhang, N.; Yuan, G.; Wang, D. A spatio-temporal temperature-based thresholding algorithm for underground coal fire detection with satellite thermal infrared and radar remote sensing. Int. J. Appl. Earth Obs. Geoinf. 2022, 110, 102805. [Google Scholar] [CrossRef]
- Zhao, C.; Lu, Z.; Zhang, Q.; Juan, F. Large-area landslide detection and monitoring with ALOS/PALSAR imagery data over Northern California and Southern Oregon, USA. Remote Sens. Environ. 2012, 124, 348–359. [Google Scholar] [CrossRef]
- Wang, B.; Zhao, C.; Zhang, Q.; Peng, M. Sequential InSAR Time Series Deformation Monitoring of Land Subsidence and Rebound in Xi’an. China Remote Sens. 2019, 11, 2854. [Google Scholar] [CrossRef]
- Wang, T.; Perissin, D.; Rocca, F. Stability Monitoring of the Three Gorges Dam Based on Time Series SAR Image Analysis Method. Sci. China Earth Sci. 2011, 41, 110–123. [Google Scholar]
- Di Martire, D.; Iglesias, R.; Monells, D.; Centolanza, G.; Sica, S.; Ramondini, M.; Pagano, L.; Mallorquí, J.J.; Calcaterra, D. Comparison between Differential SAR interferometry and ground measurements data in the displacement monitoring of the earth-dam of Conza della Campania (Italy). Remote Sens. Environ. 2014, 148, 58–69. [Google Scholar] [CrossRef]
- MacChiarulo, V.; Milillo, P.; Blenkinsopp, C.; Reale, C.; Giardina, G. Multi-temporal InSAR for transport infrastructure monitoring: Recent trends and challenges. Proc. Inst. Civ. Eng. Bridge Eng. 2021, 176, 92–117. [Google Scholar] [CrossRef]
- Zhou, W.; Li, S.; Zhou, Z.; Chang, X. Insar observation and numerical modeling of the earth-dam displacement of shuibuya dam (China). Remote Sens. 2016, 8, 877. [Google Scholar] [CrossRef]
- Dong, S.; Yin, H.; Yao, S.; Zhang, F. Detecting surface subsidence in coal mining area based on DInSAR technique. J. Earth Sci. 2013, 24, 449–456. [Google Scholar] [CrossRef]
- Li, T.; Motagh, M.; Wang, M.; Zhang, W.; Gong, C.; Xiong, X.; He, J.; Chen, L.; Liu, J. Earth and rock-filled dam monitoring by high-resolution X-band interferometry: Gongming dam case study. Remote Sens. 2019, 11, 246. [Google Scholar] [CrossRef]
- Blaht, J.; Balek, J.; Elia, M.; Meletlidis, S. 3D Dilatometer Time-Series Analysis for a Better Understanding of the Dynamics of a Giant Slow-Moving Landslide. Appl. Sci. 2020, 10, 5469. [Google Scholar] [CrossRef]
- Berardino, P.; Fornaro, G.; Lanari, R.; Sansosti, E. A New Algorithm for Surface Deformation Monitoring Based on Small Baseline Differential Sar Interferograms. IEEE Trans. Geosci. Remote. Sens. 2002, 40, 2375–2383. [Google Scholar] [CrossRef]
- Michoud, C.; Baumann, V.; Lauknes, T.R.; Penna, I.; Derron, M.-H.; Jaboyedoff, M. Large slope deformations detection and monitoring along shores of the Potrerillos dam reservoir, Argentina, based on a small-baseline InSAR approach. Landslides 2016, 13, 451–465. [Google Scholar] [CrossRef]
- Aminjafari, S. Monitoring of Masjed-Soleiman embankment dam’s deformation using a combination of Interferometric Synthetic Aperture Radar (InSAR) and finite element modeling. Geod. Cartogr. 2017, 43, 14–21. [Google Scholar] [CrossRef][Green Version]
- Pang, Z.; Jin, Q.; Fan, P.; Jiang, W.; Lv, J.; Zhang, P.; Cui, X.; Zhao, C.; Zhang, Z. Deformation Monitoring and Analysis of Reservoir Dams Based on SBAS-InSAR Technology—Banqiao Reservoir. Remote Sens. 2023, 15, 3062. [Google Scholar] [CrossRef]
- Liao, Z. Study on the Strategic Position and Benefits of Datengxia Water Conservancy Hub. China Water Resour. 2020, 4, 1–3. (In Chinese) [Google Scholar]
- Ansari, H.; De Zan, F.; Parizzi, A. Study of systematic bias in measuring surface deformation with SAR interferometry. IEEE Trans. Geosci. Remote. Sens. 2020, 59, 1–12. [Google Scholar] [CrossRef]
- Ou, Q.; Daout, S.; Weiss, J.R.; Shen, L.; Lazecký, M.; Wright, T.J.; Parsons, B.E. Large-Scale Interseismic Strain Mapping of the NE Tibetan Plateau from Sentinel-1 Interferometry. JGR Solid Earth 2022, 127, e2022JB024176. [Google Scholar] [CrossRef]
- Zhou, L.; Guo, J.; Hu, J.; Li, J.; Xu, Y.; Pan, Y.; Shi, M. Wuhan Surface Subsidence Analysis in 2015-2016 Based on Sentinel-1A Data by SBAS-InSAR. Remote Sens. 2017, 9, 982. [Google Scholar] [CrossRef]
- Wu, W.; Zhou, Z.; Li, T.; Long, S. A Study of Sentinel-1 TOPS Mode Co-registration. Acta Geod. Cartogr. Sin. 2017, 46, 1156–1164. (In Chinese) [Google Scholar]
- Chen, S.; Li, J.; Xie, Y.; Tian, Y. Runoff Inversion in the Li River Basin Based on Sentinel-1 SAR Remote Sensing Images. People's Pearl River 2020, 41, 116–123. [Google Scholar]
- Werner, C.; Wegmuller, U.; Strozzi, T.; Wiesmann, A. Interferometric point target analysis for deformation mapping. In Proceedings of the 2003 IEEE International Geoscience and Remote Sensing Symposium, Toulouse, France, 21–25 July 2003; IEEE: Piscataway, NJ, USA, 2003; Volume 7, pp. 4362–4364. [Google Scholar]
- Mora, O.; Mallorquí, J.; Broquetas, A. Linear and nonlinear terrain deformation maps from a reduced set of interferometric SAR images. IEEE Trans. Geosci. Remote Sens. 2003, 41, 2243–2253. [Google Scholar] [CrossRef]
- Hooper, A.; Zebker, H.; Segall, P.; Kampes, B. A New Method for Measuring Deformation on Volcanoes and Other Natural Terrains Using Insar Persistent Scatterers. Geophys. Res. Lett. 2004, 31, 96–106. [Google Scholar] [CrossRef]
- Hooper, A. A multi-temporal InSAR method incorporating both persistent scatterer and small baseline approaches. Geophys. Res. Lett. 2008, 35, 1–5. [Google Scholar] [CrossRef]
- Zhan, W.; Li, Z.; Wei, J.; Zhu, J.; Wang, C. An InSAR Atmospheric Phase Modeling and Estimation Method. Chin. J. Geophys. 2015, 58, 2320–2329. [Google Scholar]
- Doin, M.-P.; Lasserre, C.; Peltzer, G.; Cavalié, O.; Doubre, C. Corrections of stratified tropospheric delays in SAR interferometry: Validation with global atmospheric models. J. Appl. Geophys. 2009, 69, 35–50. [Google Scholar] [CrossRef]
- Hu, Z.; Mallorquí, J.J. An Accurate Method to Correct Atmospheric Phase Delay for InSAR with the ERA5 Global Atmospheric Model. Remote Sens. 2019, 11, 1969. [Google Scholar] [CrossRef]
- Xu, D.; Feng, H.; Yan, S. Time-Series InSAR Analysis of Xiaolangdi Dam Stability Based on Sentinel-1A Images. China Rural Water Hydropower 2020, 6, 165–170. (In Chinese) [Google Scholar]
- Xiao, R.; He, X. Application Research on Time-Series InSAR Deformation Monitoring of Reservoir Dams. J. Wuhan Univ. (Inf. Sci. Ed.) 2019, 44, 1334–1341. (In Chinese) [Google Scholar]
- Pepe, A.; Calò, F. A Review of Interferometric Synthetic Aperture RADAR (InSAR) Multi-Track Approaches for the Retrieval of Earth's Surface Displacements. Appl. Sci. 2017, 7, 1264. [Google Scholar] [CrossRef]
- Gong, C.; Ren, H. Application of Spaceborne Synthetic Aperture Radar in Dam Deformation Monitoring. China Rural Water Hydropower 2013, 2, 81–84. (In Chinese) [Google Scholar]
- Osmanoglu, B.; Sunar, F.; Wdowinski, S.; Cabral-Cano, E. Time series analysis of InSAR data: Methods and trends. ISPRS J. Photogramm. Remote Sens. 2016, 115, 90–102. [Google Scholar] [CrossRef]
- Du, S.; Mallorqui, J.J.; Fan, H.; Zheng, M. Improving PSI Processing of Mining Induced Large Deformations with External Models. Remote Sens. 2020, 12, 3145. [Google Scholar] [CrossRef]
- Emadali, L.; Motagh, M.; Haghighi, M.H. Characterizing post-construction settlement of the Masjed-Soleyman embankment dam, Southwest Iran, using TerraSAR-X SpotLight radar imagery. Eng. Struct. 2017, 143, 261–273. [Google Scholar] [CrossRef]
- Dai, K.; Li, Z.; Tomás, R.; Liu, G.; Yu, B.; Wang, X.; Cheng, H.; Chen, J.; Stockamp, J. Monitoring activity at the Daguangbao mega-landslide (China) using Sentinel-1 TOPS time series interferometry. Remote Sens. Environ. 2016, 186, 501–513. [Google Scholar] [CrossRef]


Disclaimer/Publisher’s Note: The statements, opinions and data contained in all publications are solely those of the individual author(s) and contributor(s) and not of MDPI and/or the editor(s). MDPI and/or the editor(s) disclaim responsibility for any injury to people or property resulting from any ideas, methods, instructions or products referred to in the content. |
© 2024 by the authors. Licensee MDPI, Basel, Switzerland. This article is an open access article distributed under the terms and conditions of the Creative Commons Attribution (CC BY) license (https://creativecommons.org/licenses/by/4.0/).
Share and Cite
Ouyang, Y.; Feng, T.; Feng, H.; Wang, X.; Zhang, H.; Zhou, X. Deformation Monitoring and Potential Risk Detection of In-Construction Dams Utilizing SBAS-InSAR Technology—A Case Study on the Datengxia Water Conservancy Hub. Water 2024, 16, 1025. https://doi.org/10.3390/w16071025
Ouyang Y, Feng T, Feng H, Wang X, Zhang H, Zhou X. Deformation Monitoring and Potential Risk Detection of In-Construction Dams Utilizing SBAS-InSAR Technology—A Case Study on the Datengxia Water Conservancy Hub. Water. 2024; 16(7):1025. https://doi.org/10.3390/w16071025
Chicago/Turabian StyleOuyang, Yi, Tao Feng, Han Feng, Xinghan Wang, Huayu Zhang, and Xiaoxue Zhou. 2024. "Deformation Monitoring and Potential Risk Detection of In-Construction Dams Utilizing SBAS-InSAR Technology—A Case Study on the Datengxia Water Conservancy Hub" Water 16, no. 7: 1025. https://doi.org/10.3390/w16071025
APA StyleOuyang, Y., Feng, T., Feng, H., Wang, X., Zhang, H., & Zhou, X. (2024). Deformation Monitoring and Potential Risk Detection of In-Construction Dams Utilizing SBAS-InSAR Technology—A Case Study on the Datengxia Water Conservancy Hub. Water, 16(7), 1025. https://doi.org/10.3390/w16071025