Article

Evaluation of Physicochemical Parameters, Carbamazepine and Diclofenac as Emerging Pollutants in the Machángara River, Quito, Ecuador

by
Raquel Ibarra
1,2,
Darío Bolaños-Guerrón
2,3,* and
Luis Cumbal-Flores
3
1
Escuela de Ciencias Químicas, Pontificia Universidad Católica del Ecuador, Quito P.O. Box 17-01-2184, Ecuador
2
Departamento de Ciencias de la Tierra y la Construccción, Maestría en Sistemas de Gestión Ambiental, Universidad de las Fuerzas Armadas ESPE, Sangolquí P.O. Box 1715-231B, Ecuador
3
Center for Nanoscience and Nanotechnology (CENCINAT), Universidad de las Fuerzas Armadas ESPE, Sangolquí P.O. Box 1715-231B, Ecuador
*
Author to whom correspondence should be addressed.
Water 2024, 16(7), 1026; https://doi.org/10.3390/w16071026
Submission received: 13 November 2023 / Revised: 23 February 2024 / Accepted: 11 March 2024 / Published: 2 April 2024
(This article belongs to the Section Water Quality and Contamination)

Abstract

:
This study evaluates the pollution of the Machángara River basin in Ecuador. For the assessment, water samples were pumped from the river for 1 to 4 h, with a representative water sample of 4 L collected. In the site and laboratory, the physicochemical parameters, carbamazepine (CBZ), and diclofenac (DIC) concentrations were measured using standardized analytical methods. On average, a temperature of 17.02 °C, pH of 7.06, electrical conductivity of 760.96 µS/cm, and turbidity of 83.43 NTU were found. Furthermore, the average solids content was 72.88, 495.47, and 568.35 mg/L for total suspended solids (TSS), total dissolved solids (TDS), and total solids (TS) in that order. The highest chloride concentration (Cl = 87.97 mg/L) was below the maximum permissible limit (MPL) based on the Ecuadorian regulations for surface and underground water for human consumption and domestic use, which only require conventional treatment. In contrast, levels of nitrate (NO3 = 27.75–288.25 mg/L) and nitrite in five points (NO2 = 2.02–5.42 mg/L) were higher than the MPLs. Moreover, sulfate (SO42− = 34.75–110 mg/L) and phosphate (PO4−P = 4.15–16.58 mg/L) contents caused turbidity and eutrophication in the river water., Additionally, concentrations of copper (Cu2+ = 0.002–0.071 mg/L), zinc (Zn2+ = 0.001–0.011 mg/L) and iron (Fe3+ = 0.000–0.287 mg/L) were within the permissible limits. On the other hand, carbamazepine concentrations in the Machángara River basin were below the limit of detection (LOD) up to a value of 0.121 mg/L. At the same time, diclofenac levels ranged from 9.32 to 48.05 mg/L. The concentration discrepancy for both pharmaceuticals is linked with the trend of drug consumption by Quito’s inhabitants. As measured in this investigation, meaningful amounts of CBZ and DIC are released to the Machángara River. Accordingly, the two pharmaceuticals in the river water may be dangerous for aquatic species.

1. Introduction

Water is an indispensable environmental resource for living beings and, therefore, a matter of permanent control regarding its purity and constituents [1,2,3]. To date, several technologies and methods have been developed to ensure and guarantee the quality of watery natural resources and minimize, where possible, the increase of unwanted and harmful pollution [4,5,6,7,8]. Regrettably, water is contaminated by human activities such as industry, urbanization, transportation, agriculture, and others. Clean water inadvertently receives solid, liquid, and gaseous pollutants and is transformed into wastewater. Discarded waters from domestic use and medical centers contain various chemicals called emerging pollutants (EPs). These EPs have recently received much attention because they are abundant in waste surface waters and groundwater, and many are recalcitrant and have very low biodegradability [9,10,11,12].
Synthetic or natural EPs are not generally controlled in the terrestrial setting but can potentially enter it and produce recognized or suspected adverse ecological and human effects [13,14]. Several are highly toxic at low concentrations because they are bioaccumulative and dangerous for humans [15,16]. Ultimately, these unpleasant chemicals are discharged with the sewage into water bodies before or after treatment and contaminate them [17,18].
Instead, pharmaceuticals are vital EPs in modern society. They are produced and commercialized to preserve human and animal health. However, between 0.5 and 70% of the parent drug is not used in the therapeutic procedure and is excreted in urine and feces [19]. The most widely sold drugs are analgesics, antihypertensives, and anti-microbial [20]. They are consumed worldwide and administered without a prescription [21,22]. For the massive consumption of drugs and their partial use in medical treatments, diclofenac, ibuprofen, and acetaminophen residuals have been reported in hospital wastewater around the globe [23,24,25]. In Ecuador, EPs are chemical substances with unknown legal constraints for consumption or discharge [26,27]. Due to the lack of sanitation (treatments), concentrations of sulfamethoxazole, venlafaxine, carbamazepine, and benzoylecgonine have been found in rivers of San Pedro, Guayllabamba, and Esmeraldas, which are prevalent even after the water purification process in some cities [28]. According to the National Directorate of Medicines and Medical Devices and the Ministry of Public Health, the following are on the list of essential medicines consumed in the city of Quito: paracetamol, ibuprofen, omeprazole, amoxicillin, carbamazepine, and diclofenac [29]. Particularly, carbamazepine, a nonpolar compound, is an anti-seizure medication given especially to patients who have epilepsy [30]. In contrast, diclofenac, a polar combination, is a non-steroidal anti-inflammatory drug (NSAID) administered in tablets or topical gels [31].
Awkwardly, as time passes, medicine-based EPs are more frequently encountered in water sources [30,31,32]. Nevertheless, their presence and danger to the environment remained largely unnoticed. Consequently, these EPs must be first identified before being subjected to a monitoring system [15,18,33,34]. After that, treatments of reduction and decontamination of the polluted streams should follow monitoring procedures to ensure healthy or regulated levels of EPs and avoid any threat to the human population or migration into natural ecosystems [35,36,37,38]. Even though such issues are of worldwide concern, these fears are not seriously judged in developing countries [39,40,41]. For instance, in Ecuador’s capital, Quito, indiscriminate wastewater discharges carrying several EPs are released from the city into the Machángara River (pretreatment) channel, which is, in turn, discharged to the river basin [42,43,44]. Downstream, the river captures sewage from most of Quito’s population and the northeastern valleys, making the natural pretreatment ineffective [45,46,47,48].
This study evaluates the contamination of Quito’s central basin, focusing on quantifying carbamazepine and diclofenac along the Machángara River pathway, mainly where wastewater discharges impact its water.

2. Experimental

2.1. Study Area

The Machángara River runs longitudinally through Quito in the south-to-north direction (Figure 1), from its formation (UTM X: 774,939, Y: 997,0201) to its entrance into the Guayllabamba River (X: 792,555, Y: 999,2864) and has an approximate extension of 36 km [49]. The area of influence of this study covers the entire Metropolitan District of Quito (MDQ). The Machángara River is highly affected by industrial and residential pollution due to its long pathway [50]. It is a tributary of the Guayllabamba River, which forms with other affluents, the Esmeraldas River, which ends in the Pacific Ocean, northern Ecuador.

2.2. Sampling

Using a GPS Mobile Mapper SPECTRA 60 (Spectra Geospatial, Westminster, MD, USA) we selected ten sampling locations of easy access and repeatability along the Machángara River basin. However, the actual location and accessibility of each sampling point were verified during field campaigns. Composed samples were pumped out from the river for 1 to 4 h. At the end of each pumping period, a representative water sample of 4 L was collected. Table 1 provides the locations and coordinates of the sampling points. The sampling per se was conducted following the methodology described in the International Standardization Organization based on the selected matrix type [51]. Water samples were then homogenized and stored in amber glass bottles. After that, glass containers were tightly capped, sealed with parafilm, placed in a cooler at a temperature of 4 °C, and transferred to the laboratory for further analysis.

2.3. Chemicals

Table 2 summarizes the chemicals used to determine physicochemical parameters, including carbamazepine and diclofenac in the Machángara River water.

2.4. Methods

In situ temperature, pH measurements were carried out using a Mettler Toledo (Columbus, OH, USE) (Education Series EL2) Portable pH/ORP/Temperature Meter. Electrical conductivity (EC) was measured with a Conductimeter Metrohm CH-9100 (Metrohm AG, Herisau, Switzerland). Turbidity measurements were conducted with a portable Turbidimeter Hach 2100Q (Hach, Loveland, CO, USA). Hardness was determined using the Titration Method 2340 C. Total suspended solids (TSS), total dissolved solids (TDS), total solids (TS), anions, and heavy metals were analyzed at the Advanced Materials Laboratory del Centro de Nanociencia y Nanotecnología de la Universidad de las Fuerzas Armadas ESPE. Measurements followed standardized procedures of the Standard Methods and USEPA listed in Table 3 [52]. TSS and TS were determined with the 2540 D and 2540 B methods at a temperature of 103–105 °C, respectively, and TDS was analyzed applying the 2540 C method at a temperature of 180 °C using a Spectrophotometer Hach DR/850 (Hach, Loveland, CO, USA).
For the measurements of heavy metals, 5 mL of collected water was taken from the glass containers, filtered through 0.45 mm membrane filters, and analyzed by atomic absorption spectroscopy (Perkin Elmer, Waltham, MA, USA, AA800) using the direct air-acetylene flame method (SM 3500) [52]. The analysis of sulfate and chloride was carried out by ion chromatography [53]. Five milliliters of collected water were filtered with a 0.45 µm syringe filter and analyzed on a Dionex ion chromatograph (Thermo Scientific, Waltham, MA, USA, ICS 1100 RFIC). Operational conditions set on the chromatograph were as follows: a running time of 11 min, an eluent a mixture of 2 mM carbonate and 0.2 mM bicarbonate, a suppressor current (ASRS_4 mm) of 11 mA, a pump working pressure of 1873.28 psi, and a flow rate of 1 mL/min. Retention times for chlorides and sulfates were 4.10 and 8.71 min, respectively.
For the analysis of carbamazepine (CBZ) and diclofenac (DIC), a calibration curve for each drug was prepared (Figure 2 and Figure 3). Additionally, Table 4 and Table 5 list concentrations and peak areas used in the calibration of the chromatograph. CBZ and DIC standards were prepared using a 100 μg/L stock solution by mixing 10 μg of each Sigma Aldrich, St. Louis, MO, USA, secondary standard (purity: 99.9%) with HPLC grade Methanol [54]. Working solutions of 0.5, 1.0, 2.5, 5.0, 7.5, 10, 20, 30, 40, and 50 μg/L were prepared by getting aliquots from the stock solution and placing them in 1.5 mL vials for readings. After that, 100 mL of each water sample was filtered through 125 µm filter papers and placed in a Reacti Therm Ts-18824 heater (Thermo Fisher Scientific, East Lyme, CT, USA) at 150 °C for concentrating CBZ and DIC. The resulting samples were again filtered through filters of 0.45 and 0.22 µm pore size and placed in 1.5 mL vials for chromatographic measurements. Before measuring both drugs with a Dionex Ultimate 3000 UHPLC ultrahigh performance liquid chromatograph (Dionex, Sunnyvale, CA, USA), its C18 Hypersil Gold column (length: 150 mm, diameter: 4.6 mm, and particle size: 5 µm) (Thermo Fisher Scientific, Oslo, Norway) was washed with ethanol for one hour. The mobile phase was prepared for each drug, provided in Table 6. The injected quantity of each sample was 20 µL, followed by a degas for 30 min, and transported to the C18 chromatographic column by a quaternary pump. Additional operation requirements for running the UHPLC for the analysis of both drugs are shown in Table 6.

3. Results and Discussion

3.1. Physicochemical Parameters

Data from ten sampling points and other published experimental results have been analyzed to evaluate the contamination of the Machángara River basin (Table 7a,b and Table 8). In general, it is observed that concentrations of physicochemical parameters of the river water are above the Ecuadorian permissible limits; however, Cl, Cu, Zn, and Fe are below. Moreover, concentrations of CBZ are lower compared to DIC. Notably, the distribution pattern of the river’s water quality parameters depends on the sampling point’s geographical location, the type of sewage reaching the river, and the consumption of the analyzed components. A detailed description of the measured parameters is provided in the following sections.
Table 7a illustrates the pH in each sampling point. The lowest value is at the T6 sampling point, located around the Sena bridge, south of Quito. This low pH may result from the solid and liquid household waste from this densely populated urban area being discharged into the Machángara River. Also, a foamy appearance and an unpleasant odor were recorded at this sampling point. Foam can be derived from detergents used for washing clothes and fabrics, and the smell can be linked to H2S or CH4 generated by the early anaerobic degradation of the organic matter in the riverbed.
In contrast, points T4 and T10, located in areas far from the south and east of the city, have the highest pH values (pH = 7.46). The hydrogen potential (pH) is somewhat above neutral because wastewater flows reaching the river’s water do not disturb it much. However, soluble salts may precipitate at a pH slightly higher than 7. Moreover, because the pH of the river water modulates the risk of toxicity of some chemical compounds such as ammonia, if the pH rises above 7, the ammonia species fraction increases, thus disrupting the river’s wildlife. In addition, pH variation tends to break the water’s chemical balance and mobilize pollutants, and toxic conditions may arise [55]. As seen in Table 7a, the mean temperature of the Machángara River basin is 17.02 °C. Moreover, the temperature at the sampling points varies between 16.10 °C (point T4) and 18.30 °C (point T9). According to Ecuadorian regulations, all points in the river basin are below the maximum permissible limit [56,57].
As seen in Table 7a, three points do not meet the recommended turbidity (optical property) limit of 100 NTU: T1 (238 NTU), T4 (139.25 NTU), and T6 (101.50 NTU). Notably, in the monitoring campaigns, high soil erosion was observed in those areas. However, the solid material that falls into the body of water and urban runoff at each sampling point has a different contribution. Consequently, the turbidity changes observed along the river tend to be random. Table 7a also shows that the hardness values range between 112.00 and 138.00 mg/L. A water hardness of less than 60 mg/L is considered soft water, while values greater than 120 mg/L are considered hard water [58]. From this point of view, the water of the Machángara River can be considered moderately hard (75–200 mg/L). Additionally, it should be noted that at point T8—Guápulo, the hardness value is higher (138 g/L) due to the ecological formation of the area through which the water passes until its catchment. Likewise, areas with steeper slopes (T3, T8, and T9) were found to have high hardness levels.
Total dissolved solids (TDS) concentration at the inlet and outlet of the WWTP varies between 1056.50 mg/L (T1—WWTP Inlet) and 912 mg/L. The TDS value is the highest at T1 because there are plenty of dissolved salts, minerals, metals, and organic and inorganic compounds smaller than 1.5 microns in the sewage at the entrance of WWTP. Nevertheless, the TDS removal efficiency of the biological treatment is low, approximately 10% (T2—WWTP Outlet: 912 mg/L). In the river, TDS ranges from 154.25 (T4—El Recreo) to 498.5 mg/L (T8—Guangopolo), below the maximum limit of 1000 mg/L recommended by the Ecuadorian Legislation for freshwater [56,57]. TDS values are below the allowed level because the Machángara River mainly receives household, industrial, and runoff water. On the other hand, TSS contents in only two sampling points (T1 = 183.50 mg/L and T4 = 143.00 mg/L) are above the maximum permissible limit (MPL) of 100 mg/L fixed by the Ecuadorian Criteria for surface and underground water for human consumption that require only conventional treatment [56,57]. The latter TSS values agree with the highest turbidity values found at those sampling points because turbidity measures how light passes through water, while TSS is a quantitative number of particles suspended in the water. There are also two points with low TSS values (T9 = 30.50 mg/L and T10 = 27.75 mg/L). Low TSS values resulted in sample collection points farther away from Quito City.
Measurements of anions in the river’s water reveal that Cl meets the maximum permissible limit (141 mg/L). However, it contains more chlorides upstream (points T1 to T6) compared to the eastern zone of the Metropolitan District of Quito (MDQ) (points T7 to T10). Moreover, nitrate (NO3) content at all sampling points exceeds the maximum admissible limit (10 mg/L). Nitrate is high because of the large amount of nitrogenized organic matter (from domestic wastewater) that decomposes in an oxidizing environment through nitrification. Curiously, at point T2, located at the outlet of the WWTP, NO3 is above the allowed limit (27.75 mg/L). Nevertheless, the highest nitrate concentration occurs at point T5, the Villa Flora neighborhood, with 288.25 mg/L. During the sampling campaigns, leachates from artisan landfills and low-income people living in temporary shelters without toilets on the river’s shore were observed. It is most likely that nitrogen-based residuals undergo an incomplete nitrification–denitrification process. Hence, these high NO3 concentrations stimulate eutrophication in the Machángara River, a leading cause of the impairment of this source of freshwater [59]. Furthermore, the concentration of nitrites (NO2) in five sampling points exceeds the maximum value of 1.0 mg/L established by Ecuadorian regulations [56,57]. Sampling points with the highest presence of nitrites are T4, T6, T7, T8, and T9, with 2.02; 2.30; 2.02; 2.81; and 5.42 mg/L, respectively. Likewise, nitrites are derived from the biodegradation of urine, nitrification, or denitrification reactions and indicate fecal contamination [60].
The sulfate (SO42−) concentration is the highest at point T1 (110 mg/L). Downstream, there is a decrease in the sulfate concentrations in the Machángara River basin, reaching point T10 with 34.74 mg/L. As observed in Table 7a,b, the concentration of sulfates follows the same trend as the TSS or turbidity in the river’s water, and it varies in cloudiness [61] except for point T2 (exit of WWTP). At this point, TSS is low because it has been removed in the WWTP. Regarding phosphate (PO4P), the Ecuadorian standards fail to establish the maximum permissible limit for fresh waters. However, based on the measurements obtained in this study, PO4P varies from 4.15 mg/L (T2) to 16.58 mg/L (T3) in the whole watershed. High phosphate concentrations imply more household discharges and the presence of detergents, which cause eutrophication and increase the state of putrefaction of the water [62]. Our results are above the range of most natural waters (0.001–0.02 mg/L PO4P), according to Chapman (1996). However, this author states that concentrations as low as 0.001 mg/L PO4P may be found in some pristine waters and as high as 200 mg/L PO4P in several enclosed waters [63].

3.2. Metals

Data in Table 8 summarizes Cu, Ni, Fe, and Zn concentration values measured along the Machángara River basin. The TULSMA 2015 establishes the MPLs for metals in water for human consumption and domestic use as follows: 2.0 mg/L (Cu2+), 5.0 mg/L (Zn2+), and 1.0 mg/L (Fe3+). As provided in Table 8, copper concentrations of all sampling points fluctuate between 0.042 mg/L (T9) and 0.071 mg/L (T1), nickel oscillate from 0.001 (T2) to 0.05 mg/L (T1), and the zinc is between 0.001 mg/L (T2) to 0.011 mg/L (T4). Thus, the regulated heavy metals (Cu2+ and Zn2+) in the water of the Machángara River are below their corresponding MPLs.
Furthermore, at point T2 (WWTP inlet), no presence of Fe is detected; however, in the following sampling points, it is found that 0.079 mg/L (T6) is the minimum value, and 0.287 mg/L (T7) is the maximum. Consequently, iron contents are also under its MPL (1 mg/L). The iron source can be from the basin’s contact with groundwater. The other dissolved metals are of natural origin (enrichment) or anthropogenic. The latter contribution is because of releases from human activities and the use of pesticides in small agriculture farming. Moreover, in the MDQ, old buildings still hold piping fabricated with heavy metal alloys. As time passes, pipes are oxidized by humidity and corrosion and deliver metallic particles [64], and ultimately, runoff waters carry them into the river basin.

3.3. Carbamazepine and Diclofenac

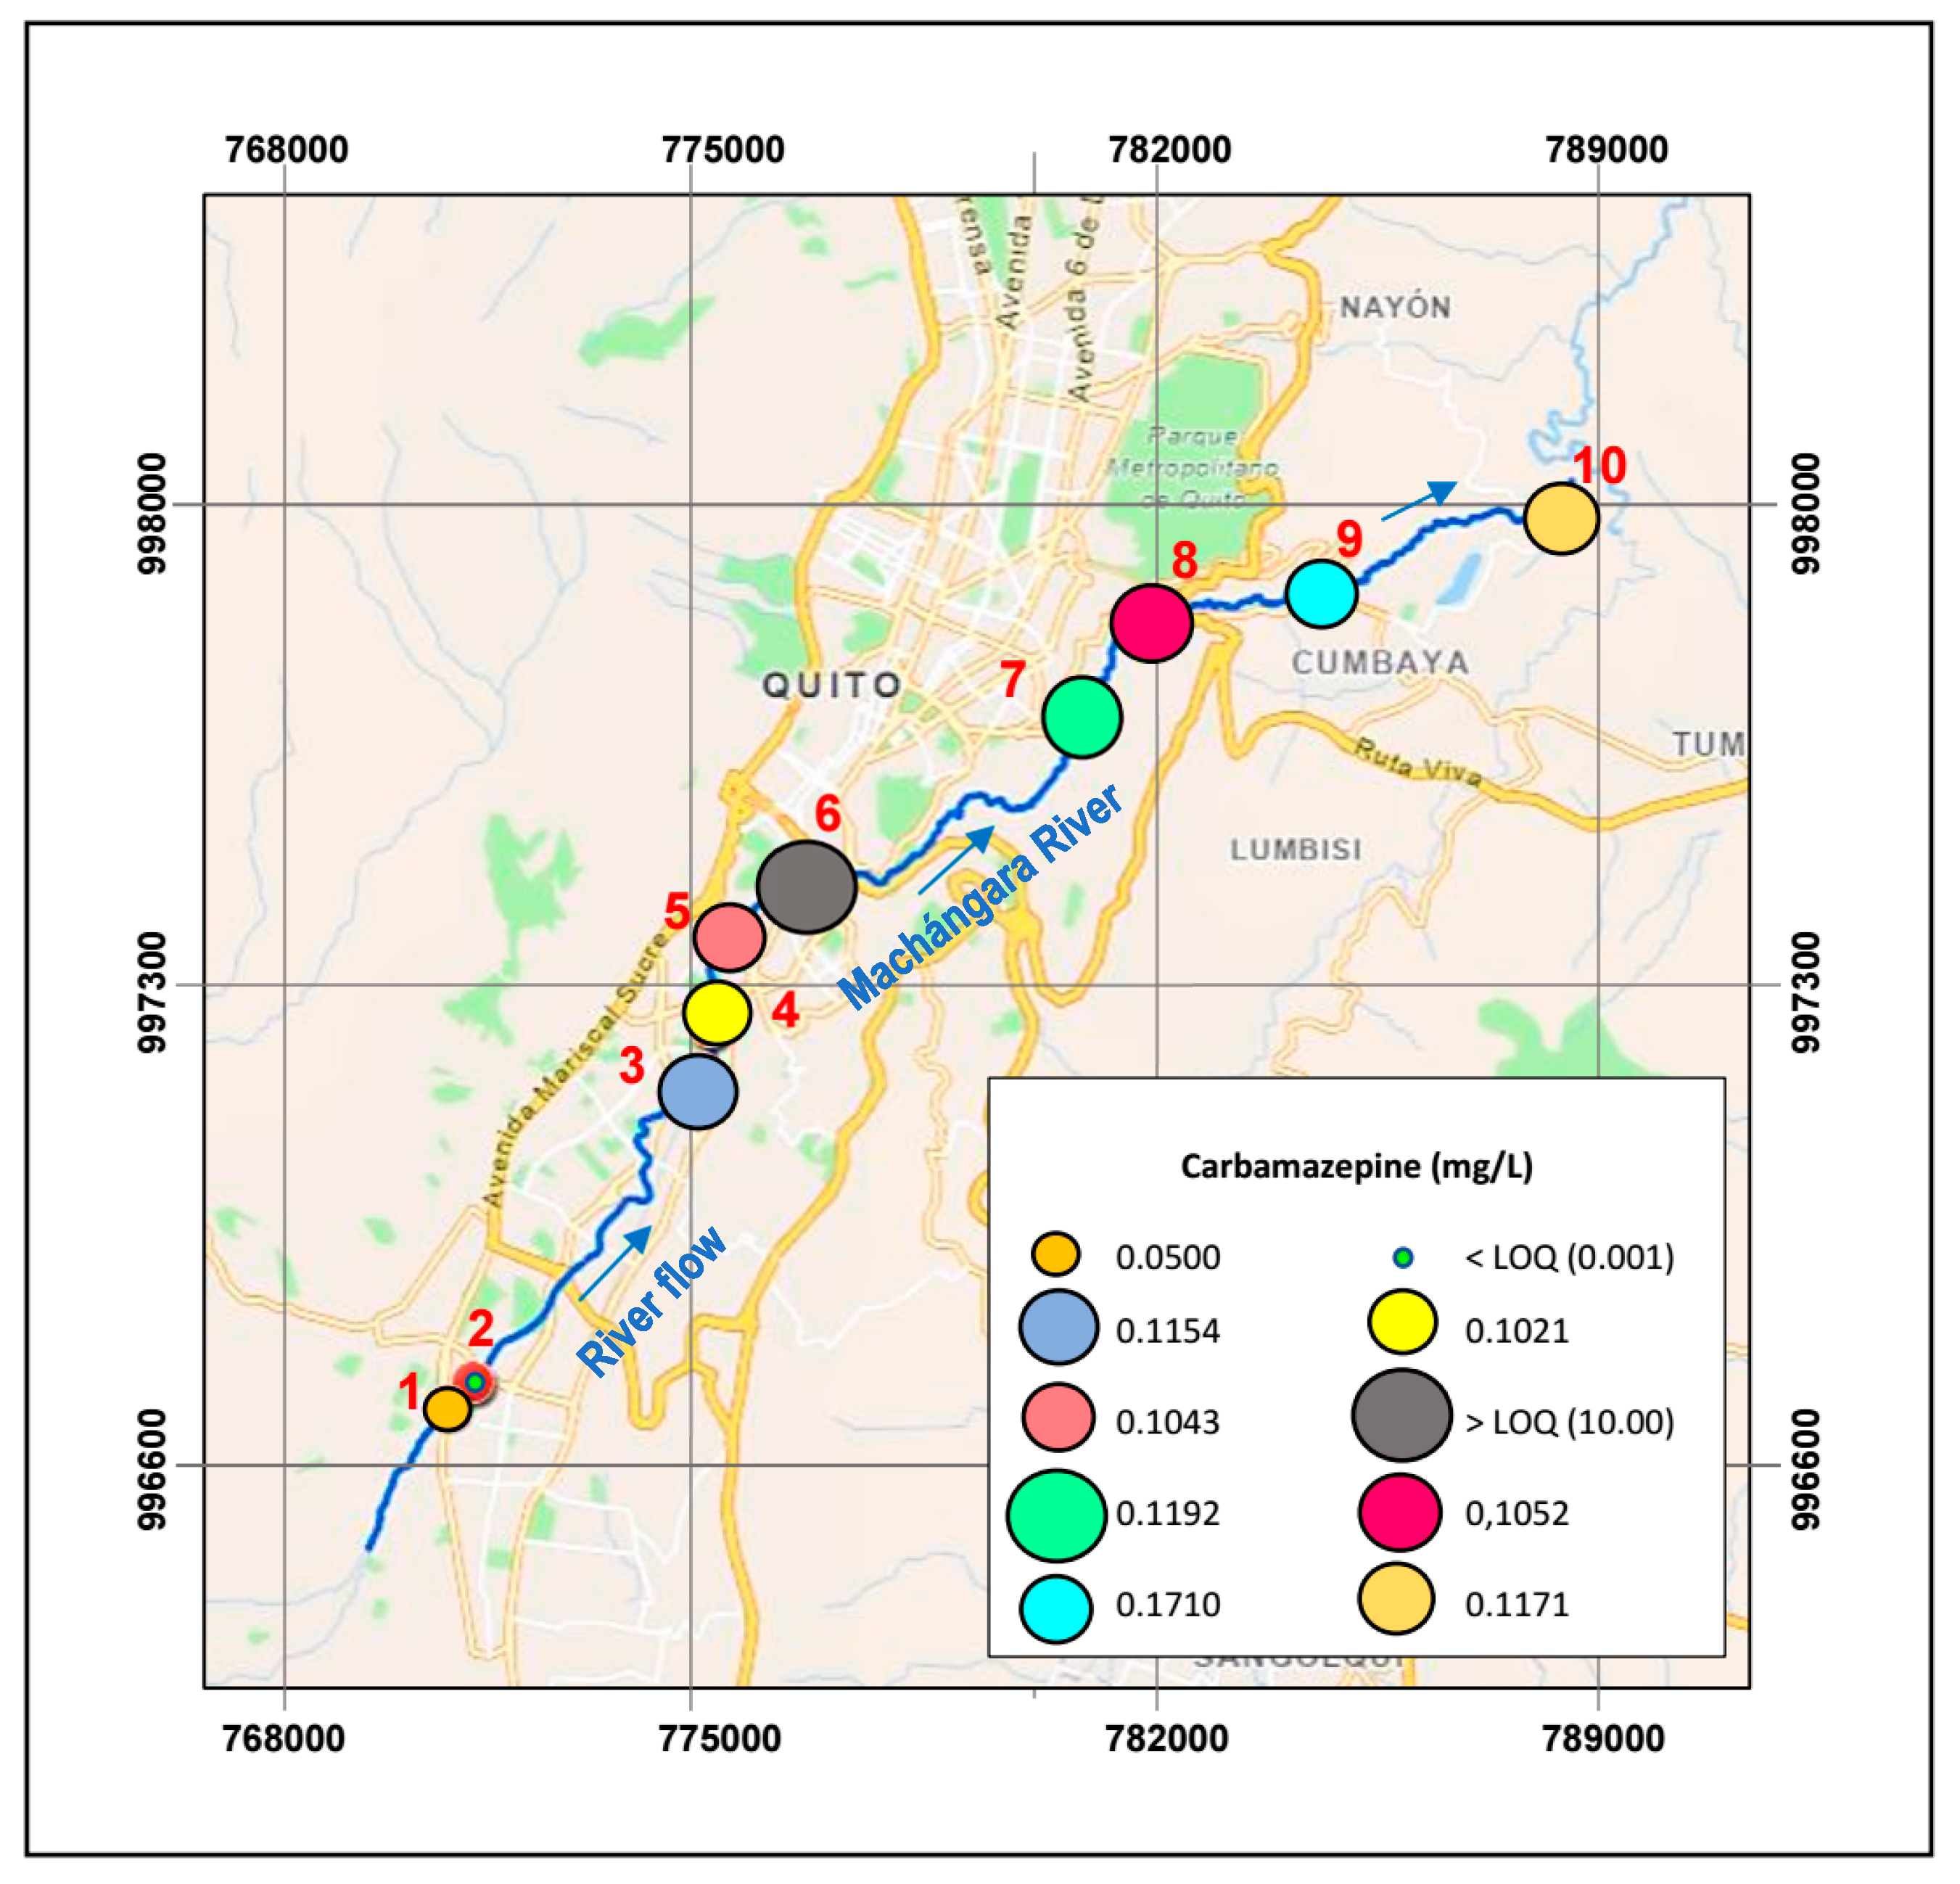
3.3.1. Carbamazepine
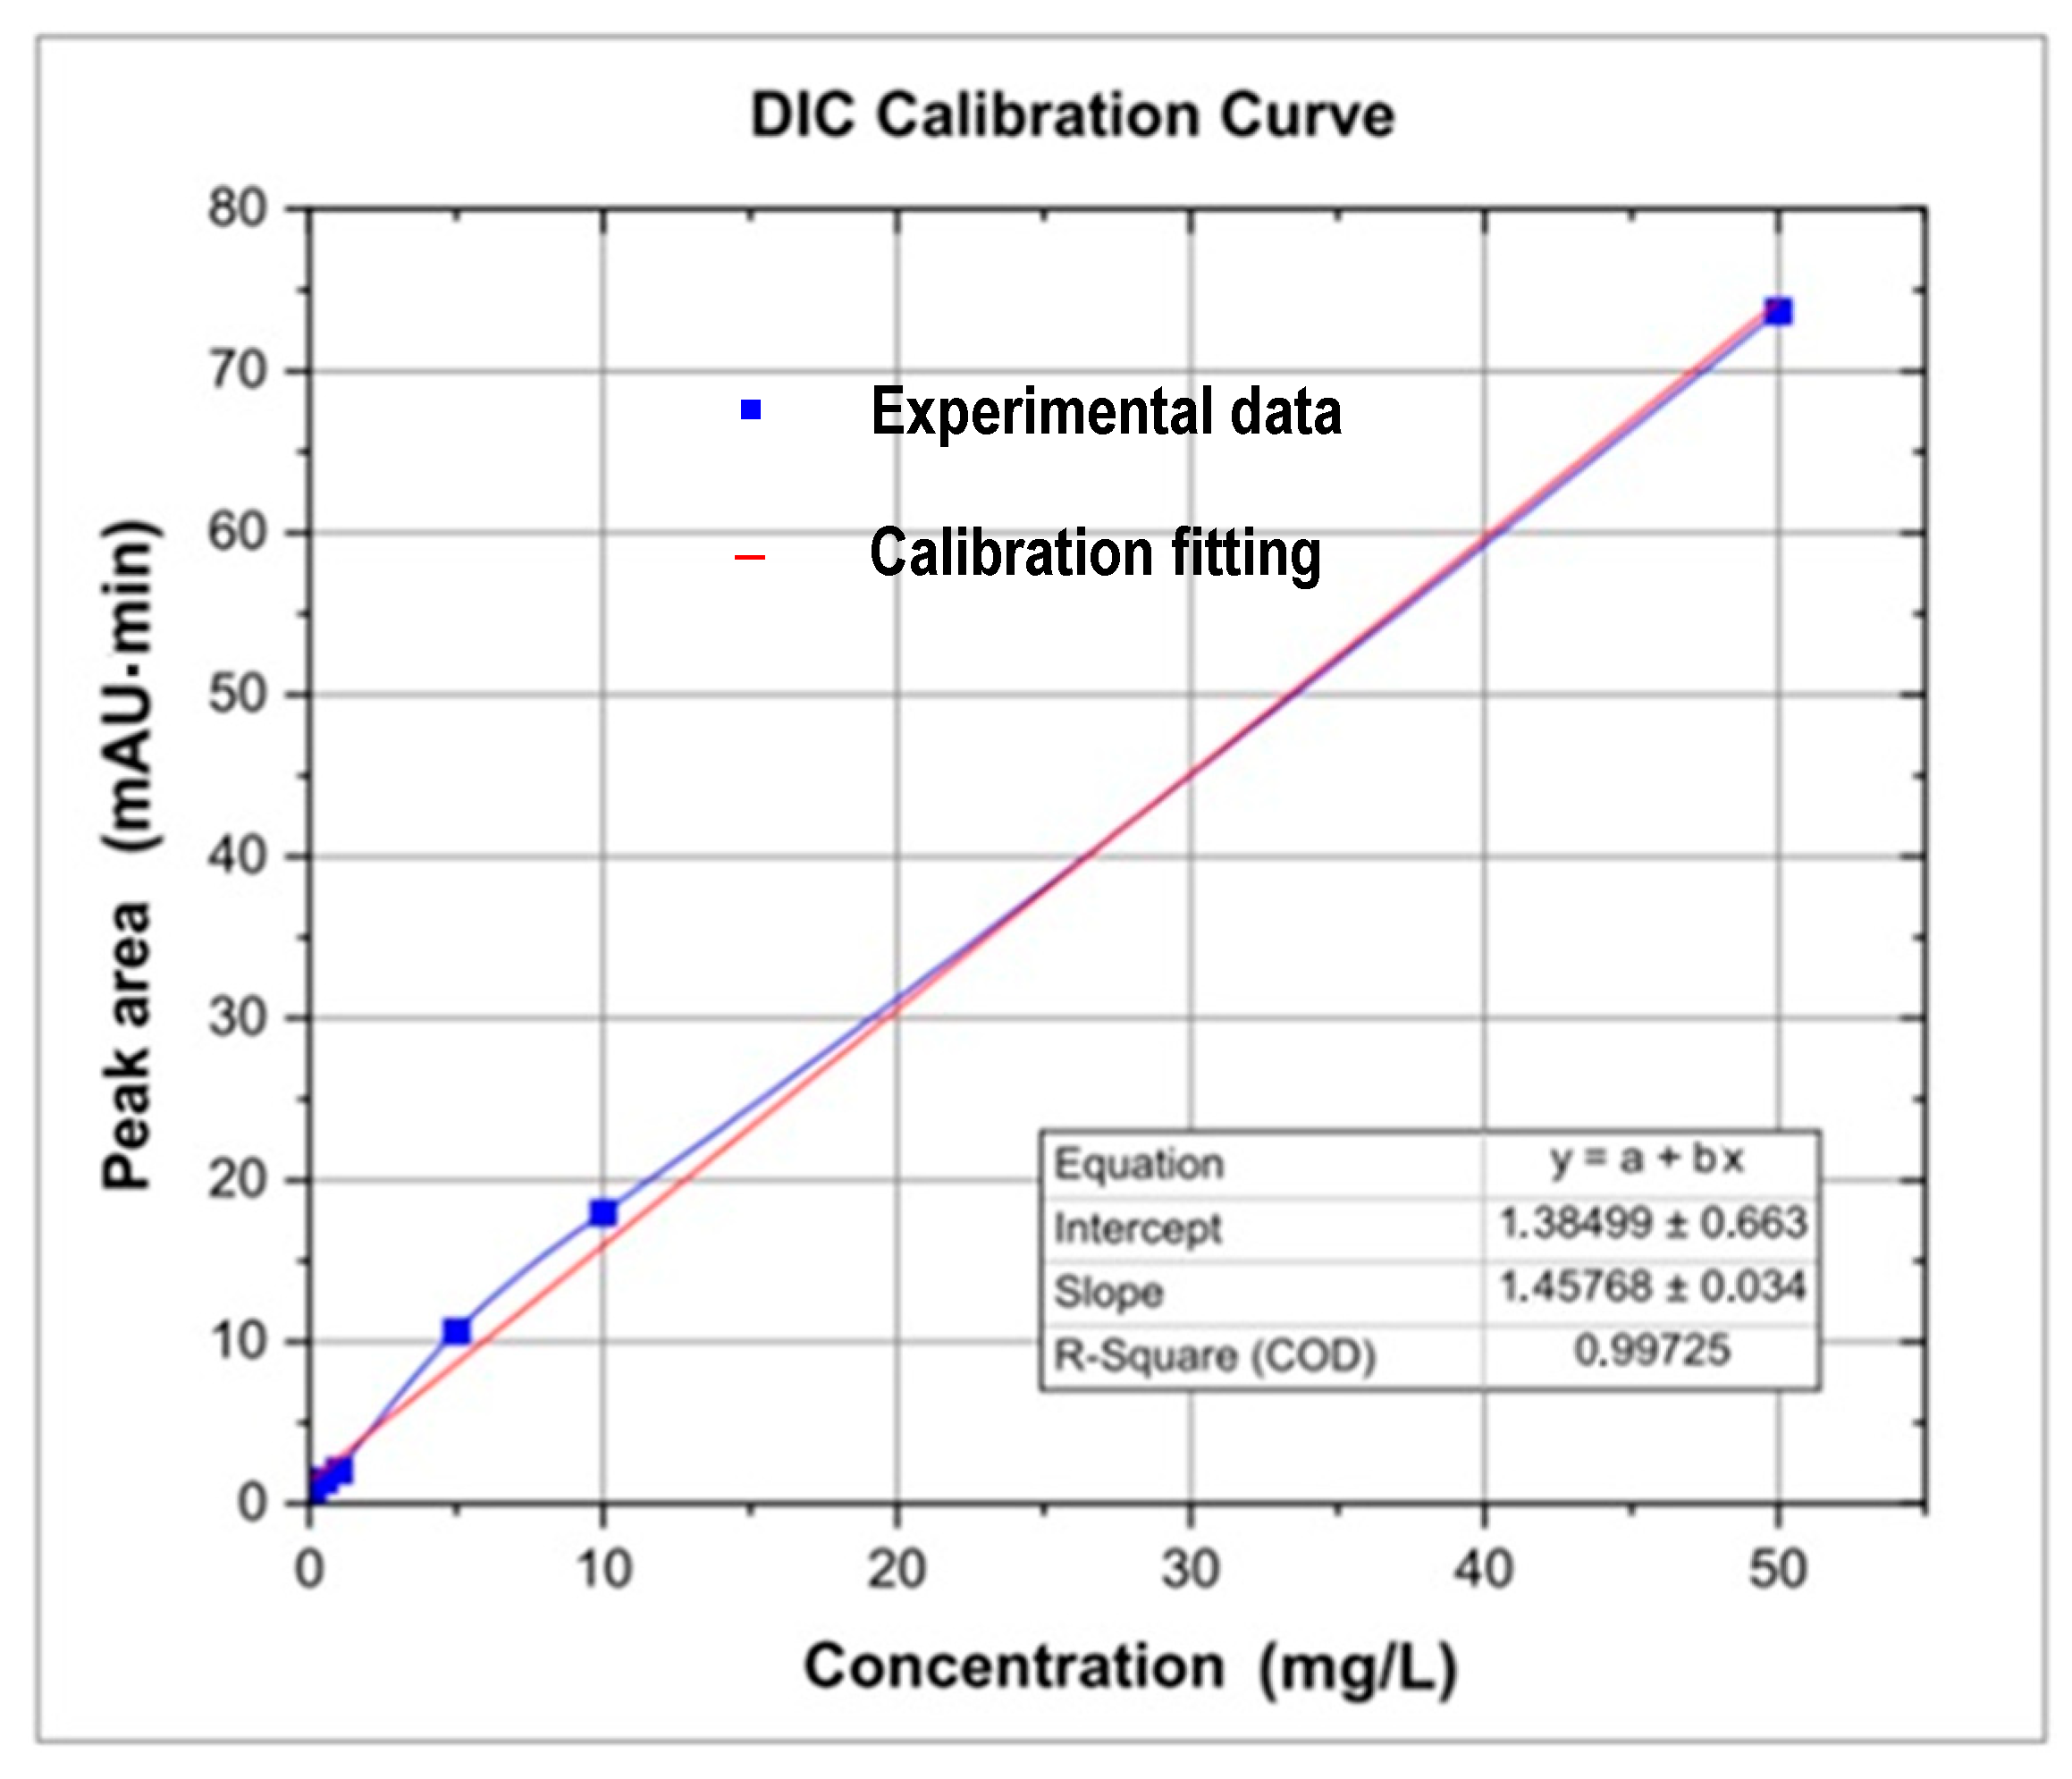
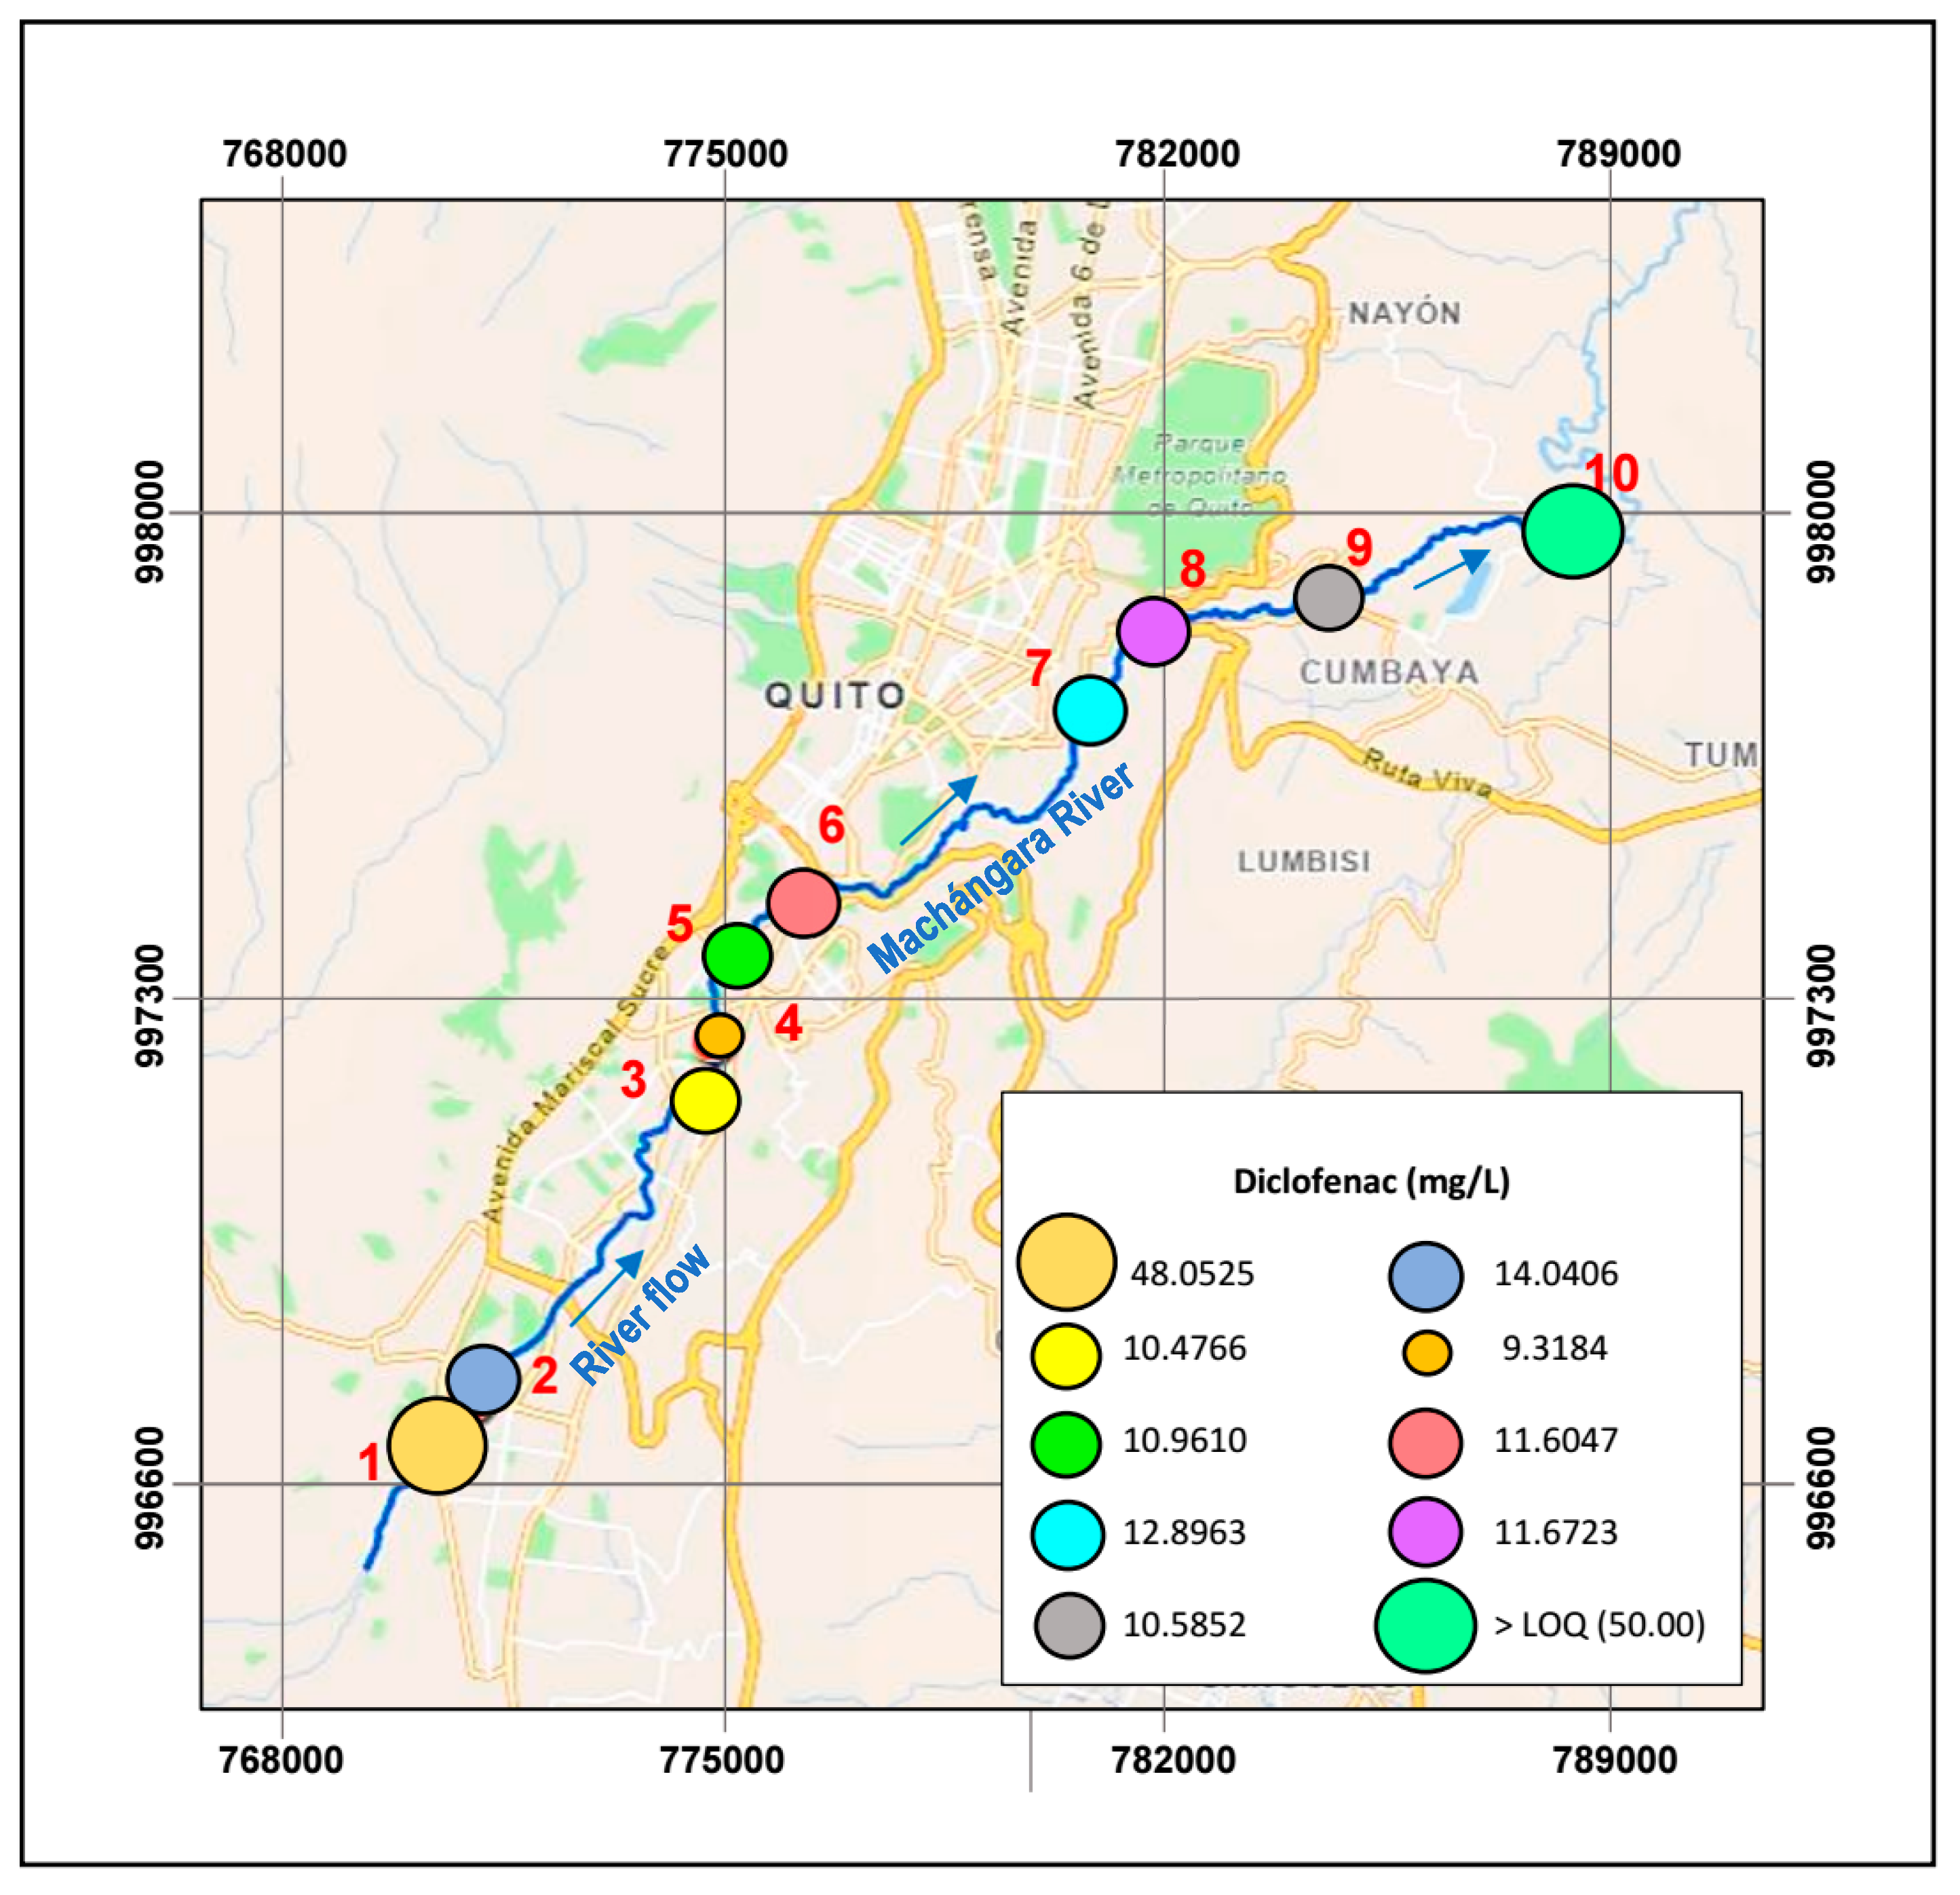
The CBZ concentration at point T1 (WWTP inlet, Figure 4) is on average 50 μg/L (Table 9), while at T2 (WWTP exit, Figure 4), it is below the limit of detection (LOD). The lowest value of CBZ is from the water collected at the exit of the wastewater treatment plant. Thus, the complete degradation of the CBZ could be attributed to the WWTP’s efficiency. Nevertheless, the scientific literature asserts that the removal efficiency of CBZ in conventional wastewater treatment plants is approximately 30%, working at 40 d of sludge retention time [65]. Hence, the carbamazepine that remains in the WWTP effluent would be 35 μg/L, a value below the drug detection level. Conversely, at point T3, there is an increase of twentyfold in the concentration of CBZ (115.4 μg/L) compared to the drug level at point T1. The resulting concentration of CBZ can be associated with the discharges from the Hospital del Sur to the Machángara River. Surprisingly, concentrations of CBZ at points T6 and T7 (see Figure 4) exceeded the limit of quantification (LOQ) of the equipment. Besides, the river water at these sampling points exhibited high turbidity and hardness (see Table 7a). Accordingly, the drug peaks on the HPLC could overlap because of the water’s turbidity and provide unreliable measurements. In comparison, at sampling points T8, T9, and T10, concentrations of CBZ (119.2, 105.2, and 117.1 μg/L) are higher than the levels of the medical compound at the other collecting points.
Almost all concentrations of CBZ found in this study are higher (Table 9) than those reported in previous investigations, such as in the range of 0.081 to 1.11 μg/L [66,67]. However, they are lower than the values measured by Voloshenko et al., 2015 [68] in the south and north of the Machángara River (598 and 830 μg/L). This trend can be associated with its long half-life (~167 days) and slow biodegradation under solar light and ambient temperature [69].
Additionally, it has been reported that CBZ is usually lethal to fish when the concentration exceeds 43 μg/L [70]; thus, fish life is potentially endangered in most of the watershed sampling points. Moreover, CBZ’s hydrophobic nature tends to adhere to sediments (not measured in this study), threatening organisms that feed on organic matter [71].

3.3.2. Diclofenac

As illustrated in Table 10 and Figure 5, the sampling point with the highest concentration of DIC is T1, with 48.0525 mg/L on average. This water sample is from the entrance of the WWTP, where a collection of all the residual water from south of Quito exists. Meanwhile, at the exit of the wastewater treatment plant (point T2), the concentration is 14.0406 mg/L. This result confirms that conventional wastewater treatments do not entirely remove diclofenac (21–40%) [72]. Intriguingly, in Table 10, it is observed that all measurements of DIC at point T10 (Figure 5) are above the quantification limit of the HPLC. These maximal DIC values can be credited to the substantial sewage discharges from the north residential neighborhoods of Quito that flow into the Machángara River. In contrast, moderate concentrations of diclofenac are observed in T7, T8, and T9 (12.8973, 11.6723, and 10.5852 mg/L, on average) compared with the results at the other sampling points. As reported by other researchers, the high and moderate concentrations of DIC could be linked with drug persistence in the environment [73,74,75].
Moreover, as observed in Table 9 and Table 10, all concentrations of diclofenac are above carbamazepine. It is suggested that higher values of DIC are correlated to the trend of drug consumption by the inhabitants of Quito. Diclofenac is consumed ~1,300,000 times, while carbamazepine is only one-third [29].
Regarding DIC effects on aquatic life, Schwaiger et al., 2004 [76] exposed an Oncorhynchus mykiss fish to 1 to 500 μg/L concentrations. They found the lowest observed effect concentration (LOEC) was 5 μg/L. That value caused gill disorders and kidney damage. Similarly, Triebskorn et al., (2004) [77] showed that at a concentration of 1 μg/L, cytological alterations are produced in the gills’ kidneys and liver. Contrasting the diclofenac measured in this study with data from previous investigations, it is noticeable that the drug levels found in the Machángara River basin can cause toxic effects on the aquatic beings living in this surficial water source.

4. Conclusions

The physicochemical parameters of the Machángara River basin, on average, are a temperature of 17.02 °C, pH of 7.06, electrical conductivity of 760.96 µS/cm, and turbidity of 83.43 NTU. Furthermore, the average content solids are 72.88 mg/L of TSS, 495.47 mg/L of TDS, and 568.35 mg/L of TS. Values of the water quality parameters mainly depend on the runoff waters and the domestic and industrial wastes dumped into the Machángara River basin, as well as intermittent landslides falling towards the river. Concentrations of NO3 in the entire river basin and NO2 in five monitoring locations (T4, T6, T7, T8, and T9) are higher than their MPLs due to the incomplete nitrification–denitrification of nitrogenous organic matter, triggering an algal bloom in the Machángara River. Moreover, SO42− concentrations follow the same trend as the TSS or turbidity in the river’s water (Table 7a,b), and it varies in cloudiness except for point T2 (exit of WWTP). At this point, TSS is low because it has been removed from the WWTP. Meanwhile, PO4P concentrations tend to rise due to more household discharges, thus increasing eutrophication in the river water pathway.
Additionally, the metal content for Cu, Zn and Fe is within the permissible limits. The iron source is attributed to the basin’s contact with groundwater. The other metals are primarily generated from human activity discharges, pesticides from agriculture, and old piping oxidation/corrosion.
For pharmaceuticals, carbamazepine concentrations in the Machángara River basin are below the detection limit at T2 up to 0.121 mg/L at T3. In contrast, diclofenac levels range from 9.32 mg/L at T4 to 48.05 mg/L at T1. Notably, most of the pharmaceutical contamination of the river comes from sewage discharges. However, the discrepancy in concentrations is credited to the consumption of both medicines by the inhabitants of Quito. Diclofenac is utilized ~1,300,000 times, while carbamazepine consumption is one-third of diclofenac [29].
In this study, the highest concentrations of diclofenac and carbamazepine are 48.08 mg/L and 0.121 mg/L, respectively. So, the values of both medicine residuals are well above the lethal levels reported in other studies for water-living species [70,71,76,77]. Accordingly, the Machángara River could be dangerous for aquatic life. In this context, our scientific work provides evidence of pollution; however, the government should implement facilities to reduce concentrations of the studied drugs and other pharmaceuticals that may be contained in the river water.

Author Contributions

R.I.: She carried out field and laboratory research. Data analysis and writing of the first draft. Images. D.B.-G.: Director of the research project. Approach to the idea and definition of the project, selection of sampling points, data analysis, writing of the paper, corrections and response to reviewers. L.C.-F.: Analysis of research results, data review, bibliography, writing and response to reviewers. All authors have read and agreed to the published version of the manuscript.

Funding

This study was supported by Universidad de las Fuerzas Armadas ESPE, with the project “Determination of concentrations of emerging pollutants in the San Pedro, Guayllabamba, Esmeraldas and Daule rivers, and analysis of alternatives for nanoparticle treatment, of Convocatoria de Proyectos 2019.

Data Availability Statement

Data is contained within the article.

Acknowledgments

This study was carried out with the commitment and support of Center for Nanoscience and Nanotechnology (CENCINAT).

Conflicts of Interest

The authors declare no conflict of interest.

References

  1. Gupta, G.S.; Orbán, A. Water is life, life is water: (Un) sustainable use and management of water in the 21st century. Corvinus J. Sociol. Soc. Policy 2018, 9, 81–100. [Google Scholar]
  2. Topp, S.N.; Pavelsky, T.M.; Jensen, D.; Simard, M.; Ross, M.R. Research trends in the use of remote sensing for inland water quality science: Moving towards multidisciplinary applications. Water 2020, 12, 169. [Google Scholar] [CrossRef]
  3. Sagan, V.; Peterson, K.T.; Maimaitijiang, M.; Sidike, P.; Sloan, J.; Greeling, B.A.; Maalouf, S.; Adams, C. Monitoring inland water quality using remote sensing: Potential and limitations of spectral indices, bio-optical simulations, machine learning, and cloud computing. Earth-Sci. Rev. 2020, 205, 103187. [Google Scholar] [CrossRef]
  4. Fox, K.R. Water treatment and equipment decontamination techniques. J. Contemp. Water Res. Educ. 2009, 129, 5. [Google Scholar] [CrossRef]
  5. Zuluaga-Gomeza, J.; Bonaverib, P.; Zuluagab, D.; Álvarez-Peñaa, C.; Ramirez-Ortiza, N. Techniques for water disinfection, decontamination and desalinization: A review. Desalin. Water Treat 2020, 181, 47–63. [Google Scholar] [CrossRef]
  6. Bi, J.; Tao, Q.; Huang, X.; Wang, J.; Wang, T.; Hao, H. Simultaneous decontamination of multi-pollutants: A promising approach for water remediation. Chemosphere 2021, 284, 131270. [Google Scholar] [CrossRef] [PubMed]
  7. Singh, P.; Borthakur, A.; Singh, R.; Bhadouria, R.; Singh, V.K.; Devi, P. A critical review on the research trends and emerging technologies for arsenic decontamination from water. Groundw. Sustain. Dev. 2021, 14, 100607. [Google Scholar] [CrossRef]
  8. Pradhan, S.S.; Gowda, G.B.; Adak, T.; Guru-Pirasanna-Pandi, G.; Patil, N.B.; Annamalai, M.; Rath, P.C. Pesticides occurrence in water sources and decontamination techniques. In Pesticides-Updates on Toxicity, Efficacy and Risk Assessment; IntechOpen: London, UK, 2022. [Google Scholar]
  9. Méndez, G.; Vásquez, K.; Coyago, E. Bacteria Identification in Machángara River Water Capable of Metabolizing Emerging Estrone Pollutant. In Communication, Smart Technologies, and Innovation for Society: Proceedings of CITIS 2021; Springer Singapore: Singapore, 2021; pp. 21–30. [Google Scholar]
  10. Pare, S.; Bonzi-Coulibaly, L.Y. Water quality issues in West and Central Africa: Present status and future challenges. IAHS Publ. 2013, 361, 87–95. [Google Scholar]
  11. Li, C.; Wu, K.; Chen, L.; Liu, Z.; Zhao, X.; Li, Y.; Hu, M.; Zhao, Q.; Ye, Z. Advanced treatment of low-pollution and poor biodegradability sewage by combined process. J. Clean. Prod. 2023, 414, 137366. [Google Scholar] [CrossRef]
  12. Zhang, B.; Ning, D.; Yang, Y.; Van Nostrand, J.D.; Zhou, J.; Wen, X. Biodegradability of wastewater determines microbial assembly mechanisms in full-scale wastewater treatment plants. Water Res. 2020, 169, 115276. [Google Scholar] [CrossRef]
  13. Patel, N.; Khan, M.D.; Shahane, S.; Rai, D.; Chauhan, D.; Kant, C.; Chaudhary, V.K. Emerging pollutants in aquatic environment: Source, effect, and challenges in biomonitoring and bioremediation-a review. Pollution 2020, 6, 99–113. [Google Scholar]
  14. Kumar, R.; Qureshi, M.; Vishwakarma, D.K.; Al-Ansari, N.; Kuriqi, A.; Elbeltagi, A.; Saraswat, A. A review on emerging water contaminants and the application of sustainable removal technologies. Case Stud. Chem. Environ. Eng. 2022, 6, 100219. [Google Scholar] [CrossRef]
  15. Vasilachi, I.C.; Asiminicesei, D.M.; Fertu, D.I.; Gavrilescu, M. Occurrence and fate of emerging pollutants in water environment and options for their removal. Water 2021, 13, 181. [Google Scholar] [CrossRef]
  16. Arman, N.Z.; Salmiati, S.; Aris, A.; Salim, M.R.; Nazifa, T.H.; Muhamad, M.S.; Marpongahtun, M. A review on emerging pollutants in the water environment: Existences, health effects and treatment processes. Water 2021, 13, 3258. [Google Scholar] [CrossRef]
  17. Gavrilescu, M.; Demnerová, K.; Aamand, J.; Agathos, S.; Fava, F. Emerging pollutants in the environment: Present and future challenges in biomonitoring, ecological risks and bioremediation. New Biotechnol. 2015, 32, 147–156. [Google Scholar] [CrossRef] [PubMed]
  18. Tang, Y.; Yin, M.; Yang, W.; Li, H.; Zhong, Y.; Mo, L.; Liang, Y.; Ma, X.; Sun, X. Emerging pollutants in water environment: Occurrence, monitoring, fate, and risk assessment. Water Environ. Res. 2019, 91, 984–991. [Google Scholar] [CrossRef] [PubMed]
  19. Jjemba, P.K. Excretion and ecotoxicity of pharmaceutical and personal care products in the environment. Ecotoxicol. Environ. Saf. 2006, 63, 113–130. [Google Scholar] [CrossRef] [PubMed]
  20. Subedi, B.; Balakrishna, K.; Joshua, D.I.; Kannan, K. Mass loading and removal of pharmaceuticals and personal care products including psychoactives, antihypertensives, and antibiotics in two sewage treatment plants in southern India. Chemosphere 2017, 167, 429–437. [Google Scholar] [CrossRef] [PubMed]
  21. Shankar, P.R.; Partha, P.; Nagesh, S. Prescribing patterns in medical outpatients. Int. J. Clin. Pract. 2002, 56, 549–551. [Google Scholar] [CrossRef]
  22. Poot, E.; Nelson, K.; Taylor, D.; Weatherall, M. Antimicrobial prescribing in New Zealand: Medical versus non-medical prescribing practices. In Proceedings of the Pharmacology Conference, Wellington, New Zealand, 16 December 2019. [Google Scholar]
  23. Aydin, S.; Aydin, M.E.; Ulvi, A. Monitoring the release of anti-inflammatory and analgesic pharmaceuticals in the receiving environment. Environ. Sci. Pollut. Res. 2019, 26, 36887–36902. [Google Scholar] [CrossRef]
  24. Santos, L.H.; Gros, M.; Rodriguez-Mozaz, S.; Delerue-Matos, C.; Pena, A.; Barceló, D.; Montenegro, M.C.B. Contribution of hospital effluents to the load of pharmaceuticals in urban wastewaters: Identification of ecologically relevant pharmaceuticals. Sci. Total Environ. 2013, 461, 302–316. [Google Scholar] [CrossRef] [PubMed]
  25. Vieira, Y.; Pereira, H.A.; Leichtweis, J.; Mistura, C.M.; Foletto, E.L.; Oliveira, L.F.; Dotto, G.L. Effective treatment of hospital wastewater with high-concentration diclofenac and ibuprofen using a promising technology based on degradation reaction catalyzed by Fe0 under microwave irradiation. Sci. Total Environ. 2021, 783, 146991. [Google Scholar] [CrossRef] [PubMed]
  26. Capparelli, M.V.; Cipriani-Avila, I.; Jara-Negrete, E.; Acosta-López, S.; Acosta, B.; Pérez-González, A.; Molinero, J.; Pinos-Vélez, V. Emerging contaminants in the northeast Andean foothills of Amazonia: The case of study of the city of Tena, Napo, Ecuador. Bull. Environ. Contam. Toxicol. 2021, 107, 2–10. [Google Scholar] [CrossRef] [PubMed]
  27. Cipriani-Avila, I.; Molinero, J.; Cabrera, M.; Medina-Villamizar, E.J.; Capparelli, M.V.; Jara-Negrete, E.; Pinos-Velez, V.; Acosta, S.; Andrade, D.L.; Barrado, M.; et al. Occurrence of emerging contaminants in surface water bodies of a coastal province in Ecuador and possible influence of tourism decline caused by COVID-19 lockdown. Sci. Total Environ. 2023, 866, 161340. [Google Scholar] [CrossRef] [PubMed]
  28. Quilumbaqui, C. Determinación de la Concentración de Elementos Mayores en Dieciocho Ríos de la Provincia de Pichincha, Ecuador. Trabajo de Titulación Presentado Como Requisito Para la Obtención del Título: Ingeniero Ambiental. Universidad San Francisco de Quito. 2017. Available online: http://repositorio.usfq.edu.ec/bitstream/23000/7047/1/135154.pdf (accessed on 17 August 2020).
  29. SGI. Sistema de Gestión Integral. Consumos de Medicamentos Esenciales. Subsecretaría de Gobernanza de la Salud Pública. Dirección Nacional de Medicamentos y Dispositivos Médicos. Quito-Ecuador. 2017. Available online: https://www.conasa.gob.ec/biblioteca-conasa/CNMB-XI/Libro-Cuadro-Medicamentos-Basicos-11a-revision-2022.pdf/ (accessed on 18 August 2020).
  30. Bahlmann, A.; Brack, W.; Schneider, R.J.; Krauss, M. Carbamazepine and its metabolites in wastewater: Analytical pitfalls and occurrence in Germany and Portugal. Water Res. 2014, 57, 104–114. [Google Scholar] [CrossRef] [PubMed]
  31. Huber, C.; Preis, M.; Harvey, P.J.; Grosse, S.; Letzel, T.; Schröder, P. Emerging pollutants and plants–metabolic activation of diclofenac by peroxidases. Chemosphere 2016, 146, 435–441. [Google Scholar] [CrossRef] [PubMed]
  32. Richardson, S.D.; Ternes, T.A. Water analysis: Emerging contaminants and current issues. Anal. Chem. 2018, 90, 398–428. [Google Scholar] [CrossRef]
  33. Gogoi, A.; Mazumder, P.; Tyagi, V.K.; Chaminda, G.T.; An, A.K.; Kumar, M. Occurrence and fate of emerging contaminants in water environment: A review. Groundw. Sustain. Dev. 2018, 6, 169–180. [Google Scholar] [CrossRef]
  34. Kasonga, T.K.; Coetzee, M.A.; Kamika, I.; Ngole-Jeme, V.M.; Momba, M.N.B. Endocrine-disruptive chemicals as contaminants of emerging concern in wastewater and surface water: A review. J. Environ. Manag. 2021, 277, 111485. [Google Scholar] [CrossRef]
  35. Daughton, C.G. Non-regulated water contaminants: Emerging research. Environ. Impact Assess. Rev. 2004, 24, 711–732. [Google Scholar] [CrossRef]
  36. Halden, R.U.; Paull, D.H. Co-occurrence of triclocarban and triclosan in US water resources. Environ. Sci. Technol. 2005, 39, 1420–1426. [Google Scholar] [CrossRef] [PubMed]
  37. Bănăduc, D.; Simić, V.; Cianfaglione, K.; Barinova, S.; Afanasyev, S.; Öktener, A.; McCall, G.; Simić, S.; Curtean-Bănăduc, A. Freshwater as a sustainable resource and generator of secondary resources in the 21st century: Stressors, threats, risks, management and protection strategies, and conservation approaches. Int. J. Environ. Res. Public Health 2022, 19, 16570. [Google Scholar] [CrossRef] [PubMed]
  38. Sharma, S.; Bhattacharya, A.J.A.W.S. Drinking water contamination and treatment techniques. Appl. Water Sci. 2017, 7, 1043–1067. [Google Scholar] [CrossRef]
  39. Weerasooriya, R.R.; Liyanage, L.P.K.; Rathnappriya, R.H.K.; Bandara, W.B.M.A.C.; Perera, T.A.N.T.; Gunarathna, M.H.J.P.; Jayasinghe, G.Y. Industrial water conservation by water footprint and sustainable development goals: A review. Environ. Dev. Sustain. 2021, 23, 12661–12709. [Google Scholar] [CrossRef]
  40. Gil, M.I.; Selma, M.V.; López-Gálvez, F.; Allende, A. Fresh-cut product sanitation and wash water disinfection: Problems and solutions. Int. J. Food Microbiol. 2009, 134, 37–45. [Google Scholar] [CrossRef]
  41. Sakthivadivel, M.; Nirmala, A.; Sakthivadivel, J.; Mukhilan, R.R.; Tennyson, S. Physicochemical and biological parameters of water at industrial sites of metropolitan city of Chennai, Tamil Nadu, India. Water Conserv. Manag. 2020, 4, 90–98. [Google Scholar] [CrossRef]
  42. Jerves-Cobo, R.; Everaert, G.; Iñiguez-Vela, X.; Córdova-Vela, G.; Díaz-Granda, C.; Cisneros, F.; Nopens, I.; Goethals, P.L.M. A methodology to model environmental preferences of EPT taxa in the Machángara river basin (Ecuador). Water 2017, 9, 195. [Google Scholar] [CrossRef]
  43. Herrera, I.A.; Burneo, P.C. Environmental flow assessment in Andean rivers of Ecuador, case study: Chanlud and El Labrado dams in the Machángara River. Ecohydrol. Hydrobiol. 2017, 17, 103–112. [Google Scholar] [CrossRef]
  44. Veintimilla-Reyes, J.; De Meyer, A.; Cattrysse, D.; Tacuri, E.; Vanegas, P.; Cisneros, F.; Van Orshoven, J. MILP for optimizing water allocation and reservoir location: A case study for the Machángara river basin, Ecuador. Water 2019, 11, 1011. [Google Scholar] [CrossRef]
  45. EPMAPS. Memoria de Sostenibilidad 2016. Alcaldía de Quito. 2016. Available online: https://www.aguaquito.gob.ec/wp-content/uploads/2017/06/MEMORIA-DE-SOSTENIBILIDAD-AGUA-DE-QUITO-2016.pdf (accessed on 17 August 2020).
  46. Vizcaíno, I.P.; Carrera, E.V.; Sanromán-Junquera, M.; Muñoz-Romero, S.; Luis Rojo-Alvarez, J.; Cumbal, L.H. Spatio-temporal analysis of water quality parameters in Machángara river with nonuniform interpolation methods. Water 2016, 8, 507. [Google Scholar] [CrossRef]
  47. Ortega-Paredes, D.; Barba, P.; Mena-López, S.; Espinel, N.; Crespo, V.; Zurita, J. High quantities of multidrug-resistant Escherichia coli are present in the Machángara urban river in Quito, Ecuador. J. Water Health 2020, 18, 67–76. [Google Scholar] [CrossRef] [PubMed]
  48. Territorial Arrangement Planning. Secretaría de Territorio, Hábitat y Vivienda 2012–2022. Distrito Metropolitano de Quito. 2012–2022. Available online: https://www.quito.gob.ec/documents/96rticulac_cuentas/AZC/96rticulación_politicas_publicas/PLAN_ORDENAMIENTO_TERRITORIAL2012.pdf (accessed on 18 August 2020).
  49. ASTEC. Río Machángara: Historia, Nacimiento y Todo lo Que Desconoce. Ríos del Planeta. 2020. Available online: https://riosdelplaneta.com/rio-machangara/ (accessed on 18 August 2020).
  50. Borja-Serrano, P.; Ochoa-Herrera, V.; Maurice, L.; Morales, G.; Quilumbaqui, C.; Tejera, E.; Machado, A. Determination of the microbial and chemical loads in rivers from the Quito capital province of Ecuador (Pichincha)—A preliminary analysis of microbial and chemical quality of the main rivers. Int. J. Environ. Res. Public Health 2020, 17, 5048. [Google Scholar] [CrossRef] [PubMed]
  51. NTC ISO 5667-1:2010. Calidad del Agua. Muestreo. Parte 1: Directrices Para el Diseño de Programas de Muestreo. Available online: https://tienda.icontec.org/gp-calidad-del-agua-muestreo-parte-1-directrices-para-el-diseno-de-programas-y-tecnicas-de-muestreo-ntc-iso5667-1-2010.html (accessed on 18 August 2020).
  52. APHA. Standard Methods for the Examination of Water and Wastewater, 22nd ed.; Rice, E.W., Baird, R.B., Eaton, A.D., Clesceri, L.S., Eds.; American Public Health Association (APHA); American Water Works Association (AWWA); Water Environment Federation (WEF): Washington, DC, USA, 2012; Parts 2000, 3000, and 4000. [Google Scholar]
  53. U.S. EPA. Method 300.1: Determination of Inorganic Anions in Drinking Water by Ion Chromatography; Revision 1.0.; U.S. EPA: Cincinnati, OH, USA, 1997. [Google Scholar]
  54. Al-Hadithi, N.; Saad, B.; Grote, M. A solid bar microextraction method for the liquid chromatographic determination of trace diclofenac, ibuprofen, and car-bamazepine in river water. Microchim. Acta 2011, 172, 31–37. [Google Scholar]
  55. Kubitza, F. El Parámetro de Calidad del Agua a Menudo Ignorado: pH. Global Aquaculture Alliance. Jundiai/SP-España. 2017. Available online: https://www.aquaculturealliance.org/advocate/el-parametro-de-calidad-del-agua-a-menudo-ignorado-ph/ (accessed on 19 August 2020).
  56. Tulsma. Anexo 1 Del Libro VI del Texto Unificado de Legislación Secundaria del Ministerio del Ambiente: Norma de Calidad Ambiental y de Descarga de Efluentes al Recurso Agua. Norma de Calidad Ambiental y de Descarga de Efluentes: Recurso Agua. Reforma Texto Unificado Legislación Secundaria, Medio Ambiente, Libro VI, Decreto Ejecutivo 3516, Registro Oficial Suple-mento 2. Acuerdo Ministerial. 2015. Available online: https://www.ambiente.gob.ec/wp-content/uploads/downloads/2018/05/Acuerdo-097.pdf (accessed on 20 August 2020).
  57. Tulsma. Revisión del Anexo 1 del Libro VI del Texto Unificado de legislación Secundaria Del Ministerio del Ambiente: Norma de Calidad Ambiental y de Descarga de Efluentes al Recurso Agua. Revisión y Actualización de la Norma De Calidad Ambiental y de descarga de Efluentes: Recurso Agua. 2016. Available online: http://www.cip.org.ec/attachments/article/1579/PROPUESTA%20ANEXO%201.pdf (accessed on 21 August 2020).
  58. Durfor, C.N.; Becker, E. Public Water Supplies of the 100 Largest Cities in the United States, 1962 (No. 1812); US Government Printing Office: Washington, DC, USA, 1964. [Google Scholar]
  59. Hessen, D.O.; Hindar, A.; Holtan, G. The significance of nitrogen runoff for eutrophication of freshwater and marine recipients. Ambio 1997, 26, 312–320. [Google Scholar]
  60. Cabrera, E.; Hernández, L.; Gómez, H.; Cañizares, M. Determinación de nitratos y nitritos en agua: Comparación de costos entre un método de flujo continuo y un método estándar. Rev. Soc. Química México 2003, 47, 88–92. [Google Scholar]
  61. Amoako, J.; Karikari, A.Y.; Ansa-Asare, O.D.; Adu-Ofori, E. Water quality characteristics of Densu River basin in south-east Ghana. Water Sci. Technol. 2010, 61, 1467–1477. [Google Scholar] [CrossRef] [PubMed]
  62. Weber, C.E. The phosphate story. J. Food Prot. 1972, 35, 597–603. [Google Scholar]
  63. Chapman, D. Water Quality Assessment: A Guide to the Use of Biota, Sediments and Water in Environmental Monitoring, 2nd ed.; Chapman and Hall: London, UK, 1996; p. 585. [Google Scholar]
  64. Roberge, P.R. Corrosion Inspection and Monitoring; John Wiley Sons: Hoboken, NJ, USA, 2007. [Google Scholar]
  65. Alobaidi, R.A.K.; Ulucan-Altuntas, K.; Mhemid, R.K.S.; Manav-Demir, N.; Cinar, O. Biodegradation of emerging pharmaceuticals from domestic wastewater by membrane bioreactor: The effect of solid retention time. Int. J. Environ. Res. Public Health 2021, 18, 3395. [Google Scholar] [CrossRef] [PubMed]
  66. Tixier, C.; Singer, H.P.; Oellers, S.; Müller, S.R. Occurrence and fate of carbamazepine, clofibric acid, diclofenac, ibuprofen, ketoprofen, and naproxen in surface waters. Environ. Sci. Technol. 2003, 37, 1061–1068. [Google Scholar] [CrossRef]
  67. Zhou, X.F.; Dai, C.M.; Zhang, Y.L.; Surampalli, R.Y.; Zhang, T.C. A preliminary study on the occurrence and behavior of carbamazepine (CBZ) in aquatic environment of Yangtze River Delta, China. Environ. Monit. Assess. 2011, 173, 45–53. [Google Scholar] [CrossRef]
  68. Voloshenko-Rossin, A.; Gasser, G.; Cohen, K.; Gun, J.; Cumbal-Flores, L.; Parra-Morales, W.; Sarabia, F.; Ojeda, F.; Lev, O. Emerging pollutants in the Esmeraldas watershed in Ecuador: Discharge and attenuation of emerging organic pollutants along the San Pedro–Guayllabamba–Esmeraldas rivers. Environ. Sci. Process. Impacts 2015, 17, 41–53. [Google Scholar] [CrossRef] [PubMed]
  69. Martínez, A. Cuantificación de Carbamazepina en Efluentes Hospitalarios por Cromatografía de Líquidos de Alta Resolución y Determinación de la Cinética de Degradación. Master’s Thesis, Universidad Autónoma de México (UNAM), Mexico City, Mexico, 2018. [Google Scholar]
  70. Rodrigues, P.; Guimarães, L.; Carvalho, A.P.; Oliva-Teles, L. Carbamazepine, venlafaxine, tramadol, and their main metabolites: Toxicological effects on zebrafish embryos and larvae. J. Hazard. Mater. 2023, 44, 130909. [Google Scholar] [CrossRef] [PubMed]
  71. Santos, L.; Araújo, A.; Fachini, A.; Peña, A.; Delerue-Matos, C. Ecotoxicological aspects related to the presence of pharmaceuticals in the aquatic environment. J. Hazard. Mater. 2020, 175, 45–95. [Google Scholar] [CrossRef] [PubMed]
  72. Zhang, Y.; Geißen, S.U.; Gal, C. Carbamazepine and diclofenac: Removal in wastewater treatment plants and occurrence in water bodies. Chemosphere 2008, 73, 1151–1161. [Google Scholar] [CrossRef] [PubMed]
  73. Hanif, H.; Waseem, A.; Kali, S.; Qureshi, N.A.; Majid, M.; Iqbal, M.; Ur-Rehman, T.; Tahir, M.; Yousaf, S.; Zafar, M.I. Environmental risk assessment of diclofenac residues in surface waters and wastewater: A hidden global threat to aquatic ecosystem. Environ. Monit. Assess. 2020, 192, 1–12. [Google Scholar] [CrossRef] [PubMed]
  74. Sathishkumar, P.; Meena, R.A.A.; Palanisami, T.; Ashokkumar, V.; Palvannan, T.; Gu, F.L. Occurrence, interactive effects, and ecological risk of diclofenac in environmental compartments and biota-a review. Sci. Total Environ. 2020, 698, 134057. [Google Scholar] [CrossRef] [PubMed]
  75. González-González, R.B.; Sharma, P.; Singh, S.P.; Américo-Pinheiro, J.H.P.; Parra-Saldívar, R.; Bilal, M.; Iqbal, H.M. Persistence, environmental hazards, and mitigation of pharmaceutically active residual contaminants from water matrices. Sci. Total Environ. 2022, 821, 153329. [Google Scholar] [CrossRef] [PubMed]
  76. Schwaiger, J.; Ferling, H.; Mallow, U.; Wintermayr, H.; Negele, R.D. Toxic effects of the non-steroidal anti-inflammatory drug diclofenac: Part I: Histopathological alterations and bioaccumulation in rainbow trout. Aquat. Toxicol. 2004, 68, 141–150. [Google Scholar]
  77. Triebskorn, R.; Casper, H.; Heyd, A.; Eikemper, R.; Köhler, H.R.; Schwaiger, J. Toxic effects of the non-steroidal anti-inflammatory drug diclofenac: Part II. Cytological effects in liver, kidney, gills, and intestine of rainbow trout (Oncorhynchus mykiss). Aquat. Toxicol. 2004, 68, 151–166. [Google Scholar] [CrossRef]
Figure 1. (a) Location Map of Quito Metropolitan District (QMD). (b) Closeup of the sampling points in the Machángara River, QMD.
Water 16 01026 g001
Figure 2. Carbamazepine calibration curve using the Dionex Ultimate 3000 UHPLC.
Water 16 01026 g002
Figure 3. Diclofenac calibration curve using the Dionex Ultimate 3000 UHPLC.
Water 16 01026 g003
Figure 4. Carbamazepine concentrations along the Machángara River.
Water 16 01026 g004
Figure 5. Diclofenac concentrations along the Machángara River.
Water 16 01026 g005
Table 1. UTM coordinates of the sampling points in the Machángara River.
PointIdentification CodeCoordinates (UTM)Locations
North (m)East (m)
1T19,966,694.740772,071.393Wastewater Treatment Plant (WWTP) entrance
2T29,966,694.740772,071.393Wastewater Treatment Plant (WWTP) exit
3T39,971,692.545775,429.148Hospital del Sur
4T49,971,613.600775,424.500El Recreo (R. Torres)
5T59,973,317.587775,757.796Villaflora (Av. Chávez)
6T69,974,181.580776,725.057Puente Sena
7T79,976,804.729780,897.876La Tolita
8T89,978,056.787781,834.774Guápulo
9T99,978,512.478784,240.642Av. Guayasamín
10T109,979,506.740787,747.701Cumbayá
Table 2. Chemicals used for analyzing the physicochemical parameters, CBZ and DIC in water.
ParameterChemical ReagentTrademarkPurity
pHBuffer SolutionMillipore-
ConductivityConductivity standardOakton1413 µS/cm
HardnessEDTALobaChemie99.0%
Magnesium sulphateMerck99.0%
Ammonium chlorideLobaChemie99.5%
Ammonium hydroxideFisher Chemical25.0%
Eriochrome blackMerck99.0%
AnionsPowder Pillows:
NitraVer 5, NitriVer 3, SulphaVer, PhosphaVer
Hach-
Heavy
metals
Standard sol: Cu, Ni, Zn, FeInorganic ventures1000 ppm
Nitric acidFisher Chemical98.0%
Hydrochloric acidFisher Chemical37.0%
CBZ, DICCBZ and DICSigma Aldrich99.9%
Methanol HPLCScharlau99.9%
AcetonitrileMerck99.0%
Ammonium phosphatePanReac98.0%
Table 3. Physicochemical parameters analyzed in water samples from the Machángara river.
ParameterMethodEquipment
TemperatureSM 2550 BpHmeter Mettler Toledo
Hydrogen PotentialSM 4500-H+ B2pHmeter Mettler Toledo
Electric ConductivitySM 2510 BConductimeter Metrohm CH-9100
Turbidity
Hardness
TSS, TDS, TS
USEPA 180.1
2340 C
SM 2540D, SM 2540C
Portable Turbidimeter, HACH 2100Q
Titration method
Spectrophotometer, HACH DR/850
AnionsUSEPA 300.1Dionex Chromatograph, ICS 1100 RFIC
CationsSM 3500AA Perkin Elmer Analyst 800
Table 4. Standard concentrations for CBZ.
Standard Concentrations CBZ (mg/L)Peak Area
(mAU.min)
0.000.0000
0.100.1590
0.500.2768
1.000.7777
2.501.3649
5.002.8610
10.005.5248
Table 5. Standard concentrations for DIC.
Concentration Standards DIC (mg/L)Peak Area
(mAU.min)
0.000.0000
0.100.9672
0.501.4326
1.002.0489
5.0010.6521
10.0017.9854
50.0073.6901
Table 6. Operational parameters for CBZ and DIC analysis.
ParameterCBZDIC
Flow (mL/min)0.800.40
Run time (min)4.004.00
Mobile phaseAcetonitrile:Monobasic Phosphate 0.6 mM (58:42)Methanol:Water (60:40)
Wavelength (nm)288220
Injection volume (µL)2020
Table 7. (a,b) Physicochemical parameters at the Machángara river sampling points.
(a)
Sampling PointTemp
(°C)
pHTDS
(mg/L)
TSS
(mg/L)
TS
(mg/L)
Turbidity
(NTU)
Hardness
(mg/L)
T116.306.791056.5183.501240.0238.00132.00
T217.097.04912.008.00920.0011.00112.00
T316.507.17311.0059.75370.7554.00136.50
T416.107.46154.25143.00297.25139.25115.00
T516.836.83459.4860.25519.7367.50130.00
T616.846.64313.0090.50403.50101.50123.00
T717.206.96391.5057.00448.5064.25126.00
T816.856.94498.5068.50567.0078.00138.00
T918.307.39474.7530.50505.2542.50135.00
T1018.247.46383.7527.75411.50238.00127.00
(b)
Sampling PointCl
(mg/L)
NO3
(mg/L)
NO2
(mg/L)
SO42
(mg/L)
PO4P
(mg/L)
T175.9853.750.22110.005.25
T287.9727.750.0391.004.15
T361.98130.750.6934.0016.58
T450.98264.002.0260.0013.48
T545.99288.250.4747.7512.35
T659.48155.502.3050.5012.38
T749.48168.502.0251.0012.18
T846.99274.502.8151.5014.53
T946.4972.255.4239.758.58
T1044.49132.000.2734.7512.98
Table 8. Metals found in the sampling points of the Machángara River basin (mg/L).
Sampling PointsCu2+
(mg/L)
Ni2+
(mg/L)
Zn2+
(mg/L)
Fe3+
(mg/L)
T10.0720.0500.0200.096
T20.0020.0010.001ND
T30.0610.0370.0080.173
T40.0570.0360.0110.101
T50.0630.0450.0060.146
T60.0710.0410.0070.079
T70.0500.0380.0100.287
T80.0530.0340.0090.226
T90.0420.0360.0070.128
T100.0490.0350.0070.106
Table 9. Concentration of CBZ in the sampling points of the Machángara River basin.
Sampling PointSampling 1
(mg/L)
Sampling 2
(mg/L)
Sampling 3
(mg/L)
Sampling 4
(mg/L)
Average
(mg/L)
T10.05000.05000.05000.05000.0500
T2<LOD<LOD<LOD<LOD<LOD
T30.11560.11270.11680.11650.1154
T4>LOQ0.10440.10080.10100.1021
T5>LOQ0.11040.10070.10200.1043
T6>LOQ>LOQ>LOQ>LOQ>LOQ
T7>LOQ>LOQ>LOQ>LOQ>LOQ
T80.11690.12570.11680.11750.1192
T9>LOQ>LOQ0.10890.10140.1052
T100.12260.13230.10780.10560.1171
Table 10. Concentration of DIC in the sampling points of the Machángara River basin.
Sampling PointSampling 1
(mg/L)
Sampling 2
(mg/L)
Sampling 3
(mg/L)
Sampling 4
(mg/L)
Average
(mg/L)
T148.052548.052548.052548.052548.0525
T214.067814.680413.897613.516714.0406
T313.5099>LOQ7.205610.714310.4766
T4>LOQ13.06166.52018.37359.3184
T520.26055.53407.0886>LOD10.9610
T6>LOQ12.15739.898812.758011.6047
T713.1251>LOQ11.376614.190312.8973
T814.74689.5558>LOQ10.714211.6723
T9>LOQ10.669110.5013>LOQ10.5852
T10>LOQ>LOQ>LOQ>LOQ>LOQ
Disclaimer/Publisher’s Note: The statements, opinions and data contained in all publications are solely those of the individual author(s) and contributor(s) and not of MDPI and/or the editor(s). MDPI and/or the editor(s) disclaim responsibility for any injury to people or property resulting from any ideas, methods, instructions or products referred to in the content.

