Abstract
Surface water is a vital resource for human survival. However, economic and social development has resulted in significant pollutants from human activities, causing environmental pollution in watersheds. This pollution has had a profound impact on the surface water environment. However, limited studies have been conducted on the environmental risk evaluation of the watershed. In this study, we accounted for agricultural, industrial, and domestic source discharges in the districts and counties of the Harbin section of the Songhua River Basin for 2021. Data were collected from Statistical Yearbooks and governmental departments, and the characteristics of pollutant discharges in Harbin’s districts and counties were analyzed. Subsequently, we employed the Back Propagation neural network optimization method, combining remote sensing data, accounting data, pollution discharge data from each district and county, and economic and social data from the Statistical Yearbook and literature. This fusion of multiple data sources facilitated the construction of a watershed environmental risk evaluation system. The analysis considered four levels: economic and social, resource load, environmental infrastructure, and pollution discharge. Via this comprehensive evaluation, we identified the reasons for environmental risks in the water environment of the Harbin section of the Songhua River Basin. The evaluation results indicate that Nangang District, Xiangfang District, and Pingfang District face a higher risk to the water environment. Consequently, recommendations for mitigating water environment risks in these areas and across Harbin City are presented. The research methods and findings in this paper contribute valuable insights for developing control strategies to manage water quality in critically polluted areas of the Harbin section of the Songhua River Basin, providing a scientific foundation for regional river water quality management studies.
1. Introduction
In recent years, the issue of river water safety in our country has become prominent, significantly impacting people’s health and social development [1]. The sudden pollution of the water environment can have numerous negative impacts on people’s lives in a short period of time. Therefore, it is necessary to enhance the daily risk assessment of the basin environment, conduct scientific protection and planning of the basin environment, and minimize the likelihood of environmental risks in the basin from the outset [2,3]. In order to enforce the Environmental Protection Law of the People’s Republic of China, enhance ecological and environmental risk management, and provide guidance and standardization for ecological and environmental health risk assessment, the Ministry of Ecology and Environment issued the Technical Guide for Ecological and Environmental Health Risk Assessment in 2020. It is evident that watershed environmental risk assessments have become an essential foundation for environmental managers to make informed decisions and implement effective management strategies.
The development process of water environment risk evaluation has undergone three main stages: health risk evaluation, accident risk evaluation, and comprehensive risk evaluation.
1.1. Health Risk Assessment
Health risk assessment aims to evaluate the negative impacts that human beings may experience when exposed to the environment. It dates back to the 1930s and 1950s, with quantitative analysis beginning in the 1960s. The year 2020 witnessed the emergence of a new coronavirus, leading to a resurgence in the utilization of health risk assessment as a popular approach for preventing and controlling new coronaviruses. Health risk assessment is primarily manifested in soil and groundwater pollution. In soil pollution, the primary focus is to evaluate soil contamination caused by heavy metals and its impact on human health. Zhao Sheng [4] evaluated the health risk to determine the pollution risk posed by Cd, As, Cu, Pb, Cr, Zn, and Hg. Zhang [5] explored the applicability of health risk evaluation for evaluating land pollution. For groundwater pollution, Wang [6] analyzed the distribution characteristics, source allocation, and health risks of heavy metals in surface seawater during the dry and rainy seasons. Karim [7] investigated ten potentially hazardous elements in groundwater samples from the Hyderabad district in Pakistan. The study aimed to assess the natural and anthropogenic sources of these elements and their impacts on organisms and human health.
1.2. Accident Risk Evaluation
Along with economic and social development, the frequency of industrial activities is increasing, leading to various major pollution incidents. Therefore, accident risk assessment is widely used. It is commonly used in the evaluation of industrial process accident risk [8], building construction risk [9], geological disaster accident risk [10], oil leakage accident risk [11], fire accident risk [12], and so on. In the environmental field, the primary applications are in water and atmospheric environments. In the water environment, Baha [13] studied the risk assessment of water resource pollution caused by oil and hazardous materials transportation. Yang [14] assessed the risk of sudden water pollution accidents in the middle section of the south-to-north water diversion. Ni [15] evaluated the risk of leakage accidents involving Mexican chemicals during transportation. Lin [16] evaluated the risk of accidents involving acrylic acid leakage in the atmospheric environment. Si-Hyun [17] assessed the risk of methane leakage in chemical accidents.
1.3. Comprehensive Risk Evaluation
With the improvement in the risk evaluation system, scholars have found that simply considering accidents or health for risk evaluation often leads to a single consideration and fails to provide a comprehensive assessment of environmental risks. Due to the diversity and complexity of the actual environmental risks, scholars must seek a comprehensive approach to evaluating the water environment from various aspects. Ecological environmental risk assessment was born in this situation. Xing [18] introduced ecosystem service value and uncertainty into the evaluation system and constructed an ecological environment risk evaluation system in Hubei province. Yang [19] conducted an ecological risk assessment of semi-arid watersheds based on the risk response conceptual model and improved the Technique for Order Preference by Similarity to Ideal Solution (TOPSIS) model. Hou [20] evaluated the environmental risk of Phthalic Acid Esters (PAEs) in water using two risk assessment methods, Hazard Quotient (HQ) and Probabilistic Ecological Risk Assessment (PERA), based on Aquatic Life Criteria (ALCs) derived from aquatic organism reproductive toxicity data.
Existing environmental risk assessment mainly focuses on two aspects. On one hand, landscape risk assessment is based on changes in land use type and socio-economic indicators [21]. On the other hand, the land risk assessment system is built based on indicators such as soil pollution content, biodiversity, and social economy [22,23,24]. There are few studies on the environmental risk assessment of river basins. The current index systems for assessing environmental risk in river basins primarily rely on the water quality index, biodiversity index, and economic and social indices [25,26,27]. However, they fail to consider important factors such as pollution discharge and natural resources. In this paper, the pollution data calculated and the land use type data extracted by remote sensing technology are set as indicators. In addition, the government’s investment in environmental protection is included as an indicator. A watershed environmental risk assessment index system has been established that integrates economic and social resource load, environmental infrastructure, and pollution discharge. The risk assessment of the watershed environment in the Harbin section of the Songhua River Basin is conducted in a more comprehensive manner.
2. Overview of the Study Area and Data Sources
2.1. Research and Regional Overview
The Songhua River is located in the northeast of China and is one of the seven major rivers in the country [28]. In this paper, the term “Harbin” refers to the area within the boundary of Harbin City in the Songhua River basin. The main reason for selecting this basin is that the data statistics of various districts and counties in Harbin are relatively comprehensive, which facilitates the construction of an evaluation system.
Harbin, as one of the provincial capitals in Northeast China, is a vital grain base. It has a well-developed agriculture sector, particularly in the areas of planting and aquaculture [29]. Harbin is also an old industrial base with food processing, pharmaceutical, petrochemical, metallurgy, and other industries. However, the pollution discharge is also increasing, which poses a significant threat to the watershed environment of the Songhua River basin [30]. Figure 1 shows the overall map of the study area and the spatial distribution of industrial pollution sources.
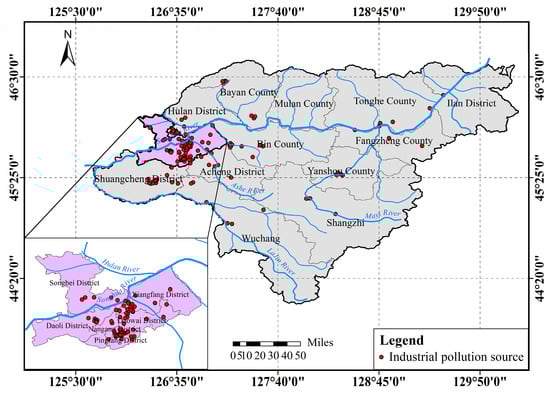
Figure 1.
Spatial distribution of industrial pollution sources in the Harbin section of Songhua River Basin.
The Songhua River serves as the primary river basin in Harbin, and the water quality of this river can, to a certain extent, indicate the level of environmental risk in the local river basin. Figure 2 presents the water quality data of the Harbin section of the Songhua River from 2005 to 2020. These data suggest that the water quality of the Songhua River has remained relatively stable during this period. The inner sections of the Ashe River estuary and the Hulan River estuary are tributaries of the Songhua River basin. They have smaller flow volumes and velocities compared to the mainstream, resulting in slower rates of water renewal. Additionally, the capacity of the water environment is limited, and the self-purification capacity of the water body is poor. After agricultural and industrial enterprises, as well as sewage treatment plants, release pollutants, the capacity for renewal, pollution absorption, and self-purification is diminished. As a result, pollutants persist at relatively high levels for an extended period of time. With the state’s focus on environmental protection, Harbin has intensified its efforts to control river pollution. Several enterprises have been closed down and rectified, resulting in a gradual improvement in the water quality of each tributary, bringing it closer to that of the mainstream.
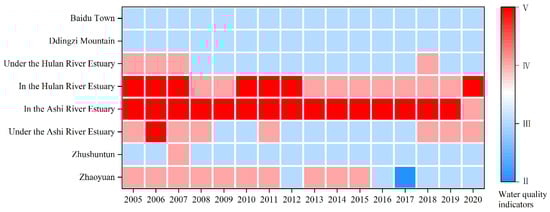
Figure 2.
Heat map of spatiotemporal changes in water quality levels of each section.
On the whole, the water quality of the Harbin section of the Songhua River has gradually improved. The water quality of the Zhushuntun section, starting from the source, has stabilized at Grade III since 2015. Additionally, the water quality of the Ash River and Hulan River has also shown significant improvement. The water quality of Ddingzishan Ferry Town is stable, and it remains at grade III overall. It shows that Harbin has made remarkable progress in environmental protection.
2.2. Data Sources
The pollution accounting data used in this paper are from the Harbin Statistical Yearbook 2022, and the data on industrial water pollution discharge are from the Harbin Industrial Enterprise Pollution Discharge, Treatment, and Utilization in 2021. The pollutant discharge coefficient used in the calculation of pollutant discharge volume was obtained from the Manual of Accounting Methods and Coefficients of Pollutant Discharge from Emission Source Statistics and Investigation. Some parameters that cannot be collected from the Statistical Yearbook can be obtained from the government websites of Harbin and Heilongjiang.
The water quality data and seven water quality indices of seven test sections from Zhaoyuan to Harbin along the Songhua River were collected from multiple monitoring stations in the Songhua River basin and the China Environmental Monitoring Station. The remote sensing data used to extract the river network are digital elevation data. The specific model is ASTER GDEM30M, and the image range is N45E124-131 and N46E124-131, totaling 16 scenes. The remote sensing data mentioned in this paper are all free data provided by the Geospatial Data Cloud https://www.gscloud.cn/ (accessed on 21 February 2023). The remote sensing data of land use type used in this paper are the LUCC secondary land use/cover change data from the Chinese Academy of Sciences (2020). The secondary index data for the basin environmental risk assessment system are sourced from the Harbin Statistical Yearbook 2022.
3. Research Methods
3.1. Pollution Source Accounting
This paper primarily focuses on the environmental risk assessment of the Songhua River Basin. It is noted that pollution discharge has the most significant influence on the basin’s environmental risk [31]. Via consulting various literature, it is known that the sources of pollution in the Harbin Basin primarily depend on three factors: industrial, agricultural, and residential pollution [32,33,34]. Agricultural pollution includes pollution generated by farming and livestock breeding. Planting pollution mainly comes from land fertilization, while breeding pollution mainly comes from the wastewater produced by livestock and poultry breeding and fishery [35]. According to the Manual of Accounting Methods and Coefficients of Emission Source Statistics and Investigation Production and Discharge, the pollution accounting for the planting industry, aquaculture industry, industrial sector, and urban and rural residents’ lifestyles in the Harbin Section will be conducted in 2021. The accounting indicators mainly include ammonia nitrogen, total nitrogen, and total phosphorus. The pollution emission characteristics of the Harbin section of the Songhua River are analyzed based on the six districts in the city, suburbs, counties, and prefecture-level cities. The results of the calculation provide a data basis for the establishment of an environmental risk assessment system for the river basin.
3.2. Environmental Risk Assessment of Watershed Empowered by Combination Based on BP Neural Network Optimization
In this paper, land use types were extracted using remote sensing technology to obtain the coverage of arable land, forest land, grassland, and water in each district and county of the Harbin section of the Songhua River Basin. Using remote sensing data as indicators, combined with pollutant discharge data of each district and county and economic and social data from the Statistical Yearbook, we constructed a multi-source data fusion evaluation index system of “remote sensing-accounting-statistics”. Four indicators are selected for the indicator system, including economic and social, resource load, environmental infrastructure, and pollution discharge. Based on the combination of Back Propagation (BP) neural network optimization and the empowerment method, the basin environmental risk evaluation system of the Harbin section of the Songhua River basin was constructed. The risk evaluation results of each district and county were obtained based on indicators of economic and social, resource load, environmental infrastructure, and pollution discharge. Then, the evaluation results of the first-level indicators were used to obtain the comprehensive evaluation results of the basin environment of the Harbin section of the Songhua River basin. Based on the evaluation results under the first-level indicators and the complete evaluation results, the study will focus on identifying the primary causes of environmental risks in the basin. It also suggests environmental planning and protection for the Songhua River basin and high-risk areas.
3.2.1. Land Use Type Data Extracted from Remote Sensing Images
Based on ENVI 5.3 and ArcMap 10.8, remote sensing images were processed to extract land use types. Via radiometric calibration, atmospheric correction, geometric correction, mosaicking, cropping, and the application of a unified coordinate system, the pre-processing of remote sensing images was completed. Subsequently, land classification was conducted for the Harbin section of the Songhua River Basin in 2021. The table below displays the specific parameters of the remote-sensing image coordinate system used in this study. Table 1 demonstrates the specific parameters of the coordinate system of the remote sensing images of this study.

Table 1.
Specific parameters of remote sensing image coordinate system.
In this study, the maximum likelihood classification method, which is a type of supervised classification method, is chosen to classify remote sensing images. This method determines the class labels by maximizing the probability function of the samples. Assuming that the number of image elements for each land use category in each band follows a normal distribution, we can calculate the likelihood that an image element belongs to a different land use category in the training set, determining the specific class of the image element according to the principle of maximum likelihood, and carrying out the same operation on all image elements to complete the classification of land use types. Extract the data to obtain the coverage of arable land, forest land, grassland, and water. The specific steps are as follows:
- (1)
- Collect training samples representing different categories, each with a set of feature values (e.g., spectral information from remote sensing images) and a known category label.
- (2)
- Assuming that the samples of each category follow a multivariate normal distribution, calculate the mean vector and covariance matrix for each category.
- (3)
- To classify the samples, calculate the probability of belonging to each category based on the known eigenvalues. Bayes’ theorem and the probability density function of the normal distribution are used in this context.
- (4)
- The category with the highest probability is selected as the classification result for the classified sample.
3.2.2. Index System Construction
The selection of indicators for constructing the evaluation system should follow the following principles: the principle of purpose, the principle of data availability, the principle of systematicity, the principle of dynamic change, and the principle of comprehensiveness [36]. Based on references, books, national documents, and expert opinions, four primary indicators and twenty secondary indicators were selected to assess the impact of various factors on the basin’s environment. The specific indicators were composed as shown in Figure 3.
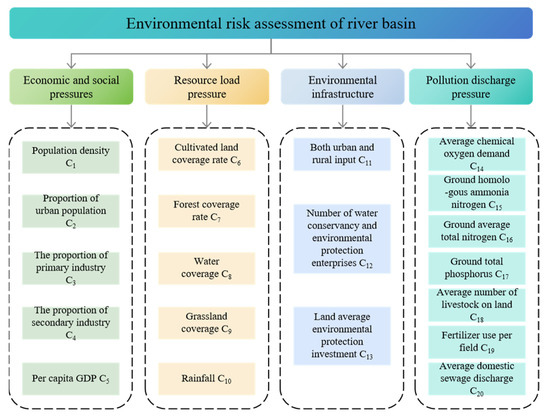
Figure 3.
Index system for environmental risk assessment in river basins.
This paper examines four indices: economic and social pressure, resource load pressure, environmental infrastructure, and pollution discharge pressure. The main reason for the impact of economic and social factors on the environment is the continuous improvement in agricultural and industrial development, which exacerbates the pollution of urban water environments [37,38]. However, compared to the pressure of resource load, economic and social development has little impact on the Harbin section of the Songhua River basin. Resource load pressure refers to the quantity and quality of natural resources that can be sustained in a specific region, as well as the stability and sustainability of the ecosystem. In the Harbin section of the Songhua River Basin, the resource-carrying capacity varies greatly among different districts and counties [39,40]. Environmental infrastructure plays a crucial role in the protection of the basin’s environment. Via the construction of environmental protection structures and the establishment of a sound municipal pipe network system, water pollution can be reduced, prevented, and treated, thereby mitigating the risk to the basin environment [41]. Pollution discharge has the most direct and significant impact on the basin environment [42,43]. In this paper, the basic pollution emission indices selected are chemical oxygen demand, ammonia nitrogen, total nitrogen, and total phosphorus.
The classification is mainly based on the following basic principles [44]: (1) Compliance with national standards: The classification of indicators should adhere to the highest standard set by national standards, and whenever possible, the classification should be based on national standards. The levels of chemical oxygen demand, ammonia nitrogen, total nitrogen, and total phosphorus in the pollution discharge meet the requirements of the “Surface Water Environmental Quality Standard”. (2) Classification of indicators within the scope: Some data do not have a clear standard. Therefore, indicators are classified based on the specific distribution range of grade indicators and the local situation. Among them, there is no clear range of index grades for forest, grassland, and water area coverage. Instead, it is graded based on the distribution of indicators.
3.2.3. BP Neural Network Optimal Combination Weighting Method
The entropy weight method is an objective weighting method that is based on the effective information contained in each evaluation index datum. The greater the amount of effective information contained, the higher the weight conferred. The advantage of the entropy weight method is that it can handle multiple attributes without requiring subjective judgment for weighting. However, it does have the issue of repeated weighting. Analytic Hierarchy Process (AHP) is a multi-attribute decision-making method. Its advantage is that it considers the relative importance of decision-making factors and allows decision-makers to make subjective judgments. However, it is highly dependent on expert experience and is subject to strong subjectivity. In this paper, the entropy weight method is utilized to extract the relevant information from the index data, and expert knowledge is incorporated to enhance the precision of weight allocation. Determining the combination coefficient of different weight calculation methods in the combination weighting method is of great significance for accurately determining the index weight. The Nash equilibrium in game theory can be used to quickly and accurately determine the final combination coefficient [45]. In this method, the weight deviation is minimized, and the matrix differential property is utilized to transform it into a linear system of optimal first derivative conditions. The combination coefficient α is calculated, and the combined weight of each index is ultimately obtained.
With the advancement of artificial intelligence, the neural network model has been incorporated into risk assessment as a multi-variable and non-linear method [46]. This method has some disadvantages, such as a high requirement for data quality and slow convergence speed. In this paper, the calculated weights are utilized as the initial weights of the neural network model. This approach facilitates faster convergence, reduces the model’s reliance on hyperparameter adjustment, and optimizes the index weights with the assistance of the neural network model’s powerful learning ability. The model is trained to minimize the sum of squared errors between the input and output of the network, using each index data as the input and output. In the training process, the model initially encodes the original index data to obtain the output result of the middle layer. It then decodes the output result of the middle layer to obtain the final model output, which is the index data. The output result of the middle layer can be considered as the linear representation of each indicator data, and the network weight can be seen as the combination coefficient of each indicator. Therefore, in this paper, the weight of the middle layer of the model is utilized as the final weight value for environmental risk assessment in order to achieve weight optimization.
4. Results
4.1. Results of Regional Pollution Accounting
4.1.1. Industrial Pollution
Harbin, as an old industrial city, has a high level of heavy industry development and a wide range of industries. It mainly includes heavy industry, processing and manufacturing industry, pharmaceutical industry, biotechnology and chemical industry, and food processing industry. It can be seen from Table 2 that Songbei District has the highest chemical oxygen demand (COD) emission in Harbin. There are numerous enterprises in the Songbei district, including a significant number of food, pharmaceutical, and chemical companies. Their emissions can have an impact on the basin’s environment. The food processing industry is the most serious pollutant emitter in Songbei District. Bayan County has the highest levels of ammonia nitrogen emissions, and the majority of enterprises in the county are involved in the food and biochemical industries. The total nitrogen emissions are highest in the cottage area, with an annual emission of 36.28 tons. The main industries in the cottage area include food, metal manufacturing, and food processing. The food processing industry has the highest total nitrogen production. Bayan County has the highest total phosphorus emission, and the industry with the highest emission is the food processing industry.
Table 2.
Emissions of industrial pollutants by district and county in Harbin.
4.1.2. Agricultural Pollution
Heilongjiang Province is the most significant grain production and breeding base in China. Agricultural pollution is one of the primary contributors to the pollution of the Songhua River, primarily due to two reasons: pollution caused by agricultural inputs like fertilizers and pesticides, as well as improper crop cultivation and farming practices; pollution caused by aquaculture wastewater and waste.
- (1)
- Planting pollution
Planting pollution is a common form of non-point source pollution. The primary cause is the excessive use of chemical fertilizers, which results in the release of nitrogen, phosphorus, and other nutrients. When these substances enter the water, they cause water eutrophication. The concentration of pollutants from agricultural activities in surface water primarily depends on the size of the cultivated land area in the county. As a well-known rice planting area in China, Wuchang City has the largest cultivated land area in Harbin City. Its dense river network has not only improved the agricultural development of Wuchang City but also brought about a significant amount of non-point source pollution.
- (2)
- Pollution of livestock and poultry farming
According to the accounting data, the production amount of various types of pollution can be observed: COD > TN > NH3N > TP. Beef cattle farmers are the main contributors to COD production, with Bin County having the highest number of beef cattle in the district and county. The city’s annual COD production exceeds 20,000 tons. The highest contributor to ammonia nitrogen production and waste is pig breeding, with Bin County having the highest stock. It produces 200.2 tons of ammonia nitrogen every year. The highest contribution rate of total nitrogen comes from beef cattle breeding. The total nitrogen produced by beef cattle in the city is 3751.3 tons per year, while in Bin County, it is 883.9 tons per year. The highest contributor to the total phosphorus output is beef cattle. In the city, beef cattle contribute 326.7 tons of phosphorus per year, while in Bin County, they contribute 125.6 tons. Bin County, being a significant breeding county in the city, has a large population of live pigs and beef cattle, resulting in the highest concentration of breeding pollutants.
4.1.3. Domestic Pollution
Domestic sewage mainly refers to the wastewater discharged from residential areas. Domestic sewage contains a large amount of organic matter, nitrogen, phosphorus, and other nutrients, as well as heavy metals, antibiotics, and microorganisms, among other substances. If discharged into the water without treatment, nutrients can lead to an outbreak of algae in the water. Heavy metals and drugs can accumulate and become toxic, posing a threat to the environment and human health in the basin.
Urban domestic sewage mainly comes from household sources, including laundry wastewater, bathwater, toilet waste, and kitchen wastewater. In addition to household sewage, urban sewage also includes waste from the accommodation industry, catering industry, service industry, hospitals, and other sectors. In recent years, Harbin City has increasingly focused on the environmental safety of the basin. In the decade from 2011 to 2021, a new sewage plant was built, and the sewage treatment process was improved, resulting in increased sewage treatment capacity and treatment efficiency. The proportion of domestic sewage treatment has increased from 81.7% to 95.5% today, and the effluent quality of sewage treatment plants now meets the national first-class A discharge standard.
4.2. Watershed Environmental Risk Assessment Based on BP Neural Network Optimization and Combination Empowerment
4.2.1. Comparative Analysis of Indicators before and after Optimization
The initial weight of the combination is calculated using the combination weighting method in Section 3.2.3. The calculated combined weights are then used as the initial weights for the input layer of the neural network. The neural network model is then trained and used for prediction. Finally, the optimized weights have been obtained, as shown in Table 3. The comparison of weight changes for each secondary index before and after optimization is shown in Figure 4.
Table 3.
Table of weights for each indicator.
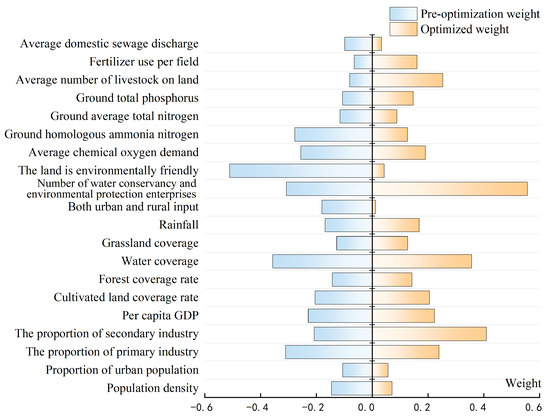
Figure 4.
Comparison of weights before and after optimization.
After optimization, the weight of the pollutant discharge pressure index increased by 17%, while the weight of the economic and social index increased by 33%. Pollution discharge is directly related to the quantity of pollutants entering the water environment, which has the most significant impact on water pollution. In particular, chemical oxygen demand, ammonia nitrogen, total nitrogen, and total phosphorus are important indicators for monitoring surface water. Socio-economic indicators reflect the state of local industry, agriculture, and living standards. These two types of indicators have a significant impact on environmental risks. Therefore, increasing their weight can better reflect the level of local environmental risks.
In the secondary index of economy and social pressure, the weight of the secondary industry increased by 96.45% after optimizing the BP neural network. Compared to the primary industry, the secondary industry produces a wider range of pollutants and emits larger quantities of pollutants, and these pollutants are more harmful to the environment. Therefore, the secondary industry has a greater impact on environmental risks. In terms of resource-carrying capacity, the weight of water coverage before and after optimization is relatively high. This is mainly due to the large water area, high flow rate, and large water environment capacity. These factors effectively contribute to the dilution and degradation of pollutants in the water. The weight of each index did not change before and after optimization. This is mainly because the weight setting of each index before optimization was already reasonable and aligned with the actual situation. Thus, no optimization was necessary. In terms of environmental infrastructure, the number of water conservancy environmental protection enterprises increased by 80.89% after optimization. This increase is mainly due to the fact that a higher number of environmental protection enterprises can more effectively remove environmental pollutants in different regions, thereby reducing the damage caused by these pollutants to the environment. Consequently, this has a significant positive impact on reducing environmental risks. In terms of pollutant discharge, the average livestock weight, fertilizer use, and total phosphorus increased by 215.26%, 148.83%, and 38.31%, respectively. Excessive concentrations of nitrogen and phosphorus in natural water can lead to eutrophication. However, removing total phosphorus in natural water bodies is more challenging and has a greater impact on the environment. Therefore, the weight value of total phosphorus is increased. At the same time, livestock manure and fertilizers are the primary pollutants generated by agriculture. These pollutants effectively demonstrate the environmental risks associated with the primary industry. They also help compensate for the impact caused by the decrease in the weight proportion of the primary industry index.
Via the above analysis, it can be concluded that the weight value of each indicator, optimized by the BP neural network, can better reflect the contribution of these indicators to the level of environmental risk. This allows the environmental risk assessment results to more accurately reflect the level of local environmental risk.
Based on the classification of surface water levels, this paper divides the water environmental risk assessment levels into five levels: I (lower), II (low), III (medium), IV (high), and V (higher). The indicators selected above are classified according to the classification principle above. The specific classification is shown in Table 4.
Table 4.
Classification table.
4.2.2. Watershed Environmental Risk Assessment under First-Level Indicators
This paper evaluates the environmental risk of the basin under the first level index, and the risk level is depicted in Figure 5.
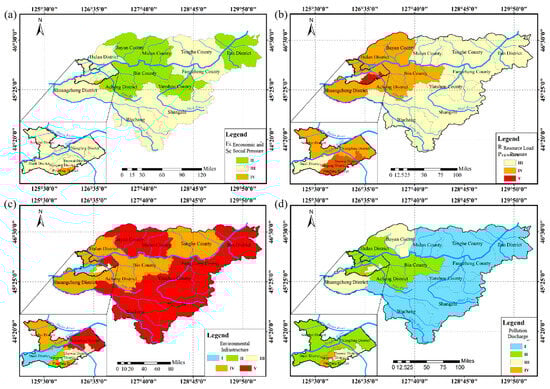
Figure 5.
(a) Watershed environmental risk assessment with economic and social pressure; (b) watershed environmental risk assessment with resource load pressure; (c) watershed environmental risk assessment with environmental infrastructure; (d) watershed environmental risk assessment with pollution discharge pressure.
- (1)
- Economic and social indicators watershed environmental risk assessment
As seen from Figure 5a, the impact of economic and social pressure on the Harbin section of the Songhua River Basin is relatively small compared to the effects of resource loading. Regarding economic and social indicators, the environmental risk assessment levels of all districts and counties are similar, primarily at Level III, accounting for 61%. The impact of the social economy on the environmental risk of a watershed is primarily observed via population activities and economic development. Population activities will generate significant domestic sewage, and economic development necessitates the growth of agriculture, industry, the service sector, and other sectors. Agriculture, industry, and service sectors generate pollution during their operations and development. The district with the highest population density is Nangang District, which has a population density of 6320 people per square kilometer. The city with the highest proportion of urban population is Nangang District, where the urban population accounts for 95.78%. The district with the highest proportion of secondary industry is Cottage District, which accounts for 68.91% of the total. The types of environmental pollutants produced by the industry are complex, and the emissions are significant. The Cottage District has the highest environmental risk value, resulting in an evaluation grade of IV.
- (2)
- Resource load index environmental risk assessment of river basin
From Figure 5b, it can be concluded that the resource load pressure varies significantly among different districts and counties. Fangzheng County, Ilan County, Mulan District, and Tonghe County, which are situated near the main course of the Songhua River, possess abundant resources. The risk to the water environment, as indicated by the resource load index, is low, resulting in a typical evaluation value and a grade of III. Regarding resource load pressure, the basin exhibits the lowest environmental risk, robust ecological stability, and a strong ability for self-purification. This enables it to effectively mitigate the release of pollutants into the environment. The primary factor contributing to the low value of Fangzheng County is its high forest coverage rate, which stands at 65.08%. The coverage rate of grassland and water areas is very high. The grassland coverage rate meets the Level IV standard as determined by experts, while the water area coverage rate meets the Level I standard. The coverage rates of cultivated land, forests, water, and grassland in Ilan County are high. The grassland area falls within the category of the III standard, which meets the requirements of the I and II standards. The reason for the low appraisal value of Mulan District is the high coverage rate of forest land and cultivated land. The coverage rate of cultivated land, forest land, and grassland is higher in Tonghe County, resulting in a lower environmental risk value.
- (3)
- Environmental infrastructure indicators watershed environmental risk assessment
Figure 5c shows that environmental infrastructure weakens and controls pollution throughout the process and ends by establishing environmental protection structures and constructing municipal pipeline systems. It has played a role in reducing water environmental risks. Overall, the environmental protection infrastructure in Harbin City is relatively weak, particularly in various districts and counties, with 44.44% of them classified as risk Level V. Yanshou County has the highest risk level, primarily due to the elevated risk levels of three indicators: per capita urban-rural investment, number of water conservancy and environmental protection enterprises, and per capita environmental protection investment in Yanshou County. The proportion of risk level IV in each district and county is 38.9%. Most counties with a risk level of IV are located along the main course of the Songhua River. It mainly depends on the local government’s awareness of protecting the water environment of the Songhua River and increasing investment in environmental protection infrastructure. However, there still needs to be a significant disparity in the overall level compared to the urban area.
- (4)
- Pollution discharge index environmental risk assessment of river basin
As shown in Figure 5d, pollution discharge has the most direct impact on the water environment and the most significant degree of influence. The pollution discharge index indicates a considerable variation in the risk level of sewage pollution across the entire city. Nangang District is the most severely affected by pollution emissions, with an evaluation grade of Ⅳ. The district has a high demand for chemicals, ammonia nitrogen, total nitrogen, and average sewage discharge. The large discharge of various pollutants is mainly due to the high level of urbanization, high population density, and significant pollution production from domestic sources. The water environment risk level of Bayan County, Shuangcheng District, and Xiangfang District is IV. The average ground chemical oxygen demand and ground ammonia nitrogen levels in Xiangfang District are 9.84 and 0.83, respectively, indicating a relatively high pollutant content. The average number of livestock in Shuangcheng District and Bayan County is high, meaning the breeding industry heavily pollutes the area. The overall trend of groundwater environmental risk assessment in the study area is that Nangang District has the highest grade for water environmental risk assessment. The farther the other districts are from the city center, the lower the water environmental risk assessment grade is.
5. Discussion
Figure 6a displays the results of the environmental risk evaluation for each district before optimization, while Figure 6b presents the results of the environmental risk evaluation for each district after optimization. From the figure, it can be seen that the risk evaluation grade of the districts before optimization is lower than the risk evaluation grade of the districts after optimization. Among them, there is only one district with a grade of 4 before optimization. After optimization, three districts now have a grade of 4, including Nangang, Xiangfang, and Pingfang districts. The analysis above indicates that the three mentioned districts are characterized by a high level of urbanization. These areas have a significant amount of domestic sewage and a low amount of green spaces, which limits their capacity to reduce pollution and increases their environmental risk. Hence, classifying the three into four grades after optimization aligns with the actual situation. In contrast, the results of the environmental risk evaluation prior to optimization could have been more optimistic, and they deviated from the expected outcome.
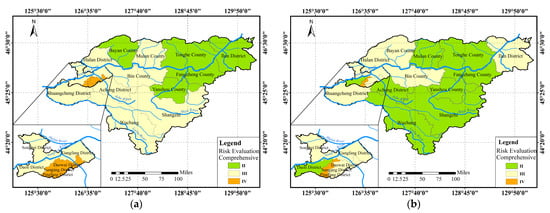
Figure 6.
(a) Comprehensive risk assessment of watershed environment before optimization; (b) comprehensive risk assessment of watershed environment after optimization.
Based on the results of the optimized environmental risk evaluation, the following conclusions can be drawn. Nangang District, Xiangfang District, and Pingfang District received the lowest environmental risk assessment grade of IV. Nangang District has the highest environmental risk assessment value and poses the greatest risk. The main reason is that Nangang District has a high population density, a high level of urbanization, and a large volume of urban domestic sewage. The average discharge of chemical oxygen demand, ammonia nitrogen, total nitrogen, and total phosphorus in Nangang District is the highest among all districts and counties. Although Nangang District has a high population density, it boasts a well-developed industrial structure. To mitigate the environmental risks in this area, the main focus is on reducing the environmental impact, as well as improving the treatment rate and efficiency of domestic sewage in the region. Increase the amount of green space in Nangang District to protect the water source and improve the stability of the water area via ecological water replenishment.
Xiangfang District is characterized by a high level of environmental risk in the basin. From a socio-economic perspective, Xiangfang district has a high population density and a large per capita GDP, which significantly impacts the environmental risk in the basin. In terms of resource-carrying capacity, the ratio of forest coverage to water coverage in Xiangfang District is very low, and its ability to reduce pollutants is poor. In terms of pollution discharge, Xiangfang District has high average levels of COD, livestock, and sewage discharge. This is primarily due to the successful development of the aquaculture industry in the district. In a relatively small land area, the high livestock population exerts a significant burden on the ecological environment. In addition, the average amount of fertilizer applied in the Xiangfang area is higher, and the basin’s environment is also seriously polluted by non-point sources of agricultural pollution. In response to the aforementioned issues, the primary solution is to increase the prevalence of large-scale breeding. Additionally, efforts should be made to enhance the utilization rate of livestock and poultry manure. Farmers should be mandated to properly manage livestock and poultry sewage and, if feasible, establish their own sewage treatment systems. In cases where contracting sewage treatment plants is not possible, alternative treatment options should be explored.
There are three reasons for the higher environmental risk level of the Pingfang basin. The first reason is the high population density, which leads to a significant amount of urban pollution. The second reason is the low coverage rate of cultivated land, forest land, grassland, and water areas, as well as the limited ability to reduce pollution. The third reason is that there is a large average number of livestock, resulting in a significant amount of pollution from livestock and poultry farming. Although the discharge of industrial enterprises in the Pingfang district has been largely controlled, the presence of a large enterprise base still poses risks to the water environment.
6. Planning and Suggestions
Via the optimization of a BP neural network and the fusion of multi-source data, an empowerment method is used to conduct a risk assessment of the water environment in the Harbin section of the Songhua River Basin. According to the analysis results of the evaluation, the following suggestions are proposed for the future protection of the water environment in the Songhua River basin:
- (1)
- Economic and social aspects: The goal is to optimize the industrial pattern and increase the proportion of tertiary industry. Accelerate the transformation and development of traditional industries, promoting their transition toward being low-carbon, low-emission, intelligent, high-end, and service-oriented. Strengthen the introduction and training of talent, particularly for high-level professionals in the tertiary industry, and attract individuals with competitive salaries.
- (2)
- Protecting important natural resources, such as cultivated land, forest land, grassland, and water areas. In terms of cultivated land, it is important to protect the original cultivated land and prevent excessive expansion of rural and urban areas. For forested areas, local forestry bureaus should enhance tree protection efforts and increase public awareness and education on forest conservation. In terms of grassland protection, the hardening of non-essential areas should be minimized, and efforts should be made to enhance the preservation of existing grasslands. In terms of water resources, we need to enhance the supervision of water bodies, conduct thorough investigations into individuals and enterprises involved in illegal discharge, and prevent the depletion of water resources. Ecological water replenishment can be adopted to maintain biodiversity, enhance the stability of the water ecosystem, and promote the health of the water ecosystem.
- (3)
- In terms of environmental infrastructure, there should be an increase in investment in various districts and counties. This includes increasing the number of environmental protection enterprises, such as sewage treatment plants, and using funds to invest in updating technology. These measures will help improve the pollution treatment capacity of environmental protection enterprises. C
- (4)
- In terms of pollution discharge, efforts should be made to enhance the sewage treatment capacity and aim for a treatment rate of close to 100% for urban domestic sewage. To enhance the management of rural domestic sewage, it is crucial to improve the proportion of sewage treatment in rural areas. This can be achieved by constructing drainage systems in densely populated villages and implementing unified treatment measures for rural domestic sewage. These efforts will effectively reduce the amount of sewage discharged into the environment. Upgrade the treatment process of the sewage treatment plant to enhance the efficiency of pollutant removal. In agriculture, it is important to practice scientific planting, avoid excessive application of chemical fertilizers, and reduce non-point source pollution of water bodies. Regulating the aquaculture industry, increasing the proportion of large-scale farming, and establishing standards for aquaculture wastewater discharge.
Author Contributions
Conceptualization, S.C. and L.G.; methodology, Y.Z.; software, Z.S.; validation, J.T. and Y.L.; formal analysis, Z.T.; investigation, H.S.; resources, Y.Z.; data curation, Y.Z.; writing—original draft preparation, H.S.; writing—review and editing, Y.Z. and L.G.; visualization, H.S.; supervision, Y.Z. and L.G.; project administration, L.G. and S.C.; funding acquisition, Y.Z. All authors have read and agreed to the published version of the manuscript.
Funding
This research was supported by the Open Research Fund of State Environmental Protection Key Laboratory of Drinking Water Source Protection, Chinese Research Academy of Environmental Sciences (2022YYSYKFYB09), and the Fundamental Research Funds for the Central Public-interest Scientific Institution (2022YSKY-01).
Data Availability Statement
The datasets generated during and/or analyzed during the current study are available from the corresponding author upon reasonable request.
Conflicts of Interest
The authors declare no conflict of interest.
References
- Xi, H.; Li, T.; Yuan, Y.; Chen, Q.; Wen, Z. River Ecosystem Health Assessment Based on Fuzzy Logic and Harmony Degree Evaluation in a Human-Dominated River Basin. Ecosyst. Health Sustain. 2023, 9, 0041. [Google Scholar] [CrossRef]
- Liu, J.; Liu, R.; Zhang, Z.; Zhang, H.; Cai, Y.; Yang, Z.; Kuikka, S. Copula-based exposure risk dynamic simulation of dual heavy metal mixed pollution accidents at the watershed scale. J. Environ. Manag. 2021, 277, 111481. [Google Scholar] [CrossRef]
- Li, Q.; Yu, Y.; Jiang, X.; Guan, Y. Multifactor-based environmental risk assessment for sustainable land-use planning in Shenzhen, China. Sci. Total Environ. 2019, 657, 1051–1063. [Google Scholar] [CrossRef] [PubMed]
- Zhao, S.; OYang, K.; Luo, X.; Wang, Z.; Wen, X.; Li, Y.; Luo, L. Characterization of heavy metal contamination in soil and crops around Gaoyan landfill in Guiyang city and evaluation of health risk. Shandong Agric. Sci. 2023, 55, 92–99. [Google Scholar] [CrossRef]
- Zhang, S.; Han, Y.; Peng, J.; Chen, Y.; Zhan, L.; Li, J. Human health risk assessment for contaminated sites: A retrospective review. Environ. Int. 2023, 171, 107700. [Google Scholar] [CrossRef] [PubMed]
- Wang, J.; Zheng, Y.; Li, Y.; Wang, Y. Potential risks, source apportionment, and health risk assessment of dissolved heavy metals in Zhoushan fishing ground, China. Mar. Pollut. Bull. 2023, 189, 114751. [Google Scholar] [CrossRef] [PubMed]
- Bux, R.K.; Haider, S.I.; Mallah, A.; Shah, Z.-u.-H.; Solangi, A.R.; Moradi, O.; Karimi-Maleh, H. Spatial analysis and human health risk assessment of elements in ground water of District Hyderabad, Pakistan using ArcGIS and multivariate statistical analysis. Environ. Res. 2022, 2010, 112915. [Google Scholar] [CrossRef]
- He, Z.; Chen, C.; Weng, W. Multi-hazard risk assessment in process industries: State-of-the-Art. J. Loss Prev. Process Ind. 2022, 76, 104672. [Google Scholar] [CrossRef]
- Shen, Y.; Xu, M.; Lin, Y.; Cui, C.; Shi, X.; Liu, Y. Safety Risk Management of Prefabricated Building Construction Based on Ontology Technology in the BIM Environment. Buildings 2022, 12, 765. [Google Scholar] [CrossRef]
- Qi, Q.; Yan, B.; Liu, W.; Zhang, B.; Liu, J. Study on the Mechanism and Chain Generation Relationship of Geological Disaster Secondary Coal Mine Accidents. Sustainability 2022, 14, 15425. [Google Scholar] [CrossRef]
- Zhou, Q. Environmental Risk Assessment of the Zhengrunzhou Water Source under the Influence of Oil Spill Accidents at the Wharf Group. Sustainability 2022, 14, 7686. [Google Scholar] [CrossRef]
- Wang, L.; Li, W.; Feng, W.; Yang, R. Fire risk assessment for building operation and maintenance based on BIM technology. Build. Environ. 2021, 205, 108188. [Google Scholar] [CrossRef]
- Ebrahimi, B.; Ahmadi, S.; Chapi, K.; Amjadi, H. Risk assessment of water resources pollution from transporting of oil hazardous materials (Sanandaj-Marivan road, Kurdistan Province, Iran). Environ. Sci. Pollut. Res. 2020, 27, 35814–35827. [Google Scholar] [CrossRef] [PubMed]
- Yang, Y.; Lei, X.; Long, Y.; Tian, Y.; Zhang, Y.; Yao, Y.; Hou, X.; Shi, M.; Wang, P.; Zhang, C.; et al. A novel comprehensive risk assessment method for sudden water accidents in the Middle Route of the South-North Water Transfer Project (China). Sci. Total Environ. 2020, 698, 134167. [Google Scholar] [CrossRef] [PubMed]
- Ni, J.; Tokgoz, B.E.; Gao, F.; Li, Y. Practical risk assessment tool for the frequently transported chemicals at the Gulf of Mexico ports. Int. J. Crit. Infrastruct. 2020, 16, 293–309. [Google Scholar] [CrossRef]
- Lim, H.-B.; Park, S.-H.; Hong, H.-J.; Jeong, J.-Y.; Kim, H.-S.; Lee, C.-M. Acute and chronic health risk assessment for inhalation and ingestion exposure in acrylic acid leak accidents. Environ. Sci. Pollut. Res. 2022, 29, 26648–26659. [Google Scholar] [CrossRef] [PubMed]
- Park, S.-H.; Lim, H.-B.; Hong, H.-J.; Kim, H.-S.; Yoon, D.-K.; Lee, H.-W.; Kong, H.-K.; Jeon, J.-I.; Choi, J.-W.; Cho, E.-M.; et al. Health risk assessment for multimedia exposure of formaldehyde emitted by chemical accident. Environ. Sci. Pollut. Res. 2021, 28, 9712–9722. [Google Scholar] [CrossRef]
- Xing, L.; Hu, M.; Wang, Y. Integrating ecosystem services value and uncertainty into regional ecological risk assessment: A case study of Hubei Province, Central China. Sci. Total Environ. 2020, 740, 140126. [Google Scholar] [CrossRef]
- Yang, T.; Zhang, Q.; Wan, X.; Li, X.; Wang, Y.; Wang, W. Comprehensive ecological risk assessment for semi-arid basin based on conceptual model of risk response and improved TOPSIS model-a case study of Wei River Basin, China. Sci. Total Environ. 2020, 719, 137502. [Google Scholar] [CrossRef]
- Hou, Y.; Tu, M.; Li, C.; Liu, X.; Wang, J.; Wei, C.; Zheng, X.; Wu, Y. Risk Assessment of Phthalate Esters in Baiyangdian Lake and Typical Rivers in China. Toxics 2023, 11, 180. [Google Scholar] [CrossRef]
- Kato, S.; Huang, W. Land use management recommendations for reducing the risk of downstream flooding based on a land use change analysis and the concept of ecosystem-based disaster risk reduction. J. Environ. Manag. 2021, 287, 112341. [Google Scholar] [CrossRef] [PubMed]
- Meng, Y.; Zhang, J.; Fiedler, H.; Liu, W.; Pan, T.; Cao, Z.; Zhang, T. Influence of land use type and urbanization level on the distribution of pharmaceuticals and personal care products and risk assessment in Beiyun River, China. Chemosphere 2022, 287, 132075. [Google Scholar] [CrossRef] [PubMed]
- Chen, C.; Zhang, X.; Chen, J.; Chen, F.; Li, J.; Chen, Y.; Hou, H.; Shi, F. Assessment of site contaminated soil remediation based on an input output life cycle assessment. J. Clean. Prod. 2020, 263, 121422. [Google Scholar] [CrossRef]
- Jin, X.; Jin, Y.; Mao, X. Ecological risk assessment of cities on the Tibetan Plateau based on land use/land cover changes—Case study of Delingha City. Ecol. Indic. 2019, 101, 185–191. [Google Scholar] [CrossRef]
- Huang, D.; Jia, B.; Xie, H.; Zheng, W.; Feng, L.; Bing, Y.; Guo, Q. Ecological infrastructure planning of large river basin to promote nature conservation and ecosystem functions. Chin. J. Environ. Eng. 2021, 15, 2868–2873. [Google Scholar] [CrossRef] [PubMed]
- Li, R.; Zhu, L.; Wang, Y.; Zhu, Y.-G. Metagenomic insights into environmental risk of field microplastics in an urban river. Water Res. 2022, 223, 119018. [Google Scholar] [CrossRef] [PubMed]
- Mazzorana, B.; Picco, L.; Rainato, R.; Iroume, A.; Ruiz-Villanueva, V.; Rojas, C.; Valdebenito, G.; Iribarren-Anacona, P.; Melnick, D. Cascading processes in a changing environment: Disturbances on fluvial ecosystems in Chile and implications for hazard and risk management. Sci. Total Environ. 2019, 655, 1089–1103. [Google Scholar] [CrossRef] [PubMed]
- Gai, Z.; Chen, X.; Du, G.; Wang, H. Analysis on ecological environment effect and driving factors of Sansheng spatial evolution in Songhua River basin in Harbin. J. Soil Water Conserv. 2022, 36, 116–123. [Google Scholar] [CrossRef]
- Che, L.; Liu, S.; Han, J.; Qi, S.; Yu, Y. Spatial distribution and source analysis of heavy metal pollution in snowmelt runoff in Harbin City. J. Environ. Sci. 2019, 39, 1572–1580. [Google Scholar] [CrossRef]
- Sun, H.; Zhang, Z. Changes and driving forces of landscape pattern vulnerability in Songhua River Basin, Jilin Province. Arid Zone Res. 2019, 36, 1005–1014. [Google Scholar] [CrossRef]
- Haghnazar, H.; Johannesson, K.H.; Gonzalez-Pinzon, R.; Pourakbar, M.; Aghayani, E.; Rajabi, A.; Hashemi, A.A. Groundwater geochemistry, quality, and pollution of the largest lake basin in the Middle East: Comparison of PMF and PCA-MLR receptor models and application of the source-oriented HHRA approach. Chemosphere 2022, 288, 132489. [Google Scholar] [CrossRef] [PubMed]
- Yang, S.; Wang, X.; Wang, W.; Hu, X.; Gao, L.; Sun, X. Distribution and Ecological Risk Assessment of Antibiotics in the Songhua River Basin of the Harbin Section and Ashe River. Environ. Sci. 2021, 42, 136–146. [Google Scholar] [CrossRef]
- Wang, W.; Zhang, W.; Liang, H.; Gao, D. Seasonal distribution characteristics and health risk assessment of typical antibiotics in the Harbin section of the Songhua River basin. Environ. Technol. 2019, 40, 2726–2737. [Google Scholar] [CrossRef] [PubMed]
- Krainyk, A.; Ballard, B.M.; Brasher, M.G.; Wilson, B.C.; Parr, M.W.; Edwards, C.K. Decision support tool: Mottled duck habitat management and conservation in the Western Gulf Coast. J. Environ. Manag. 2019, 230, 43–52. [Google Scholar] [CrossRef]
- Xu, H.; Gao, Q.; Yuan, B. Analysis and identification of pollution sources of comprehensive river water quality: Evidence from two river basins in China. Ecol. Indic. 2022, 135, 108561. [Google Scholar] [CrossRef]
- Yang, J.; Liu, Y.; Tan, X.; Xu, C.; Lin, A. Safety assessment of drinking water sources along Yangtze River using vulnerability and risk analysis. Environ. Sci. Pollut. Res. 2022, 29, 27294–27310. [Google Scholar] [CrossRef]
- Ye, K.; Meng, F.; Zhang, L.; Yao, Z.; Xue, H.; Cheng, P.; Zhang, D. Water quality evaluation of Heilongjiang section of Songhua River Basin based on principal component analysis Water Supply and Drainage in China. Environ. Sci. Res. 2020, 33, 901–910. [Google Scholar] [CrossRef]
- Xing, J.; Song, N.; Chen, W.; Ni, H.; Han, X. Water quality evaluation of Heilongjiang section of Songhua River Basin based on principal component analysis Water Supply and Drainage in China. China Water Wastewater 2021, 37, 89–94. [Google Scholar] [CrossRef]
- Wang, D.; Wang, Y.; Zhou, R.; Cao, Y.; Jiang, F.; Zhang, X.; Li, J. Water plant optimization control system based on machine learning. Desalination Water Treat. 2021, 222, 168–181. [Google Scholar] [CrossRef]
- Fu, J.; Zang, C.; Zhang, J. Economic and resource and environmental carrying capacity trade-off analysis in the Haihe River basin in China. J. Clean. Prod. 2020, 270, 122271. [Google Scholar] [CrossRef]
- Huang, L.; Wang, J.; Chen, X. Ecological infrastructure planning of large river basin to promote nature conservation and ecosystem functions. J. Environ. Manag. 2022, 306, 114482. [Google Scholar] [CrossRef] [PubMed]
- Heidari, M.; Darijani, T.; Alipour, V. Heavy metal pollution of road dust in a city and its highly polluted suburb; quantitative source apportionment and source-specific ecological and health risk assessment. Chemosphere 2021, 273, 129656. [Google Scholar] [CrossRef] [PubMed]
- Cui, Y.; Bai, L.; Li, C.; He, Z.; Liu, X. Assessment of heavy metal contamination levels and health risks in environmental media in the northeast region. Sustain. Cities Soc. 2022, 80, 103796. [Google Scholar] [CrossRef]
- Tong, H.; Gao, T.; Gao, Z.; Liu, J.; Peng, W.; Li, C. Groundwater chemical characteristics and water quality evaluation in Yihe River Basin. Environ. Chem. 2021, 40, 3443–3454. [Google Scholar]
- Liu, Y.; Hu, Y.; Hu, Y.; Gao, Y.; Liu, Z. Water quality characteristics and assessment of Yongding New River by improved comprehensive water quality identification index based on game theory. J. Environ. Sci. 2021, 104, 40–52. [Google Scholar] [CrossRef]
- Shi, E.; Shang, Y.; Li, Y.; Zhang, M. A cumulative-risk assessment method based on an artificial neural network model for the water environment. Environ. Sci. Pollut. Res. 2021, 28, 46176–46185. [Google Scholar] [CrossRef]
Disclaimer/Publisher’s Note: The statements, opinions and data contained in all publications are solely those of the individual author(s) and contributor(s) and not of MDPI and/or the editor(s). MDPI and/or the editor(s) disclaim responsibility for any injury to people or property resulting from any ideas, methods, instructions or products referred to in the content. |
© 2023 by the authors. Licensee MDPI, Basel, Switzerland. This article is an open access article distributed under the terms and conditions of the Creative Commons Attribution (CC BY) license (https://creativecommons.org/licenses/by/4.0/).