Article

Modeling of a Jet Pipe Servovalve Considering Nonlinear Flow Forces Acting on the Spool

1
School of Mechanical Engineering, Yanshan University, Qinhuangdao 066004, China
2
School of Naval Architecture and Ocean Engineering, Jiangsu Maritime Institute, Nanjing 211199, China
*
Author to whom correspondence should be addressed.
Water 2024, 16(5), 683; https://doi.org/10.3390/w16050683
Submission received: 30 January 2024 / Revised: 18 February 2024 / Accepted: 23 February 2024 / Published: 26 February 2024
(This article belongs to the Special Issue Hydraulics and Hydrodynamics in Fluid Machinery)

Abstract

:
The design and analysis of jet pipe servovalves are mostly based on linear models. However, there are some nonlinear factors in this kind of electromechanical–hydraulic structure. The article deduces a linear rotation equation for the armature assembly and a linear flow equation for the control cavity. With the consideration of nonlinear hydraulic reaction forces in the second stage, the nonlinear dynamic equation of the main spool in an ideal jet pipe servovalve is derived. Based on the MATLAB (R2016a) software, the nonlinear model of a certain type of jet pipe servovalve is numerically investigated. The equilibrium points of the nonlinear system are calculated, the phase portraits are plotted, and the Hopf bifurcations caused by the flow-pressure coefficient as the control parameter and the period-doubling bifurcations caused by the variation of the input signal are analyzed. The vibration frequency of the time-domain response of the fifth-order system with a cosine signal as input is 242 Hz, which is similar to the experimental value of 233 Hz. The relative error between the two is 3.9%, verifying the validity of the nonlinear system model.

1. Introduction

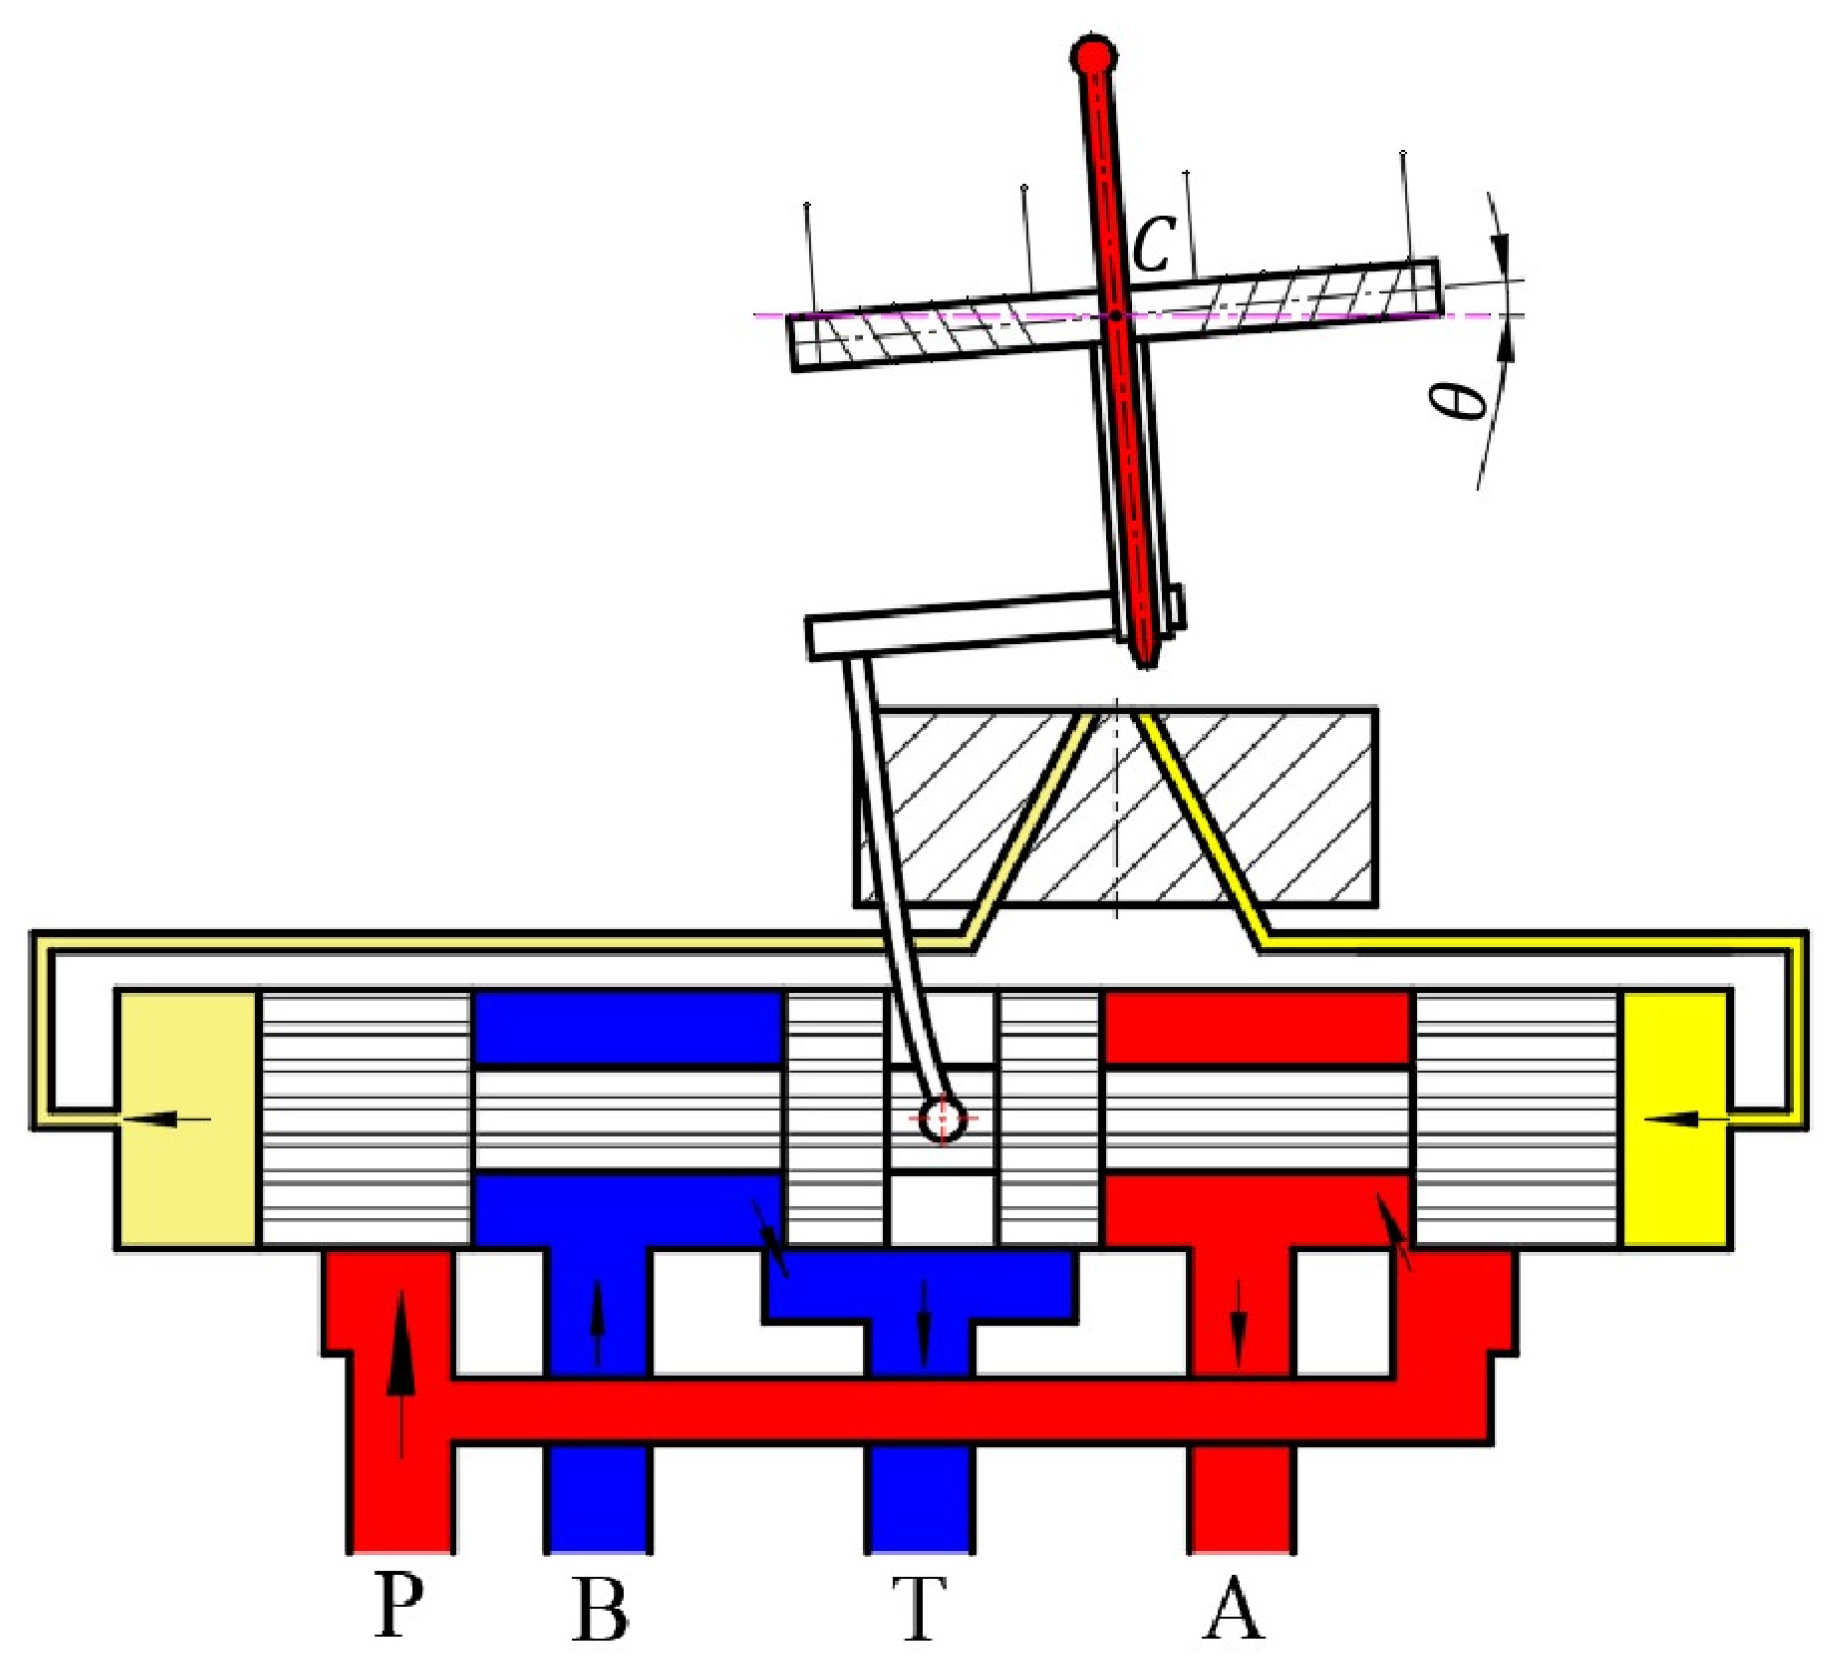
A two-stage jet pipe servovalve with force feedback is designed based on the jet principle, and its structure is shown in Figure 1. Fluid with a given pressure is delivered to the jet pipe through a filter screen. When current flows through the coil, the armature and jet pipe assembly rotates around the armature pivot point under the action of electromagnetic torque, causing unequal pressures in the two receiving channels, due to the unequal inflow from the jet pipe in the two receiving orifices. This causes the main spool to move from the pressure difference starting the servovalve operation. When the electrical signals are zero, the jet flows evenly into the two receiving channels because there is no differential pressure between the left and right control cavities of the spool, and the servovalve is stationary [1,2]. Compared with the dual flapper-nozzle servovalve, the jet pipe servovalve is characterized by low pollution potential, failure alignment, high-pressure recovery coefficient, and flow recovery coefficient. It is widely used in the control of actuators on various ships and airplanes. However, due to the complexity of the flow field within the servovalve and the difficulty in describing the nonlinear elements caused by fluid–solid coupling, its dynamic and static behavior is not easy to predict, so the design of jet pipe servovalves relies mainly on experience and experimental data [3,4].
With the development of CFD technology, more research is focused on numerical simulation to analyze the flow field characteristics of the pre-stage of the jet pipe servovalve [5,6,7,8,9,10]. Numerical simulation results of the pre-stage have been used to establish the mathematical models describing the behavior of the whole jet pipe servovalve, in order to analyze its characteristics more accurately. Somashekhar [11,12] developed a finite element model of the jet pipe servovalve with fluid–solid coupling and studied the pressure changes in the control chambers after the coil is energized, as well as the dynamic response of the jet pipe and the spool. Li et al. [13] established a numerical model of the jet pipe servovalve and analyzed the effects of the structural parameters of the jet pipe and the back pressure of the system on the characteristics of the flow field. Zhao et al. [14] built a structural model of the armature assembly, a magnetic field model of the torque motor, and a flow field model of the pre-stage based on Ansys. An overall model of the servovalve was derived by linking the above models together to obtain the dynamic characteristics. Li et al. [15] constructed a mathematical model of the force-feedback jet pipe servovalve, performed simulations of the response features in the time domain and frequency domain, analyzed the influence of key parameters on the performance of the valve, and proposed an optimization scheme accordingly. Yin et al. [16] suggested a mathematical model of the jet pipe servovalve considering the eddy current effect and investigated the effects of the main parameters in the torque motor on the dynamic behavior of the servovalve. The test shows that the difference between the theoretical and experimental results is about 5%. Chen et al. [17] used a mathematical model of the jet pipe servovalve and optimized the structural parameters based on multi-objective hierarchical particle swarm optimization genetic algorithm. The experimental results show that the model has a certain degree of accuracy.
However, all of the above literature studies are linear mathematical models of jet pipe servovalves. In fact, there are many nonlinear factors in servovalves, such as the hysteresis characteristics of the torque motor, the submerged jet characteristics of the jet hydraulic amplifier, the flow forces applied to the spool, and the dead zone caused by the overlap of the valve ports [18,19,20]. To analyze and design using classical control theory, these nonlinearities are usually ignored or the nonlinear equations are treated by the local linearization method. The resulting model loses some critical information. Models of hydraulic valves using nonlinear theory, on the other hand, have the potential to accurately simulate and predict their excitation characteristics. Hayashi et al. [21,22] studied the instability and self-excited vibration of a poppet valve in a hydraulic system. They gave a nonlinear model depicting the pilot-type poppet valve and simulated the effect of pipe length on the stability of this circuit by numerical methods. The results show the possibility of chaos at the period-doubling bifurcation. Hős et al. [23,24,25,26] applied the theory of non-smooth dynamical systems to study the chattering behavior due to spool–seat collision during the opening and closing of a pressure-reducing valve. They pointed out that the Hopf bifurcations and grazing bifurcations may generate self-excited oscillations. Bouzidi et al. [27,28] investigated theoretically and experimentally the flow–acoustic–structural coupling of a spring-loaded valve. They concluded that the natural frequency of the combined valve–pipe system is the main factor affecting the vibration modal characteristics of the system. Awad and Parrondo [29] looked into the mechanism of self-excited vibration of an annular seal in a spherical valve in a hydroelectric power plant, derived the nonlinear governing equations, and solved them numerically using MATLAB code. They explained that the self-excited vibration arises due to the unstable coupling between the flow of water in the line and the vibratory motion of the seal.
However, to the best of the authors’ knowledge, there is very little literature on the nonlinear modeling of servovalves. As servovalve machining technology becomes more and more sophisticated, some neglected factors may cause the difference between theoretical analysis and practical use. Some papers point out that the values of flow forces calculated using linear formulas are inconsistent with the measured ones [30,31,32,33]. This indicates, to some extent, that there is some error in the analysis using a linear model. In addition, linear system theory suggests that when the spool is in the neutral position, the natural frequency is the lowest, the damping ratio is the smallest, and the stability is the worst, so more research is carried out to study the servovalve dynamic characteristics at the initial zero position [34]. But when the spool changes direction, it may also exhibit instability. When the system is initially in equilibrium, a small perturbation may increase the amplitude of flow and pressure oscillations [35]. This situation is difficult to explain by linear theory. In this paper, under the assumption of an ideal jet pipe servovalve, i.e., without manufacturing errors, a mathematical model of the machine–liquid part of the servovalve considering the combination of nonlinear flow forces acting on the spool is established.
In Section 2, the linear mathematical models of the armature assembly and the jet pipe amplifier are given, the nonlinear descriptions of steady-state flow force and transient flow force are presented, and the nonlinear dynamic equation of the spool is further derived. Section 3 is an example of nonlinear analysis based on MATLAB (R2016a) software for a type of jet pipe servovalve. In order to prove the accuracy of the nonlinear model, experimental validation is carried out in Section 4, and Section 5 is the conclusion.

2. Theoretical Model

2.1. Linear Model

2.1.1. Kinematic Analysis of Armature Assembly

It is assumed that when the jet pipe servo valve operates, the spool is located on the right side, and the jet pipe is in the neutral position under the action of the spring force and electromagnetic force. The electrical signal is reversed at the time of t0, subjecting the armature assembly in the torque motor to the electromagnetic torque Me, rotating counterclockwise around the pivot point C by an angle of θ, and the spool moves to the left under the operation of the pressure difference of the two control chambers as shown in Figure 2.
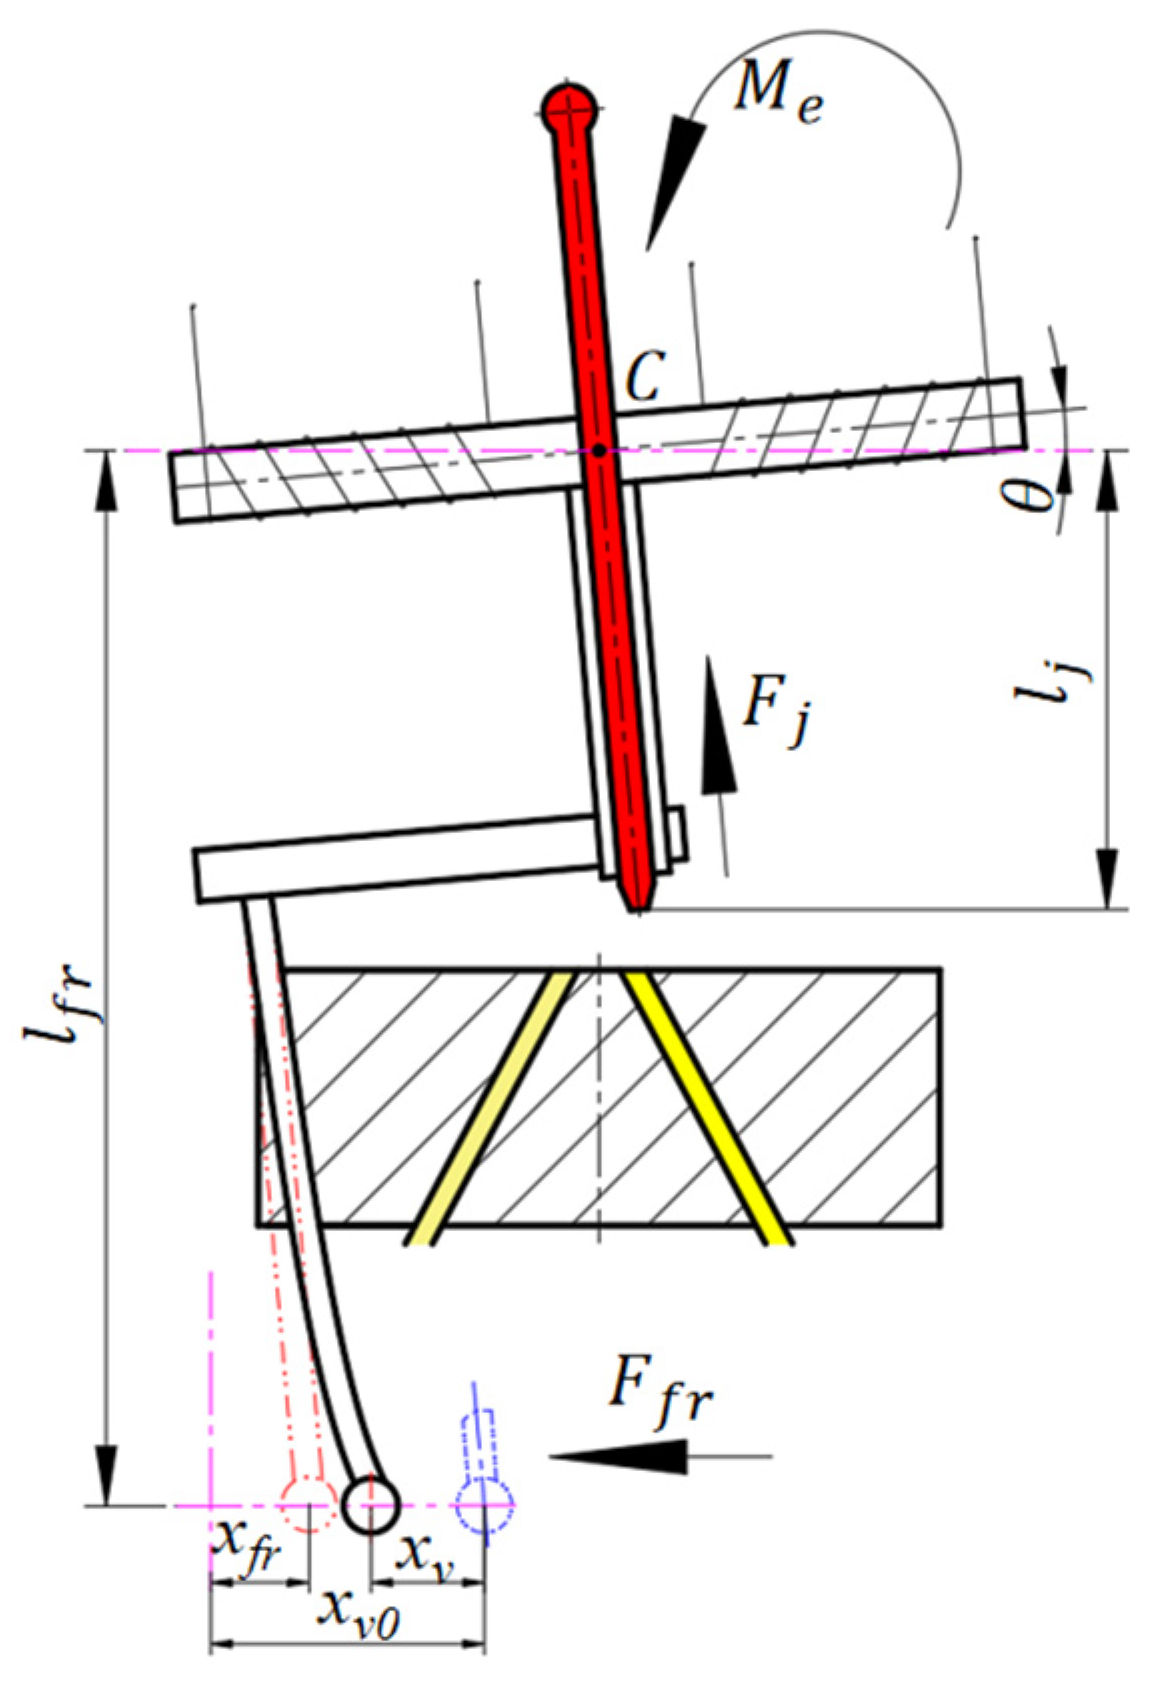
The force analysis of the armature assembly is shown in Figure 3. The oil ejected from the jet pipe exerts a jet counterforce F j on the jet pipe. The feedback spring bends and deforms under the influence of the feedback ball, generating the force F f r . Since the armature assembly is rotating around point C, there is almost no deformation of the jet pipe and its casing, so it is assumed that the elastic force of the jet pipe is zero. Neglecting the effect of the spilled flow from the receiving orifice on the jet pipe, applying the law of rotation to point C yields
J c j θ ¨ + B c j θ ˙ = M e F j x l j F f r l f r
where J c j is the moment of inertia of the rotating parts, kg/m2; θ is the rotation angle of the jet pipe, rad; B c j is the damping coefficient for rotating parts, Nms/rad; M e is torque due to input electrical signal, Nm; F j x is component of jet counterforce F j in x-direction, N; l j is a vertical distance from the nozzle to C, m; F f r is force acting at the extremity of the feedback spring, N; l f r is a vertical distance from the feedback ball center to C, m.
According to the principle of underdeveloped impact jet [36], it is approximated that the velocity of the jet ejected in time interval dt is equal everywhere, so the equivalent mass is
d m j = ρ π R j 2 v j
where ρ is the fluid density, k g / m 3 ; R j is the nozzle radius, m; v j is the velocity of the oil at the nozzle outlet, m/s.
Based on the momentum theorem, the force of the jet on the jet pipe is found to be
F j = ρ π R j 2 v j 2
From the literature [10], the velocity of the oil at the nozzle outlet is
v j = 2 ρ ( p s p t ) + 2 g h
where p s is the inlet pressure, MPa; p t is the valve return pressure, Mpa; h is the vertical distance from the nozzle inlet to outlet, m.
Since the angle of declination θ is small, there is
F j x ρ π θ R j 2 v j 2
Assuming that the engagement of the feedback ball with the feedback slot in the spool is a clearance-free fit, it is approximated that whenever there is a relative displacement, it is constrained. Considering that after deflecting the jet pipe by an angle θ , the feedback spring is similarly deflected by an angle θ , as shown in Figure 3, the resulting deformation is
x f r = x v 0 x f r x v
where x v 0 is the spool displacement before the changeover, m; x f r is the position of the end of the feedback spring without deformation, m; x v is the spool displacement, m.
Approximately,
x f r = l f r θ
Resulting in a force
F f r = k f r ( x v 0 l f r θ x v )
where k f r is the stiffness of the feedback spring, N/m.
Substituting Equations (3)~(5) and Equation (8) into Equation (1), we obtain
J c j θ ¨ + B c j θ ˙ + a θ + b ( x v 0 x v ) = M e
where a = ρ π l j R j 2 2 ρ ( p s p t ) + 2 g ( h s h j ) k f r l f r 2 ; b = k f r l f r .

2.1.2. Flow Equations for the Control Chamber

From the literature [15], it is assumed that the pressure-flow equation of the jet pipe amplifier is
q L = K q f j θ K c p f j p
where K q f j is the flow gain; K c p f j is the flow-pressure coefficient.
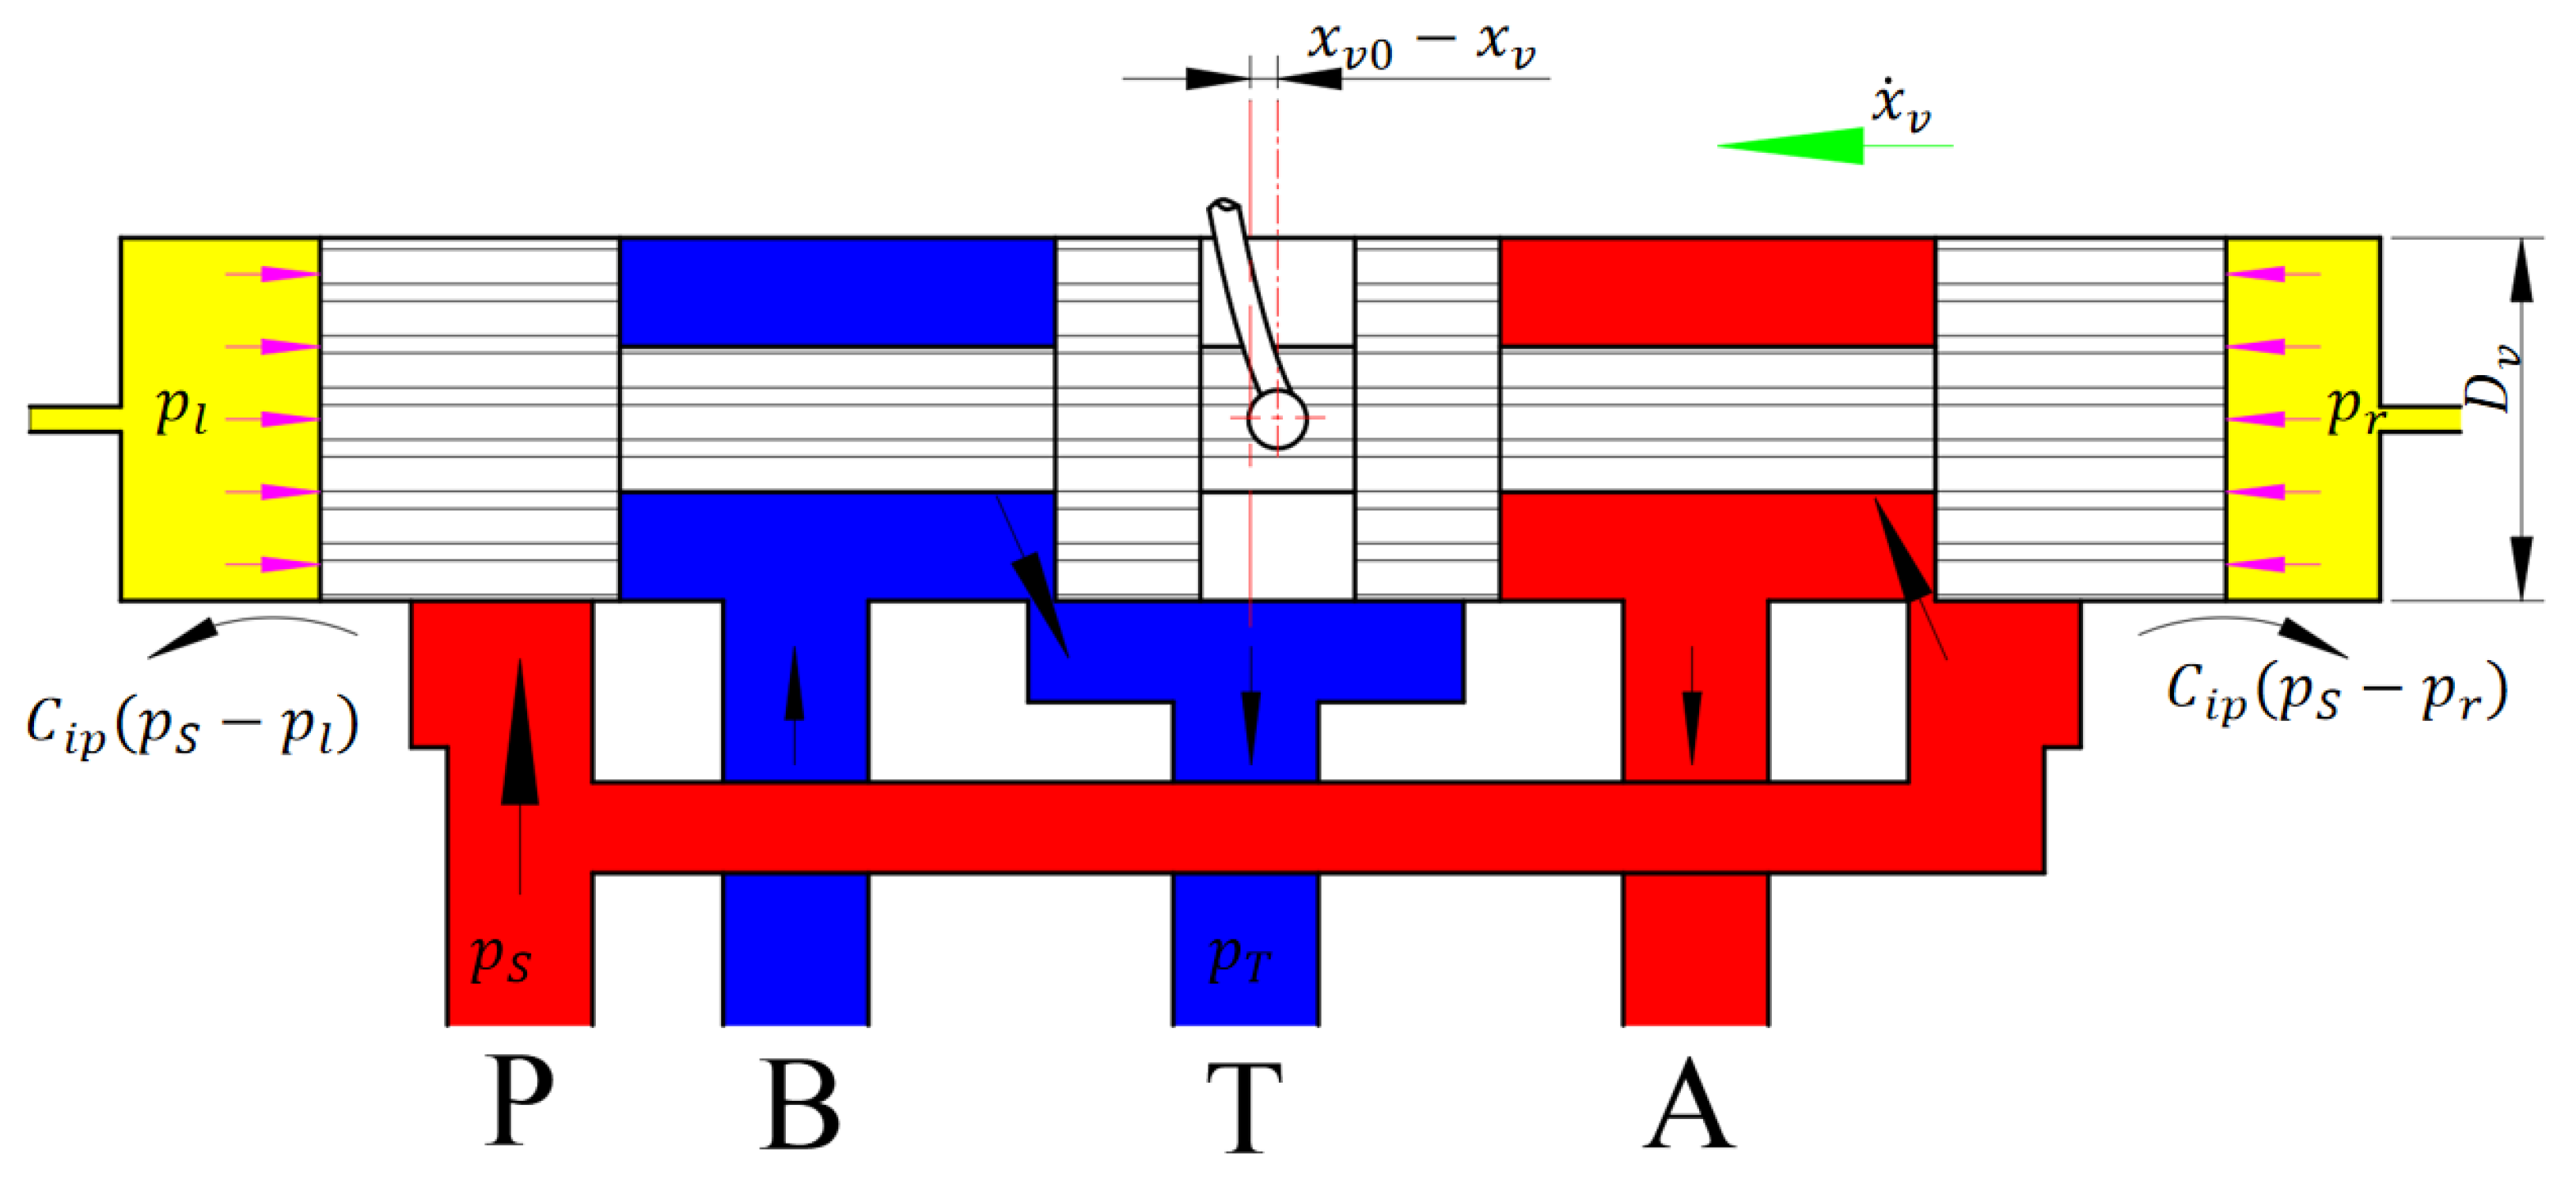
The movement of the main spool in the sleeve is shown in Figure 4.
As the spool moves to the left, the flow rate into the right control chamber is
q L R = A v x ˙ v + C i p ( p s p r ) + V r β e p ˙ r
where A v is the spool cross-sectional area, A v = π D v 2 4 , m2; C i p is the internal leakage factor; V r is the volume of the right control cavity, m3; β e is the bulk modulus of oil, Pa.
Similarly, the flow rate out of the left control oil chamber is obtained as follows:
q L L = A v x ˙ v + C i p ( p s p l ) V l β e p ˙ l
The volume of the right control chamber is as follows:
V r = V 0 + A v x v
where V 0 is the initial volume of oil in the spool side chamber, m3.
The volume of the left control chamber is
V l = V 0 A v x v
Thus
q L = q L R + q L L 2 = A v x ˙ v + C i p 2 ( 2 p s p l p r ) + V 0 2 β e p ˙ + A v x v 2 β e p ˙ r + p ˙ l
Neglecting the leak, Equation (15) simplifies to
q L = A v x ˙ v + V 0 2 β e p ˙ + A v x v 2 β e p ˙ r + p ˙ l
when the main spool moves to the left, the pressure p l in the left control chamber increases and the pressure p r in the right control chamber decreases.
p ˙ r + p ˙ l = O ( ϵ )
where O ( ϵ ) is an infinitely small quantity.
Suppose that A v x v V 0 , Equation (16) becomes
q L = A v x ˙ v + V 0 2 β e p ˙

2.2. Nonlinear Dynamic Analysis of Spool

According to Newton’s second law [37], the kinetic equation of the spool in the reverse direction is
m c x ¨ v = p A v + F s F t + F f r
where m c is the mass of spool and attendant fluid, kg; p is the differential pressure between two control chambers, Mpa; F s is the steady-state flow force, N; F t is the transient flow force, N.
When the spool has a small displacement x v under differential pressure p , the mass of the spool and the accompanying fluid is
m c = m v + ρ A v x v
where mv is the mass of the spool, kg.
Substituting Equation (19) into (20) yields
m v x ¨ v + ρ A v x v x ¨ v = p A v + F s F t + F f r
Drawing on the mathematical model of the spring [38,39,40], the nonlinear description of the steady-state hydrodynamic force is set as follows:
F s = K s 1 ( x v 0 x v ) K s 2 ( x v 0 x v ) 3
where K s 1 is the primary term coefficient; K s 2 is the cubic term coefficient.
Consider the transient hydrodynamic formulation [41]:
F t = ρ L Q ˙
where L is the damping length, m; Q is the flow rate through the orifice, m3/s.
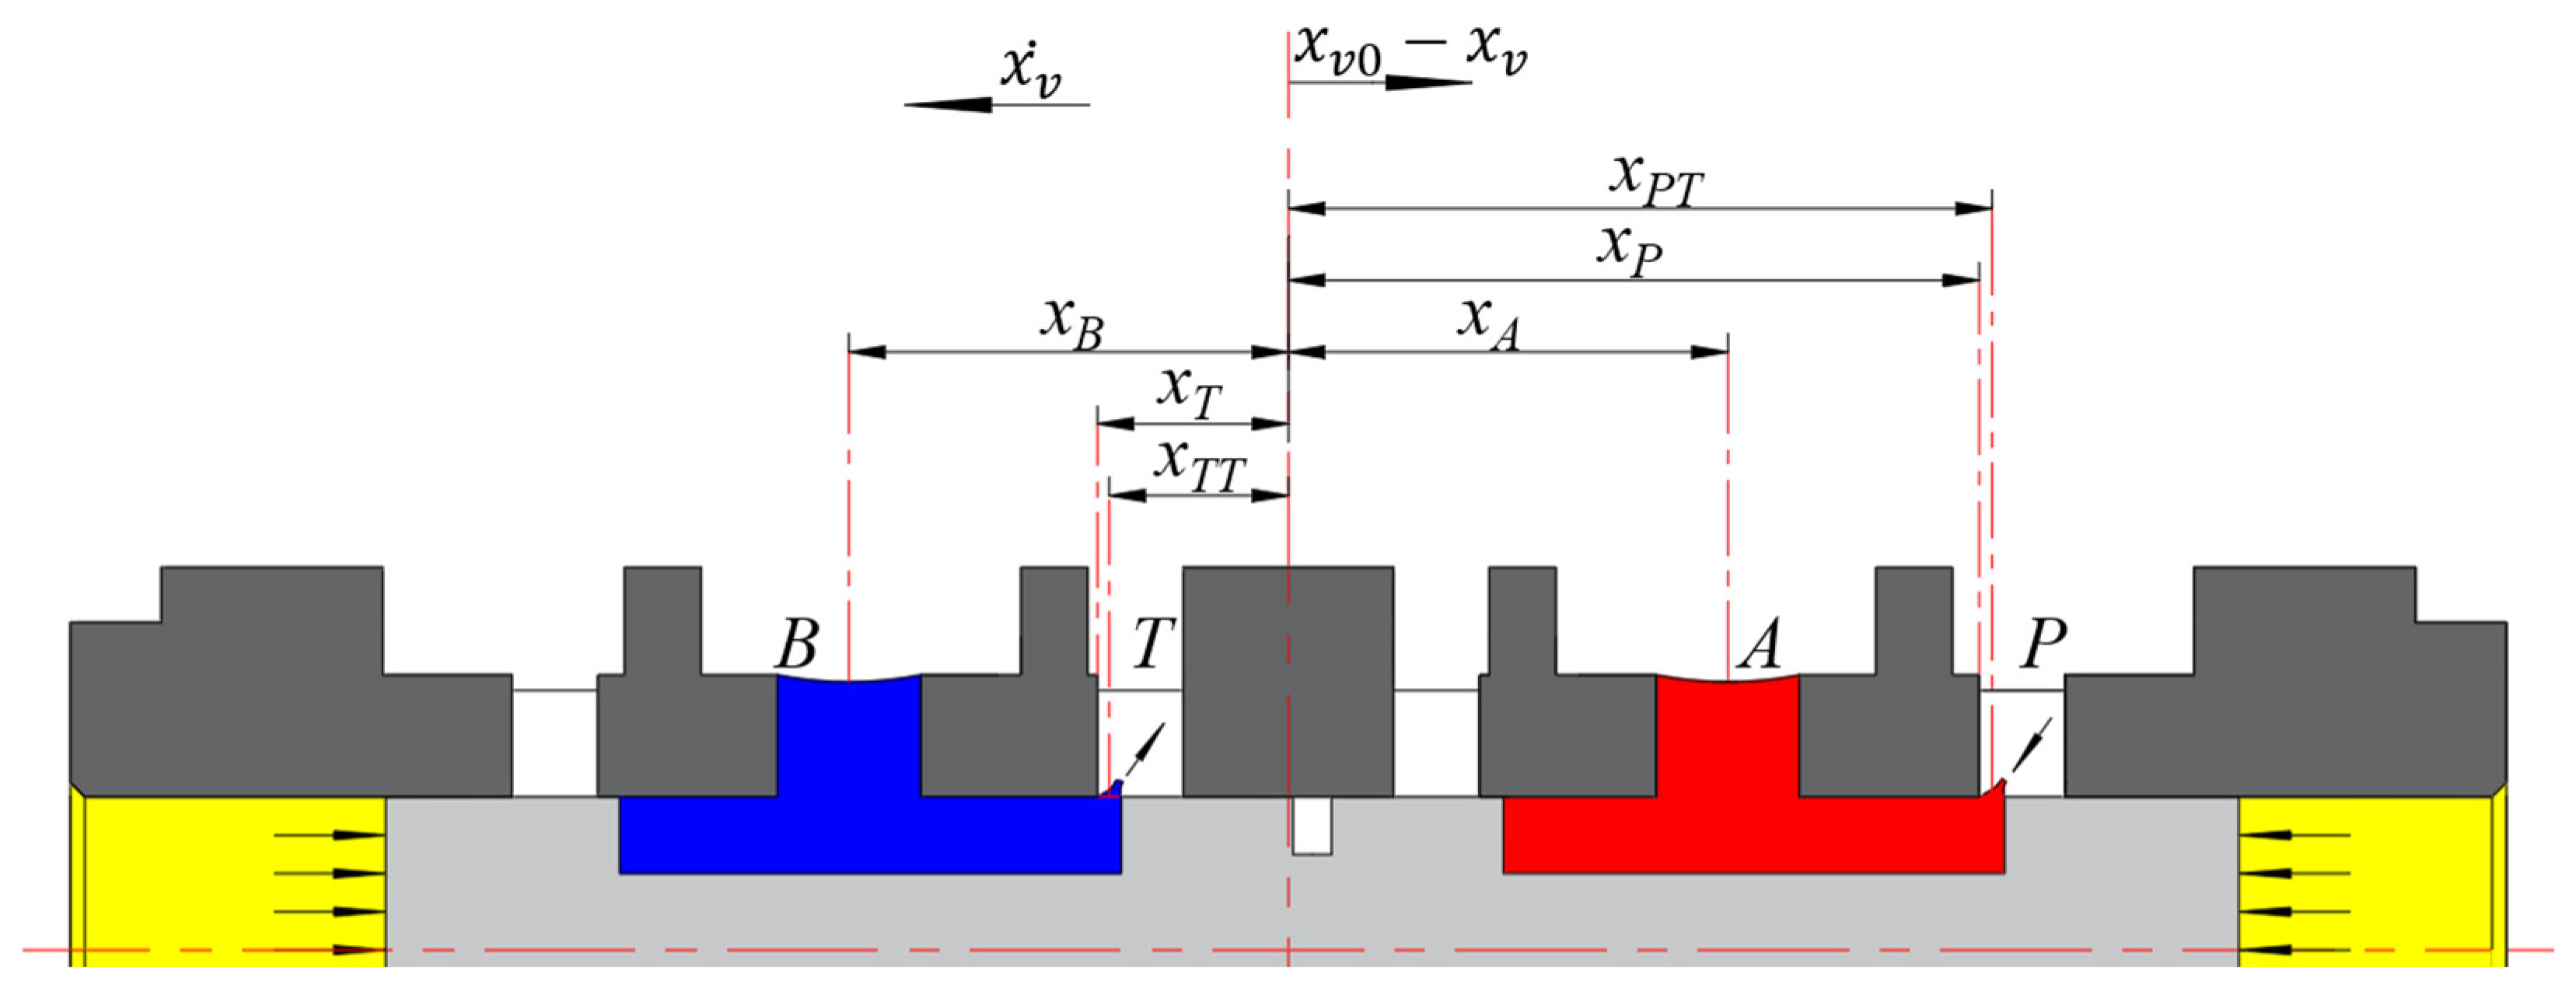
The damping length L affects the stability of the spool, as shown in Figure 5. In order to avoid the situation where the transient flow force acts as a negative damping force, it is determined during the design of the servovalve. The usual formula is
L = x P x A ( x B x T )
where x i is the distance from each port to the spool center, i = P ,   A ,   B , T , m.
It is noted that the port centerline is considered when calculating the A-port coordinate x A and the B-port coordinate x B , but the T-port coordinate x T and the P-port coordinate x P are calculated with the port boundary. In the figure, x T T and x P T are the T-port and P-port coordinates considering the centerline position.
If the centerline of each port is used, then the transient hydrodynamic equation becomes
F t = ρ ( L + x v 0 x v ) Q ˙
Therefore, similar to the steady-state flow force, the nonlinear description is defined as follows:
F t = [ K 1 ( x v 0 x v ) + K 2 ] ( 0 x ˙ v )
where K 1 is the coupling term coefficient; K 2 is the velocity term coefficient.
For analytical simplicity, setting L = K 2 K 1 yields
F t = K t 1 [ L + ( x v 0 x v ) ] ( 0 x ˙ v )
where K t 1 is the equivalent transient flow force coefficient; L is the equivalent damping length.
Substituting Equations (8), (22), and (27) into Equation (21), and letting x v v = x v 0 x v , we obtain
m v x ¨ v v + ρ A v x v x ¨ v v = p A v K s 2 x v v 3 + K s 1 x v v K t 1 ( L + x v v ) x ˙ v v + k f r ( x v v l f r θ )
Rearranging
( 1 + ρ A v m v x v ) x ¨ v v = K t 1 m v ( L + x v v ) x ˙ v v K s 2 m v x v v 3 + K s 1 + k f r m v x v v + p A v k f r l f r θ m v
Considering that ρ A v m v x v is on the order of 10 4 , which is much less than unit. So Equation (29) further reduces to
x ¨ v v = η ( L + x v v ) x ˙ v v κ ε 2 x v v 3 + κ x v v + F u
where κ = K s 1 + k f r m v ; ε = ± K s 2 K s 1 + k f r ; η = K t 1 m v ; L = K 2 K 1 ; F u = p A v k f r l f r θ m v .

2.3. Mathematical Modeling of Closed-Loop Systems

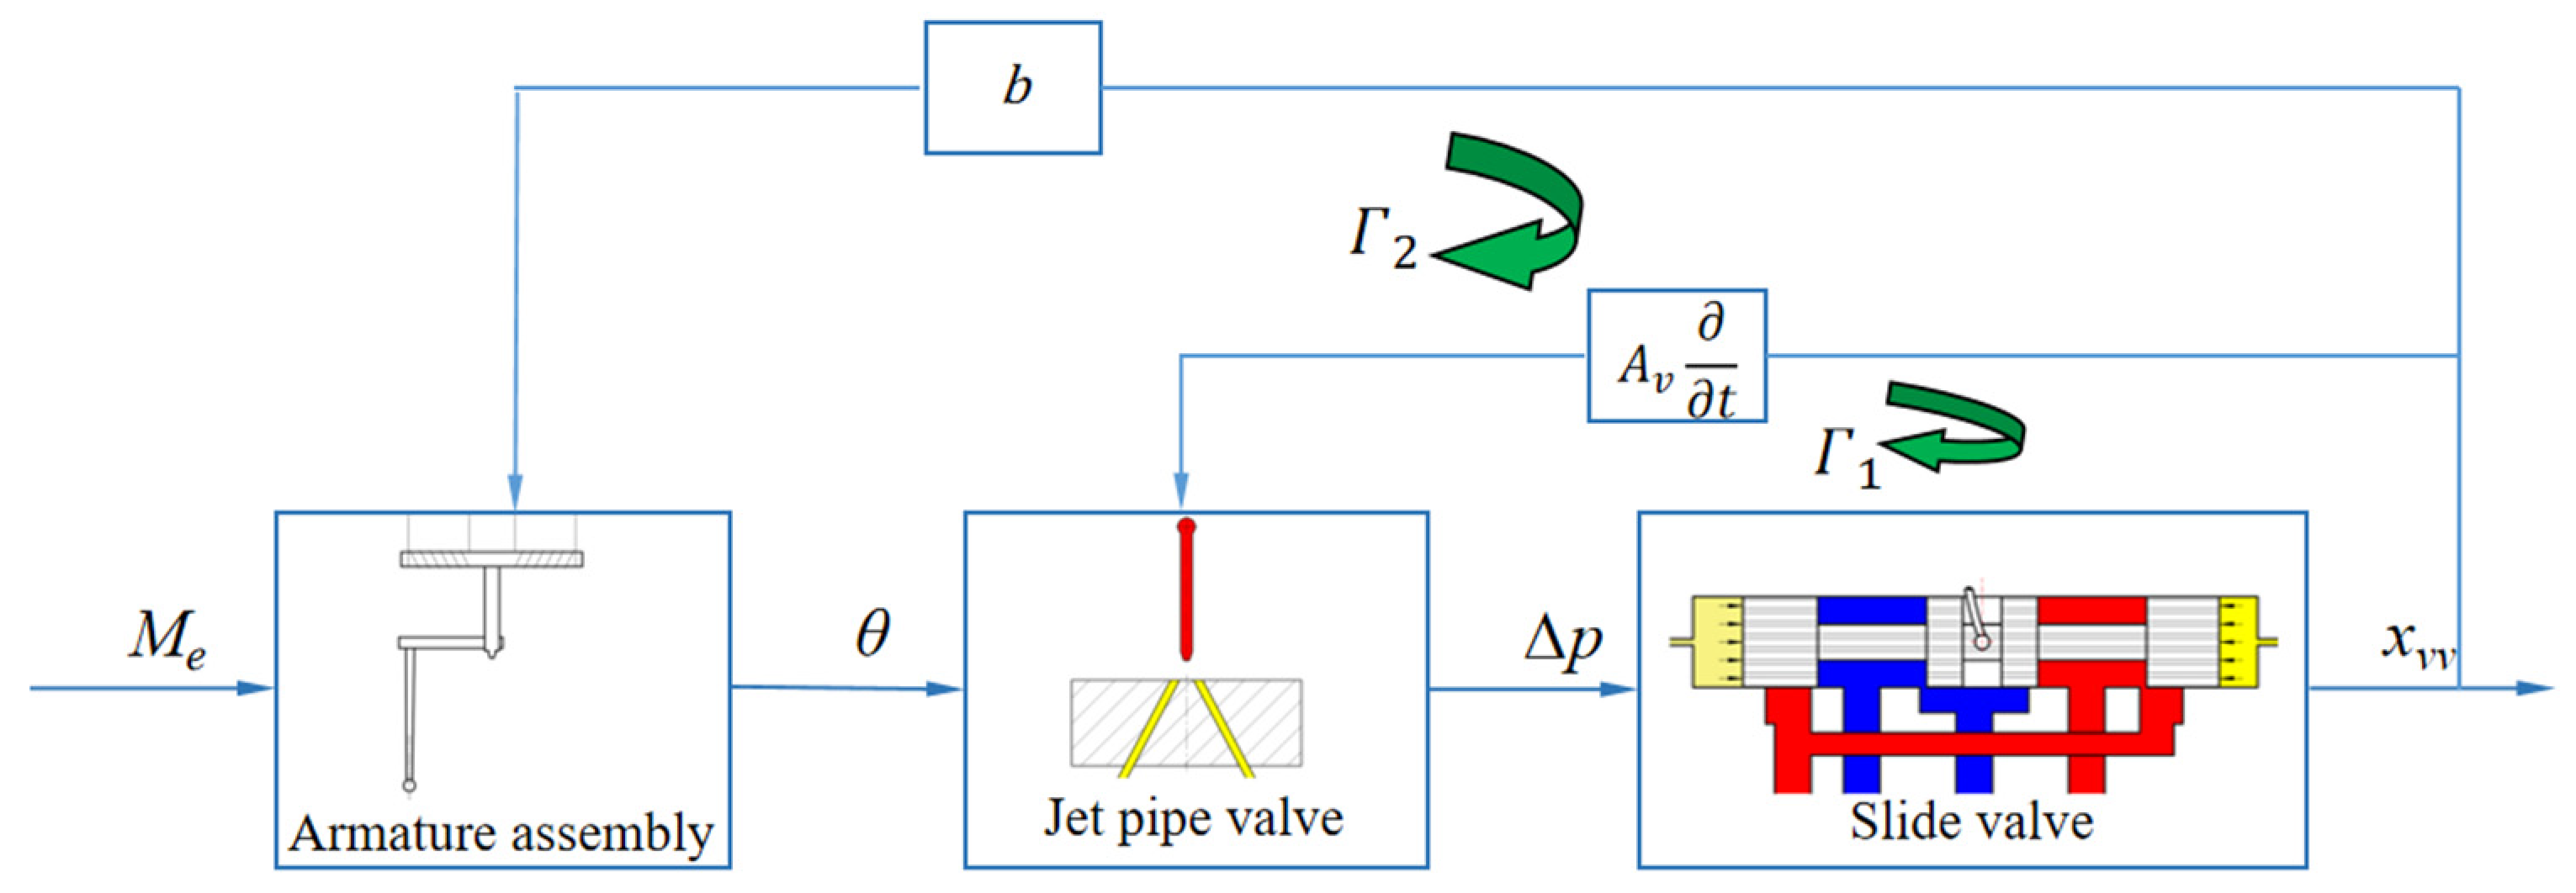
Equations (9), (10), (18), and (30) can be combined to form the block diagram in Figure 6. It can be seen that the jet pipe valve and the slide valve form a closed loop defined as Γ 1 . The armature assembly, the jet pipe valve, and the slide valve form another closed loop defined as Γ 2 .
Organizing Equations (10), (18), and (30) and setting p = x 1 , x v v = x 2 , x ˙ v v = x 3 , we obtain a set of nonlinear equations describing the third-order system Γ 1 :
x 1 ˙ = 2 β e K c p f j V 0 x 1 2 β e A v V 0 x 3 + 2 β e K q f j V 0 θ x 2 ˙ = x 3 x 3 ˙ = A v m v x 1 κ ( ε 2 x 2 2 1 ) x 2 η ( L + x 2 ) x 3 b m v θ
Organizing Equations (9), (10), (18), and (30) and setting p = x 1 , x v v = x 2 , x ˙ v v = x 3 , θ = x 4 , θ ˙ = x 5 , we obtain a set of nonlinear equations describing the fifth-order system Γ 2 :
x ˙ 1 = 2 β e K c p f j V 0 x 1 2 β e A v V 0 x 3 + 2 β e K q f j V 0 x 4 x ˙ 2 = x 3 x ˙ 3 = A v m v x 1 κ ( ε 2 x 2 2 1 ) x 2 η ( L + x 2 ) x 3 b m v x 4 x ˙ 4 = x 5 x ˙ 5 = b J c j x 2 a J c j x 4 B c j J c j x 5 + 1 J c j M e
Due to space constraints, the transfer function of the fifth-order linear system proposed in the literature [15] is given here directly
X v ( s ) = K q f j l j G 1 ( s ) G 2 ( s ) + K q f j k f r l j 2 M e ( s )
where
G 1 ( s ) = J c j s 2 + B c j s + k j
G 2 ( s ) = m v V 0 2 β e A v s 3 + K c p f j m v A v s 2 + [ A v + V 0 ( k f r + 0.43 w p v ) 2 β e A v ] s + K q f j ( k f r + 0.43 w p v ) A v

3. Numerical Analysis

The parameters used for numerical analysis are given in Table 1. Most of the parameters given in Table 1 are provided by the manufacturer. K q f j and K c p f j are calculated based on the data provided by the manufacturer. The coefficients related to the flow forces are fitted according to the CFD simulation results. All calculations and plots in this section are performed based on the MATLAB (R2016a) software [42,43,44].

3.1. Nonlinear Analysis of the Third-Order Closed-Loop Systems

3.1.1. The Calculation of Equilibrium Points

Let θ = 0 in Equation (31), and consider the so-called unexcited equations of state:
x ˙ 1 x ˙ 2 x ˙ 3 = 2 β e K c p f j V 0 0 2 β e A v V 0 0 0 1 A v m v κ ( ε 2 x 2 2 1 ) η ( L + x 2 ) x 1 x 2 x 3
Let x ˙ 1 = 0 , x ˙ 2 = 0 , x ˙ 3 = 0 , and solve Equation (34) to obtain the equilibrium points (0, 0, 0), (0, 1 ε , 0), and (0, 1 ε , 0), which are denoted as points 0, 1, and 2. Considering that a positive or negative ε does not change the positions of the equilibrium points, only the case where ε is positive is analyzed.
The Jacobi matrix corresponding to the third-order system Γ 1 at point 0 is
J 0 = 2 β e K c p f j V 0 0 2 β e A v V 0 0 0 1 A v m v κ η L
Let J 0 λ E = 0 , the eigenvalues are found to be
λ 01 = 5.003 × 10 6 ,   λ 02 = 1.4338 × 10 3 ,   λ 03 = 1.0446 × 10 3 .
Since there are two negative roots and a positive root, the point 0 is the saddle point.
The Jacobi matrix corresponding to the third-order system Γ 1 at point 1 is
J 1 = 2 β e K c p f j V 0 0 2 β e A v V 0 0 0 1 A v m v 2 κ η L + η ε
Let J 1 λ E = 0 , the eigenvalues are found to be
λ 11 = 5.003 × 10 6 ,   λ 12 = 514.11 + 1652.7 i ,   λ 13 = 514.11 1652.7 i .
There exists a negative root and a pair of complex roots with negative real parts, so point 1 is a stable spiral.
The Jacobi matrix corresponding to the third-order system Γ 1 at point 2 is
J 2 = 2 β e K c p f j V 0 0 2 β e A v V 0 0 0 1 A v m v 2 κ η L η ε
Let J 2 λ E = 0 , the eigenvalues are found to be
λ 21 = 5.003 × 10 6 ,   λ 22 = 903.35 + 1476.3 i ,   λ 23 = 903.35 1476.3 i .
There exists one negative root and a pair of complex roots with positive real parts, so point 2 is an unstable spiral. And the imaginary part of these two complex roots corresponds to the oscillation frequency, which is approximated to be 235 Hz.

3.1.2. Phase Portrait

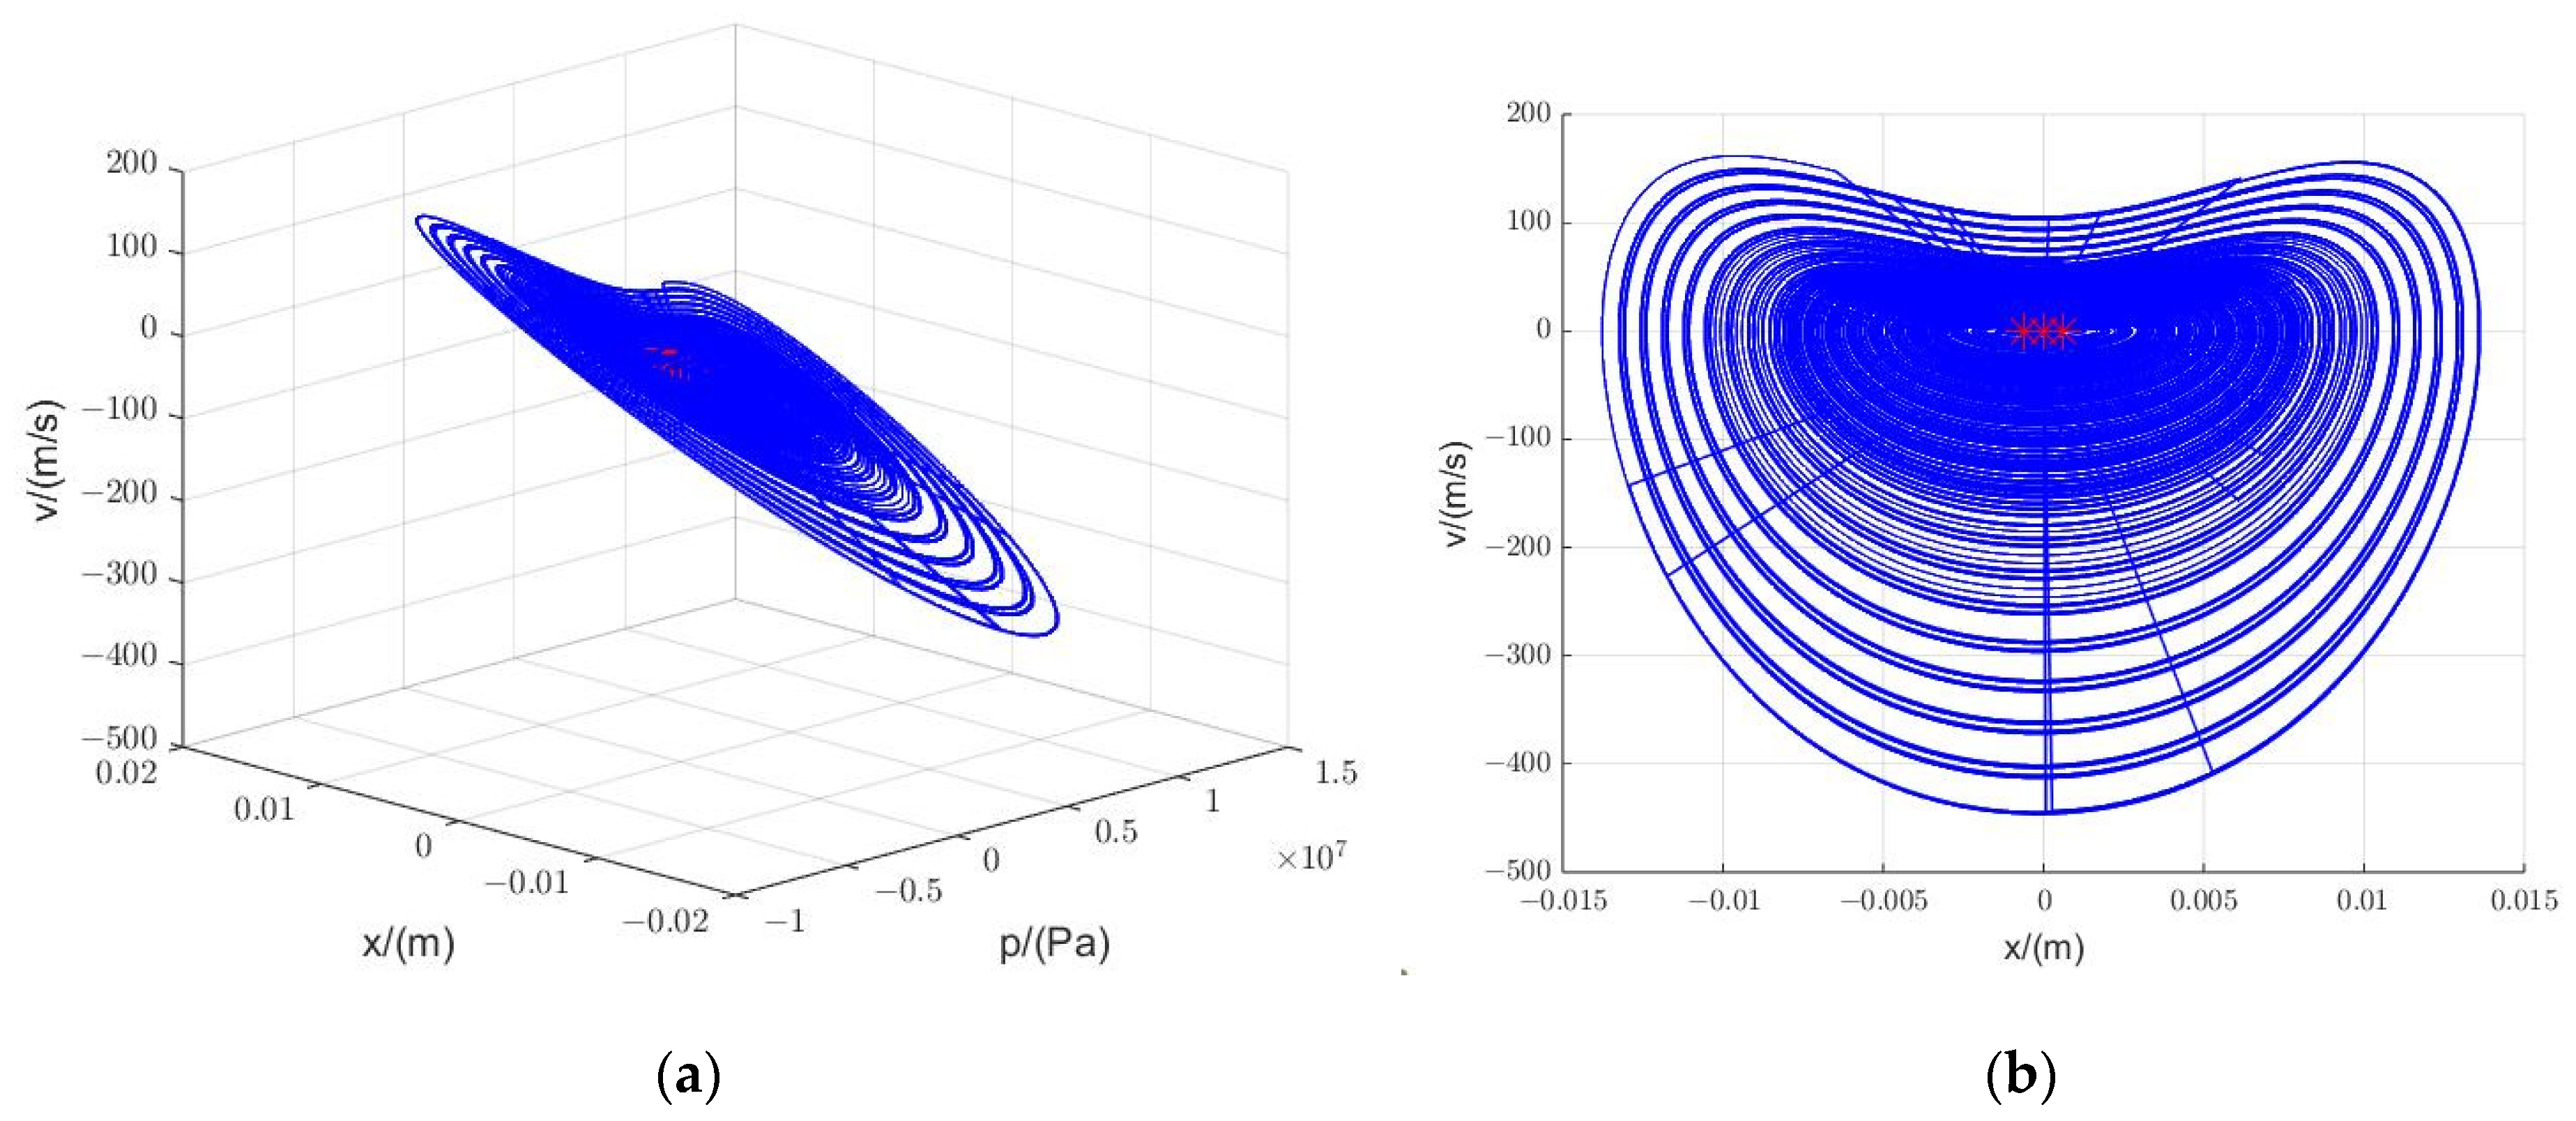
The phase plane plot of Equation (34) is shown in Figure 7. The red * in the figures indicates the equilibrium point. Although point 1 is the stable spiral, the trajectories are repelled away from the equilibrium points because the other two equilibrium points are unstable.

3.1.3. Bifurcation Characteristics

  • Hopf bifurcation
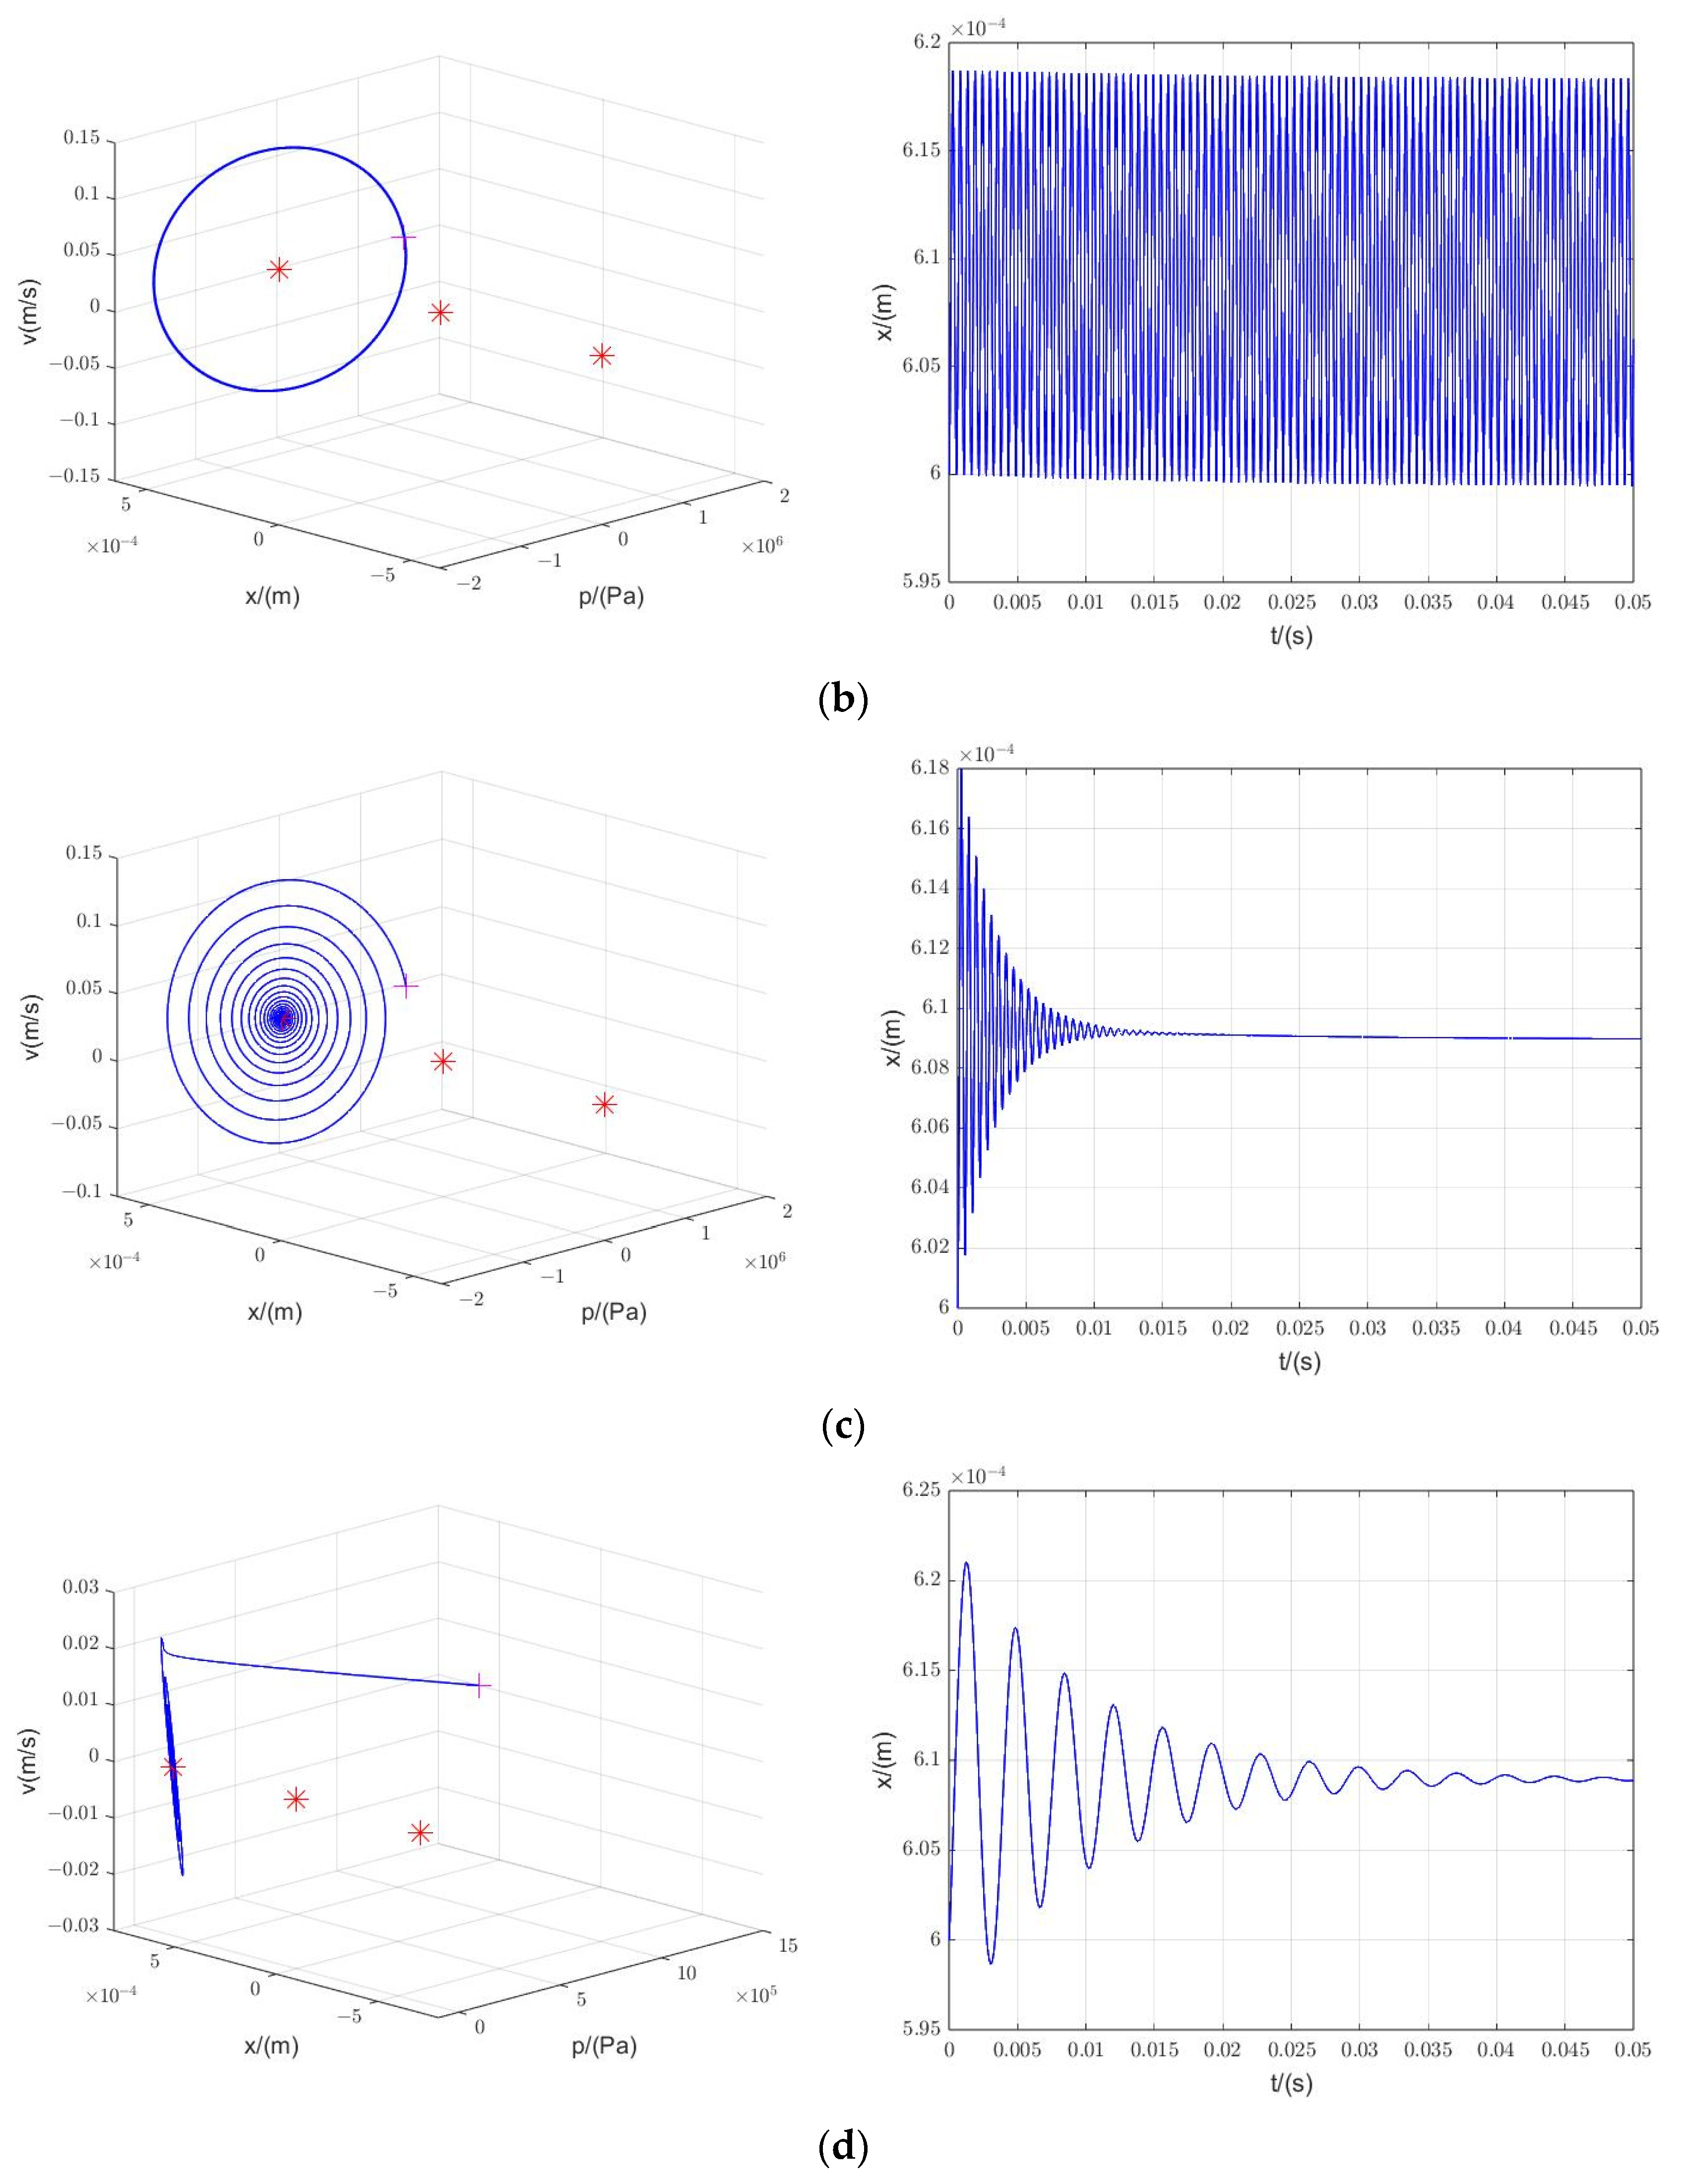
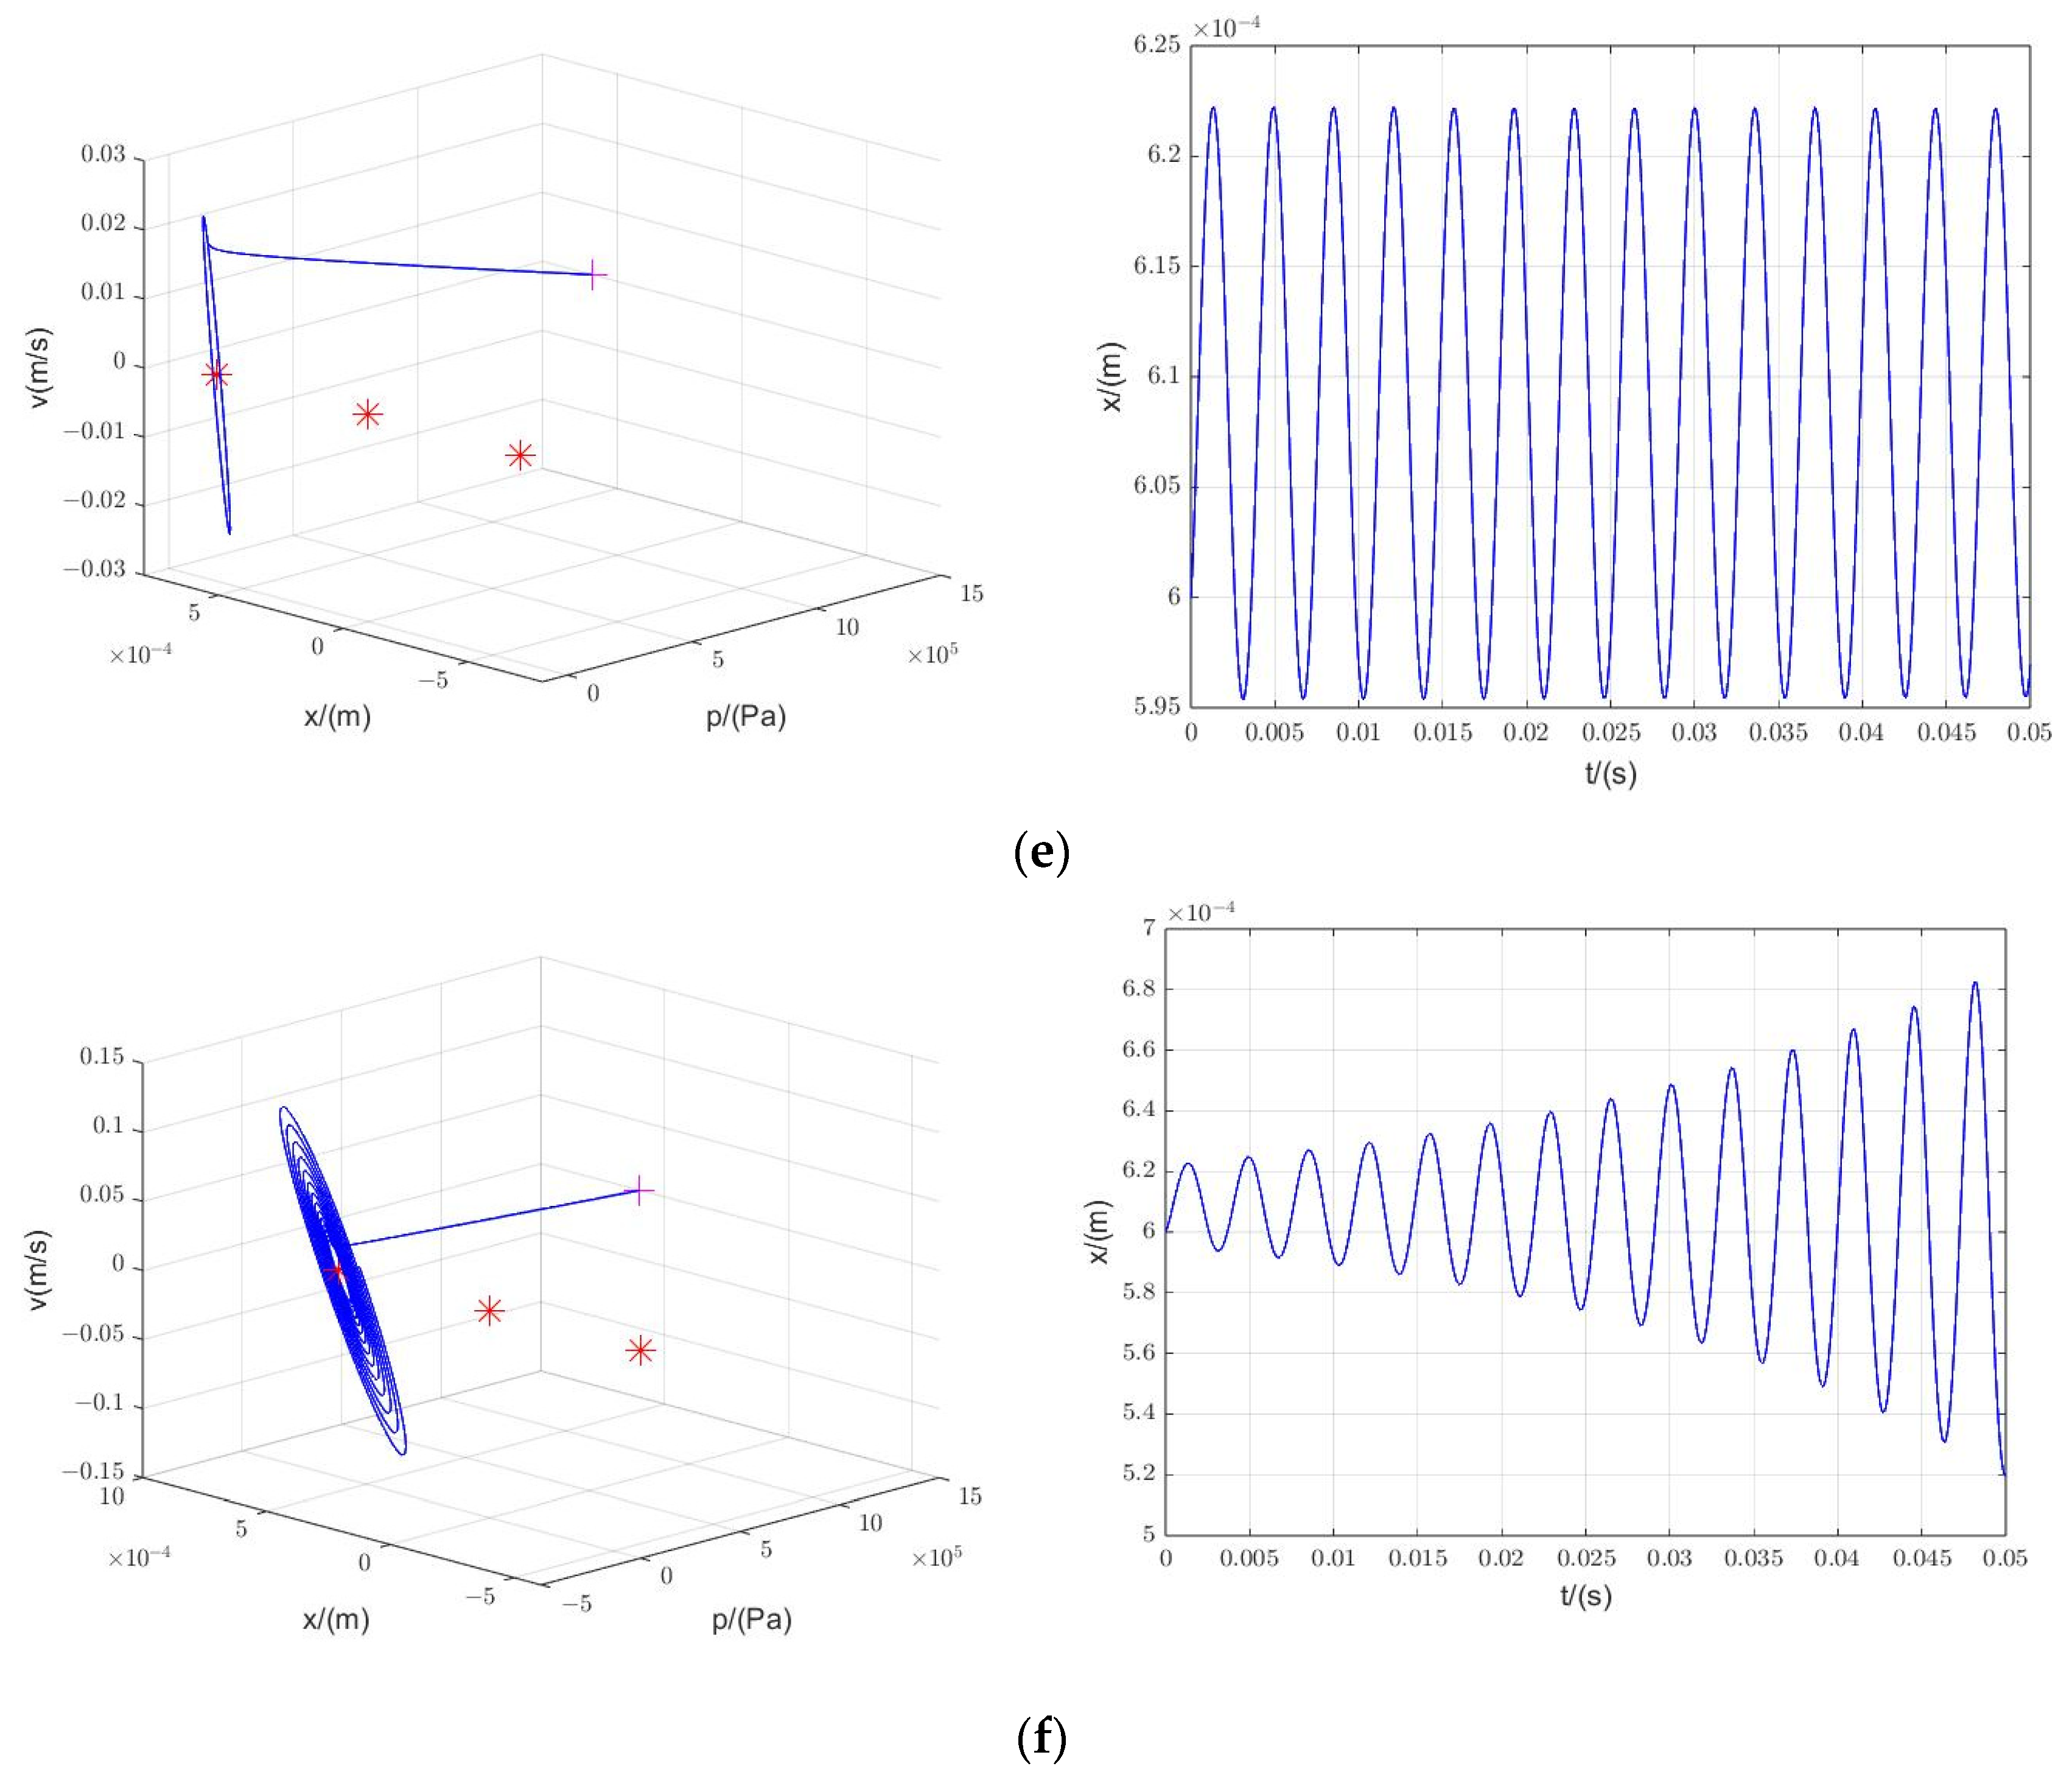
According to the Hurwitz criterion [45], it is known that the flow-pressure coefficient K c p f j affects the stability of the nonlinear third-order system; this needs to be considered when the spool size is determined. Considering it as a bifurcation parameter, the eigenvalues of the Jacobi matrix 37 are computed to find that the real part of the eigenvalues of J2 is approximately zero when K c p f = 3.67590603 × 10 13 and K c p f = 1.43899815 × 10 11 , and the system has Hopf bifurcations [46,47]. The effect on the system, when the bifurcation parameter K c p f j is different, is shown in Figure 8, with a pressure–displacement–velocity phase trajectory starting from the initial value on the left and the displacement versus time curve on the right. The simulation time is set to 0.05 s, and the initial values (pv0, xvv0, vv0) are chosen as x , y , z x = 1.5 × 10 6 , y = 6 × 10 4 ,   z = 0 .
The system depicted in Figure 8c,d is stable based on the initial condition. Figure 8b,e depict spools with equal amplitude vibration, but the frequency and amplitude of the vibration are different from each other. Figure 8f depicts a spool motion that is unstable. Although Figure 8a appears to be stable, the result is oscillatory if the simulation time is increased to 1s. Moreover, it is worth noting that the phase and displacement diagrams may be different for different initial values.
Hopf bifurcation is closely related to the generation mechanism of self-excited oscillations. When the bifurcation parameter varies a little near the critical value, the stability characteristics of the system change. In jet pipe valves, K c p f j is not a definite value, which is not only related to the valve operating point but also to the manufacturing error. Therefore, to avoid Hopf bifurcation, the effect of parameter K c p f j needs to be considered in the design of the jet pipe valve.
  • Period-doubling bifurcations
Based on the nonlinear system of Equation (31), the bifurcation due to the variations in the magnitude of the deflection angle θ and the frequency ω of the jet pipe is shown in Figure 9. Considering that the movement of the spool in the sleeve is bounded, an upper and lower limit of ±6.1 mm (the maximum distance that the spool can move unilaterally between the sleeves) is given. The spool is essentially in period-doubling motion when the jet pipe inclination angle is varied within ±0.175 rad (or ±10°). Single-period motion exists only near 0 rad. And as the frequency increases, the inclination angle range of single-cycle motion increases.

3.2. Nonlinear Analysis of the Fifth-Order Closed-Loop System

3.2.1. The Calculation of Equilibrium Points

Let M e = 0 in Equation (32), and consider the so-called unexcited equations of state:
x ˙ 1 x ˙ 2 x ˙ 3 x ˙ 4 x ˙ 5 = 2 β e K c p f j V 0 0 2 β e A v V 0 2 β e K q f j V 0 0 0 0 1 0 0 A v m v κ ( ε 2 x 2 2 1 ) η ( L + x 2 ) b m v 0 0 0 0 0 1 0 b J c j 0 a J c j B c j J c j x 1 x 2 x 3 x 4 x 5
Let x ˙ 1 = 0 , x ˙ 2 = 0 , x ˙ 3 = 0 ,, x ˙ 4 = 0 , x ˙ 5 = 0 , and solve the Equation (38) to obtain the equilibrium points (0, 0, 0, 0, 0, 0), (0, 1 ε , 0, 0, 0), and (0, 1 ε , 0, 0, 0), which are denoted as points I, II, and III.
The Jacobi matrix corresponding to the fifth-order system Γ 2 at point I is
J 0 = 2 β e K c p f j V 0 0 2 β e A v V 0 2 β e K q f j V 0 0 0 0 1 0 0 A v m v κ η L b m v 0 0 0 0 0 1 0 b J c j 0 a J c j B c j J c j
Let J 0 λ E = 0 , the eigenvalues are found to be
λ 01 = 5.003 × 10 6 ,   λ 02 = 1.4338 × 10 3 ,   λ 03 = 1.0446 × 10 3 ,   λ 04 = 154.63 + 2125.8 i ,   λ 05 = 154.63 2125.8 i .
The Jacobi matrix corresponding to the fifth-order system Γ 2 at point II is
J 1 = 2 β e K c p f j V 0 0 2 β e A v V 0 2 β e K q f j V 0 0 0 0 1 0 0 A v m v 2 κ η L + η ε b m v 0 0 0 0 0 1 0 b J c j 0 a J c j B c j J c j
Let J 1 λ E = 0 , the eigenvalues are found to be
λ 11 = 5.003 × 10 6 ,   λ 12 = 580.3 + 1736.4 i ,   λ 13 = 580.3 1736.4 i ,   λ 14 = 80.42 + 2104.4 i ,   λ 15 = 80.42 2104.4 i .
The Jacobi matrix corresponding to the fifth-order system Γ 2 at point III is
J 2 = 2 β e K c p f j V 0 0 2 β e A v V 0 2 β e K q f j V 0 0 0 0 1 0 0 A v m v 2 κ η L η ε b m v 0 0 0 0 0 1 0 b J c j 0 a J c j B c j J c j
Let J 2 λ E = 0 , the eigenvalues are found to be
λ 21 = 5.003 × 10 6 ,   λ 22 = 943.16 + 1519 . i ,   λ 23 = 943.16 1519.9 i ,   λ 24 = 186.43 + 2147.4 i ,   λ 25 = 186.43 + 2147.4 i .
Similarly, the imaginary part of these two complex roots with a positive real part corresponds to the oscillation frequency, which is approximated to be 242 Hz.
A comparison of the eigenvalues of the system Γ 2 and those of system Γ 1 shows that there is no change in all the real roots and a small change in the values of the real and imaginary parts of the complex roots. The real parts of the added eigenvalues are negative, so the stability properties of the equilibrium points of the fifth-order system are the same as those of the corresponding equilibrium points of the third-order system.

3.2.2. Phase Portrait

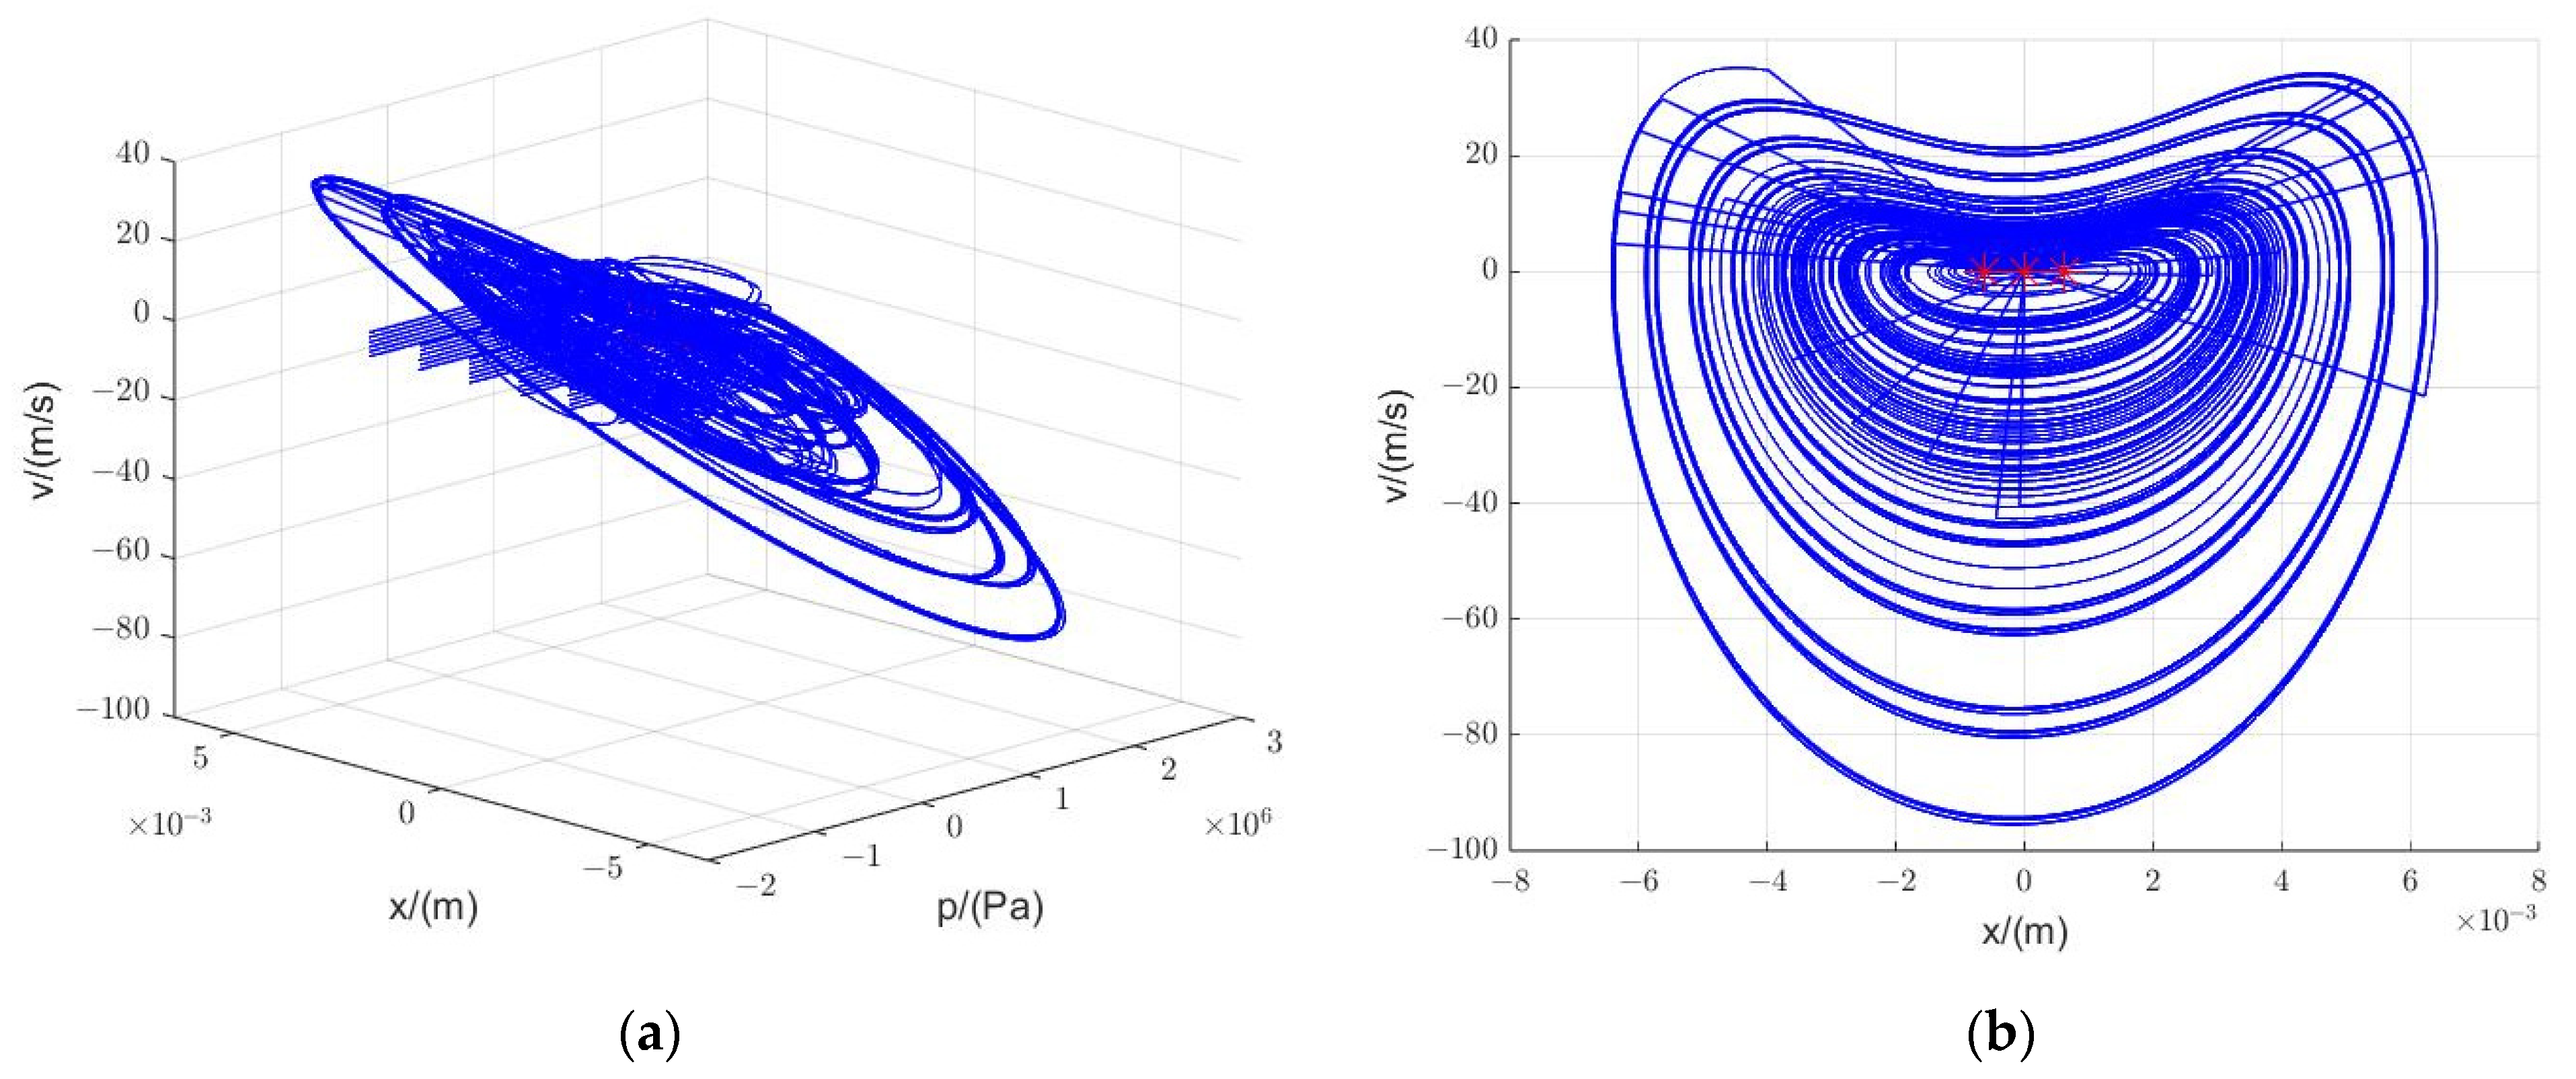
The phase plane plot of Equation (38) is shown in Figure 10.
Compared to Figure 7, the phase portraits in the fifth-order system are nearly consistent with those of the third-order system. It shows that the addition of an armature assembly does not change the stability of the servovalve.

3.2.3. Simulation

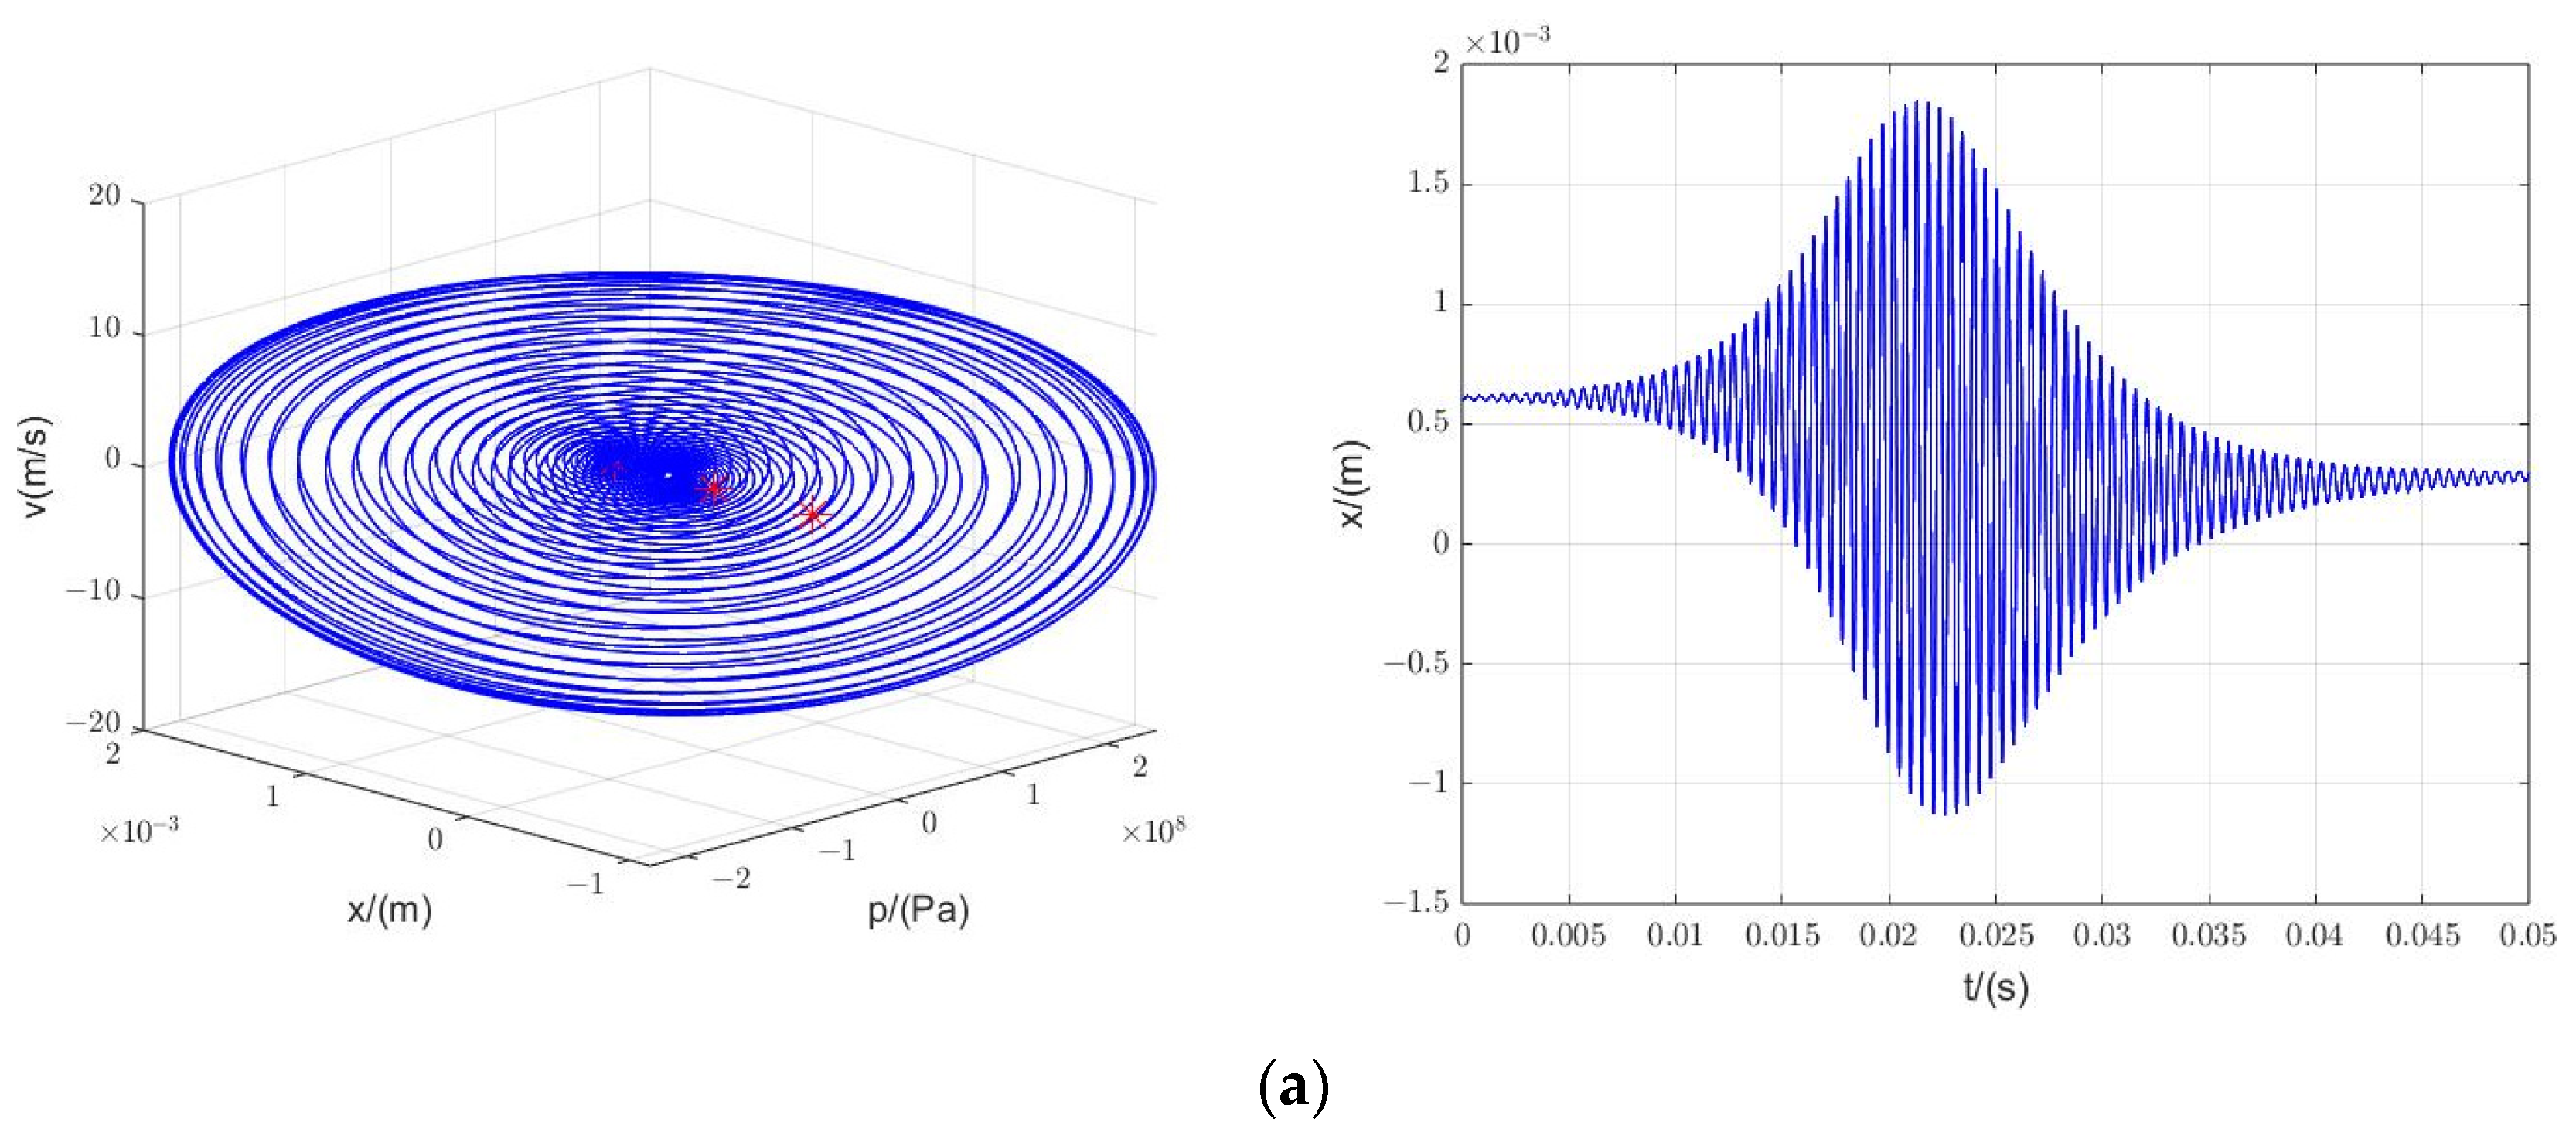
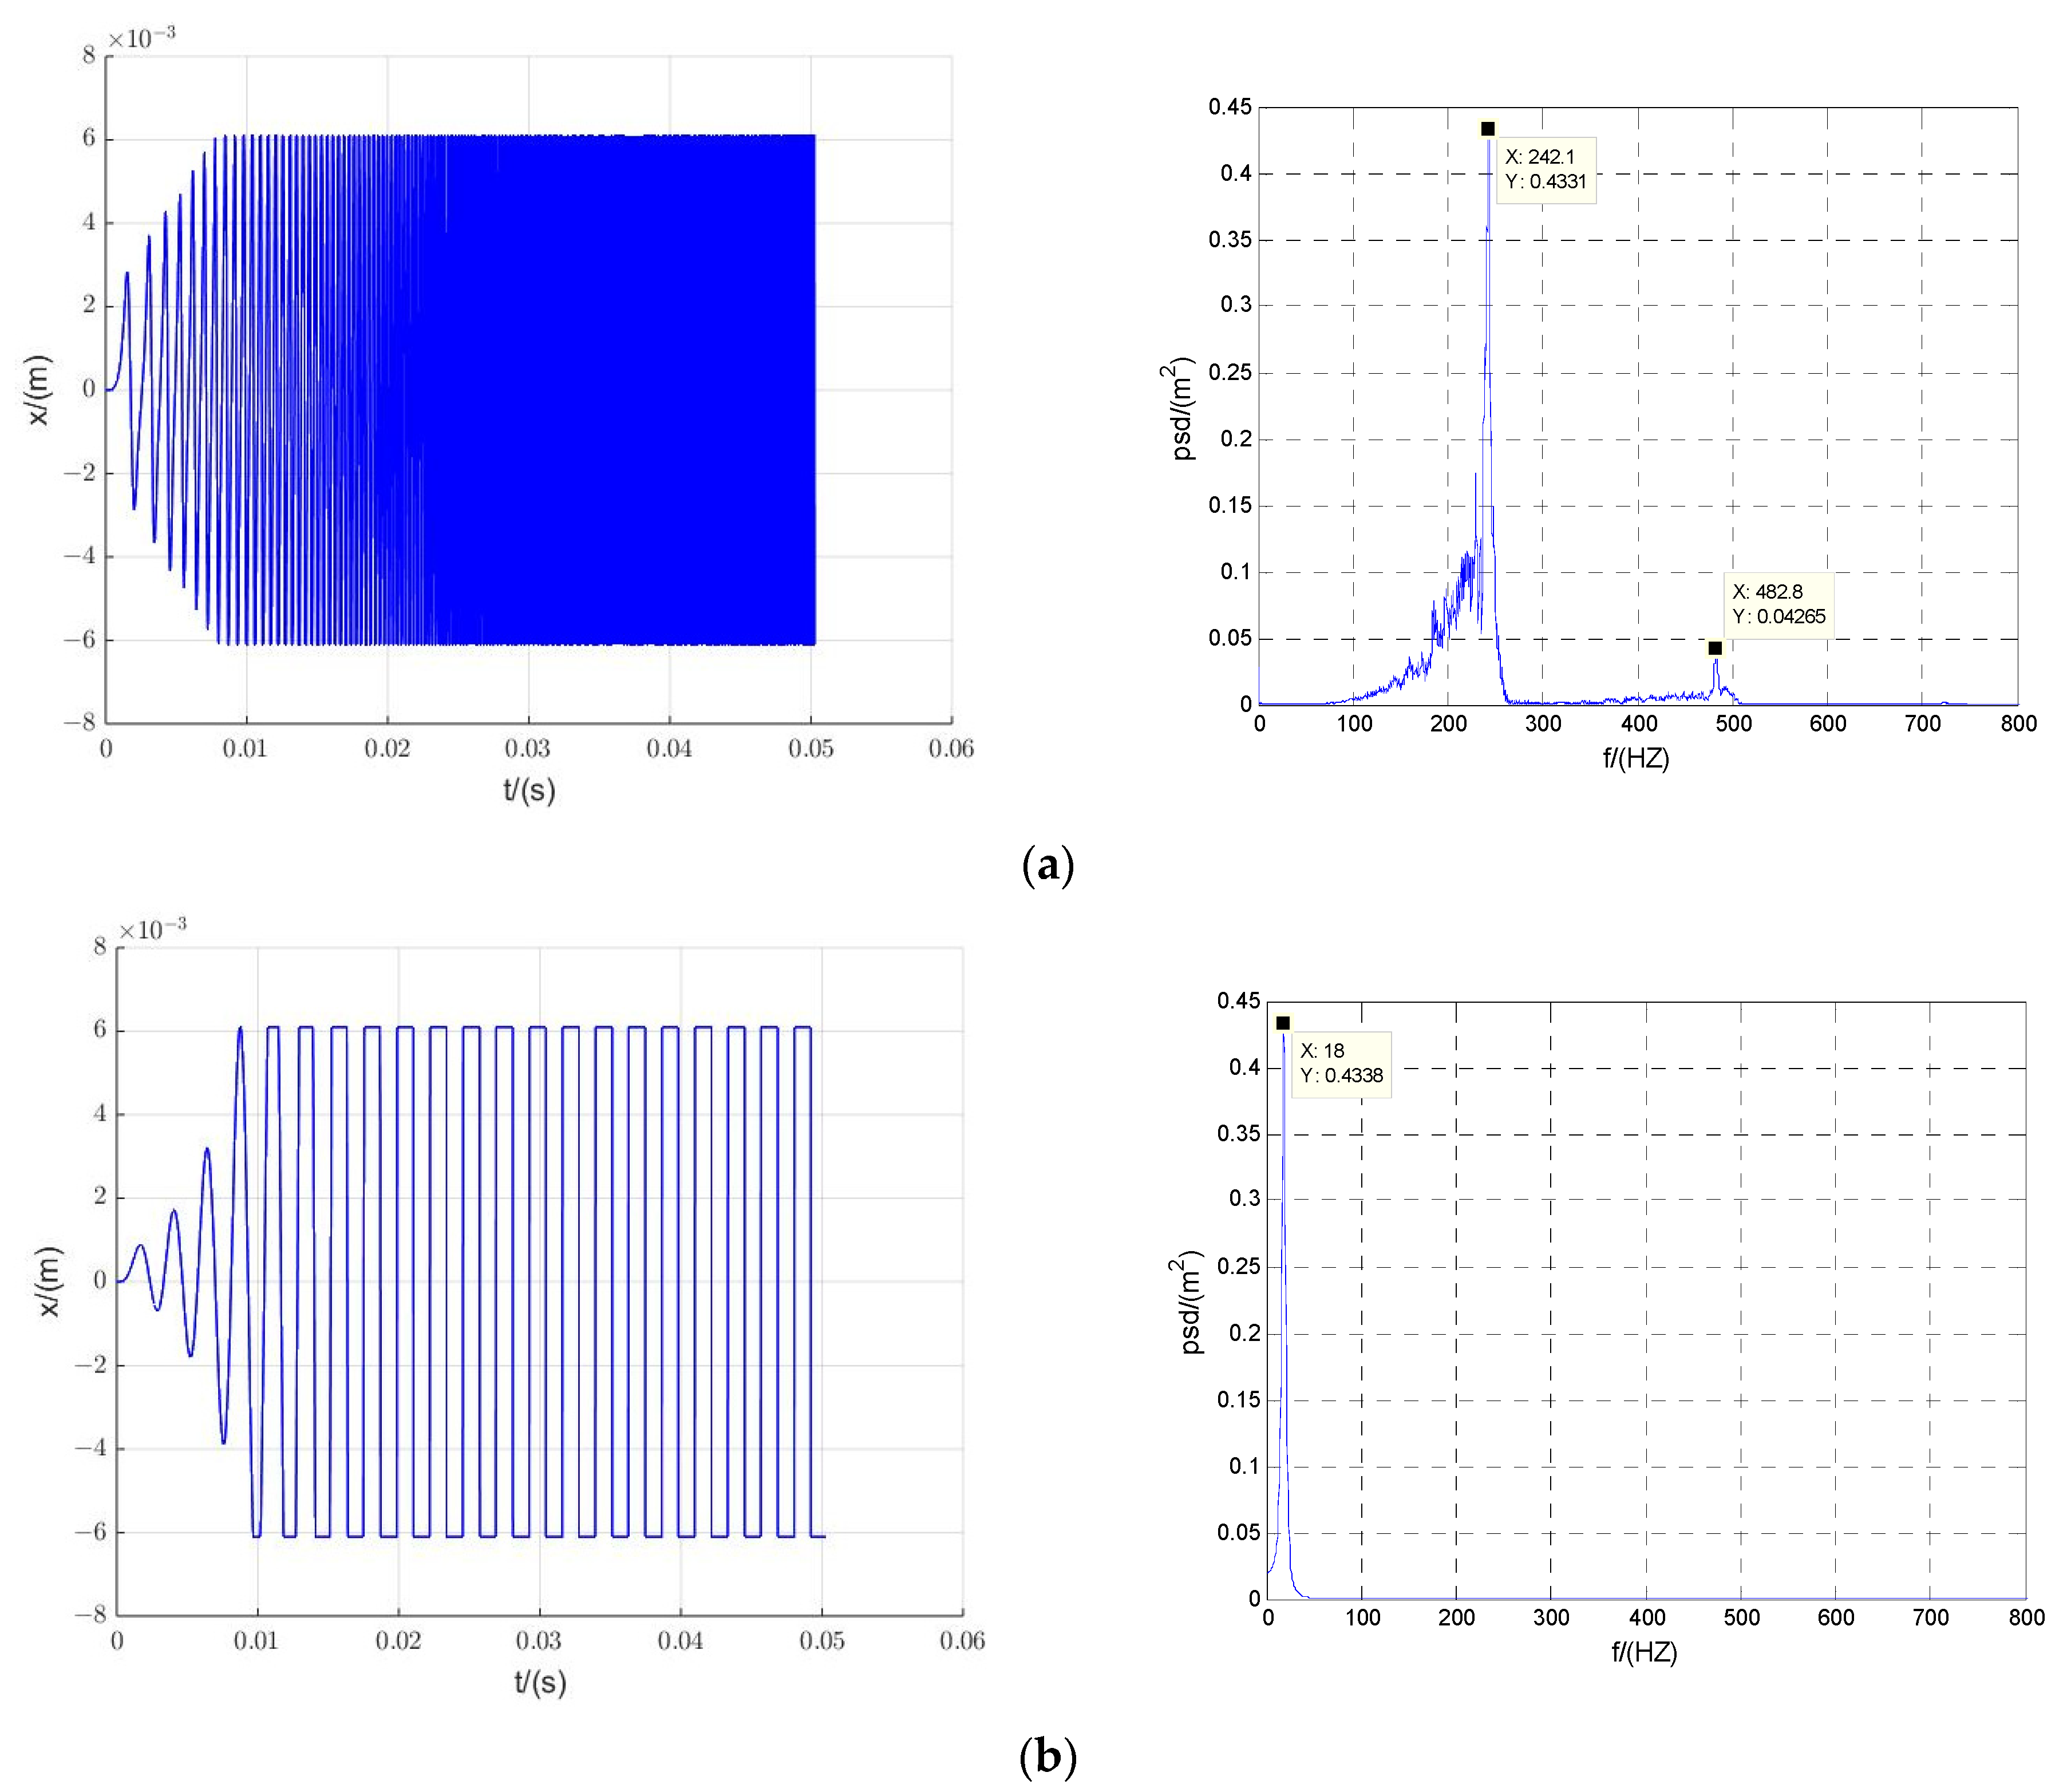
Setting the initial condition as (0, 0, 0) and the input signal as 0.1cos50t, Equations (32) and (33) are solved. The simulation results are shown in Figure 11, where the left figures show the curve of the spool displacement versus time, and the right figures show the power spectrum of displacement.
The displacement curves in Figure 11 show that the spool vibrates around the neutral position by the cosine signal and that the vibration frequencies are different for the two. The plots of power spectral density in Figure 11 illustrate the difference between the linear and nonlinear mathematical models. In the power spectrum diagram in Figure 11a, the peak appears at 242 Hz, which is consistent with the previous calculation. And the frequency of 483 Hz, nearly twice that of 242 Hz, suggests that there is a period-doubling motion of the spool. Only a single frequency of 18 Hz exists in the power spectrum diagram in Figure 11b, indicating that the linear model cannot explain the multiply-periodic motion.

4. Experiment

A test platform was built to test the performance of the jet pipe servovalve, as shown in Figure 12. The system consists of the following parts: an electrohydraulic position servo control system and a data acquisition system.
The electrohydraulic position servo control system has three parts: an oil source, a control valve, and an actuator. The oil source includes a piston pump, check valve, accumulator, and relief valve to ensure the oil supply pressure is 21 MPa. Auxiliary components include an oil filter to ensure that the oil is clean and a cooler to ensure that the oil temperature is controlled. Also, a 6-diameter jet pipe servovalve is adopted to control the servo actuator action, and a displacement sensor is used to transform the displacement of the servo cylinder piston into an electrical signal for feedback to the computer control system. The pressure sensor is placed near the outlet of the jet pipe servovalve to measure the change in oil pressure.
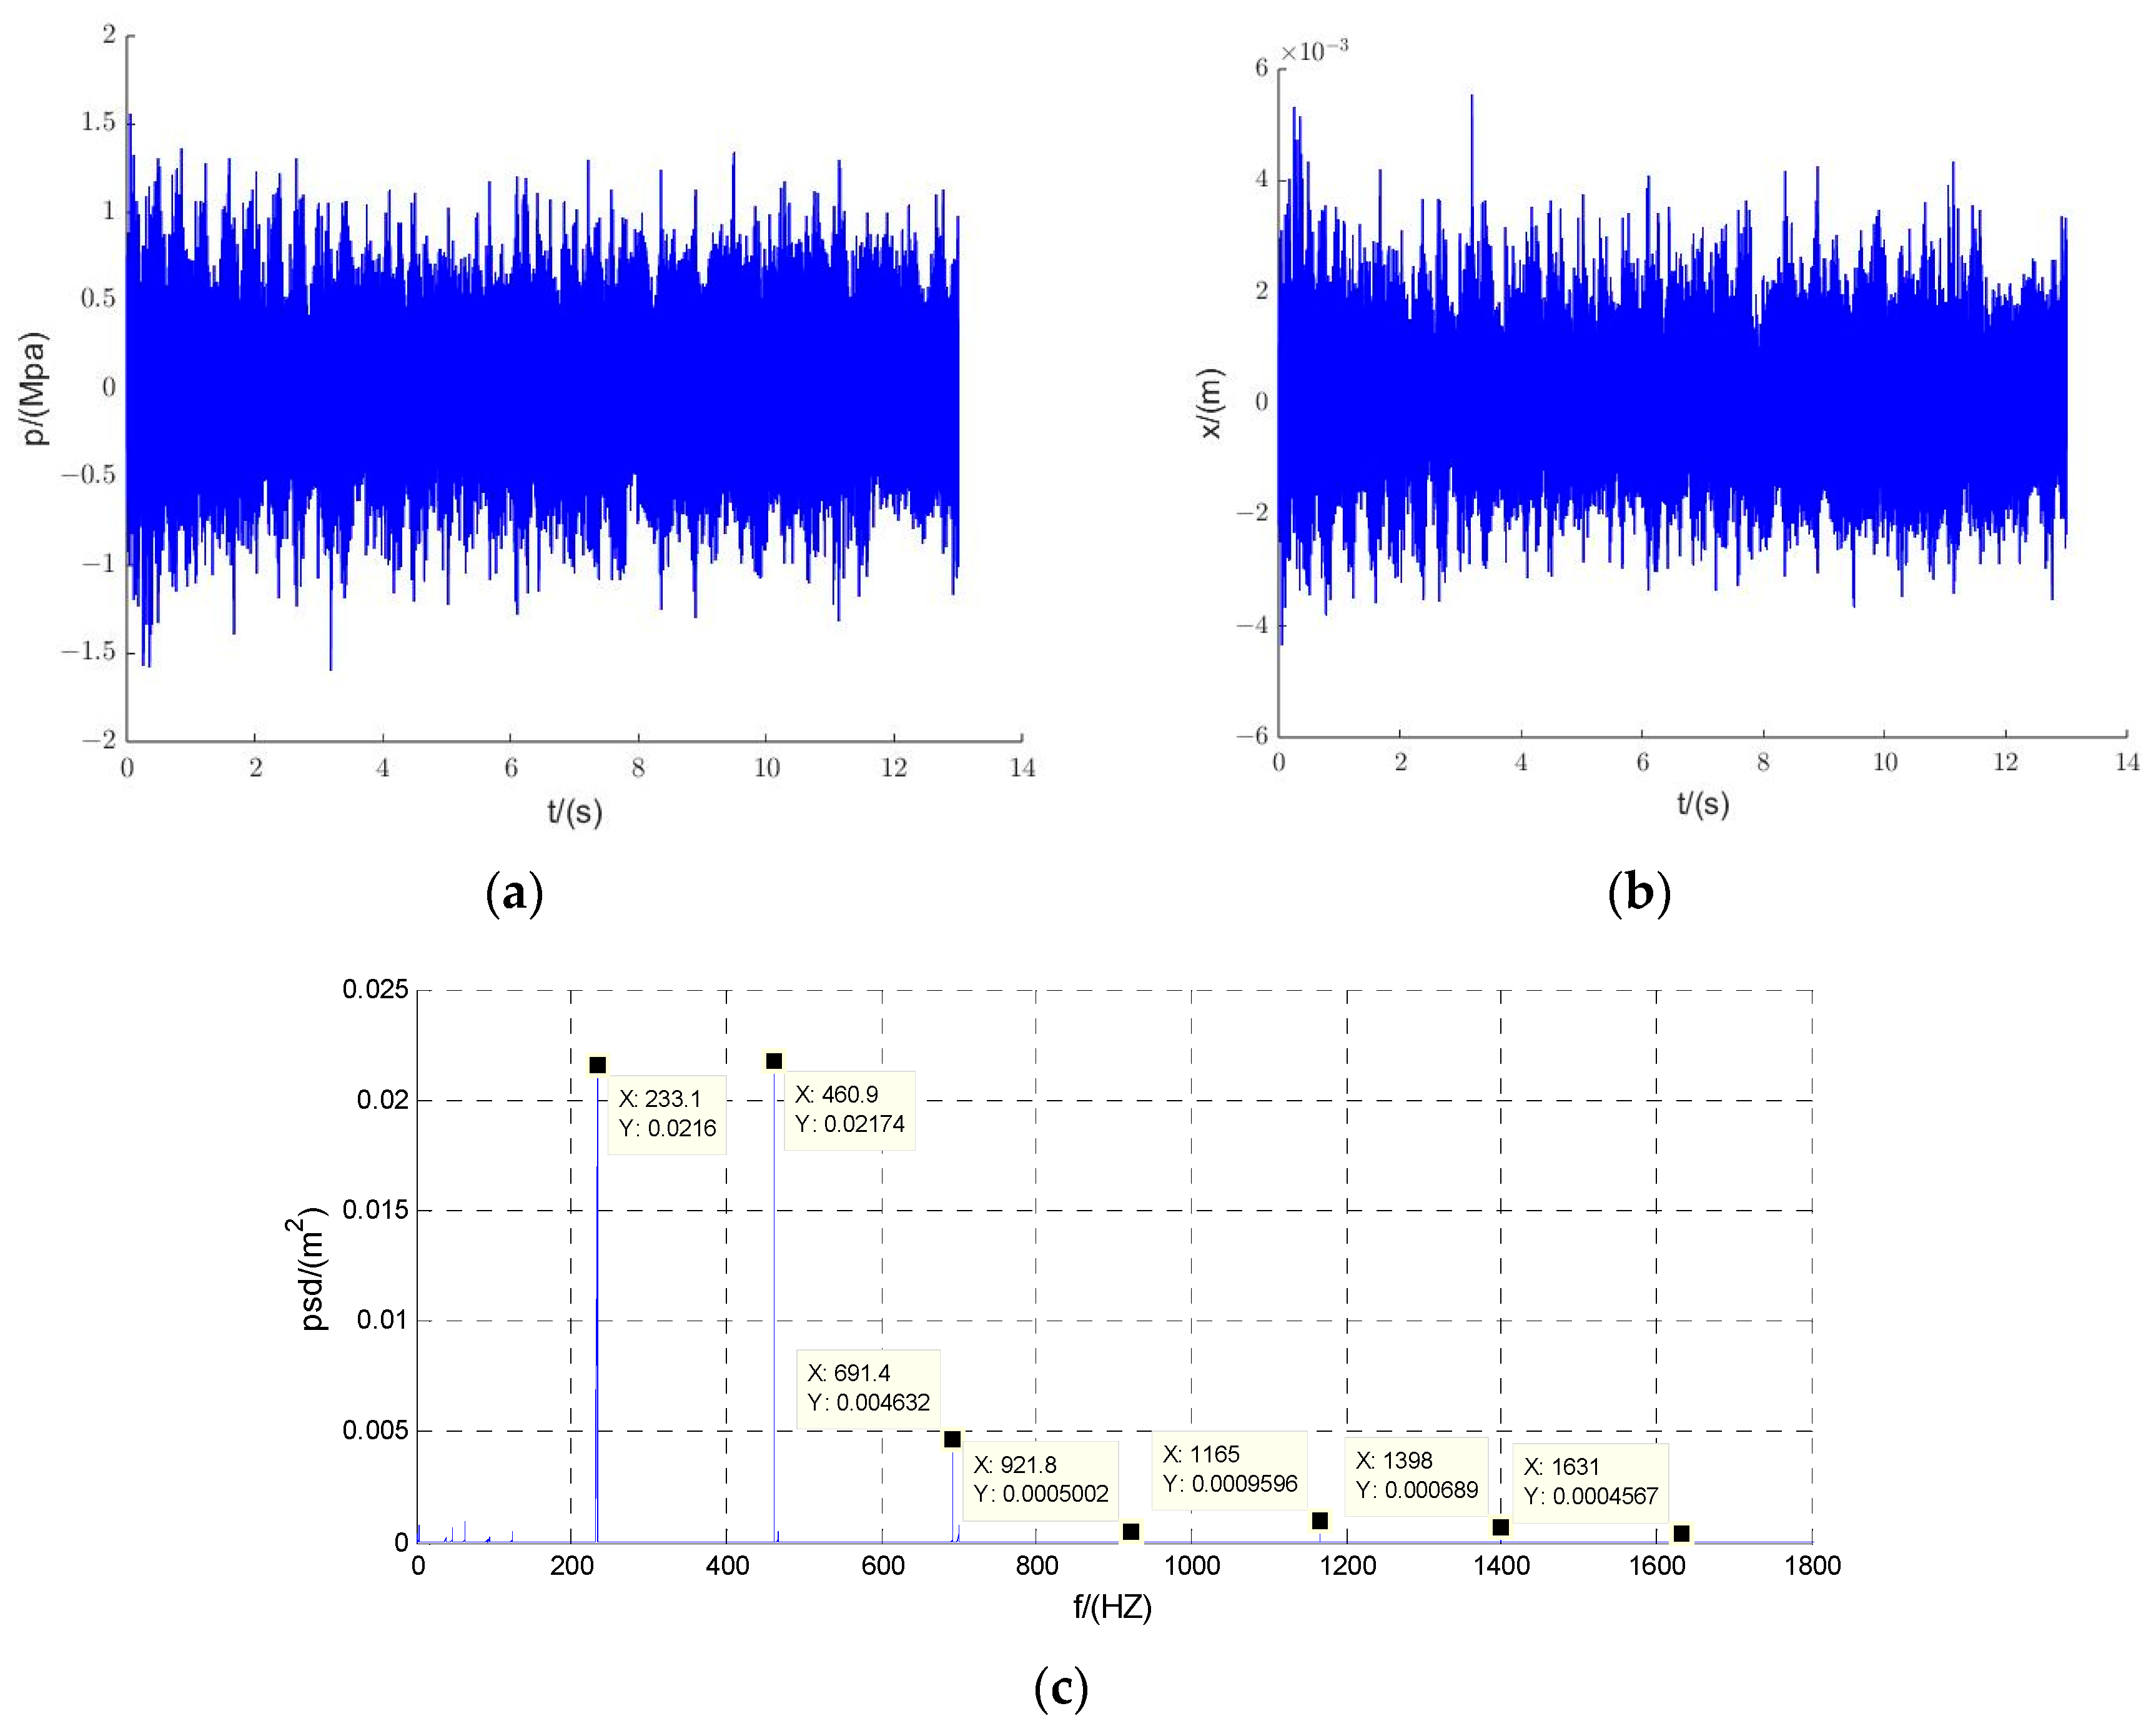
For the experiment, the piston pump is started to supply oil into the system. Enough oil is stored in the accumulator after the servo cylinder has been actuated a few times. The piston pump is turned off but still continues to control the opening and closing of the jet pipe servovalve using the accumulator to supply oil and eliminate the effect of piston pump vibration on the system. The resulting pressure change curve at the outlet of the servovalve is treated by the zero-mean method, and the obtained curve is shown in Figure 13a. The pressure signal is converted to the spool displacement curve according to the orifice equation, as shown in Figure 13b. The fast Fourier transform is performed on the displacement signal to obtain its power spectral density, as shown in Figure 13c.
From Figure 13c, it is observed that the vibration frequencies of the system are 233, 461, 691, 921, 1165, 1398, and 1631 Hz. This indicates that the spool motion during the action of the jet pipe servovalve is a multi-frequency vibration, and its single-period frequency is 233 Hz. The energy of the single-period and period-doubling motions is larger, and the corresponding power spectral density decreases more with the period-tripling motion.
The experimentally measured fundamental frequency of the spool motion in the servovalve is basically consistent with the theoretical value, with a relative error of about 3.9%. However, the analysis considers the spool motion to be a period-doubling motion. The reason for this difference may be that the theoretical analysis only considers the mechanical–hydraulic structure of the servovalve, while the experimental data have the influence of components, such as toque motor, accumulators, piping, and even actuators.
In addition, the assumption that the spool limits are forced in the simulation analysis does not correspond to the actual situation, which may also lead to the discrepancy between the experiment and theory. In the flow field of the second stage in a jet pipe servovalve, the viscosity and elasticity of the fluid will inevitably prevent a “hard collision” between the spool and the sleeve under extreme conditions. When the spool end of the cavity is extremely compressed, the compressed fluid produces a large enough pressure and damping force to push the spool in the opposite direction. Obviously, the physical description function of this phenomenon is segmentally smooth, and its global model is discontinuous on the macroscopic time scale.

5. Conclusions

During servovalve action, we consider the fluid–solid coupling motion between turbulence and spool in the second stage to be nonlinear. Based on the characteristics of the steady-state flow force and transient flow force, the nonlinear descriptions of both under the condition of a small opening are proposed, and the nonlinear kinetic equation of the main spool is further established.
The equations of a third-order closed-loop nonlinear system consisting of a jet pipe valve and a spool valve are developed, the frequency of the system destabilizing oscillations is calculated to be 235 Hz, and the local bifurcation properties of the system are investigated. When the jet pipe inclination angle is varied within ±0.175 rad, the system mostly undergoes period-doubling bifurcation. The study of the fifth-order closed-loop nonlinear system shows that the increase in armature assembly does not change the characteristics of the equilibrium points but slightly affects the distribution of the characteristic roots of instability, which increases the oscillation frequency to 242 Hz.
The vibration test of a jet pipe servovalve was carried out, and the results showed that the vibration frequencies with higher energy in the system were 233 and 461 Hz, which were similar to the theoretically calculated spool destabilization frequency of 242 Hz and the doubling period frequency of 484 Hz.
We try to establish a nonlinear mathematical model of servovalve and analyze the dynamic characteristics of the system based on nonlinear theory, providing a new perspective for the analysis and design of servovalves. However, in order to obtain a more accurate model, further theoretical work is needed, such as the description of the physical process of the reverse motion of the spool “collision” against the sleeve, the torque motor equations considering the asymmetry of the air gap, and the analysis of the global dynamics of the jet pipe servovalve.

Author Contributions

Methodology, X.K. and S.K.; software, S.K. and J.Z.; validation, J.Z. and R.D.; data curation, R.D.; resources, X.K. and J.Z.; formal analysis, J.Z.; writing—original draft preparation, S.K. and R.D.; writing—review and editing, X.K., S.K. and J.Z. All authors have read and agreed to the published version of the manuscript.

Funding

This research was funded by the National Natural Science Foundation of China, grant number 52275068; and the Key Project of Jiangsu Maritime Institute, China, grant number xjzd2020-5.

Data Availability Statement

Data are contained within the article.

Acknowledgments

This research would like to thank Zhu, J.X. and Wu, B.X. for their technical support.

Conflicts of Interest

The authors declare no conflicts of interest.

References

  1. Paolo, T.; Andrew, R.P.; Elia, D.; Riccardo, A. A review of electro-hydraulic servovalve research and development. Int. J. Fluid Power 2018, 20, 53–98. [Google Scholar]
  2. G77XK Doc. Jet Pipe Servovalve Installation and Operation Instruction. Available online: https://www.moog.com/content/dam/moog/literature/ICD/CDS33551_JetPipe.pdf (accessed on 9 February 2022).
  3. John, F.B.; Gerhard, R.; Shearer, J.L. Fluid Power Control, 1st ed.; The Technology Press of M.I.T.: Boston, MA, USA, 1960; pp. 235–245. [Google Scholar]
  4. Guo, S.R.; Yin, Y.B. Advanced Fluid Power Control, 1st ed.; Shanghai Science and Technology Press: Shanghai, China, 2017; pp. 266–272. [Google Scholar]
  5. Wu, L.; Chen, K.S.; Gao, Y. Research on cavitation phenomena in pilot stage of jet pipe servo-valve with a rectangular nozzle based on large-eddy simulations. AIP Adv. 2019, 9, 025109. [Google Scholar] [CrossRef]
  6. Fan, C.H.S.; Chen, T.F. Mathematical Model of Steady State Operation in Jet Pipe Electro-Hydraulic Servo Valve. J. Donghua Univ. 2013, 30, 269–275. [Google Scholar]
  7. Li, Y.S. Mathematical modelling and characteristics of the pilot valve applied to a jet-pipe/deflector-jet servovalve. Sens. Actuators A 2016, 245, 150–159. [Google Scholar] [CrossRef]
  8. Zhang, Y. Research on the Modeling and Simulation of Jet Pipe Servovalve. Ph.D. Thesis, Northwestern Ploytechnical University, Xi’an, China, 2015; pp. 39–58. [Google Scholar]
  9. Zhang, Y.; Xia, Y. Analysis and optimization of the pilot stage of jet pipe servo valve. Alex. Eng. J. 2022, 61, 41–50. [Google Scholar] [CrossRef]
  10. Kang, S.Q.; Kong, X.D.; Zhang, J.; Du, R.H. Research on Pressure-Flow Characteristics of Pilot Stage in Jet Pipe Servo-Valve. Sensors 2023, 23, 216. [Google Scholar] [CrossRef] [PubMed]
  11. Somashekhar, S.H.; Singaperumal, M.; Kuma, R.K. Mathematical modelling and simulation of a jet pipe electrohydraulic flow control servo valve. IMechE 2007, 221, 365–382. [Google Scholar] [CrossRef]
  12. Somashekhar, S.H. Modeling and simulation of fluid structure interaction in jet pipe electrohydraulic servovalve. Int. J. Recent Adv. Mech. Eng. (IJMECH) 2013, 2, 1–14. [Google Scholar]
  13. Li, R.; Nie, S.; Yi, M.; Ruan, J. Flow Characteristics Simulation of Jet Pipe Servo Valve Working in Different Medium Base on CFD. Mach. Tool Hydraul. 2011, 3, 10–12, 29. [Google Scholar]
  14. Zhao, K.Y.; Wu, Q.X.; Zhang, L.J.; Yuan, Z.H.; Yang, J.Q. Analysis of the Jet Pipe Electro-Hydraulic Servo Valve with Finite Element Methods; ICMME: Kuala Lumpur, Malaysia, 2017. [Google Scholar]
  15. Li, S.G.; Hu, L.M.; Cao, K.Q.; Xie, Z.G.; Cao, W. Modling and Simulation of Dynamic Characteristics of the Force Feedback Jet-pipe Servo Valve. Fire Control Command Control 2017, 42, 91–96. [Google Scholar]
  16. Yin, Y.B.; Gou, W.K.; Hu, Y.T.; Li, R.H. Modeling and frequency characteristics of jet-pipe servo valve considering eddy current effect. J. Aerosp. Power 2020, 35, 1777–1785. [Google Scholar]
  17. Chen, J.; Li, F.; Yang, Y.; Gao, Y. Mathematical Modelling and Hierarchical Encourage Particle Swarm Optimization Genetic Algorithm for Jet Pipe Servo Valve. Comput. Intell. Neurosci. 2022, 7, 9155248. [Google Scholar] [CrossRef]
  18. Gordić, D.; Babić, M.; Jovičić, N. Modelling of Spool Position Feedback Servovalves. Int. J. Fluid Power 2004, 5, 37–50. [Google Scholar] [CrossRef]
  19. Chen, J. Dynamic Simulation and Optimal Design and Control Method of Jet Pipe Servo Valve. Ph.D. Thesis, Northwestern Ploytechnical University, Xi’an, China, June 2017; pp. 11–40. [Google Scholar]
  20. Jelali, M.; Kroo, A. Hydraulic Servo-Systems Modelling, Identification and Control, 2nd ed.; Springer Ltd.: London, UK, 2003; pp. 58–59. [Google Scholar]
  21. Hayashi, S. Instability of poppet valve circuit. JSME Int. J. 1995, 38, 357–366. [Google Scholar] [CrossRef]
  22. Hayashi, S.; Hayase, T.; Kurahashi, T. Chaos in a Hydraulic Control Valve. J. Fluids Struct. 1997, 11, 693–716. [Google Scholar] [CrossRef]
  23. Licskó, G.; Champneys, A.; Hős, C. Nonlinear Analysis of a Single Stage Pressure Relief Valve. Int. J. Appl. Math. 2009, 11, 286–299. [Google Scholar]
  24. Hős, C.; Champneys, A.R. Grazing bifurcations and chatter in a pressure relief valve model. Phys. D 2012, 241, 2068–2076. [Google Scholar] [CrossRef]
  25. Bazsó, C.; Hős, C. An experimental study on the stability of a direct spring loaded poppet relief valve. J. Fluids Struct. 2013, 42, 456–465. [Google Scholar] [CrossRef]
  26. Hős, C.; Champneys, A.R.; Paul, K.; McNeely, M. Dynamic behaviour of direct spring loaded pressure relief valves connected to inlet piping: IV review and recommendations. J. Loss Prev. Process Ind. 2017, 48, 270–288. [Google Scholar] [CrossRef]
  27. Bouzidi, S.E.; Hassan, M.; Ziada, S. Self-excited vibrations of spring-loaded valves operating at small pressure drops. J. Fluids Struct. 2018, 83, 72–90. [Google Scholar] [CrossRef]
  28. Bouzidi, S.E.; Hassan, M.; Ziada, S. Experimental characterisation of the self-excited vibrations of spring-loaded valves. J. Fluids Struct. 2018, 76, 558–572. [Google Scholar] [CrossRef]
  29. Awad, H.; Parrondo, J. Hydrodynamic self-excited vibrations in leaking spherical valves with annular seal. Alex. Eng. J. 2020, 59, 1515–1524. [Google Scholar] [CrossRef]
  30. Merritt, H.E. Hydraulic Control Systems, 1st ed.; John Wiley &Sons, Inc.: New York, NY, USA, 1967; pp. 104–105. [Google Scholar]
  31. Yuan, Q.; Li, P.Y. Using Steady Flow Force for Unstable Valve Design: Modeling and Experiments. J. Dyn. Syst. Meas. Control 2005, 127, 451–462. [Google Scholar] [CrossRef]
  32. Manring, N.D.; Zhang, S. Pressure Transient Flow Forces for Hydraulic Spool Valves. J. Dyn. Syst. Meas. Control 2012, 134, 034501. [Google Scholar] [CrossRef]
  33. Frosina, E.; Senatore, A.; Buono, D.; Stelson, K.A. A modeling approach to study the fluid-dynamic forces acting on the spool of a flow control valve. J. Fluids Eng. 2017, 139, 011103. [Google Scholar] [CrossRef]
  34. Wang, C.H. Hydraulic Control System; China Machine Press: Beijing, China, 2004; pp. 40–42. [Google Scholar]
  35. Li, L.; Xu, W.X.; Tan, Y.F.; Yang, Y.S.; Yang, J.G.; Tan, D.P. Fluid-induced vibration evolution mechanism of multiphase free sink vortex and the multi-source vibration sensing method. Mech. Syst. Signal Process. 2023, 189, 110058. [Google Scholar] [CrossRef]
  36. Beltaos, S.; Rajaratnam, N. Impinging Circular Turbulent Jets. J. Hydraul. Eng. 1974, 100, 1313–1328. [Google Scholar] [CrossRef]
  37. Galal Rabli, M. Fluid Power Engineering, 1st ed.; The McGraw-Hill Companies, Inc.: New York, NY, USA, 2009; pp. 333–348. [Google Scholar]
  38. Amirante, R.; Catalano, L.A.; Tamburrano, P. The importance of a full 3D fluid dynamic analysis to evaluate the flow forces in a hydraulic directional proportional valve. Eng. Comput. Int. J. Comput.-Aided Eng. Softw. 2014, 31, 898–922. [Google Scholar] [CrossRef]
  39. Khalil, H.K. Nonlinear Systems, 3rd ed.; Publishing House of Electronics Industry: Beijing, China, 2017; pp. 5–7. [Google Scholar]
  40. Yan, Q.; Fan, X.H.; Li, L.; Zheng, G.A. Investigations of the Mass Transfer and Flow Field Disturbance Regulation of the Gas-Liquid-Solid Flow of Hydropower Stations. J. Mar. Sci. Eng. 2024, 12, 84. [Google Scholar] [CrossRef]
  41. Lee, S.Y.; Blackburn, J.F. Contributions to hydraulic control 2 Transient-flow forces and valve instability. Trans. ASME 1952, 74, 1013–1016. [Google Scholar] [CrossRef]
  42. Karris, S.T. Numerical Analysis Using MATLAB and Spreadsheets, 2nd ed.; Orchard Publications: Fremont, CA, USA, 2004. [Google Scholar]
  43. Hahn, B.D.; Valentine, D.T. Essential MATLAB for Engineers and Scientists, 7th ed.; Elsevier Ltd.: Oxfird, MI, USA, 2019. [Google Scholar]
  44. Lynch, S. Dynamical Systems with Applications Using MATLAB, 2nd ed.; Springer International Publishing: Cham, Switzerland, 2010; pp. 151–282. [Google Scholar]
  45. Ding, W.J. Self-Excited Vibration, 1st ed.; Tsinghua Press: Beijing, China, 2009; pp. 34–39. [Google Scholar]
  46. Kuznetsov, Y.A. Elements of Applied Bifurcation Theory, 1st ed.; Harbin Institute of Technology Press: Harbin, China, 2021; pp. 1–92. [Google Scholar]
  47. Strogatz, S.H. Nonlinear Dynamics and Choas, 2nd ed.; China Machine Press: Beijing, China, 2018; pp. 146–291. [Google Scholar]
Figure 1. Schematic of the jet pipe servovalve. (The red color indicates high-pressure oil in the flow channel, the blue color means low-pressure oil in the flow channel, and the yellow color shows that the fuel in the flow channel is the control fluid).
Water 16 00683 g001
Figure 2. Schematic diagram of the mechanical–hydraulic part of the servovalve when reversed. (The red color indicates high-pressure oil in the flow channel, the blue color means low-pressure oil in the flow channel, and the yellow color shows that the fuel in the flow channel is the control fluid. The directions of the arrows indicate the direction of the flow.).
Water 16 00683 g002
Figure 3. Force analysis diagram of armature assembly. (The red color indicates high-pressure oil in the flow channel, and the yellow color shows that the fuel in the flow channel is the control fluid. The directions of the arrows indicate the direction of the force or moment acting.).
Water 16 00683 g003
Figure 4. Schematic diagram of the main spool movement. (The red color indicates high-pressure oil in the flow channel, the blue color means low-pressure oil in the flow channel, and the yellow color shows that the fuel in the flow channel is the control fluid. The directions of black arrows indicate the direction of the flow. The directions of the magenta arrows indicate the direction of fluid pressure action. And the direction of the green arrow indicates the direction of spool movement).
Water 16 00683 g004
Figure 5. Schematic diagram to determine the damping length. (The red color indicates high-pressure oil in the flow channel, the blue color means low-pressure oil in the flow channel, and the yellow color shows that the fuel in the flow channel is the control fluid. The directions of the arrows indicate the direction of the flow.).
Water 16 00683 g005
Figure 6. The block diagram of the closed-loop system. (The red color indicates high-pressure oil in the flow channel, the blue color means low-pressure oil in the flow channel, and the yellow color shows that the fuel in the flow channel is the control fluid. The directions of the blue arrows indicates the drection of signal flow. The block diagrams along the direction of the green arrows form a closed-loop system.).
Water 16 00683 g006
Figure 7. Phase plane plot of the third-order system: (a) pressure–displacement–velocity and (b) displacement–velocity. (The red * denotes equilibrium point).
Water 16 00683 g007
Figure 8. Schematic representation of the effect of parameter K c p f j on the system. (a) K c p f j = 2.6 × 10 13 ; (b) K c p f j = 3.67590603 × 10 13 ; (c) K c p f j = 5.2 × 10 13 ; (d) K c p f j = 1.3 × 10 11 ; (e) K c p f j = 1.43899815 × 10 11 ; (f) K c p f j = 1.5 × 10 11 . (The red * denotes equilibrium point, and the magenta + represents the starting point.).
Water 16 00683 g008aWater 16 00683 g008bWater 16 00683 g008c
Figure 9. Bifurcation diagrams: (a) ω = 50 and (b) ω = 1000 .
Water 16 00683 g009
Figure 10. Phase plane plot of the fifth-order system: (a) pressure–displacement–velocity and (b) displacement–velocity. (The red * denotes equilibrium point.).
Water 16 00683 g010
Figure 11. The simulation results: (a) nonlinear equations and (b) linear equations.
Water 16 00683 g011
Figure 12. Hydraulic system schematic diagram.
Water 16 00683 g012
Figure 13. The experiment results: (a) measured pressure signal diagram, (b) converted spool displacement curve, and (c) the power spectrum diagram of displacement signal.
Water 16 00683 g013
Table 1. Simulation parameter list.
SymbolValueUnitSymbolValueUnit
β e 1.5 ×   10 9 Pa K t 1 −9.1245 ×   10 4 -
V 0 1.97 ×   10 7 m3 L 1.788 ×   10 4 -
A v 3.217 ×   10 5 m2 K q f j 2.232 ×   10 5 -
M v 3.92 ×   10 2 kg K c p f j 9.8065 ×   10 10 -
k f r 2.0 ×   10 3 N/m p s 2.1 ×   10 7 Pa
l f r 2 ×   10 2 m p t 5 ×   10 5 Pa
R j 1.4 ×   10 4 m h 2.865 ×   10 2 m
L j 6 ×   10 4 m J c j 5.32 ×   10 7 kg m2
K s 1 5.6713 ×   10 4 - B c j 8.938 ×   10 3 Nms/rad
K s 2 1.5833 ×   10 11 - l f 1.5 ×   10 2 m
Disclaimer/Publisher’s Note: The statements, opinions and data contained in all publications are solely those of the individual author(s) and contributor(s) and not of MDPI and/or the editor(s). MDPI and/or the editor(s) disclaim responsibility for any injury to people or property resulting from any ideas, methods, instructions or products referred to in the content.