Article

Integrated Geotechnical and Electrical Resistivity Tomography to Map the Lithological Variability Involved and Breaking Surface Evolution in Landslide Context: A Case Study of the Targa Ouzemour (Béjaia)

Centre de Recherche en Astronomie Astrophysique et Géophysique, Route de l’Observatoire, Algiers 16340, Algeria
*
Author to whom correspondence should be addressed.
Water 2024, 16(5), 682; https://doi.org/10.3390/w16050682
Submission received: 4 October 2023 / Revised: 28 November 2023 / Accepted: 29 November 2023 / Published: 26 February 2024
(This article belongs to the Special Issue Risk Analysis in Landslides and Groundwater-Related Hazards)

Abstract

:
The specific lithology of the southern part of Bejaia city represents a major limitation to urban settlement and expansion. This is partly due to landslides that tend to affect this region. To date, one of these landslides in this region has occurred in the Targa Ouzemour area, where the damage extended approximately six hectares. The main purpose of this study is to identify the failure surfaces characterizing the internal structure of this landslide as well as the significant influence of groundwater on slope instability, which manifests as surface cracking and subsidence. We have combined several geotechnical and geophysical methods, including field observations. The exploitation of the collected geotechnical data from the six (06) boreholes drilled in the landslide zone has allowed for knowledge to be gained on the lithological components, as well as the characterizations of physical and mechanical properties on a range of different types of affected rocks, whereas electrical resistivity tomography (ERT) data allowed an in-depth examination, leading us to reconstruct the landslide geometry and particularly to evaluate the hydrological characteristics of the studied site. Moreover, the resistivity contrast patterns provided more clarity to discern between the various lithological formations that are still stable or actively moving within this landslide. All these findings have contributed to the construction of a characteristic geomodel that highlights the failure surfaces over which displacement is still experienced. Finally, with the evidence of rainfall effects on the deformation and stability of the slope, specific landslide remedial measures were accordingly suggested.

1. Introduction

In a broad sense, landslides can be described as mass movement phenomena. Frequently, these mass movements are attributed to the downward movement of slope-forming material along a specific shear plane [1]. Notice that geological processes associated with landslides are very complex geological phenomena [2,3]. Many factors can thus lead to such phenomena, which generally consist of natural and triggered factors [4,5,6,7].
Their in-depth characterization involves several geoscience disciplines, namely, geotechnical methods of destructive and non-destructive testing [8,9] complemented by geophysical ones, e.g., [10]. Among these disciplines, an increasing use of subsurface geophysics has been noted during the last two decades [11]. The study of a complex landslide necessarily involves field observations and geological, geotechnical reconnaissance campaigns involving drilling and laboratory tests. Although such surveys may provide an accurate structural overview of the landslide, they remain insufficient to determine the role and effect of groundwater on landslide instability and reactivation. They provide only local information about the lithology and the surface of the landslide, in addition to the characterization of some physico-mechanical parameters related to the depth below the surface. The geophysical techniques represent a suitable complementary tool to the geotechnical investigation campaign, especially when the morphology of the sliding surface has to be characterized [12,13]. The limitations of geophysics are generally related to the non-uniqueness of the solution, depth-dependent resolution and detection. Nevertheless, geophysics remains non-invasive and flexible in its application, for example, its application in complex environments such as slopes and/or landslides. Due to the indirect information provided by geophysics, especially in the context of landslides, calibration with geological and geotechnical datasets should be crucial to ensure credible interpretations [14] and references therein.
Among the most widely used geophysical methods for landslide investigations, electrical resistivity tomography (ERT) is systematically envisaged, e.g., [13,14,15,16,17,18,19]. When combined with geotechnical investigations, this will yield more information on the reconstruction of landslide structure, the geometry of the failure surfaces and, in particular, the hydrological characteristics of the studied site. Broadly speaking, the principle of the ERT method consists of injecting a direct current into the ground between two electrodes and measuring the resulting potential between another pair of electrodes. The ERT measurement process is based on a series of ER measurements along with linear arrays of electrodes and their spatial distribution in the subsoil. As a result, a 2D image of the subsurface resistivity can be automatically generated within the programming of measurements according to the selected geometry of the electrode arrays. Because of their improved horizontal resolution and suitable depth coverage, the Wenner–Schlumberger and dipole–dipole arrays are the most commonly selected geometry arrangements for these electrode arrays (e.g., [6] and references therein).
Historically, rainfall combined with geological formation has played an im-portant role in triggering landslides in the Bejaia region. The combined occurrence of these natural potentially threatening phenomena could generate significant losses in human life, as well as considerable socio-economic consequences. However, the northern part of the region remains threatened by different types of natural hazards [11,12,13,14,15,16,17,18,19,20]. As a causal relationship usually co-exists between rainfall and landslides, this raises more concerns about landslides, especially in this vulnerable part of the region. In our study area, located about 180 km east of Algiers along the Mediterranean coastline, such a natural phenomenon is very worrying. Nowadays, the whole east-coastal region is under serious threat [21]. The landslide phenomenon is being increased in the region owing to modern infrastructure projects, new economic resources and high population density, as well as the interaction of geological, geomorphological, seismic and climatic factors.
There is some evidence of both ancient and recent instability observed locally in the municipality of Béjaïa and its surroundings. Significant mass movements of different types have been identified during geological investigations in this region. These include the Targa Ouzemour, Ighiel Ouazoug, and Aiguades landslides, as well as the rockslides and collapses of Djebel Gouraya and Sidi Boudrahem [21,22]. Geomorphologically, the most pronounced ones occur in particular in Mio-Pliocene clayey-marly formations, and in Upper Cretaceous clays, marls and marly limestones, and in Neocomian shale marls [22].
The Targa Ouzemour landslide occurs in Miocene marly clay with few sand formations. It represents the largest landslide area in the southern part of the Bejaïa region. It represents a significant risk and therefore a high priority because of its reactivation and location downstream from a university campus. The main deformation and damage extend to about six hectares (6 ha). A previous geotechnical study was conducted in the landslide area to identify the geological, geotechnical and hydrogeological characteristics of the landslide area (Soummam, 2012). Despite the availability of a good geological and geotechnical synthesis, the study did not reveal the origin and importance of the groundwater presence on landslide reactivation; as well, the failure surface geometry remains unknown.
The aim of this study is to characterize and delineate the evolution of the landslide, the deformation characteristics and the geometry of the failure surface, taking into account the effect of groundwater on the saturation of the stratified marly clays and backfills. The ERT method was applied along with distinctive profiles where geotechnical data were available. The use of a combination of geological, geotechnical and geophysical investigations provided useful information for identifying the geometry of the failure surface and/or defining the internal structure of the investigated landslide. All of these issues are further discussed below after the new mapping of the horizontal and vertical extent of the instability and landslide remedial.

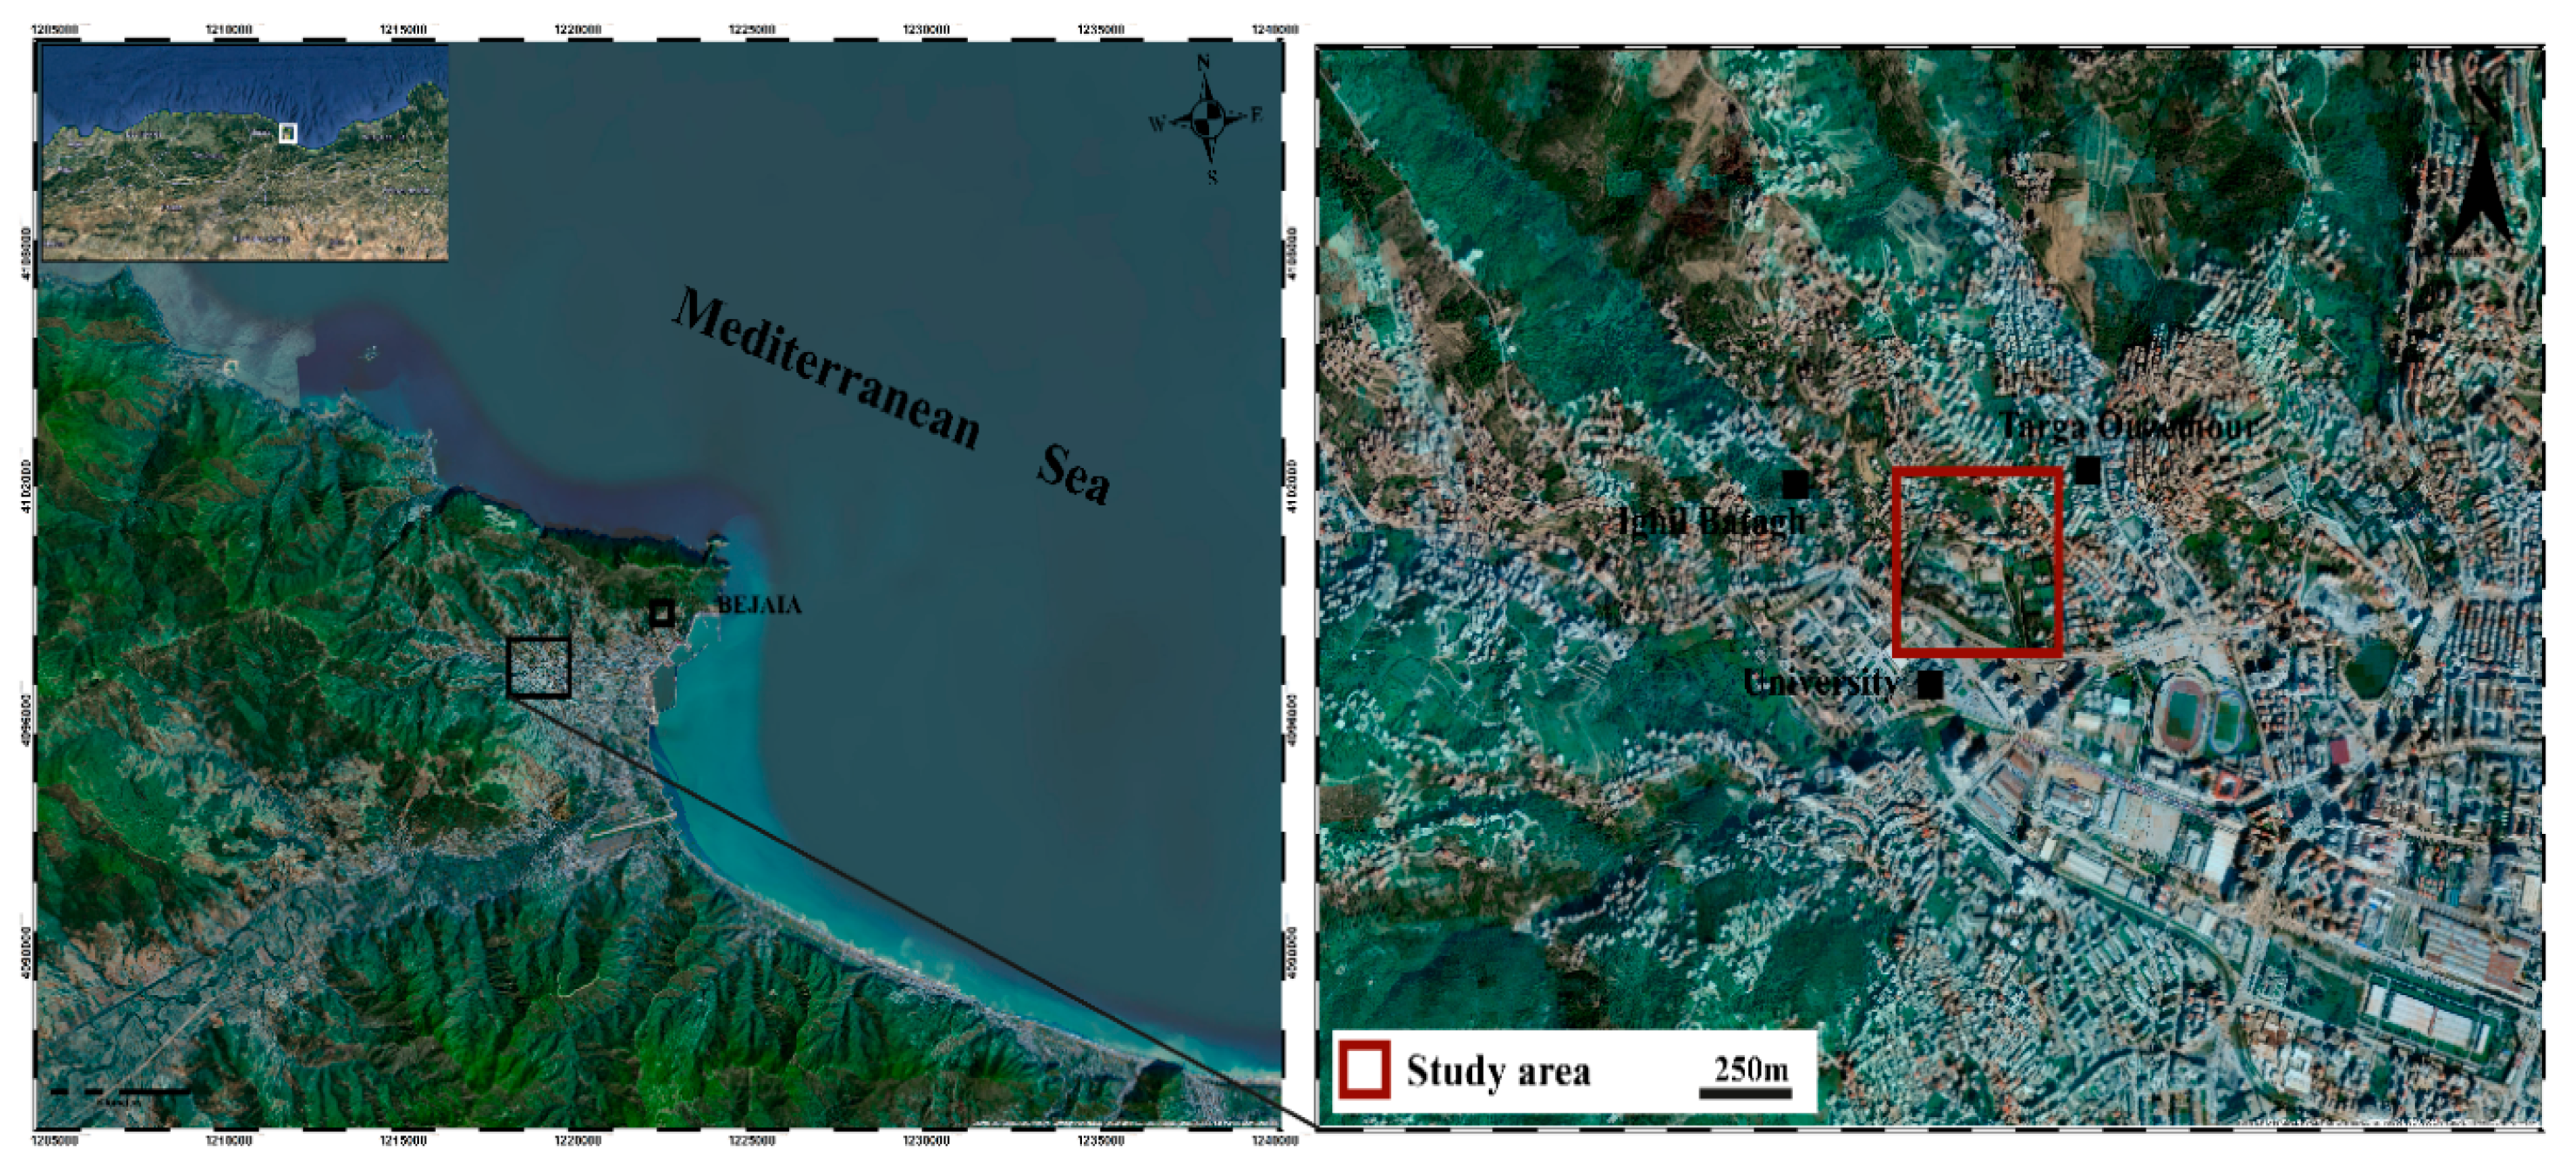
2. Description of the Study Area

The landslide occurred in Targa Ouzemour village, situated in the southern region of Béjaïa prefecture (Wilaya) (Northeast Algeria) and about 180 km east of the Algerian capital, Algiers. Nowadays, the Targa Ouzemour landslide remains one of the main urban hazards, which threatens this southern sector of Béjaïa city (Figure 1). More precisely, it is bounded towards the North and East by Targa Ouzemmour village, southwards by Abd Arahmane Mira University, and to the West by Ighil Batagh village. As a consequence of the landslide, considerable damage has occurred to the surrounding infrastructure and threatens the entire region. The affected area extends over approximately 6 Ha. However, the most severely affected infrastructures include the university campus of Béjaïa “Abd Arahmane Mira University”, in particular its upstream part and the downstream side of the university residence of “Targa Ouzemmour”, adjacent to the campus (Figure 2).
The detailed regional geology, including the landslide zone (Figure 3), has been widely documented early from the original pioneering works [23,24,25]. Referring to these pioneering works, the landslide area is part of the Brek–Gouraya unit of the Babors range, which belongs to the external zones. The stratigraphic succession within this unit starts with a Triassic clay-evaporite, marl-gypsum and sandstone formation [25,26,27]. For the Jurassic, it is mainly composed of calcareous and calcareous-dolomitic levels with conglomerates transitions, which are also well represented in this unit within the Jebel Gouraya. The Cretaceous deposits outcrop in the region upon two different lithological units, known as the Pelitic and the Marly schisto-sandstone formations. The Paleogene is mostly present along the southern part of the region, in which the Paleocene is marly pelitic while the Eocene is calcareous to marly afterward. The marine Mio-Pliocene comprises blue marls, which develop over almost 15 km within the Soummam depression [28,29]. In contrast, according to Leikine (1971) [26] and Hassissene (1989) [27], the continental Pliocene consists of consolidated breccia outcrops bearing very large elements derived from the Jurassic limestones. Specifically, the displaced mass is marked by a succession of marls with varying degrees of sandy with clayey thin interlaying, and colluvium accumulating locally which can be found superficially.
Geomorphologically, the Targa Ouzemour landslide occurs on a slope forming the foothill of the Djebel Bouzegua with a slope dipping toward the south at an angle of 5°–12° and composed of clayey-marly deposits. Following its upstream evolution, the main scarp marking the new upper limit is located upstream of the residential blocks at an altitude of 56 m (above sea level), and the landslide toe is located just upstream of the university boundary wall.
Due to its climatic conditions of “Mediterranean type”, this region is characterized by an important rainfall, with an average annual height that exceeds 900 mm/year. The rainfall is distributed during three seasons of the year, is very wet and spreads from October to March. The rainfalls are for the most part in the form of thunderstorms and torrential rains. The field observations in the Miocene formations show the existence of a highly developed hydrographic hairy behavior with mudflows and landslides. This behavior shows the effect of precipitation on the Miocene formations and the gravity phenomena control. For example, the landslide which underwent such interaction occurred around the village of Aokas, about 25 km from Bejaia. Its reactivation was triggered by the heavy rainfall of 13 March 2012 [21].

3. Materials and Methods

In order to understand the landslide mechanism and the groundwater effect on landslide reactivation in more detail, we have used and analyzed the available data from the geological-geotechnical investigation campaign carried out by the Soummam laboratory (2012), and a complementary investigation campaign by using electrical resistivity tomography (ERT) geophysical imaging of the subsoil carried out by (CRAAG, 2021). The landslide evolution mapping was based on a field investigation, high-resolution Google Earth photos and the interpretation of aerial photographs.
In order to characterize the geological formations affected by the landslide, the geological data of the Targa Ouzemour landslide and surrounding areas were obtained from the Bejaia geological map at a scale of 1:50,000 and various field mapping missions. The geotechnical available study to date on the Targa Ouzemour landslide was that conducted by the “Soummam laboratory” in 2012, including those dealing with geological fieldwork and geotechnical drilling. During this campaign, six (06) boreholes in total have been completed, covering a range of different types of affected rocks (Figure 4). The laboratory tests and analyses carried out on 18 samples were essentially focused on the lithological components, as well as physical and mechanical property characterizations.
For the hydrogeological conditions, investigations were carried out on a domestic water well located upstream of the landslide. This follow-up study concerns groundwater level fluctuations and their influence on weathering and stability.
In order to understand and delineate the deformation mechanisms and movement patterns associated with the Targa Ouzemour landslide, our investigations have been focused on the entire landslide area, primarily on its upstream part that coincides closely with the university residence stadium (Figure 4). There are a number of landslide-related deformation markers visible in the stadium area (Figure 2). The latter was chosen considering a relatively relief-free topography that makes geophysical investigations quite achievable. Moreover, the geotechnical boreholes are available at this location.
At the Targa Ouzemour landslide, electrical resistivity tomography (ERT) measurements were carried out by CRAAG in 2021; the ERT profiles were performed using the ABEM Terrameter LS 2 resistivity meter. By using an array of measurement electrodes, the Wenner–Schlumberger and dipole–dipole arrays were the most commonly tested on each profile data acquisition to improve horizontal resolution and suitable depth coverage. In total, three ERT measurements were carried out and each one measured 115 m in length (Table 1). The first two profiles were oriented perpendicular (P1, P2) and the third one (P3) was parallel to the landslide directional movement (Figure 4). The obtained apparent resistivity data were then reversed using RES2DINV version 4.8 software [23]. The individual models were selected after five iterations, after which the root mean square (RMS) remained significantly unchanged.
It was specifically around this university residence where geotechnical and geophysical investigations were carried out. The conducted geotechnical program and the ERT profiles from the geophysical investigation campaign are shown in Figure 4.
To analyze the landslide indices with different surface deformation characteristics, the failure surface morphology, the groundwater depth and the internal structure of the landslide, our analysis is focused on (1) field observations and boundary mapping of the landslide extension; (2) analysis of the available geological, hydrogeological and geotechnical investigations carried out by the Soummam laboratory; (3) analysis and interpretation of the available geophysical investigations (electrical resistivity tomography (ERT) measurements carried out by CRAAG in 2021.

4. Results and Discussion

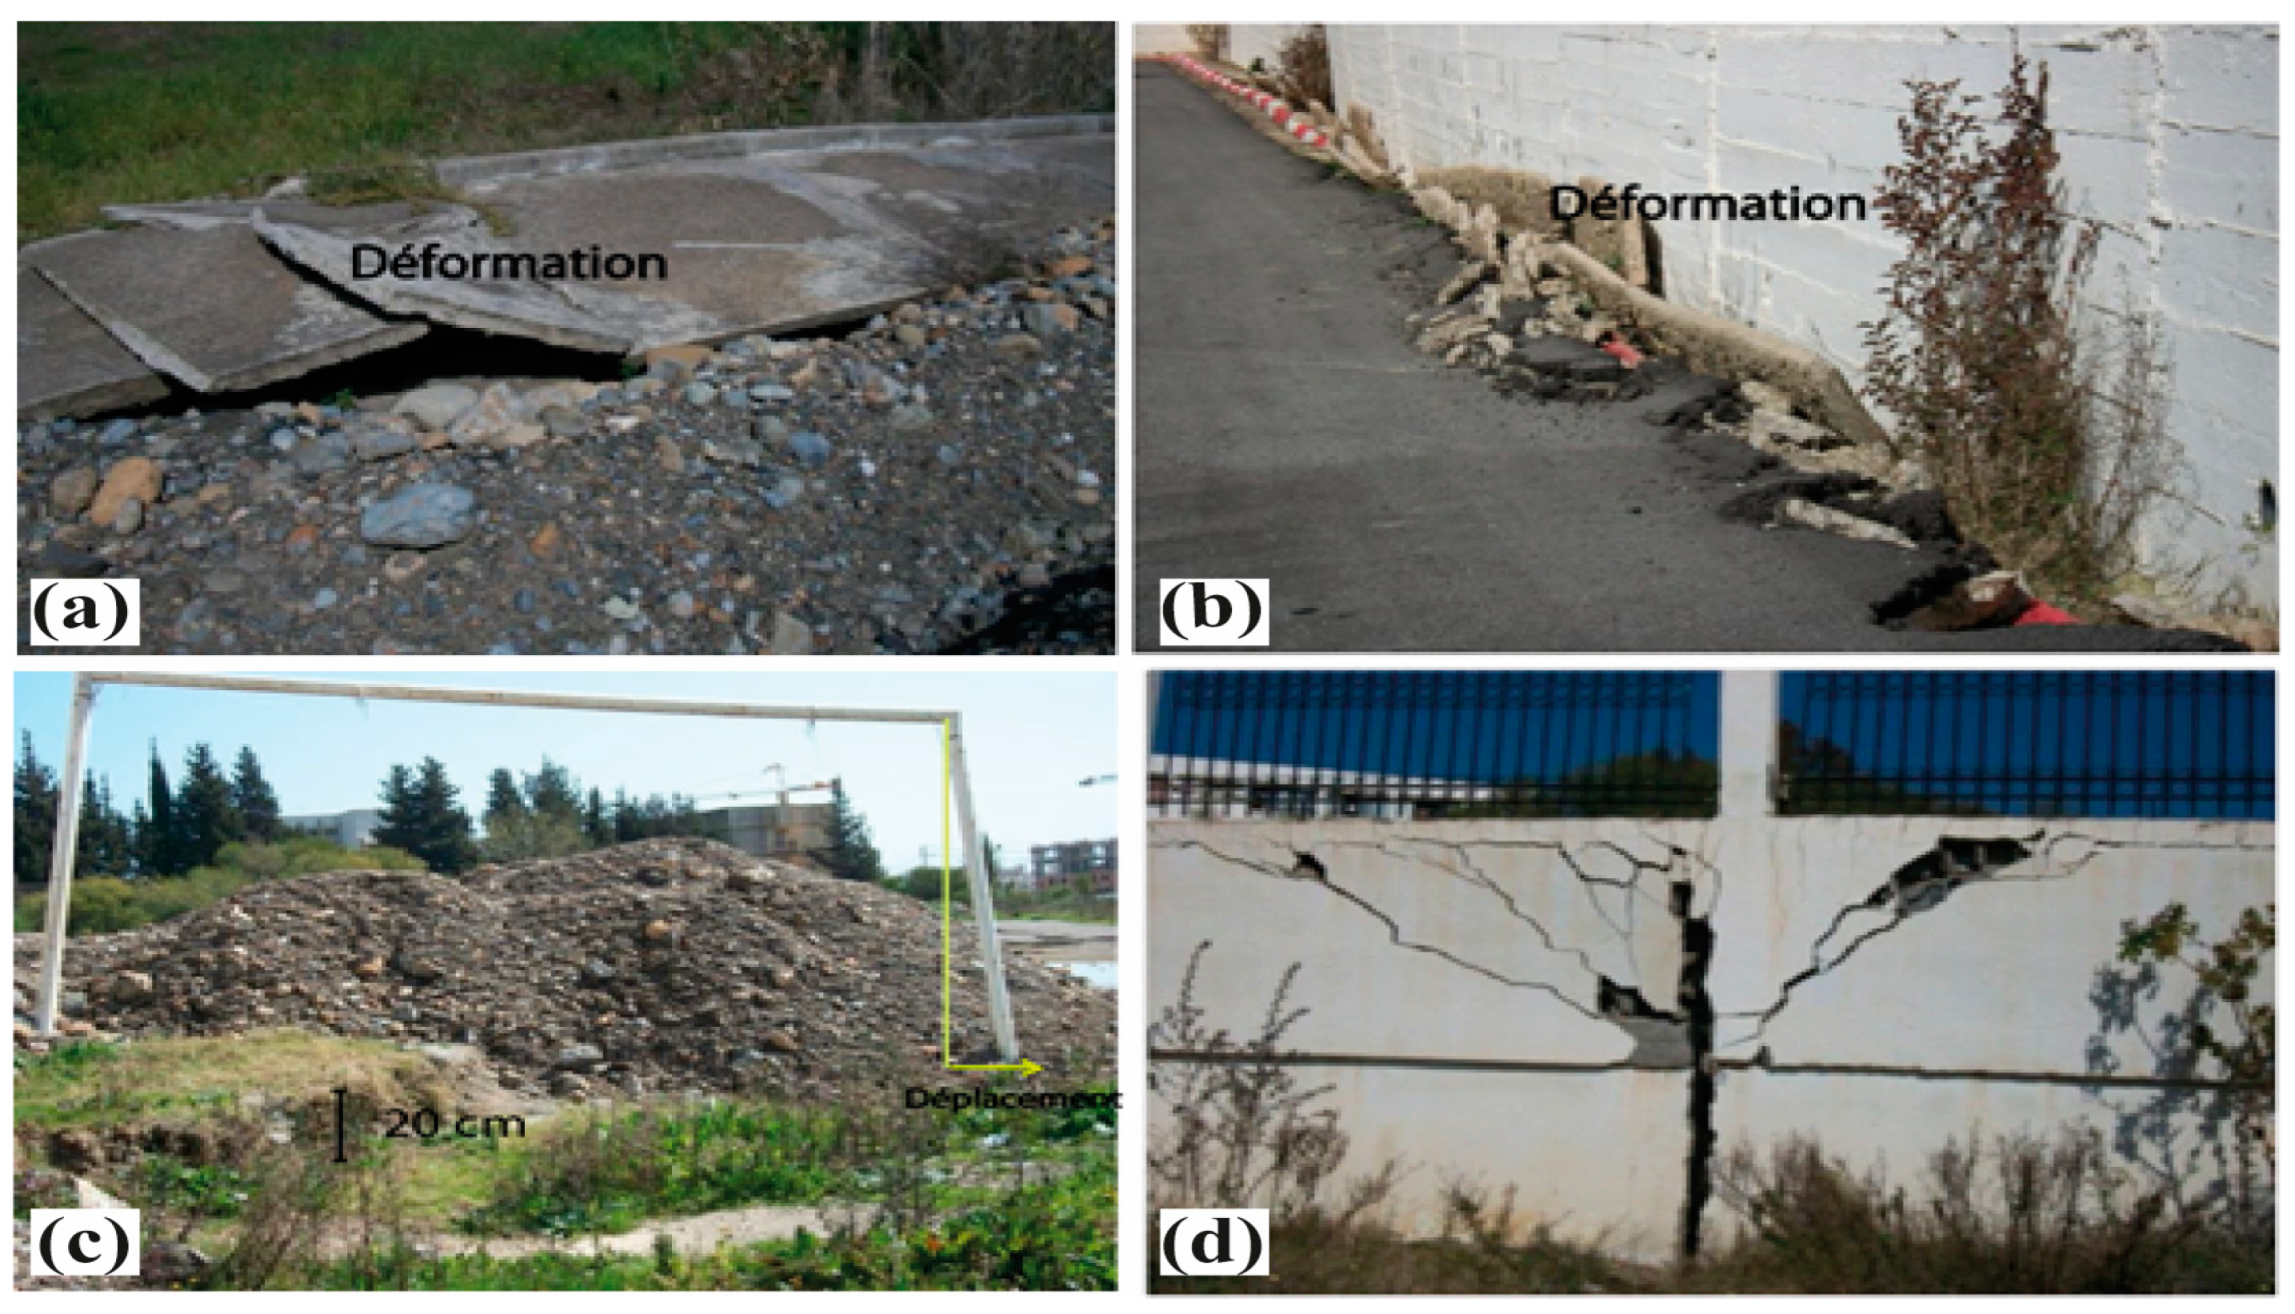
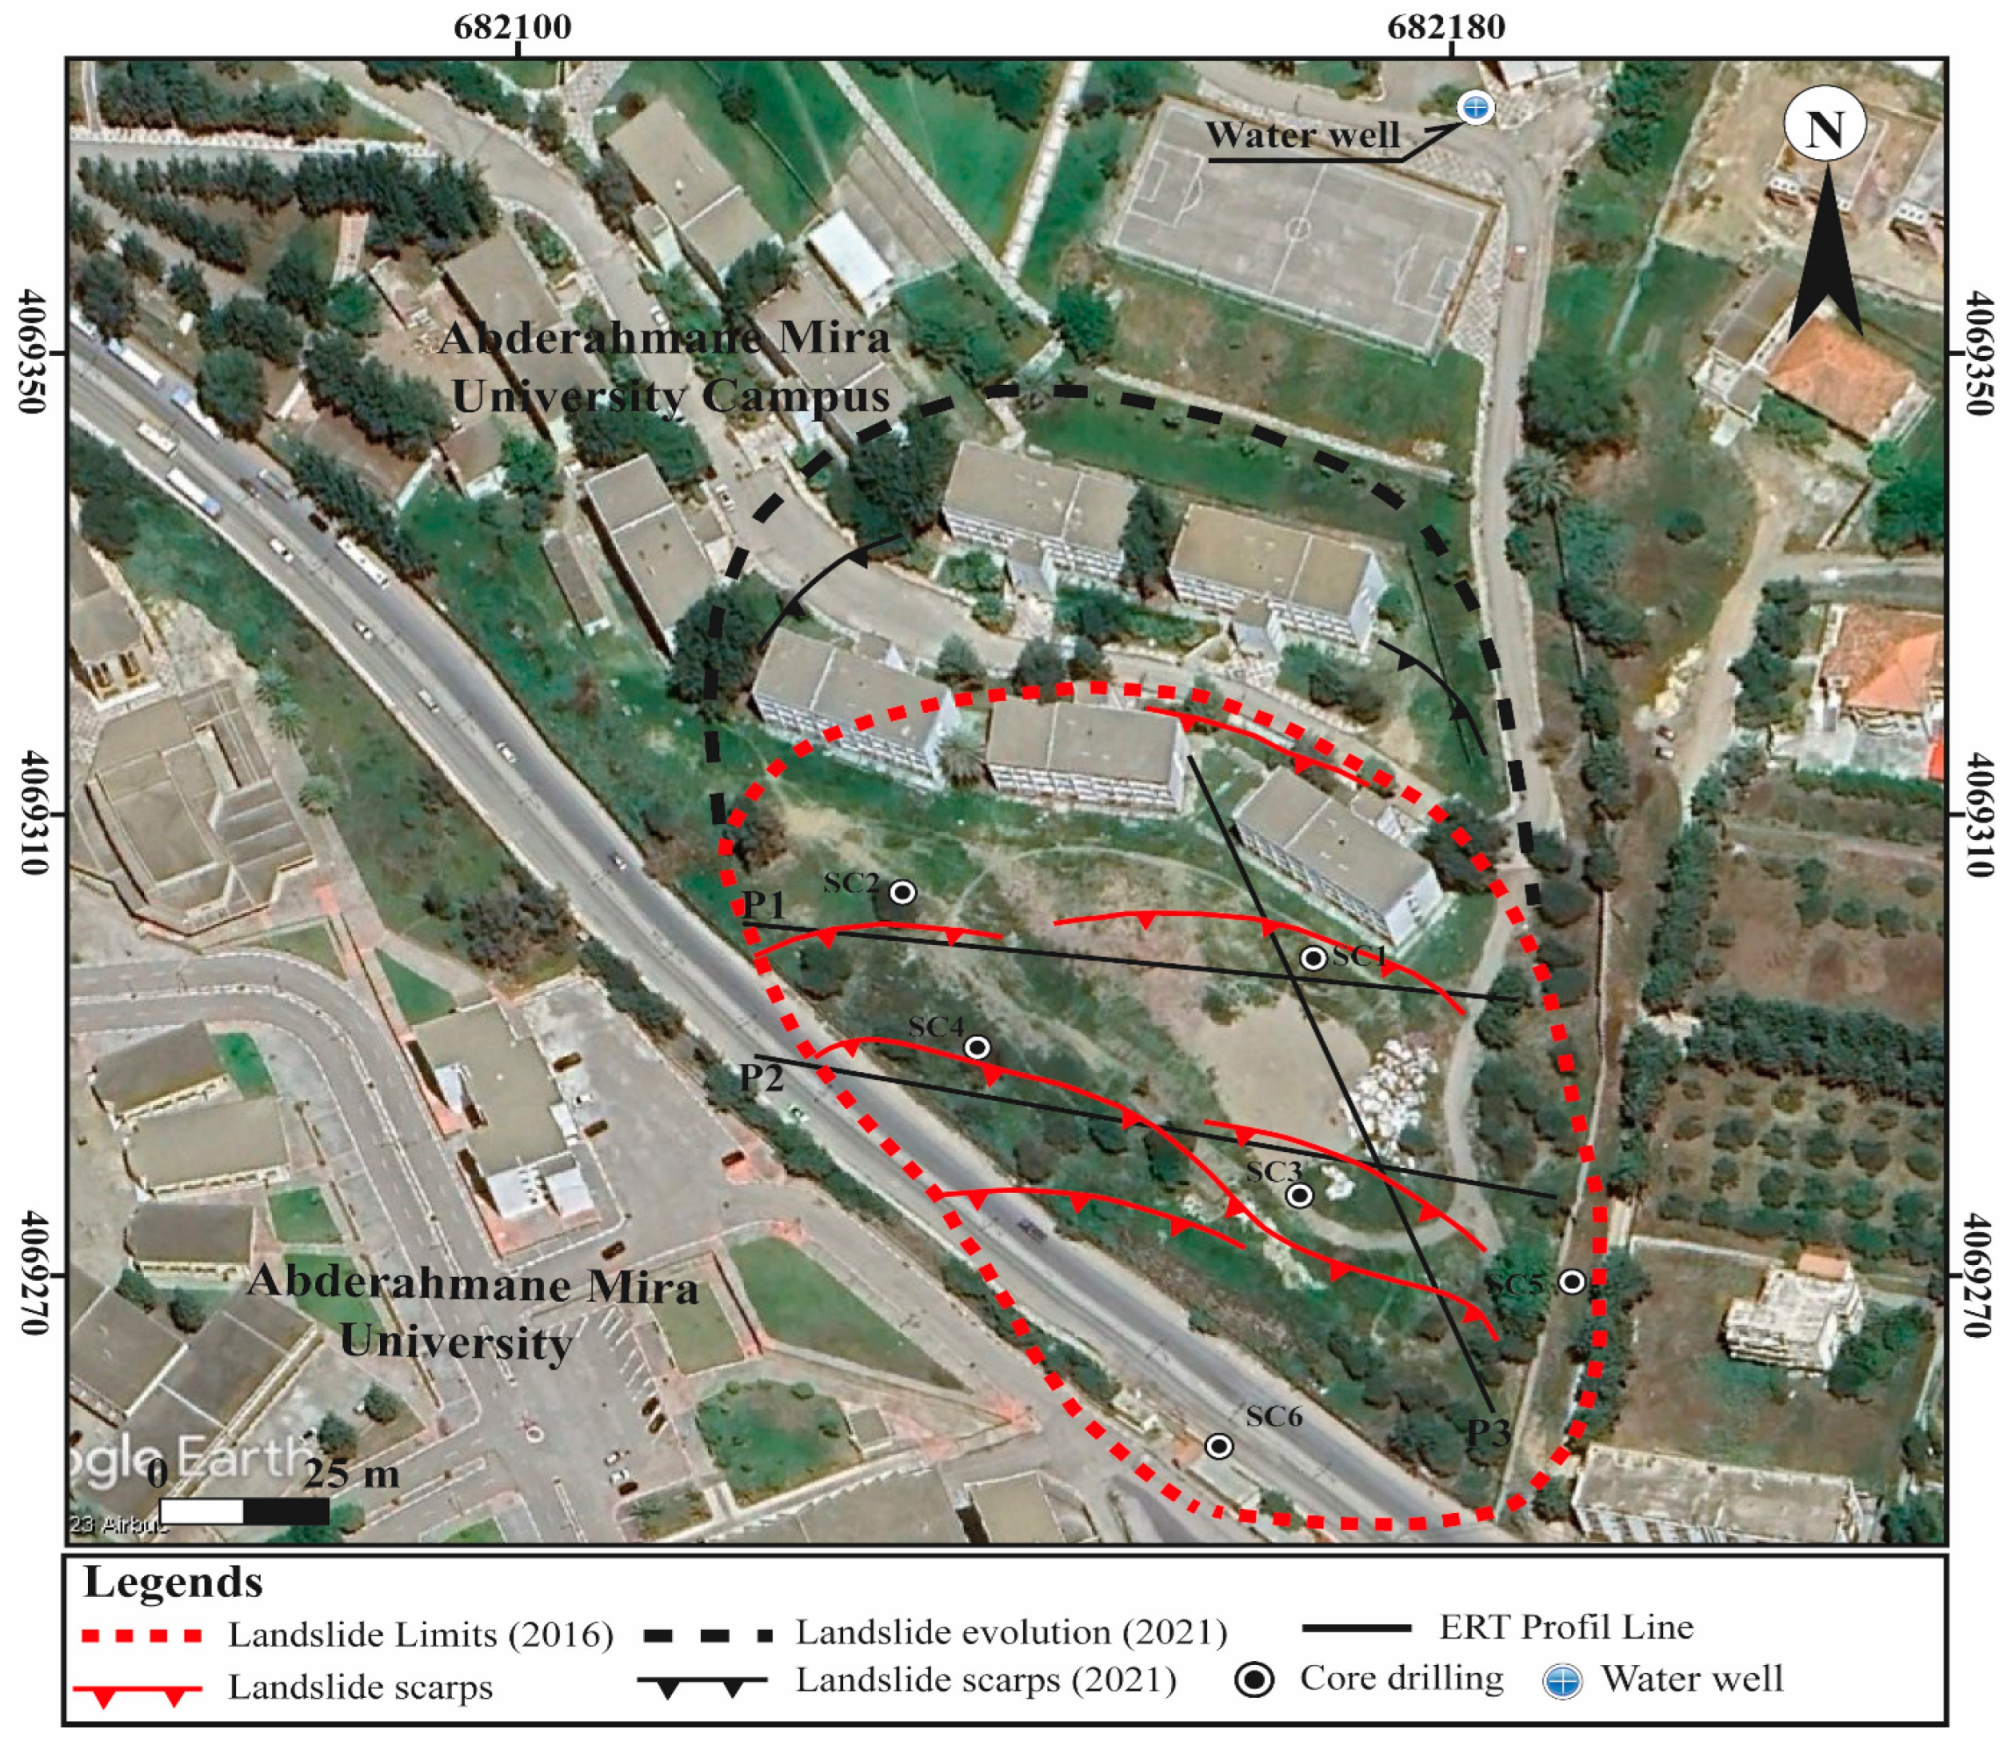
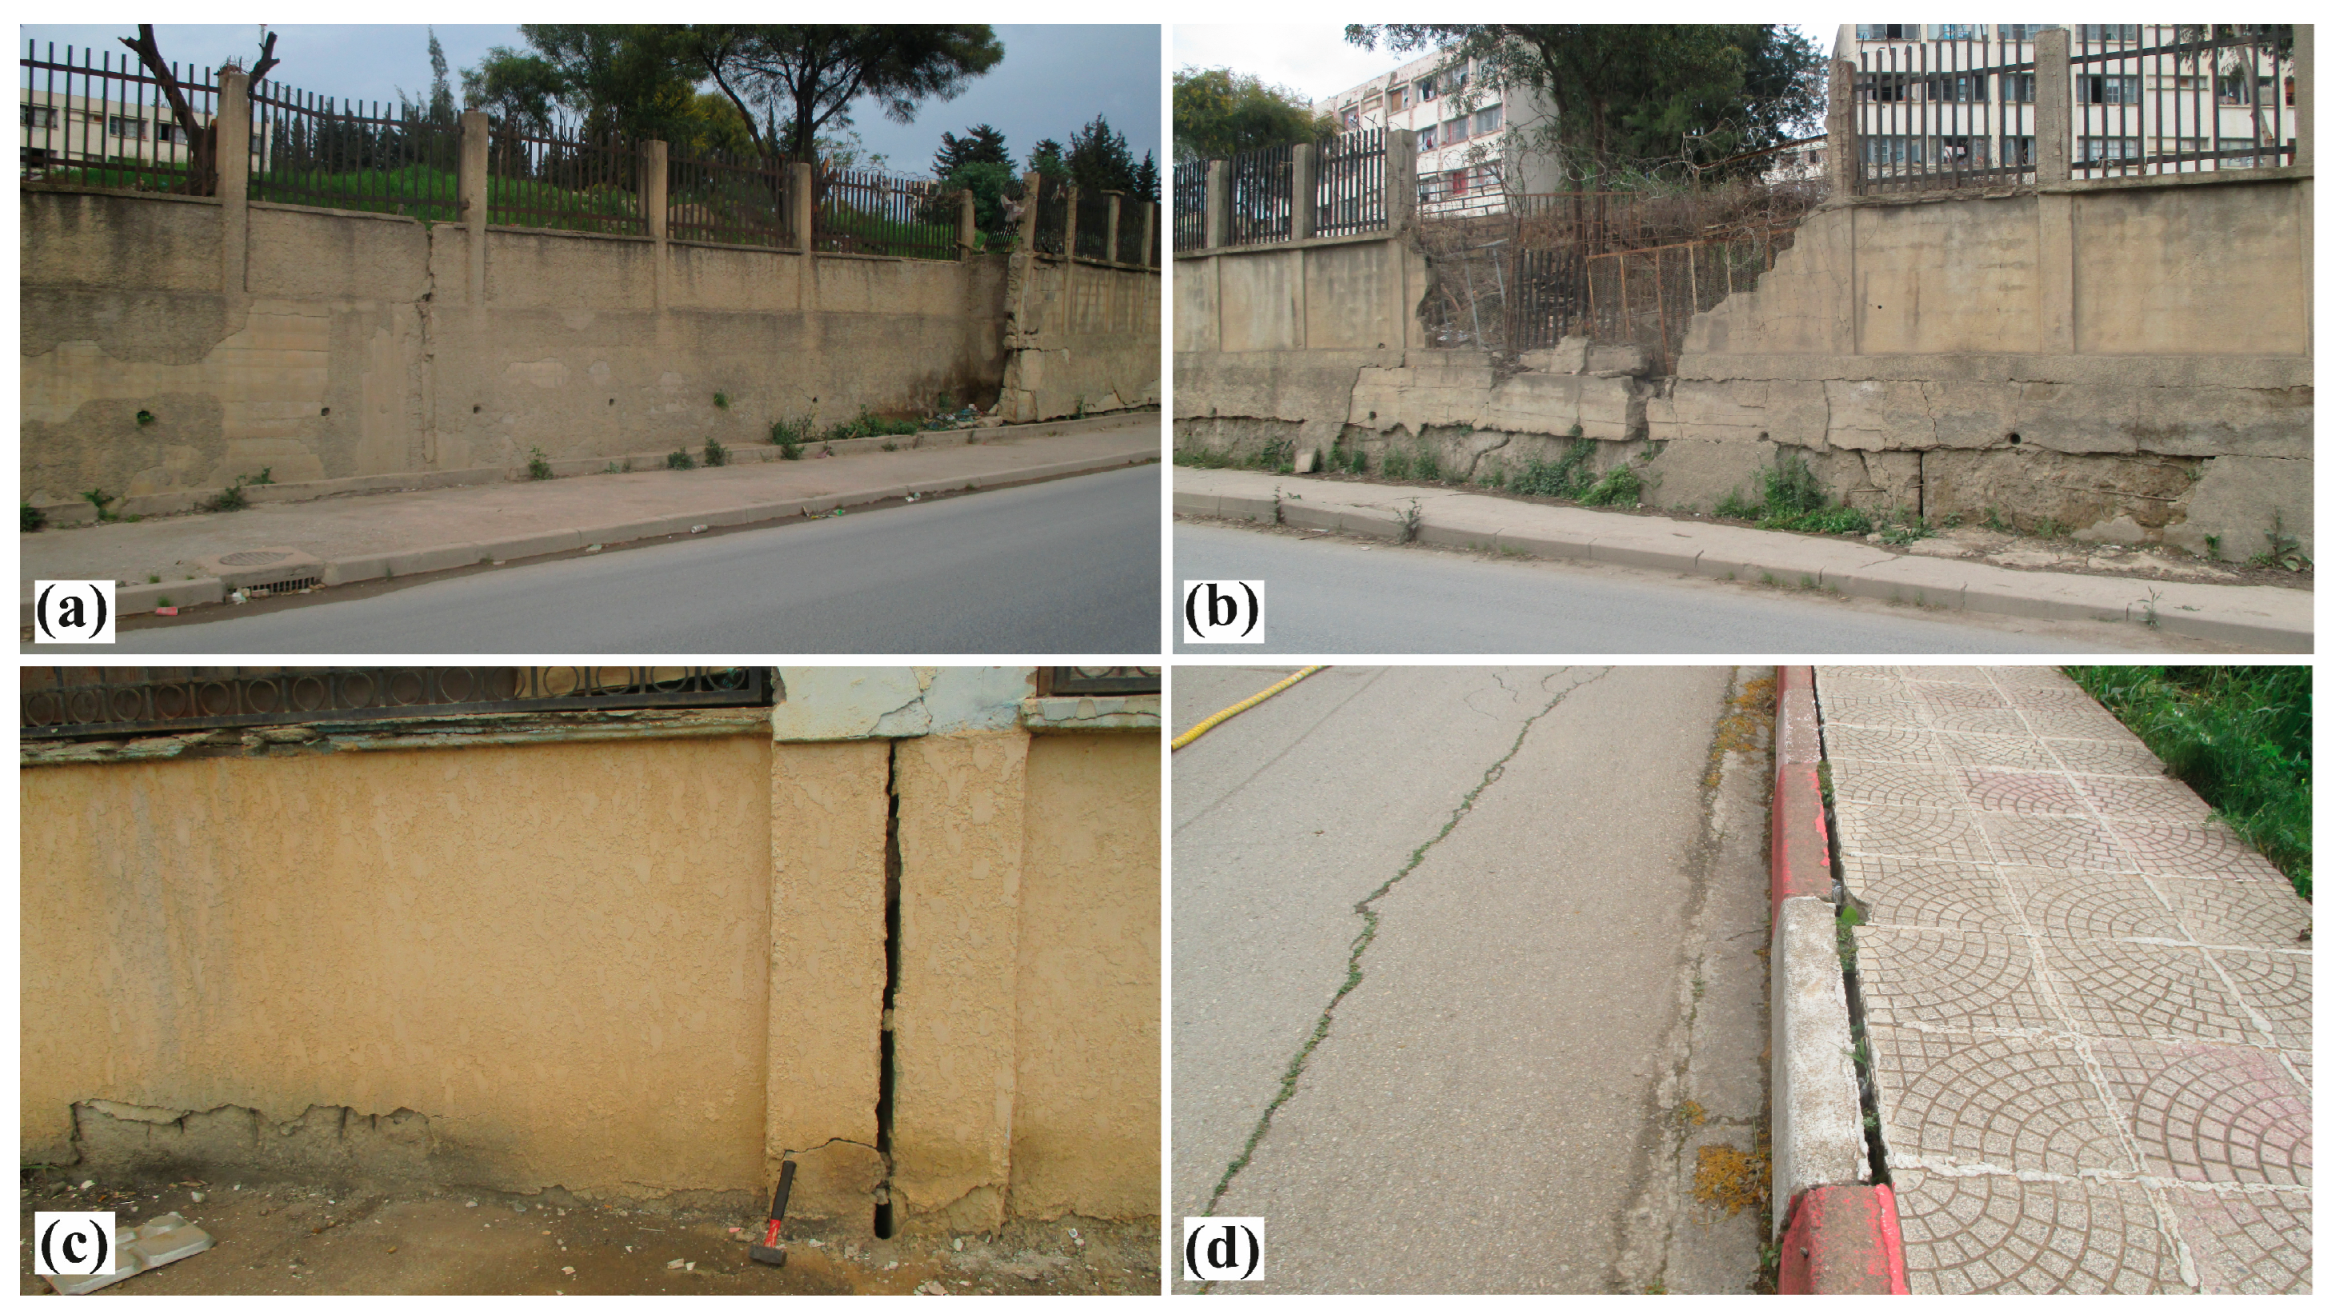
4.1. Deformation Characteristics of the Landslide

From field observations, the slope inclination is between 15° and 35°, generally NE–SW oriented, with transverse cracks and subsidence. Owing to this geometrical configuration and its location in the rainiest region (~900 mm/year), this unstable slope is affected by serious excavations and increased erosion caused by surface water flows. In addition, the landslide is accentuated especially during the winter period. The hydrographic network disturbance and the movement of groundwater from various sources are the most serious aggravations. This has resulted in severe damages, which affected above-ground structures. Several signs of deformation are observed with cracks and joint openings in the blocks, and structure shearing such as holdings, sidewalls and roads due to the traction forces generated by the soil movement. The best example of deformation indicating the landslide evolution is the deformation observed on the wall surrounding the University Residence extending about 150 m beyond this unstable area (Figure 5a,b). In the landslide zone, we have observed significant scarps of about 20 cm to 40 cm, minor scarps, depressions, subsidence and fissures inside the university residence (Figure 2 and Figure 5). Based on field observations and deformations, two types of movement characterize this landslide area. The first one can be identified by the rupture marks and the downstream ridge (Figure 2). The second one has a creep character, indicating the upstream evolution of the sliding movement. During the rainy season, these deformations are accentuated by the influx of water and the reduction in the shear strengthening characteristics of the soil. Moreover, in the upstream part, the measured length of the scarp is about 90 m, which presents a creep deformation curvature over 120 m length (Figure 5c,d).

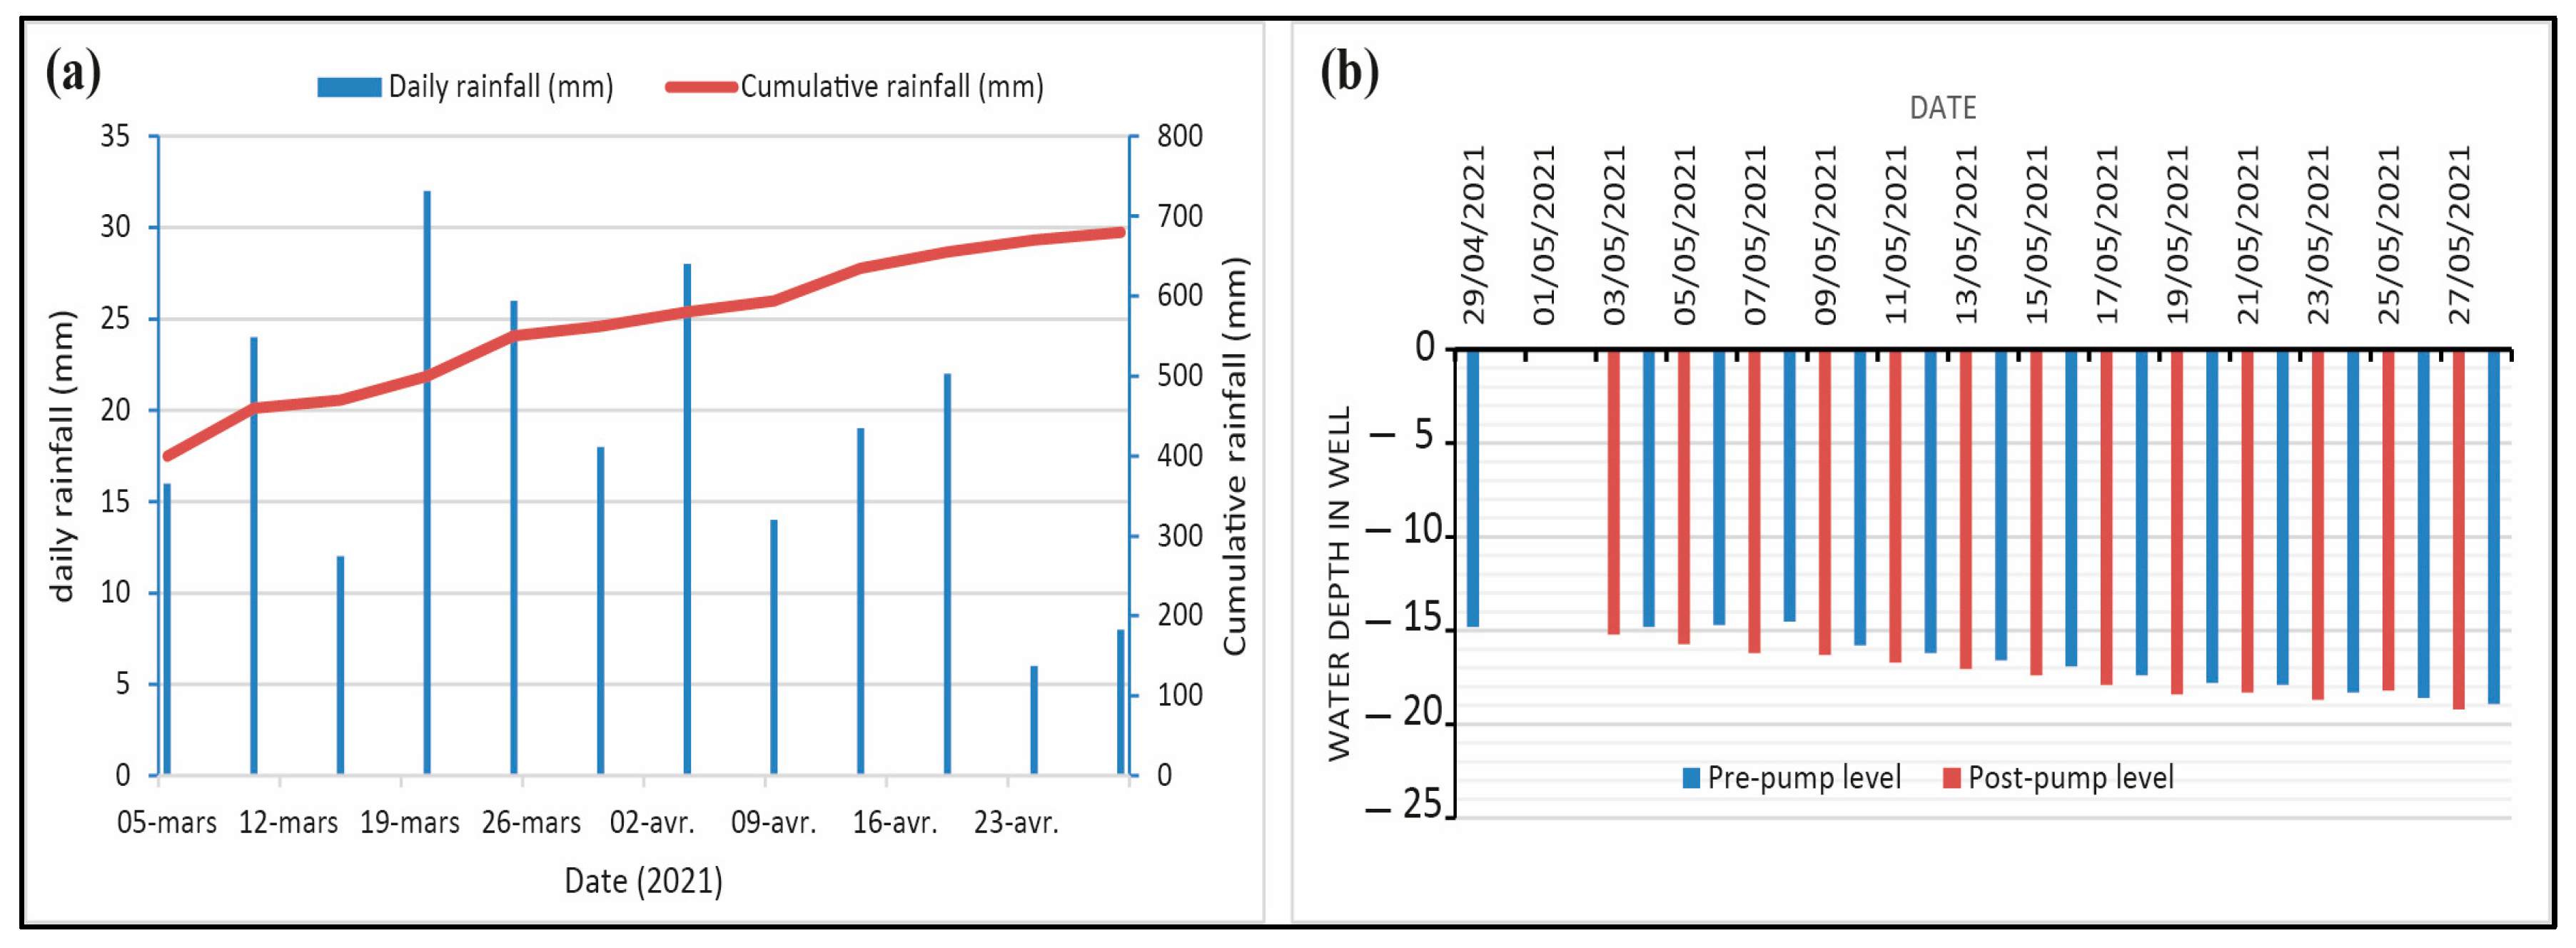
4.2. Rainfall and Ground Water Effect

Precipitation is a well-known trigger factor for landslides in the Bejaia region. Precipitation is known for its dual action, on the surface in the short term and at depth in the long term. High-intensity rainfall generally causes erosion and mudflows and rarely landslides. However, it is considered to be the first groundwater generator by infiltration from the surface. It contributes directly to the increase in pore pressure, saturation and changes in the physico-mechanical parameters of geological formations. This situation can reactivate or trigger landslides.
During the spring of the 2021 season, the Bejaia region recorded a series of precipitation events, sometimes expressed as heavy rainfall. Several days recorded heavy rainfall, with a maximum of 14.5 mm/24 h recorded at the airport rain gauge. During the season, the estimated cumulative rainfall was 280 mm and the estimated precipitation was 162 mm in March and 118 mm in April (Figure 6a). In the geotechnical study, no piezometers were installed in the landslide area. However, to monitor the groundwater level, we used a domestic water well located just upstream of the landslide. Following the rainy period, the water level in the domestic well rose by 80 cm from its initial level, which was 15.6 m above the natural ground level. Periodic measurements were obtained during the investigation campaign in May, both before and after the pumping periods (Figure 6b). These measurements show that the water level remained relatively stable. However, by the end of May, the water level in the domestic well had decreased to a depth of −18.9 m. The analysis of the deformation history recorded since 2016 shows that the deformation and landslide evolution are consistent with heavy precipitation periods, which contribute to groundwater recharge, soil saturation and changes in the physical-mechanical parameters of the geological formations. This situation favors the reactivation and evolution of the Targa Ouzemour landslide. However, during the summer period, the landslide is practically stable.

4.3. Landslide Structure and Mechanism Analysis

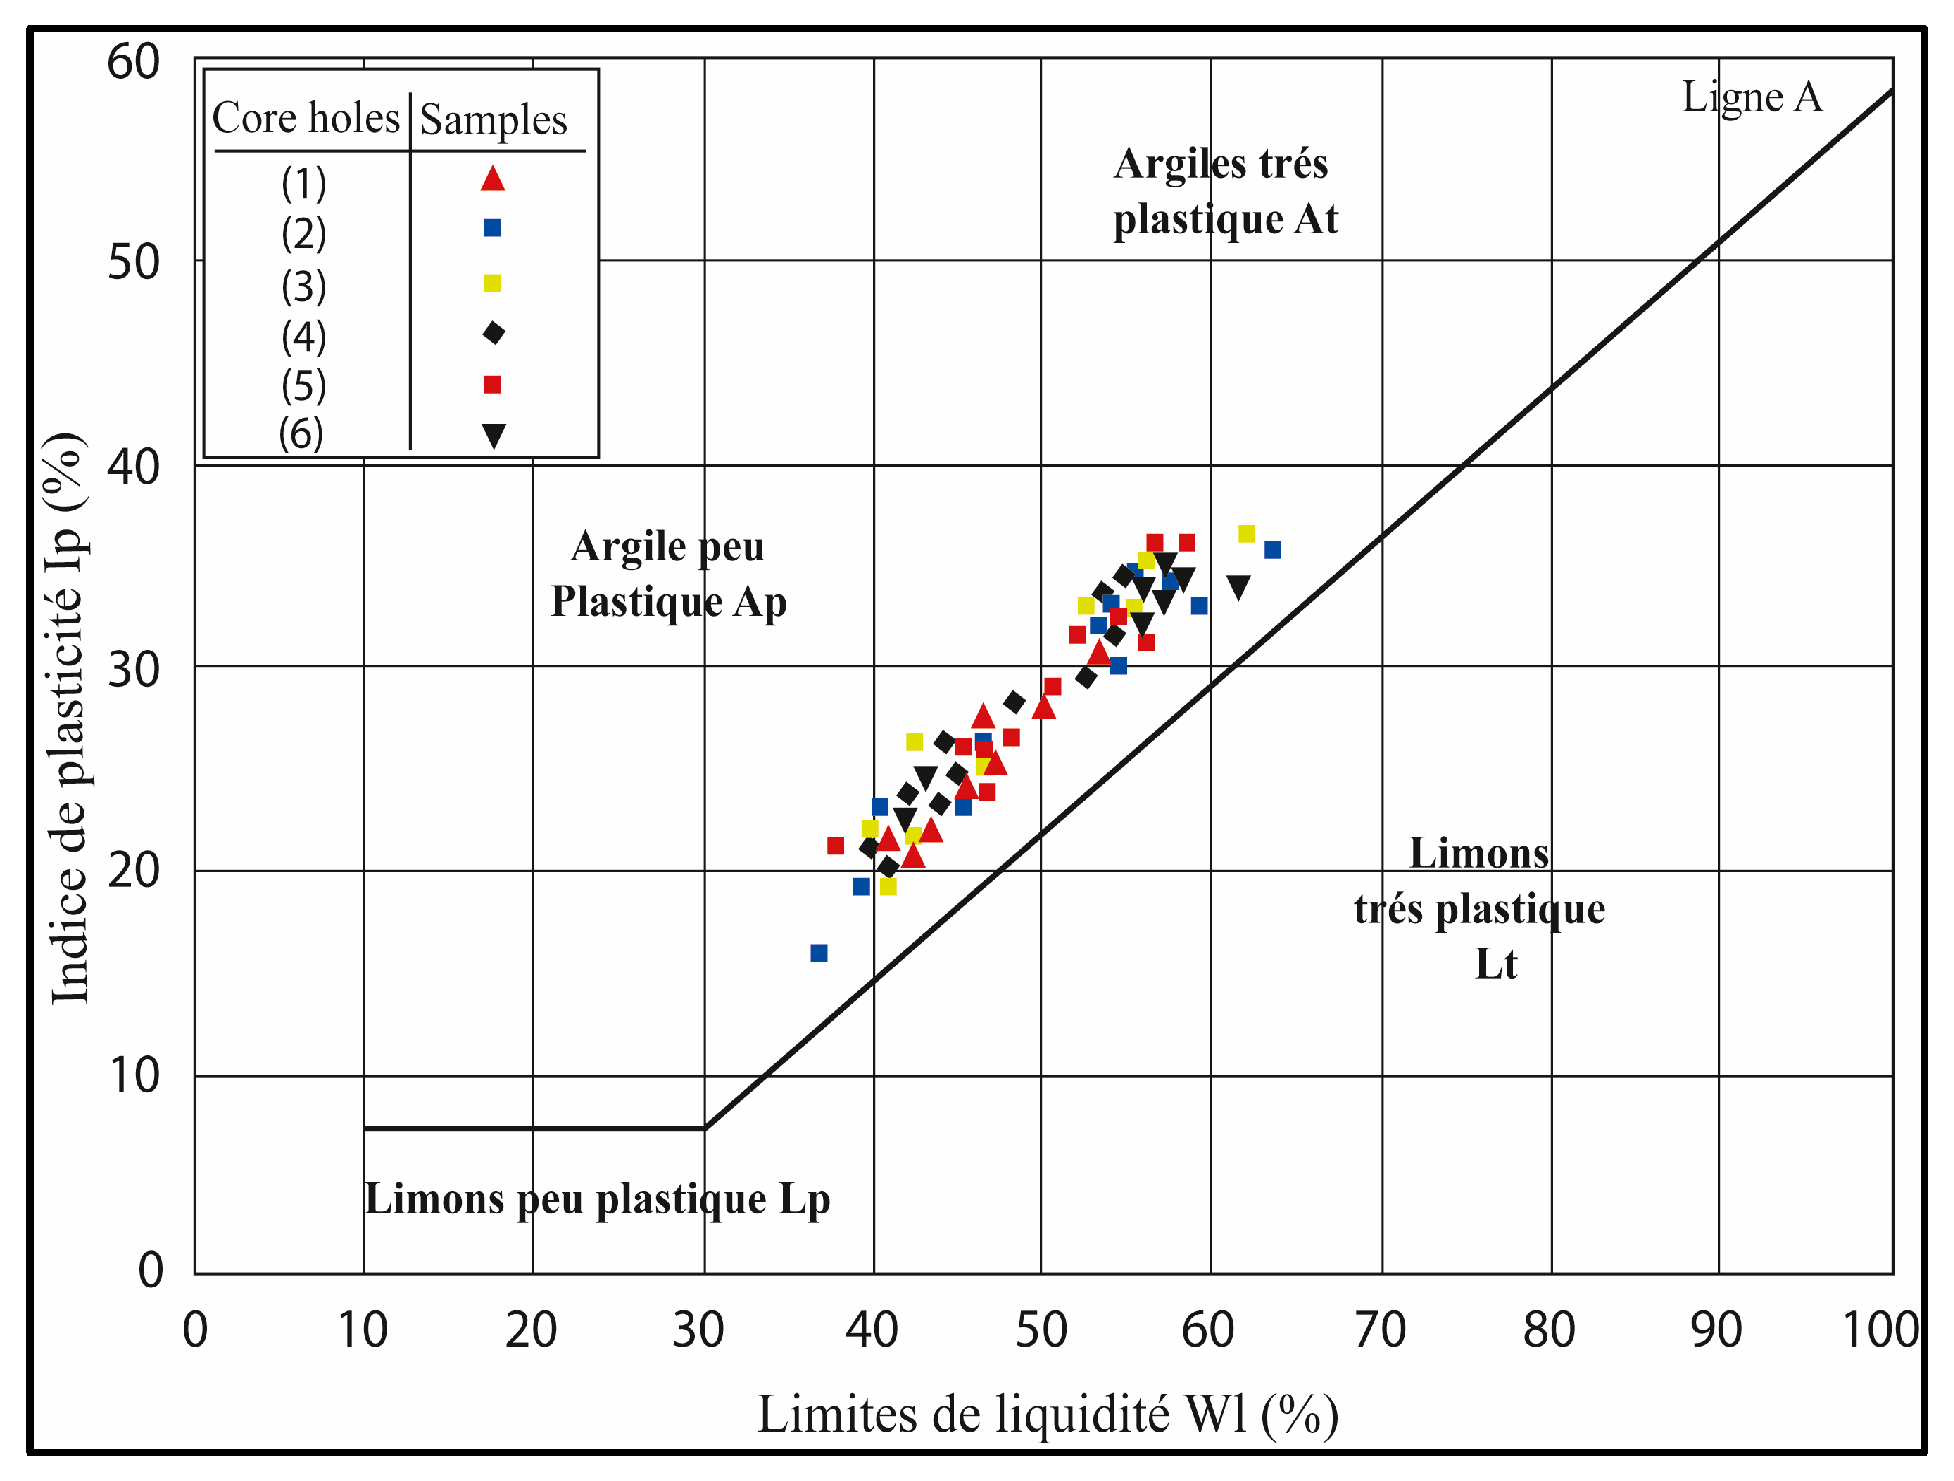
4.3.1. Geotechnical Characteristics Interpretation

Results from the six (06) boreholes drilled in the landslide zone provided important information on the lithological nature of the formations affected by the landslide. Both boreholes provided evidence of two different principal lithological formations superimposed by a layer of backfill of varying thickness. Both of these lithological formations showed a significant response to water content. From the two core samples obtained from the upper part of the landslide in boreholes SC1 and SC2, a clayey layer with a thickness ranging from 5 m to 8 m reaching a depth of 9 m and containing sand lenses was observed. This layer overlies a clayey-marly formation at a depth of 10 m, which is containing lenses of sandy marly clay, showing severe alteration degrees within deeper levels (Figure 7).
In the middle part of the unstable zone, the core drilling SC 3, SC 4 and SC 5 also showed the same lithological formations as those encountered through boreholes SC 1 and SC 2. The thickness of these layering formations is typically about 1.5 m for backfill below the surface, and between 5 m to 9 m for “with sand lenses of variable volume” clays, whereas the “weakly sandy” clay-marl formation could be encountered above a 9 m depth (Figure 7). The results from the core samples point out the highly altered levels, most likely corresponding to the slide surfaces. Figure 7 summarizes the lithological characterization of the different layer thicknesses that were encountered in the boreholes.
Additionally, the physical and mechanical property characterizations are also valuable indications in terms of mass movement features (Table 2). A series of measurements were therefore carried out on 18 samples collected from boreholes (Wn (%), γd (t/m3), γh (t/m3), Sr (%), WL (%), Wp (%), Ip, Cuu (Bars) and Φuu (Deg)° (Figure 8 and Figure 9). The fine-textured clay soils exhibit low porosity, as they tend to lose their water content progressively. Consequently, their susceptibility to landslides becomes more pronounced [6,30].
Table 2 displays the representative profiles of dry unit weight, water content and liquidity limit with the plasticity index. We can note that the dry unit weight of the altered marls increases downwards from the surface to about a 10 m depth, whereas it remains almost constant in the underlying unaltered formation. Consequently, assuming that the soils are saturated, then the water content would be reduced to an average of approximately 96% near the soil surface, and about 88% average over the undisturbed formations. On the other hand, Atterberg’s limits appear to be relatively invariable as the depth increases. Because of the similitude between particle size distribution and water content, we can assume that the soil is rather homogeneous in terms of mineralogical composition, and it consists of low-plastic to plastic soil. The graphical representation of the different results obtained are given in Figure 8 and Figure 9.
The mean values of some parameters of the samples obtained from the different boreholes that cover the landslide zone are presented in Table 2. They show a variable distribution of the geotechnical parameters in the different boreholes. The liquidity limit and the plasticity index values of the samples obtained from different depths of the core drillings vary between 37% and 69% and also between 16% and 37%, respectively. The Casagrande table shows that these samples’ nature generally goes from slightly to very plastic. These results illustrate that the Targa Ouzemmour landslide affects a slope that consists of clay overall.
The results of the oedometer tests executed on intact samples collected at different depths show that the pressure and the swelling index vary, respectively, between 1.9% and 17.4% between 34 kPa and 640 kPa for the slope affected by the landslide.
The analysis and synthesis of all the results show that the formation, which represents the unstable slope of Targa Ouzemour, is swelling with an average to high swelling pressure according to Chen (1988). The variation of the groundwater level has a very important role in the deportment of this Miocene formation. It causes volume deformations when the ground is saturated and it is considered an important factor in triggering the deformation of the slope and increasing the Targa Ouzemmour landslide. The fluctuating water levels in the domestic well, depending on the season, coincide with the levels of weathered clay observed in the core holes. This weathering is more pronounced towards the surface.

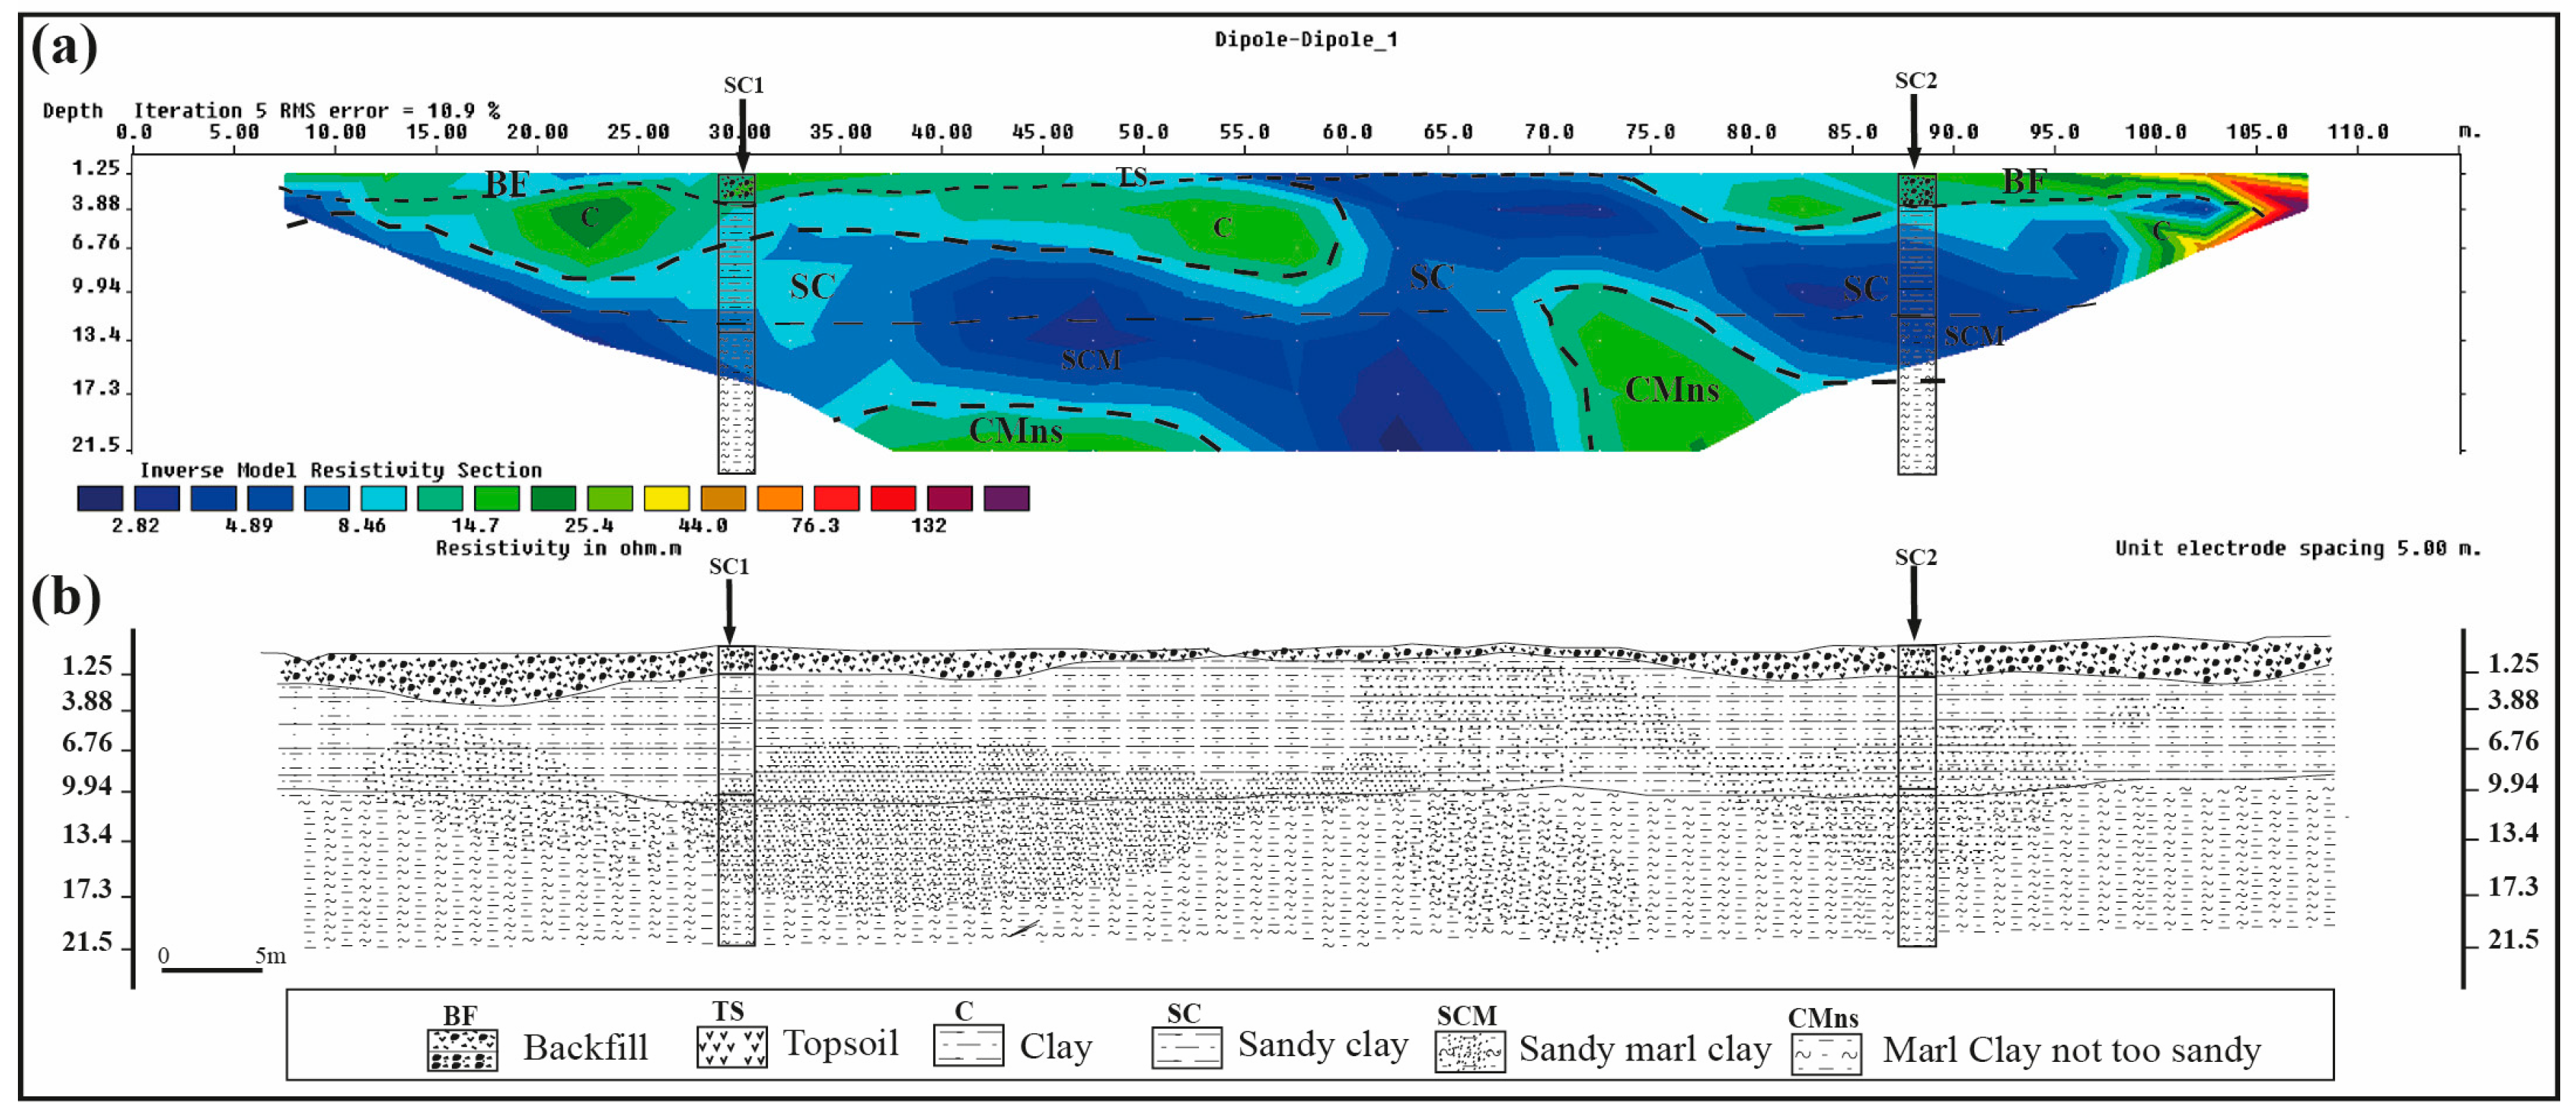
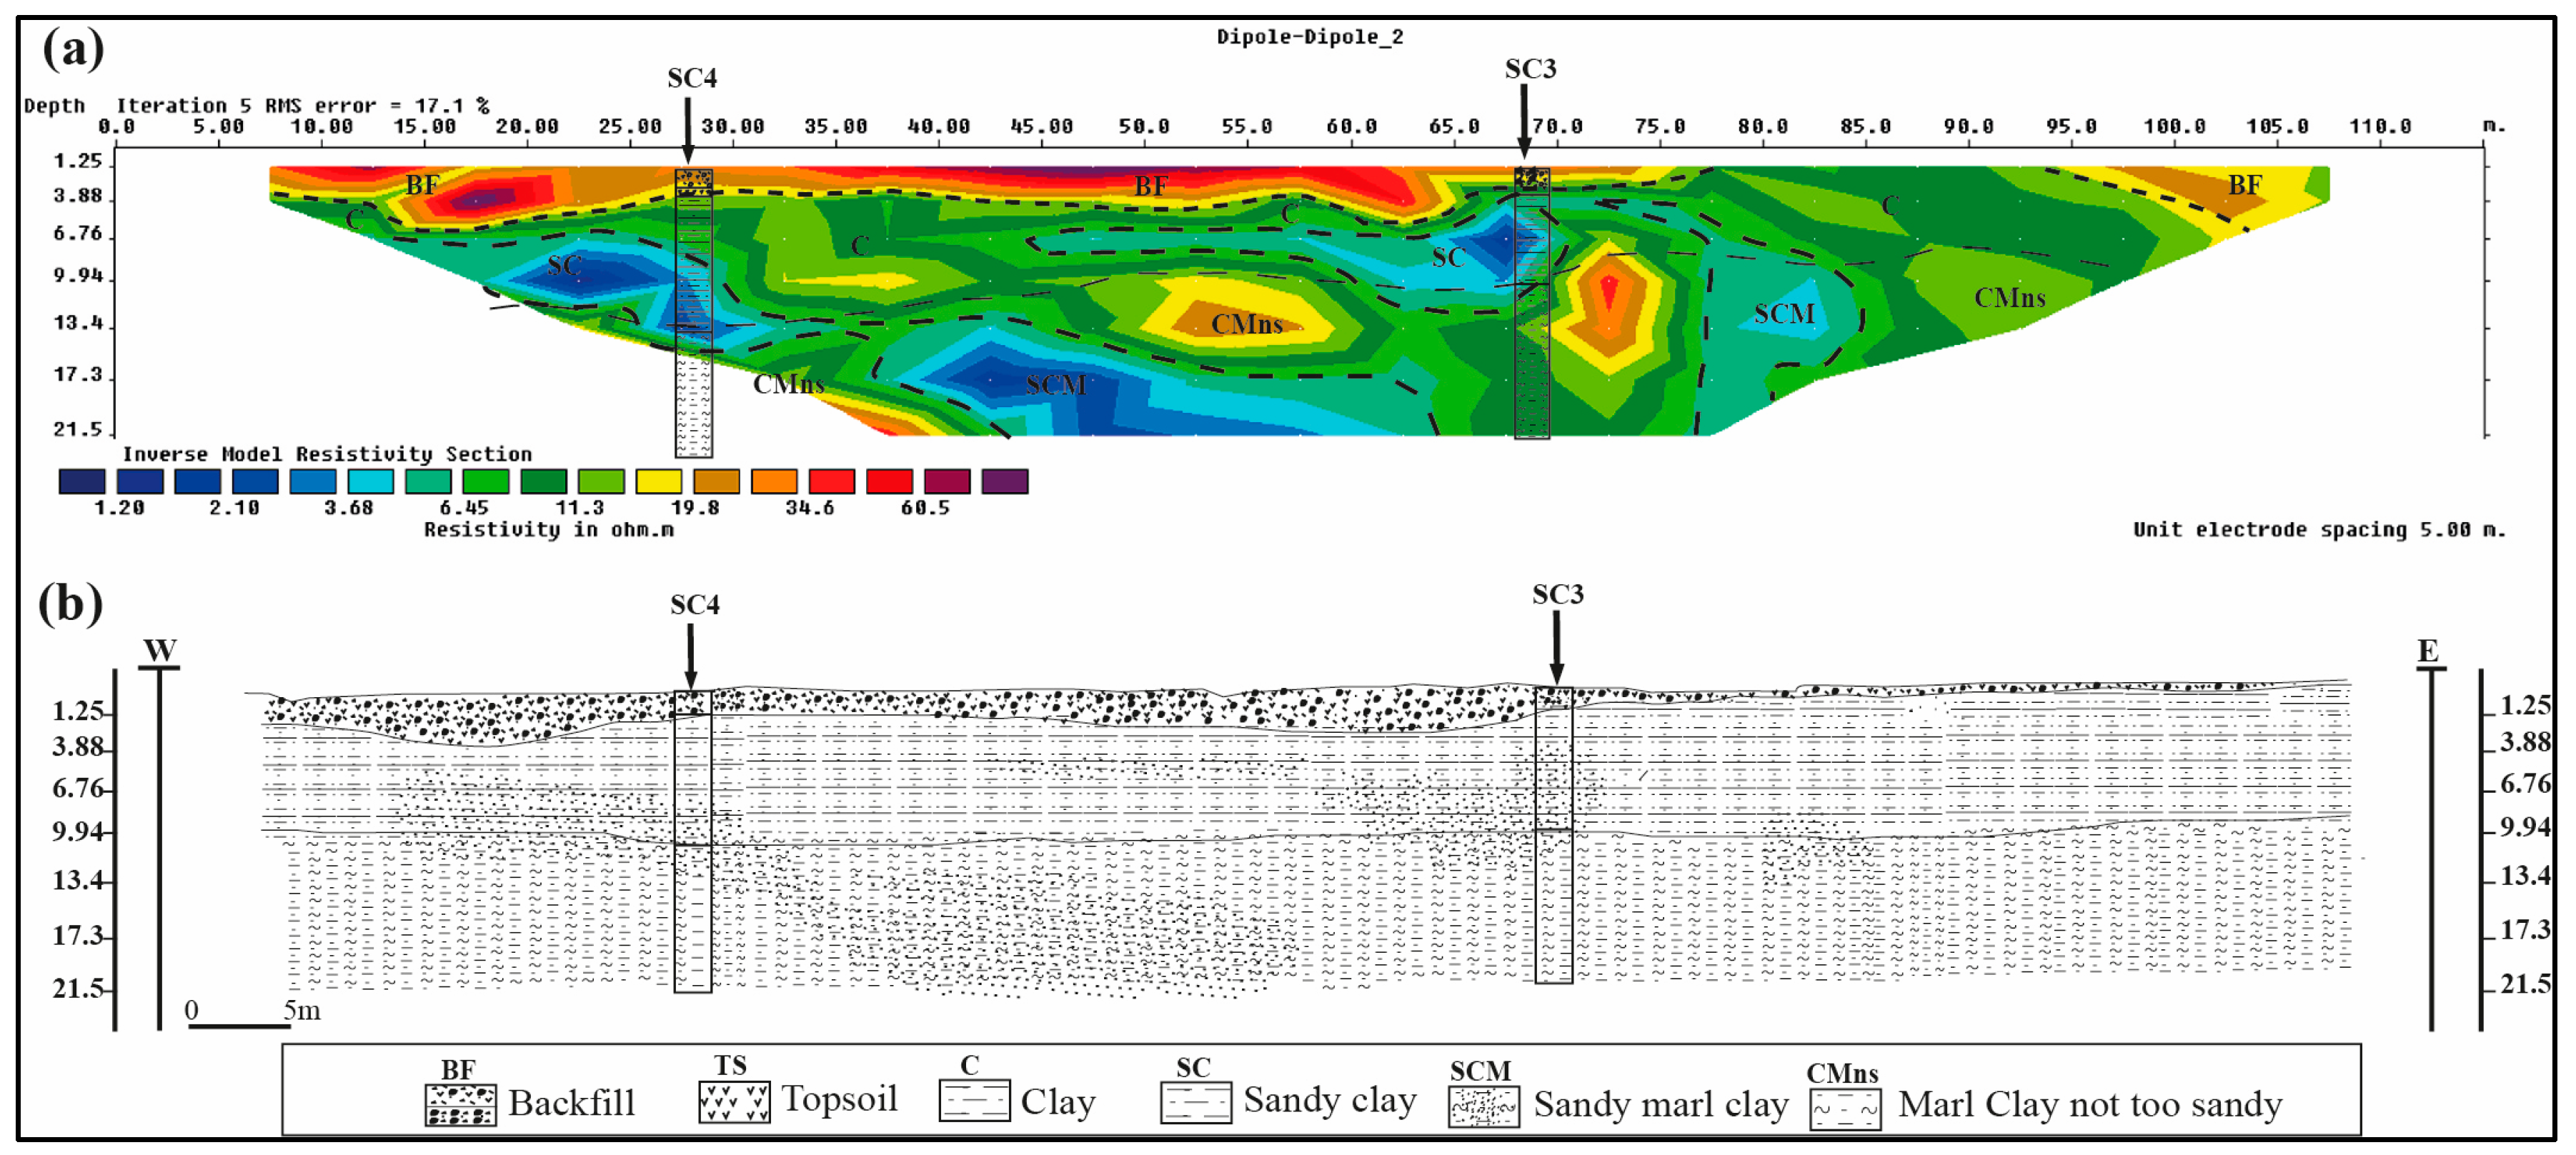
4.3.2. Interpretation of Electrical Resistivity Tomography (ERT) Data

In addition to geotechnical results, the obtained ERT data allow an improved understanding of the internal structure and lithological nature of the study area. Given an in-depth investigation and high resolution achieved under the dipole–dipole acquisition mode, only pseudo-sections derived therefrom will be considered. The models of resistivity inversion obtained from the three main ERT performed profiles are illustrated in Figure 10, Figure 11 and Figure 12. The analysis of these models shows at a glance a low resistivity contrast between the conductive material (1 < ρ < 10 Ω·m) and the relatively resistive material (10 < ρ < 40 Ω·m), while this contrast becomes noticeable in the case where the material is highly resistive (ρ > 40 Ω·m). This contrasting pattern provides more clarity to discern between the various lithological formations that are still stable or altered and actively moving within the Targa Ouzemour landslide.
When correlated with the geotechnical data and variations in groundwater levels, this basic differentiation would be resolved to the variation in resistivity values according to depths facing changes and/or to the nature of the soil. For instance, near the surface at around a 2 m depth, there is a marked contrast between the topsoil (5 < ρ < 10 Ω·m) (Figure 11a and Figure 12a) and what constitutes backfill materials (40 < ρ < 60 Ω·m) (Figure 11b and Figure 12b). Alternatively, several saturated zones may be easily identified within the three models by these resistivity compound contrasts. They are essentially those lithologically associated with sandy clays or altered clayey-marly formations (Figure 7), for which the range of resistivity values is between 1 and 10 Ω·m (Figure 10a, Figure 11a and Figure 12a). This demonstrates that the terrain is highly permeable in certain zones, thus forming preferential pathways for intense water circulation and accelerating the saturation of the sand lenses.
Similarly, the highly resistive material (ρ > 40 Ω·m) can be attributed to the unaltered and stable clay-marl formation. Depth-wise, this formation was rarely revealed by the ERTs carried out in the middle of the landslide and perpendicularly to its axis (see P2 in Figure 11a). More specifically, this stable and unaltered formation was revealed by the ERT carried out parallel to the landslide axis. This formation should be considered as an upstream landslide part, where the main features of a somital landslide scar became evident (see P3 in Figure 12a).
By relying on the geotechnical and hydrogeological data and the analysis from the inversion models of individual ERT profiles, we were able to build a detailed section of the landslide showing different lithologies, groundwater level and failure surfaces. Hence, three geological-geotechnical sections were first sketched out along the three performed ERT profiles (Figure 10b, Figure 11b and Figure 12b). The first geological-geotechnical (section one) has been made mainly in correlation with the ERT P1 profile (Figure 2 and Figure 10b). Assuming the data from boreholes SC1 and SC2 (Figure 7, Table 2) in combination with that from the interpreted ERT P1 profile (Figure 10a), one can observe the presence of the two lithological layers of clay and marly clay. Most of them seem to be altered in some specific portions of the section (Figure 10b). Above them also lies a set of earthworks. The ERT P1 profile highlighted the presence of the lenticular sandy clay and sandy marly clay lenses that are connected at different depths in accordance with very low resistivity values, which proves the water presence at depth.
The second geological-geotechnical section (Figure 11b) follows the ERT P2 profile outline and its interpretation (Figure 11a). From the SC3 and SC4 data (Figure 7) and the interpretation of the ERT P2 model (Figure 9a), this section shows similar lithology to those observed in section one (Figure 10b). Notably, the ERT P2 profile exhibits higher resistivity values near the surface and lower ones at depth. Such variation is indicative of saturated and well-developed sandy clay and sandy marly clay lenses, which extend laterally and deeply along the sliding direction.
We draw a third geological-geotechnical section (Figure 12b) following the ERT P3 profile (Figure 12a), which extends parallel to the slide direction and perpendicularly to the ERT P1 and P2 profiles (Figure 4). According to the SC3 drilling data (Figure 7) and the interpretation of the ERT P3 model (Figure 12a), this section confirms the saturated and elongation of the sandy clay and sandy marly clay lenses, hence following the same sliding direction from the surface to depth. This distribution explains the sustained saturation of these described lenses and surrounding soils after being fed from the water supply.
Once combining all the extracted information from the three drawn sections and the geotechnical interpretation, a synthesized NS-oriented geological-geotechnical section in the direction of the landslide was lastly produced with different groundwater levels (Figure 13). This section reflects a “geomodel” representation of the deep lithological composition within the in situ landslide area. On this proposed geomodel features is shown an over 10 m thick lens of sandy marly clay. The latter developed laterally and downward within a marly clay type layer. Several smaller lenses of a sandy clay nature that are developed in the clay layer come close to this thick lens. Consequently, these different lenses delineate the failure surfaces, thus characterizing the upstream sliding progression. Another implication would be that the feeding of these lenses occurs through the deep infiltrations of sewage or rainwater seeping from the surface. In this way, the saturation process and increased interstitial pressure at depth will make all these layers less resilient simultaneously.
As a result, the Targa Ouzemour landslide is still evolving upstream and currently causing severe deformation to the university residence buildings. This evolution is in line with the heavy rainfall periods, which contribute to the recharge of the groundwater in the region and this later contributes to the saturation of the landslide base. Hence, suitable attenuation measures would have to be implemented to prevent the prevailing landslide process. In addition, our results also revealed the presence of backfills that were certainly deposited at the top of the slope to compensate for collapses. Therefore, it is recommended to remove them first to avoid a high mass movement acceleration and then proceed to the stabilization of the slopes through the construction of reinforcing barriers, and smooth the slopes by removing the escarpments due to the terracing works. In addition, a drainage network should be built on the slope and its surroundings to dissipate infiltration and surface water, thus reducing interstitial pressures.

5. Conclusions

In this study, we have combined field observation, geotechnical, hydrogeological data and ERT methods to map in detail the geometry of the Targa Ouzemour landslide and assess its active evolution. In fact, the mass movement rates of this landslide are highly variable and extensive, posing a serious threat to the university campus and residential buildings.
Geotechnical data show that the Miocene marly clays of Targa Ouzemour are thick and quite homogeneous, characterized by the presence of sand lenses which are sometimes clayey. They are very plastic and sensitive to the phenomenon of swelling. The results of swelling tests carried out on intact samples obtained at different locations and depths confirm the alteration and swelling of these marly clays in the water presence and in turn favors the gravity movement’s acceleration.
Hydrogeological data show that heavy rainfall has a direct effect on the variation of groundwater levels. This variation is responsible for the reactivation and evolution of the Targa Ouzemour landslide.
The resulting ERT models cross-checked with geotechnical data have significantly contributed to building a characteristic section of this landslide, where the main scars and displacement of failure surfaces are delineated. In particular, our results have provided an in-depth overview of the triggering processes and mechanism of this landslide. Based on the combined interpretation, the potential sliding surfaces could be associated with the low-resistivity horizon within the shallow layers of the saturated sandy clay formations. From these formations, the starting preferential pathways for intense water circulation have been identified. We also found significant evidence of alteration and higher water content in the upper unsandy clayey-marly formations, unlike their deeper unweather and stable layers. The influence of rainfall and water infiltration on the deformation and stability of a slope is then clearly confirmed with variations in groundwater levels. This being among the most aggravating factors, particularly with rainy conditions that characterize this region. Finally, thanks to the proposed geomodel, specific landslide remedial measures were then suggested as prioritized tasks, such as backfill removal, stabilization and/or smoothening the slopes, including a drainage network to dissipate infiltration and surface water.

Author Contributions

All authors contributed to the study conception and design material preparation. Data collection, acquisition and analysis were performed by H.N., L.A., H.L., H.M. and M.A. The first draft of the manuscript was written by H.N. and all authors commented on previous versions of the manuscript. All authors have read and agreed to the published version of the manuscript.

Funding

This research received no external funding.

Data Availability Statement

All data generated or analyzed during this study are included in this article.

Acknowledgments

We extend our sincere appreciation to the reviewers who dedicated their time and expertise to evaluate and provide valuable feedback on this research paper. Their constructive comments and thoughtful suggestions significantly contributed to the improvement of the overall quality of the manuscript.

Conflicts of Interest

The authors declare no conflict of interest. The funders had no role in the design of the study; in the collection, analyses or interpretation of data; in the writing of the manuscript, or in the decision to publish the results.

References

  1. Dikau, R.; Brunsden, D.; Schrott, L.; Ibsen, M.-L. Landslide Recognition: Identification, Movement and Causes; John Wiley and Sons: Chichester, UK, 1996; 251p. [Google Scholar]
  2. Varnes, D.J. Slope Movement Types and Processes. In Landslides, Analysis and Control, Transportation Research Board, Special Report No. 176; Schuster, R.L., Krizek, R.J., Eds.; National Academy of Sciences: Washington, DC, USA, 1978; pp. 11–33. [Google Scholar]
  3. Dikau, R. Mass-movement causes: Water. In Treatise on Geomorphology. Vol. 7, Mountain and Hillslope Geomorphology; Shroder, J., Marston, R.A., Stoffel, M., Eds.; Academic Press: San Diego, CA, USA, 2013; pp. 207–211. [Google Scholar]
  4. Cruden, D.M.A. A simple definition of a landslide. Bull. Eng. Geol. Environ. 1991, 43, 27–29. [Google Scholar] [CrossRef]
  5. Durville, J.L.; Sève, G. Stabilité des pentes-Glissements en terrain meuble. Tech. De L’ingénieur 1996, 1, C254-1. [Google Scholar] [CrossRef]
  6. Mugagga, F.; Kakembo, V.; Buyinza, M. A characterisation of the physical properties of soil and the implications for landslide occurrence on the slopes of Mount Elgon, Eastern Uganda. Nat. Hazards 2012, 60, 1113–1131. [Google Scholar] [CrossRef]
  7. Picarelli, L.; Urciuoli, G.; Russo, C. Effect of groundwater regime on the behaviour of clayed slopes. Can. Geotech. J. 2004, 41, 467–484. [Google Scholar] [CrossRef]
  8. Tuleushev, A.Z.; Harrison, F.E.; Kozlovskiy, A.L.; Zdorovets, M.V. Evolution of the absorption edge of PET films irradiated with Kr ions after thermal annealing and ageing. Opt. Mater. 2021, 119, 111348. [Google Scholar] [CrossRef]
  9. Darwish, M.A.; Zubar, T.I.; Kanafyev, O.D.; Zhou, D.; Trukhanova, E.L.; Trukhanov, S.V.; Trukhanov, A.V.; Henaish, A.M. Combined effect of microstructure, surface energy, and adhesion force on the friction of PVA/ferrite spinel nanocomposites. Nanomaterials 2022, 12, 1998. [Google Scholar] [CrossRef]
  10. Sassa, K. Landslide science as a new scientific discipline. In Progress in Landslide Science; Sassa, K., Fukuoka, H., Wang, F., Wang, G., Eds.; Springer: Berlin/Heidelberg, Germany, 2007. [Google Scholar]
  11. Hallal, N.; Yelles Chaouche, A.; Hamai, L.; Lamali, A.; Dubois, L.; Mohammedi, Y.; Hamidatou, M.; Djadia, L.; Abtout, A. Spatiotemporal evolution of the El Biar landslide (Algiers): New field observation data constrained by ground-penetrating radar investigations. Bull. Eng. Geol. Environ. 2019, 78, 5653–5670. [Google Scholar] [CrossRef]
  12. Hack, R. Geophysics for slope stability. Surv. Geophys. 2000, 21, 423–448. [Google Scholar] [CrossRef]
  13. Jongmans, D.; Garambois, S. Geophysical investigation of landslides: A review. Bulletin Société Géologique de France. BSGF Earth Sci. Bull. 2007, 178, 101–112. [Google Scholar] [CrossRef]
  14. Pasierb, B.; Grodecki, M.; Gwóźdź, R. Geophysical and geotechnical approach to a landslide stability assessment: A case study. Acta Geophys. 2019, 67, 1823–1834. [Google Scholar] [CrossRef]
  15. Lapenna, V.; Lorenzo, P.; Perrone, A.; Piscitelli, S.; Rizzo, E.; Sdao, F. 2D electrical resistivity imaging of some complex landslides in Lucanian Apennine chain, southern Italy. Geophysics 2005, 70, B11–B18. [Google Scholar] [CrossRef]
  16. Solberg, I.L.; Long, M.; Baranwal, V.C.; Gylland, A.S.; Rønning, J.S. Geophysical and geotechnical studies of geology and sediment properties at a quick-clay landslide site at Esp, Trondheim, Norway. Eng. Geol. 2016, 208, 214–230. [Google Scholar] [CrossRef]
  17. Bellanova, J.; Calamita, G.; Giocoli, A.; Luongo, R.; Macchiato, M.; Perrone, A.; Uhlemann, S.; Piscitelli, S. Electrical resistivity imaging for the characterization of the Montaguto landslide (southern Italy). Eng. Geol. 2018, 243, 272–281. [Google Scholar] [CrossRef]
  18. Whiteley, J.S.; Chambers, J.E.; Uhlemann, S.; Wilkinson, P.B.; Kendall, J.M. Geophysical monitoring of moisture-induced landslides: A review. Rev. Geophys. 2019, 57, 106–145. [Google Scholar] [CrossRef]
  19. Lapenna, V.; Perrone, A. Time-Lapse Electrical Resistivity Tomography (TL-ERT) for Landslide Monitoring: Recent Advances and Future Directions. Appl. Sci. 2022, 12, 1425. [Google Scholar] [CrossRef]
  20. Machane, D.; Bouhadad, Y.; Cheikh Lounis, G.; Chatelain, J.L.; Oubaiche, E.H.; Abbes, K.; Guillier, B.; Bensalem, R. Examples of geomorphologic and geological hazards in Algeria. Nat. Hazards 2008, 45, 295–308. [Google Scholar] [CrossRef]
  21. Hallal, N.; Dubois, L.; Bougdal, R.; Djouder, F. Instabilités gravitaires dans la région de Béjaïa (Algérie): Inventaire et appréciation de l’importance relative des différents paramètres conduisant au déclenchement, au maintien ou à l’activation des instabilités. Bull. Eng. Geol. Environ. 2018, 77, 631–645. [Google Scholar] [CrossRef]
  22. Hallal, N.; Bougdal, R.; Bensafia, W. Dédoublement du tunnel d’Aokas (BEJAIA): Geologie et caractérisation géotechnique du massif traversé. Stabilité de l’ouvrage. Bull. Eng. Geol. Environ. 2013, 72, 477–483. [Google Scholar] [CrossRef]
  23. Durand-Delga, M. Les unités à Mésozoïque métamorphique d’El Milia à Texenna (Algérie) et leur cadre structural. Bull. Société Géologique Fr. 1971, 7, 328–337. [Google Scholar] [CrossRef]
  24. Vila, J.M. La Chaîne Alpine d’Algérie Orientale et des Confins Algéro-Tunisiens. Ph.D. Thesis, Université Paris VI, Paris, France, 1980; 665p. [Google Scholar]
  25. Obert, D. Revue de Géologie Dynamique et de Géographie Physique; Masson: Issy-les-Moulineaux, France, 1984; Volume 1984, pp. 99–117. [Google Scholar]
  26. Leikine, M. Etude Géologique des Babors Occidentaux (Algérie). Ph.D. Thesis, Université de Paris, Paris, France, 1971; 536p. [Google Scholar]
  27. Hassissene, M. Etude Géologique du Djebel Arbalou-Gouraya: Éléments Occidentaux Du Domaine des Babors (Région de Béjaïa). Ph.D. Thesis, USTHB, Alger, Algérie, 1989; 96p. [Google Scholar]
  28. Glaçon, J. Recherches sur la géologie et les gîtes métallifères du Tell sétifien (Algérie). Bull. Du Serv. Géol. D’algérie Nouv. Sér. 1967, 32, 674. [Google Scholar]
  29. Glaçon, J. Le Gisement de Cavallo (El Aouana); Algérie, Bull, BRGM, 2, Section II, 6; Alger, Algérie, 1971; pp. 69–78. [Google Scholar]
  30. Fell, R.; Corominas, J.; Bonnard, C.; Cascini, L.; Leroi, E.; Savage, W.Z. Guidelines for landslide susceptibility, hazard and risk zoning for land use planning. Eng. Geol. 2008, 102, 85–98. [Google Scholar] [CrossRef]
Figure 1. Location of the landslide area in Bejaia city.
Water 16 00682 g001
Figure 2. Deformations observed: (a,b) inside the university, (c,d) inside the university residence.
Water 16 00682 g002
Figure 3. Geologic context of Bejaia city (extracted from the Geologic Map of the Béjaia region e = 1/50,000).
Water 16 00682 g003
Figure 4. The location of the recognition program: boreholes, cross-sections and ERT profiles.
Water 16 00682 g004
Figure 5. Landslide evolution indexes observed after heavy rainfall: (a,b) deformations observed on the wall surrounding the University residence; (c,d) cracks of the movement evolution observed upstream of the unstable area.
Water 16 00682 g005
Figure 6. (a) Cumulative precipitation effects on (b) groundwater regeneration monitored before and after pumping periods in the domestic well for the period from during the month of May.
Water 16 00682 g006
Figure 7. Geological-geotechnical cross-section along the longitudinal profile P3 performed from field observation and borehole (SC4 and SC3).
Water 16 00682 g007
Figure 8. Atterberg limits of the Miocene clays affected by the Targa Ouzemour landslide.
Water 16 00682 g008
Figure 9. Results of the identification tests carried out in the different boreholes. (a) Dry density (γd), (b) wet density (γh), (c) water content (W).
Water 16 00682 g009
Figure 10. (a) The model of resistivity inversion and (b) geological-geotechnical cross-section along the profile lines P1.
Water 16 00682 g010
Figure 11. (a) The model of resistivity inversion and (b) geological-geotechnical cross-section along the profile lines P1.
Water 16 00682 g011
Figure 12. (a) The model of resistivity inversion and (b) geological-geotechnical cross-section along the profile lines P3.
Water 16 00682 g012
Figure 13. Geomodel of the Targa Ouzemour landslide drawn from geotechnical data and ERT inversion sections.
Water 16 00682 g013
Table 1. ERT survey parameters implemented during data acquisition.
Parameters of ERT ArrayProfile Lines
Profile “P1”Profile “P2”Profile “P3”
Length of profile (m)115115115
Electrode spacing (m)555
Number of electrodes242424
Type of arrayDipole–DipoleDipole–DipoleDipole–Dipole
Table 2. Physical characteristics of the lithological formations of Traga Ouzemour landslide.
LithologyParameters
Wn (%)γd (t/m3)γh (t/m3)Sr (%)WL (%)Wp (%)IpCuu (Bars)Φuu (Deg)°
Clay16.441.852.1696.7050.1723.1227.050.357.8
Marl clay18.651.722.0588.8045,5822.523.080.3212.84
Disclaimer/Publisher’s Note: The statements, opinions and data contained in all publications are solely those of the individual author(s) and contributor(s) and not of MDPI and/or the editor(s). MDPI and/or the editor(s) disclaim responsibility for any injury to people or property resulting from any ideas, methods, instructions or products referred to in the content.

