Article

Future Changes in Hydro-Climatic Extremes across Vietnam: Evidence from a Semi-Distributed Hydrological Model Forced by Downscaled CMIP6 Climate Data

1
Faculty of Environment and Natural Resources, Nong Lam University-Ho Chi Minh City, Ho Chi Minh City 721400, Vietnam
2
Center for Technology Business Incubation, Nong Lam University-Ho Chi Minh City, Ho Chi Minh City 721400, Vietnam
3
Research Center for Climate Change, Nong Lam University-Ho Chi Minh City, Ho Chi Minh City 721400, Vietnam
4
Hydrological Sciences Laboratory, NASA Goddard Space Flight Center, Greenbelt, MD 20771, USA
5
Science Applications International Corporation, Greenbelt, MD 20771, USA
6
Faculty of Management Sciences, Thu Dau Mot University, Binh Duong 820900, Vietnam
7
School of Architecture and Civil Engineering, University of Adelaide, Adelaide, SA 5005, Australia
*
Author to whom correspondence should be addressed.
Water 2024, 16(5), 674; https://doi.org/10.3390/w16050674
Submission received: 14 January 2024 / Revised: 15 February 2024 / Accepted: 22 February 2024 / Published: 25 February 2024
(This article belongs to the Special Issue The Impact of Climate Change and Land Use on Water Resources)

Abstract

:
Flood hazards have led to substantial fatalities and economic loss in the last five decades, making it essential to understand flood dynamics in a warming climate. This study reports the first comprehensive assessment of projected flood hazards across Vietnam. We used downscaled climate data from the CMIP6 initiative, involving a total of 20 climate models, and streamflow projection simulated using a semi-distributed hydrological model. The assessment covers seven near-natural catchments, each representing a climate zone of the country. To evaluate climate change impacts on floods, the study simultaneously analyzes changes in three indices: (i) the annual hottest day temperature, to represent temperature extremes; (ii) the maximum daily rainfall amount, to represent rainfall extremes; and (iii) the discharge value exceeding 5% in a year, to assess streamflow extremes. Changes in the selected indices (relative to the reference period from 1985 to 2014) are assessed under four emission scenarios (SSP1–2.6, SSP2–4.5, SSP3–7.0, and SSP5–8.5) and two future time slices (2036–2065 and 2070–2099). Although the robustness (as indicated by multi-model agreement) and significance (identified through the statistical test) of the changes vary substantially, depending on the selected indices and assessed time slices, an overall increase is consistently identified across all of the assessed hydro-climatic extremes (up to 4.8 °C for temperature extremes, 43 mm for rainfall extremes, and 31% for streamflow extremes). The findings suggest a potential increase in flood risk across Vietnam in a warming climate, highlighting the urgent need for improved flood preparedness and investment to reduce economic loss and mortality in an uncertain future.

1. Introduction

In the Anthropocene, extreme weather events such as heatwaves, droughts, and heavy rainfall have become an interest for both scientists and the general public due to their multifaceted impacts: from altering natural systems to threatening human life and undermining various aspects of modern civilization. Over the last five decades, climate-related hazards have resulted in over 2 million fatalities and economic losses surpassing USD 4 trillion globally [1]. Although early warning systems for natural hazards have significantly reduced mortality rates, economic losses caused by hydro-climatic hazards continue to rise. This indicates increasing climate risks in a warming climate, posing a significant challenge to achieve sustainable development goals [2]. For instance, a consensus view on one implication of anthropogenic climate change is that more moisture content is available in a warmer atmosphere, leading to an intensification of flood-induced rainfall events [3,4]. In some regions, the magnitude of changes in extreme precipitation might be high (up to 80 mm) in the fossil-fuel development emission scenario [5], indicating potential implications for flood hazards.
Projecting the future state of hydrologic extremes, including floods, is a highly complicated task due to many aspects that modulate their dynamics [6]. Various studies have indicated that the relationship between extreme rainfall events and floods is nonlinear [7,8]. The signal of changes in floods is not necessarily consistent with that of extreme rainfall in many regions [9,10] as antecedent soil moisture and evapotranspiration dynamics also play a substantial role. Therefore, future changes in these hazards are usually assessed by coupling multiple modeling systems. In this approach, global climate models are used to generate projections of climate variables such as precipitation and temperature under different emission scenarios [11]. These variables are then fed into hydrologic models to project and examine future flood peaks on global, regional, and local (i.e., small catchment) scales [12,13,14].
It is important to note that findings from flood projection studies can vary significantly at different scales due to the “scale problem” in hydrology, in which point-based findings (the basis to build conceptual models) do not necessarily hold true when transferred into catchment (and larger)-scale applications [15]. Global hydrologic models are also constrained by limited in situ observations available for their validation, likely due to financial and political barriers [16,17]. Therefore, the outputs of these hydrologic models over data-poor regions can be highly uncertain. In addition, future changes in climatic extremes (e.g., extreme rainfall events) exhibit high spatial heterogeneity [18], and global or continental-scale studies might overlook important patterns in a specific region, which may be crucial to inform local adaptation and mitigation policies.
Vietnam is one of the countries that is most vulnerable to climate change impacts [19]. Extensive research has been performed in the country to study flood uncertainties, with a common focus on specific catchment areas, regions, or types of floods. For example, flash flood studies are the main focus for the mountainous areas in the north of Vietnam. Heavy rainfall and river geometry are primary parameters for modeling, prediction, and assessment of flash floods and their consequences in these regions [20,21]. In urban areas and major cities in Vietnam, the transformation of land cover and rapid urbanization are key factors contributing to changes in flood characteristics and associated risks [22,23,24]. In the Mekong Delta region of Vietnam, the flood season is characterized not only by continuous and heavy rainfall but also by discharges from the upper Mekong River regions as well as tidal flows from the East Sea [25]. The analysis of changes in the flood regime and frequency in this region often takes a broader perspective, covering trans-boundary issues, dam impacts, urban planning, tidal influences, and climate change [26,27,28]. Numerous other studies have examined floods in specific catchment areas, such as the Huong River basin [29] or the Vu Gia-Thu Bon River basin [30]. Some have focused on specific interests, such as the impact of reservoir operation on flooding [31] or utilizing machine learning for flood prediction [32,33].
These diversity in the studies makes it challenging to synthesize their findings into a comprehensive conclusion regarding future flood changes that could affect Vietnam’s sustainable development [34]. This challenge arises from the use of different models and setups, while the country is characterized by spatial heterogeneity in both climate features and topography [35,36]. In addition, the landscape across the country has been altered substantially in the last two decades to support economic development [37,38,39], leading to the potential influence of changes in the landscape being attributed to the findings about how climate change modulates changes in floods.
This study addresses the above-mentioned issues by conducting a comprehensive analysis on changes in hydro-climatic extremes for Vietnam, using a consistent modeling practice across seven catchments, each representing a climate zone in Vietnam. To minimize the influence of human interventions on the findings, we selected only catchments that have had minimal changes in landscape attributes over the last two decades. To demonstrate the robustness of the changes in the extreme indices, we used a substantial number of climate inputs, simulated from global climate models, to drive our hydrologic models. The investigation also takes into account possible scenarios of future global socioeconomic development and assesses changes in hydro-climatic extremes under four different climate scenarios available in the Coupled Model Intercomparison Project Phase 6 initiative.

2. Materials and Methods

Figure 1 demonstrates the assessment framework from our investigation, in which a hydrological model, the Soil and Water Assessment Tool (SWAT), was customized for seven different catchments (described in Section 2.1), each representing a climate region of Vietnam. These SWAT models were developed using landscape attributes and climate datasets from reliable sources. These models were calibrated and validated with in situ streamflow observations (see Section 2.2 and Section 2.3). The validated models were subsequently employed to simulate historical and projected streamflow under different emission scenarios using the climate forcing downscaled from the Coupled Model Intercomparison Project Phase 6 (as described in Section 2.2.2). Finally, we calculated extreme indices (as outlined in Section 2.4) to assess the dynamics of hydro-climatic extremes across Vietnam over the historical and future periods.

2.1. Study Area

Seven catchments across Vietnam were selected (Figure 2 and Table 1) for their diverse hydro-meteorological characteristics to assess changes in hydrological regimes influenced by climate change. These catchments cover a wide range of attributes, for example, their catchment area ranges from 603 to 6392 km2, and areal percentages of forest land range from 6.2 to 84.9%. Each selected catchment is located entirely within a Vietnamese sub-climate region [40] including:
  • Xa La catchment (hereafter referred to as XLA): a tributary of the Ma River basin down to Xa La hydrological station in the northwest climate region (denoted as R1 region in Figure 2);
  • Chu catchment (CHU): a tributary of the Hong–Thai Binh River basin down to Chu hydrological station in the northeast climate region (denoted as R2 region in Figure 2);
  • Nghia Khanh catchment (NKH): a tributary of the Ca River basin down to Nghia Khanh hydrological station in the North Delta climate region (denoted as R3 region in Figure 2);
  • Son Diem catchment (SDI): a tributary of the Ca River basin down to Son Diem hydrological station in the north-central climate region (denoted as R4 in Figure 2);
  • An Hoa catchment (AHO): a tributary of the Tra Khuc River basin down to An Hoa hydrological station in the south-central climate region (denoted as R5 in Figure 2);
  • Giang Son catchment (GSO): a tributary of the Srepok River basin down to Giang Son hydrological station in the Central Highlands climate region (denoted as R6 in Figure 2); and
  • Can Dang catchment (CDA): a tributary of the Sai Gon–Dong Nai River basin down to Can Dang hydrological station in the southern and Mekong Delta climate region (denoted as R7 in Figure 2).
These catchments were selected because of their data availability (i.e., decades of worthy streamflow records). In addition, they were not affected by significant human interventions such as large dams, extensive urban development, or substantial changes in land use during the 2000–2019 period. These features make them “near-natural” catchments, which are suitable for investigating long-term changes in hydro-climate regimes and water resources in Vietnam [41]. Moreover, these catchments also exhibit considerable variability in annual total rainfall (ranging from about 1400 mm to 3800 mm) as well as average altitude (ranging from 3 m to over 2000 m above sea level). This diversity provides the possibility to generalize the implication of climate changes to hydrologic extremes over Vietnam, a country characterized by a spatially heterogeneous climate and topography.

2.2. Data Collection

2.2.1. Hydro-Climate Records

The rainfall and streamflow data utilized in this research were obtained from the Vietnam Meteorological and Hydrological Administration (VMHA) (http://kttvqg.gov.vn/; access date: 20 February 2024). Prior to their delivery to the VMHA, these data were recorded and underwent thorough quality control at regional meteorological and hydrological services, ensuring the versions used in our analysis were properly post-processed.
Daily streamflow data were recorded from seven stream gauges, the descriptions of which are provided in Table 1. The selection of rain gauges was based on their proximity to these stream gauges. From the rain gauge metadata from VMHA, we identified and gathered as many nearby rain gauges as possible. This process resulted in a collection of 44 daily rain gauge time series, with the number of rain gauges per basin ranging from 1 (AHO) to 4 (NKH). The availability of streamflow and rain gauge data varies from station to station, primarily due to variations in the initiation of measurements: stations in north Vietnam often began recording in the 1960s–1970s, whereas those in central and south Vietnam have only been collecting data since the end of the 1970s. Overall, we have data records spanning over several decades (from 38 to 62 years) for each basin, which is sufficient to develop hydrological models that capture hydrological responses to different states of the climate, and thus, are suitable for climate change assessment.
The minimum and maximum daily air temperature data for each basin were derived from the Global Land Data Assimilation System (GLDAS) simulation data products [42]. In this study, we used the 3 h GLDAS_NOAH025.2.0 and GLDAS_NOAH025_3H.2.1 data products, obtained from the NASA Goddard Earth Sciences (GES) Data and Information Services Center (DISC) (https://disc.gsfc.nasa.gov/; access date: 20 February 2024). Each day’s maximum and minimum air temperatures were estimated from eight values in the GLDAS time series. We used both NOAH version 2.0 and version 2.1 to ensure that the temperature time series covered the calibration and validation periods across all catchments (i.e., from 1980 onward).

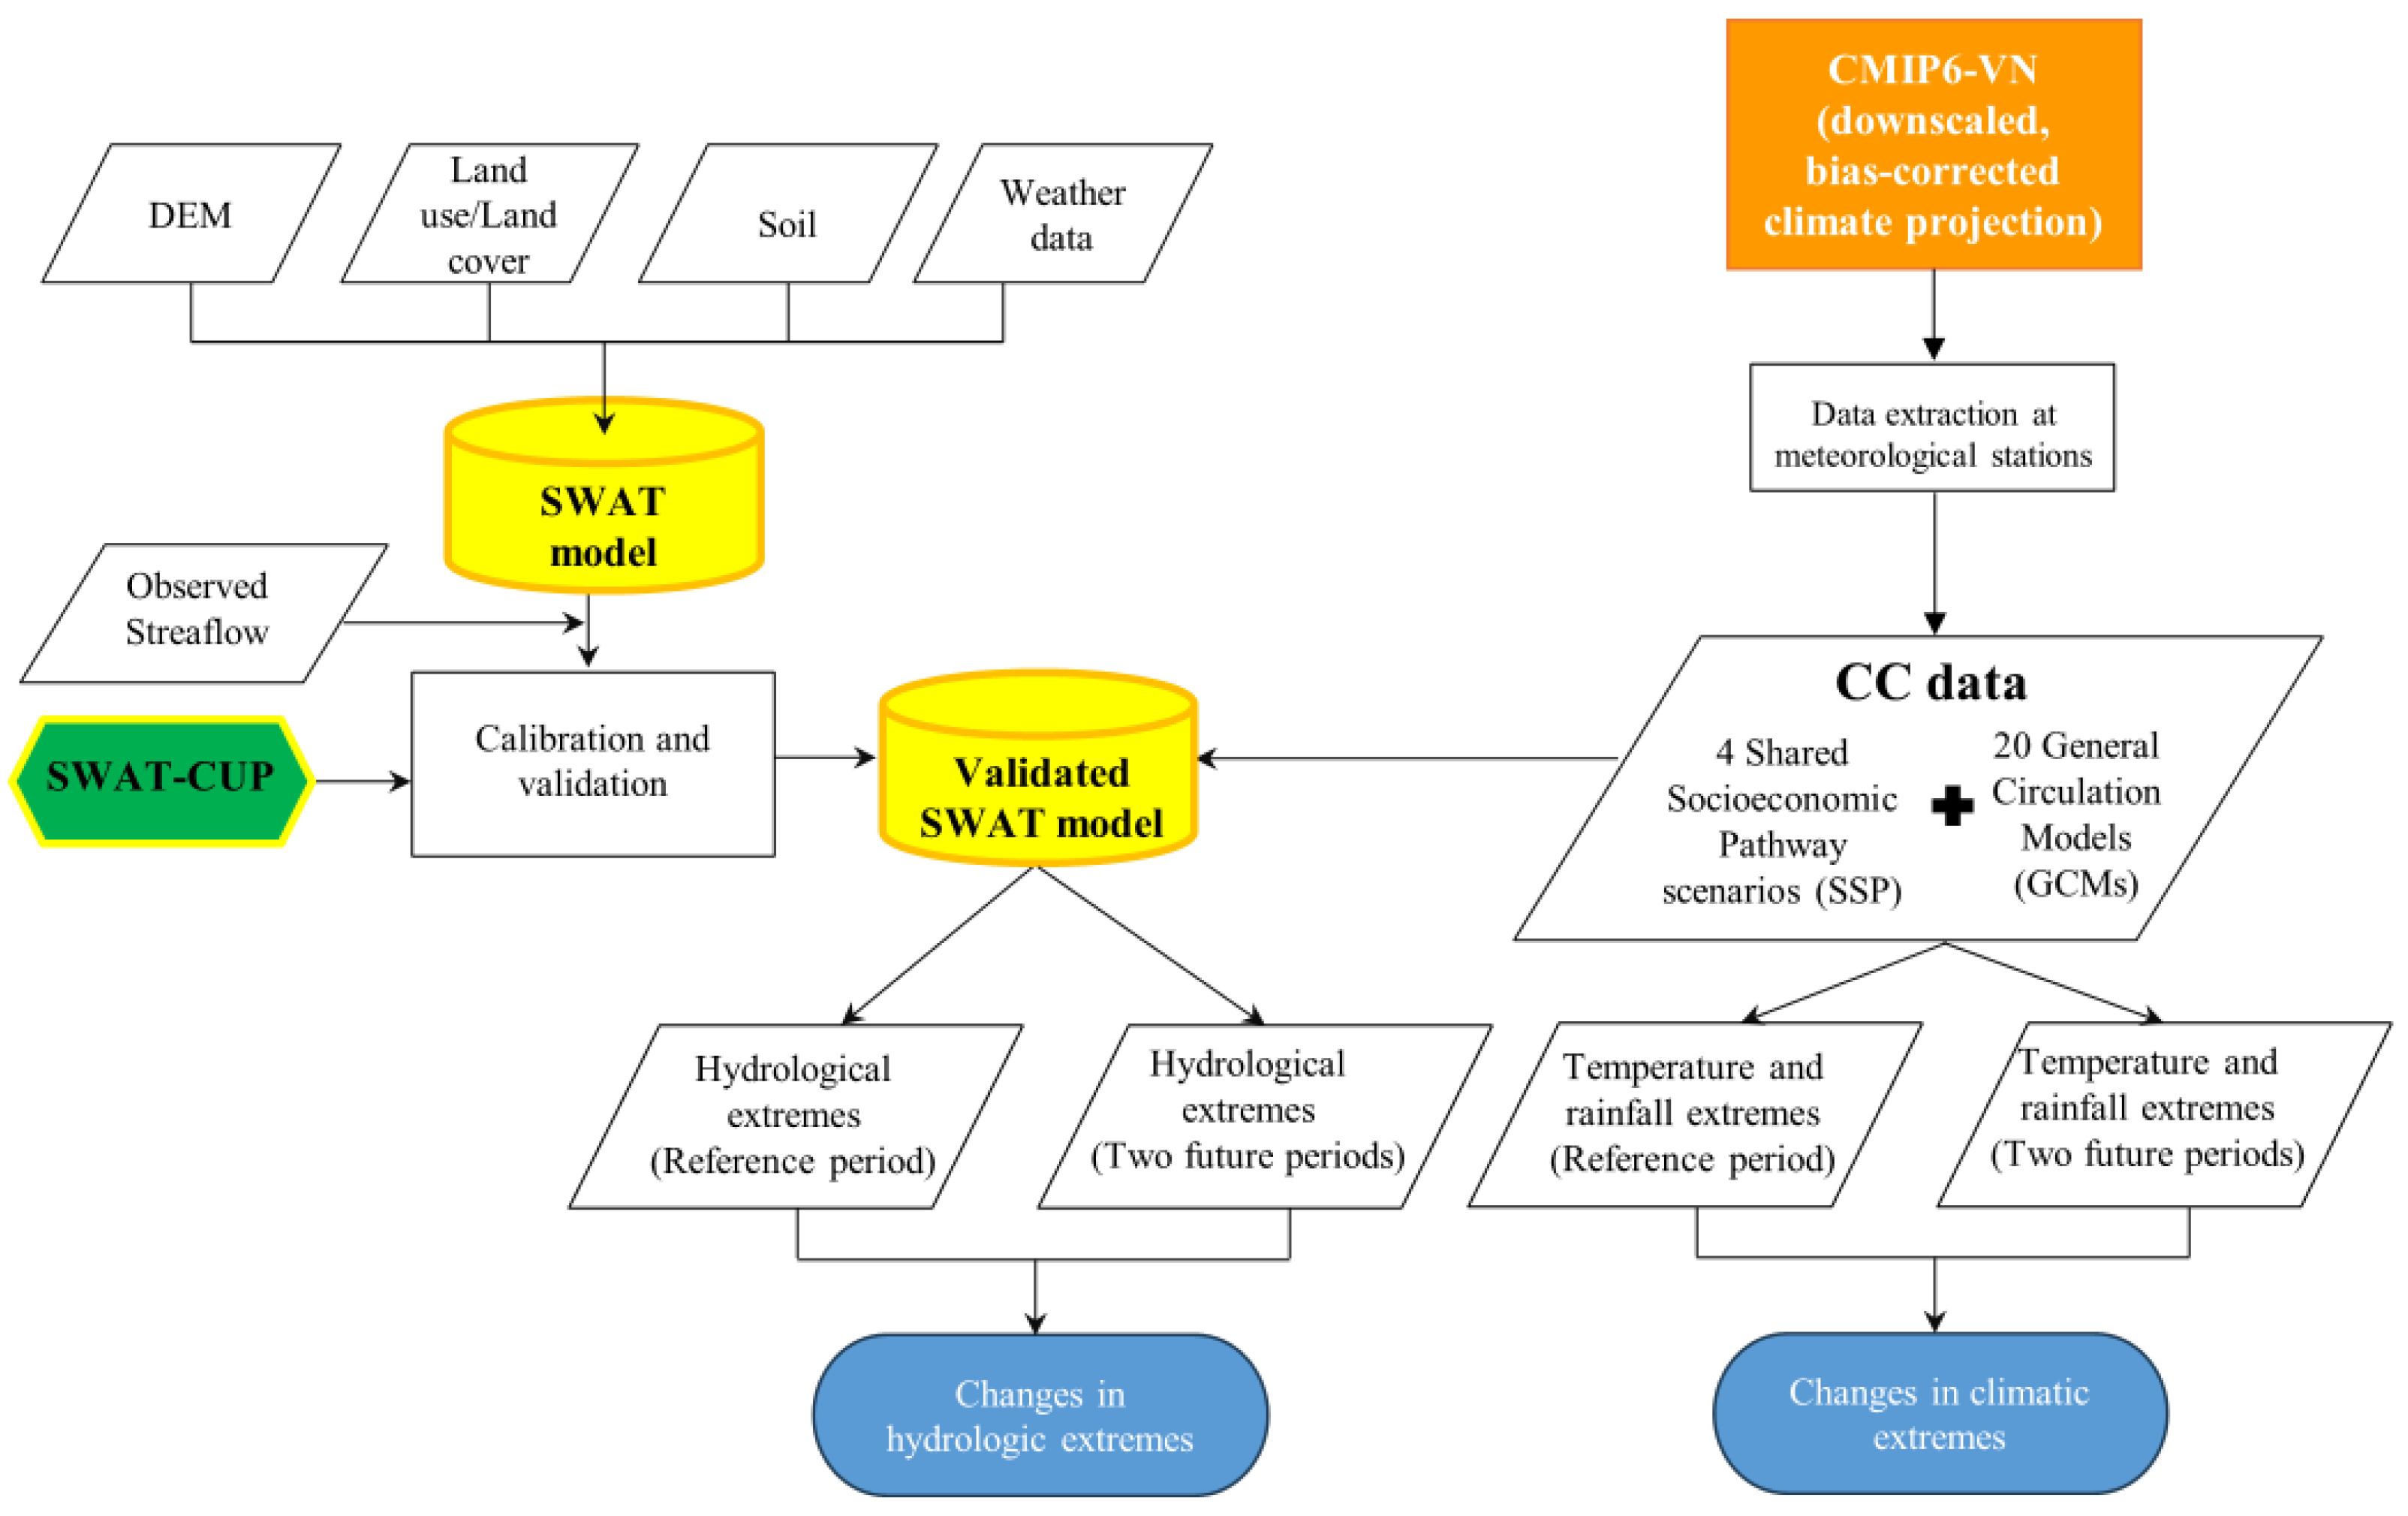
2.2.2. Downscaled Climate Projections

To conduct this research, high-resolution projections of temperature and precipitation are necessary. Previous SWAT applications usually downscaled climate forcing from global climate models (GCMs) to a suitable spatial resolution [43,44]. In this study, we leveraged CMIP6-VN, a data product of downscaled temperature and precipitation of the Coupled Model Intercomparison Project Phase 6 (CMIP6) for Vietnam [45]. CMIP6-VN was developed using the bias correction and spatial disaggregation method, which (i) bias-corrects monthly GCM simulations using ground-truth data, then (ii) temporally disaggregates them into daily time series. This recently published dataset covers the historical period (from 1980 to 2014) and future projections (from 2015 to 2099) from 35 GCMs. Our analysis focuses on 24 GCMs from CMIP6 tier-1 (shared socioeconomic pathways (SSPs) 1–2.6, 2–4.5, 3–7.0, and 5–8.5), as listed in Table 2. The selected SSPs (i.e., SSP1–2.6, SSP2–4.5, SSP3–7.0, and SSP5–8.5) generally provide a full range of possible socioeconomic changes at the global scale up to 2100 (as defined in the IPCC’s AR6 [46]). These scenarios determine the greenhouse gas concentration in the atmosphere, which modulates the global radiative forcing and ultimately drives changes in climate variables (e.g., temperature and rainfall).
We then selected downscaled temperature and precipitation from 20 GCMs that are available for the historical as well as four SSP simulations (see Table 2). We extracted daily maximum and minimum temperature and precipitation data from each of the 20 GCMs available in the CMIP6-VN dataset, for both the historical period and future simulations over four SSPs. The extracted data were then used to assess changes in climatic extremes and to force hydrological models to generate streamflow estimates for this analysis.

2.3. Hydrological Model Development and Validation

In this study, we applied the Soil and Water Assessment Tool (SWAT) model [47]. Specifically, we used the SWAT rev 681 version that is compatible with the QGIS 3.16 software for this modeling practice. We used the QSWAT3 v1.6.5 tool (which is manually installed as a plug-in to QGIS) to set up the model. Additionally, the SWAT Editor 2012 was used for editing SWAT inputs and calibrating the models. An initial two-year warm-up phase was used consistently across all catchments. Note that the calibration and validation periods varied between catchments due to streamflow data availability (reported in Table 1).
In addition to hydro-climatic observations (described in Section 2.2.1), we also collected the following spatial datasets to represent topography, land use, and soil across the selected catchments:
  • For topography data, we used the Terra Advanced Spaceborne Thermal Emission and Reflection Radiometer (ASTER) digital elevation model (D.E.M.). This dataset is jointly developed by the National Aeronautics and Space Administration and Japan’s Ministry of Economic, Trade, and Industry and was downloaded from USGS’s Earth Explorer website (https://earthexplorer.usgs.gov/; access date: 20 February 2024).
  • For land use data, we used the European Space Agency Climate Change Initiative Land Cover dataset (ESA-LC) (available at https://www.esa-landcover-cci.org; access date: 20 February 2024) and modified the classification to obtain information appropriate to the SWAT model’s structure [47].
  • For soil data, we used the Harmonized World Soil Database (HWSD) version 1.2 [24]. The data were reformatted to be readable by the SWAT model [47].
The developed SWAT models were calibrated and validated with the observed streamflow data using the SWAT Calibration and Uncertainty Program (SWAT-CUP). This program was specifically designed to assess the performance of SWAT models and offers various algorithms for parameter optimization. In this study, we used the Uncertainty in Sequential Uncertainty Fitting algorithm version 2 [48].
To quantify the capacity of SWAT models in simulating streamflow, we used the evaluation metrics that have been used extensively in hydrologic modeling studies: the Nash–Sutcliffe efficiency coefficient (NSE), ratio of the root mean square error between simulated and observed values to the standard deviation of the observations (RSR), and percent bias (PBIAS) [49,50]. The below equations describe the calculation of the selected metrics:
N S E = 1 i = 1 n ( X o b s , i X e s t , i ) 2 i = 1 n ( X o b s , i X o b s ¯ ) 2
R S R = i = 1 n ( X o b s , i X e s t , i ) 2 i = 1 n ( X o b s , i X o b s ¯ ) 2
P B I A S = i = 1 n X o b s , i X e s t , i × 100 i = 1 n X o b s , i
where Xobs,i and Xest,i are the observed and estimated values at time step i (day), and X o b s ¯ is the average of the observed values.
A useful rule of thumb is that a higher (or lower) value of NSE (RSR or PBIAS) indicates better model performance. We note, however, that there is no strict definition of a good value, as it depends on the purpose of the assessment. For instance, our investigation does not put a high emphasis on model accuracy, so these metrics are not used to remove models that are not associated with good accuracy. The focus of our work is to use a physically based hydrologic model to simulate streamflow under different climate conditions. This will enable the possibility of understanding how streamflow extremes will respond to a warming climate under different socioeconomic scenarios. As a result, we used the above-mentioned indicators to obtain information on the uncertainty introduced by the models in our conclusion of changes in hydro-climatic extremes.

2.4. Assessing Climate Changes and Variability

To evaluate changes in hydro-climatic extremes at selected sites, we calculated extreme indices for the historical period (from 1985 to 2014) and two future time frames (mid-century, from 2036 to 2065 and end-century, from 2070 to 2099) for four SSP emission scenarios. We note that we used the catchment-wide average climate time series and streamflow simulated at the catchment outlet for this calculation.
In a warming climate, numerous studies have suggested a potential increase in wet extremes due to the increasing capacity of the atmosphere to hold water content [3,51,52]. This is also the focus of our investigation:
  • To assess temperature extremes, we computed the annual hottest day index (TXx), represented by the yearly maximum value of the maximum daily temperature.
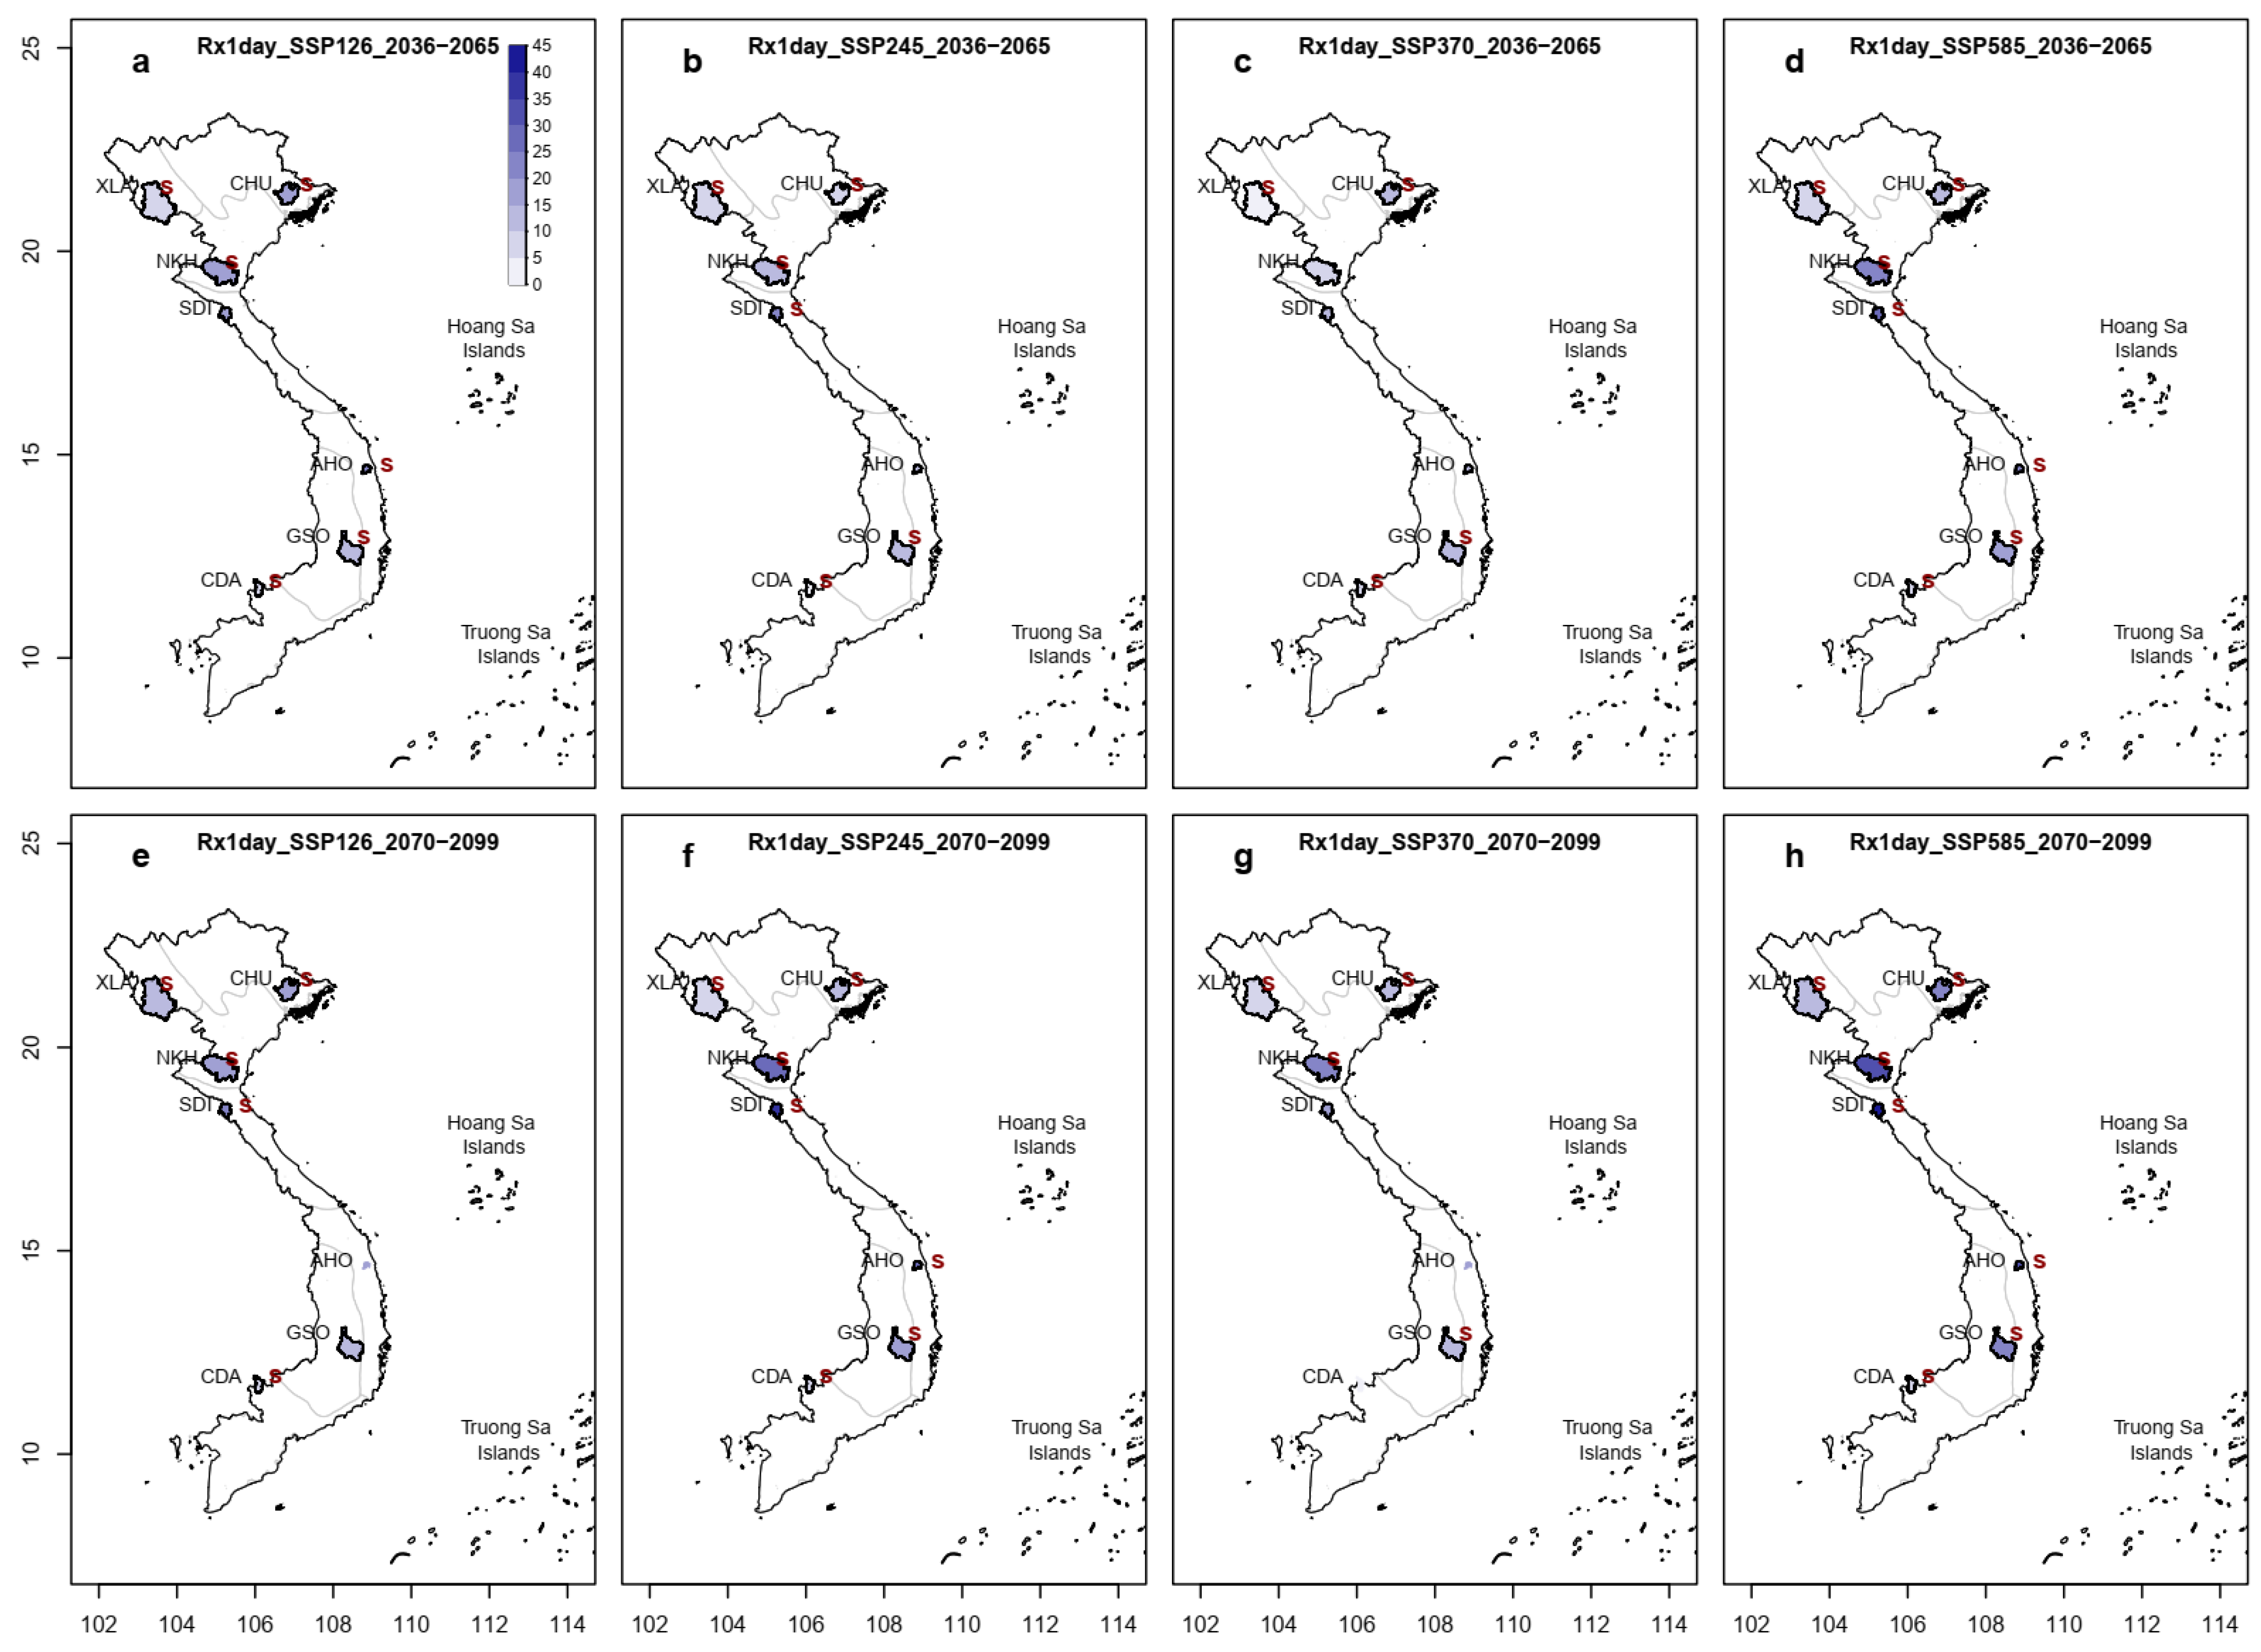
  • To assess rainfall extremes, we computed the maximum daily rainfall amount (Rx1day), represented by the yearly maximum value of daily rainfall.
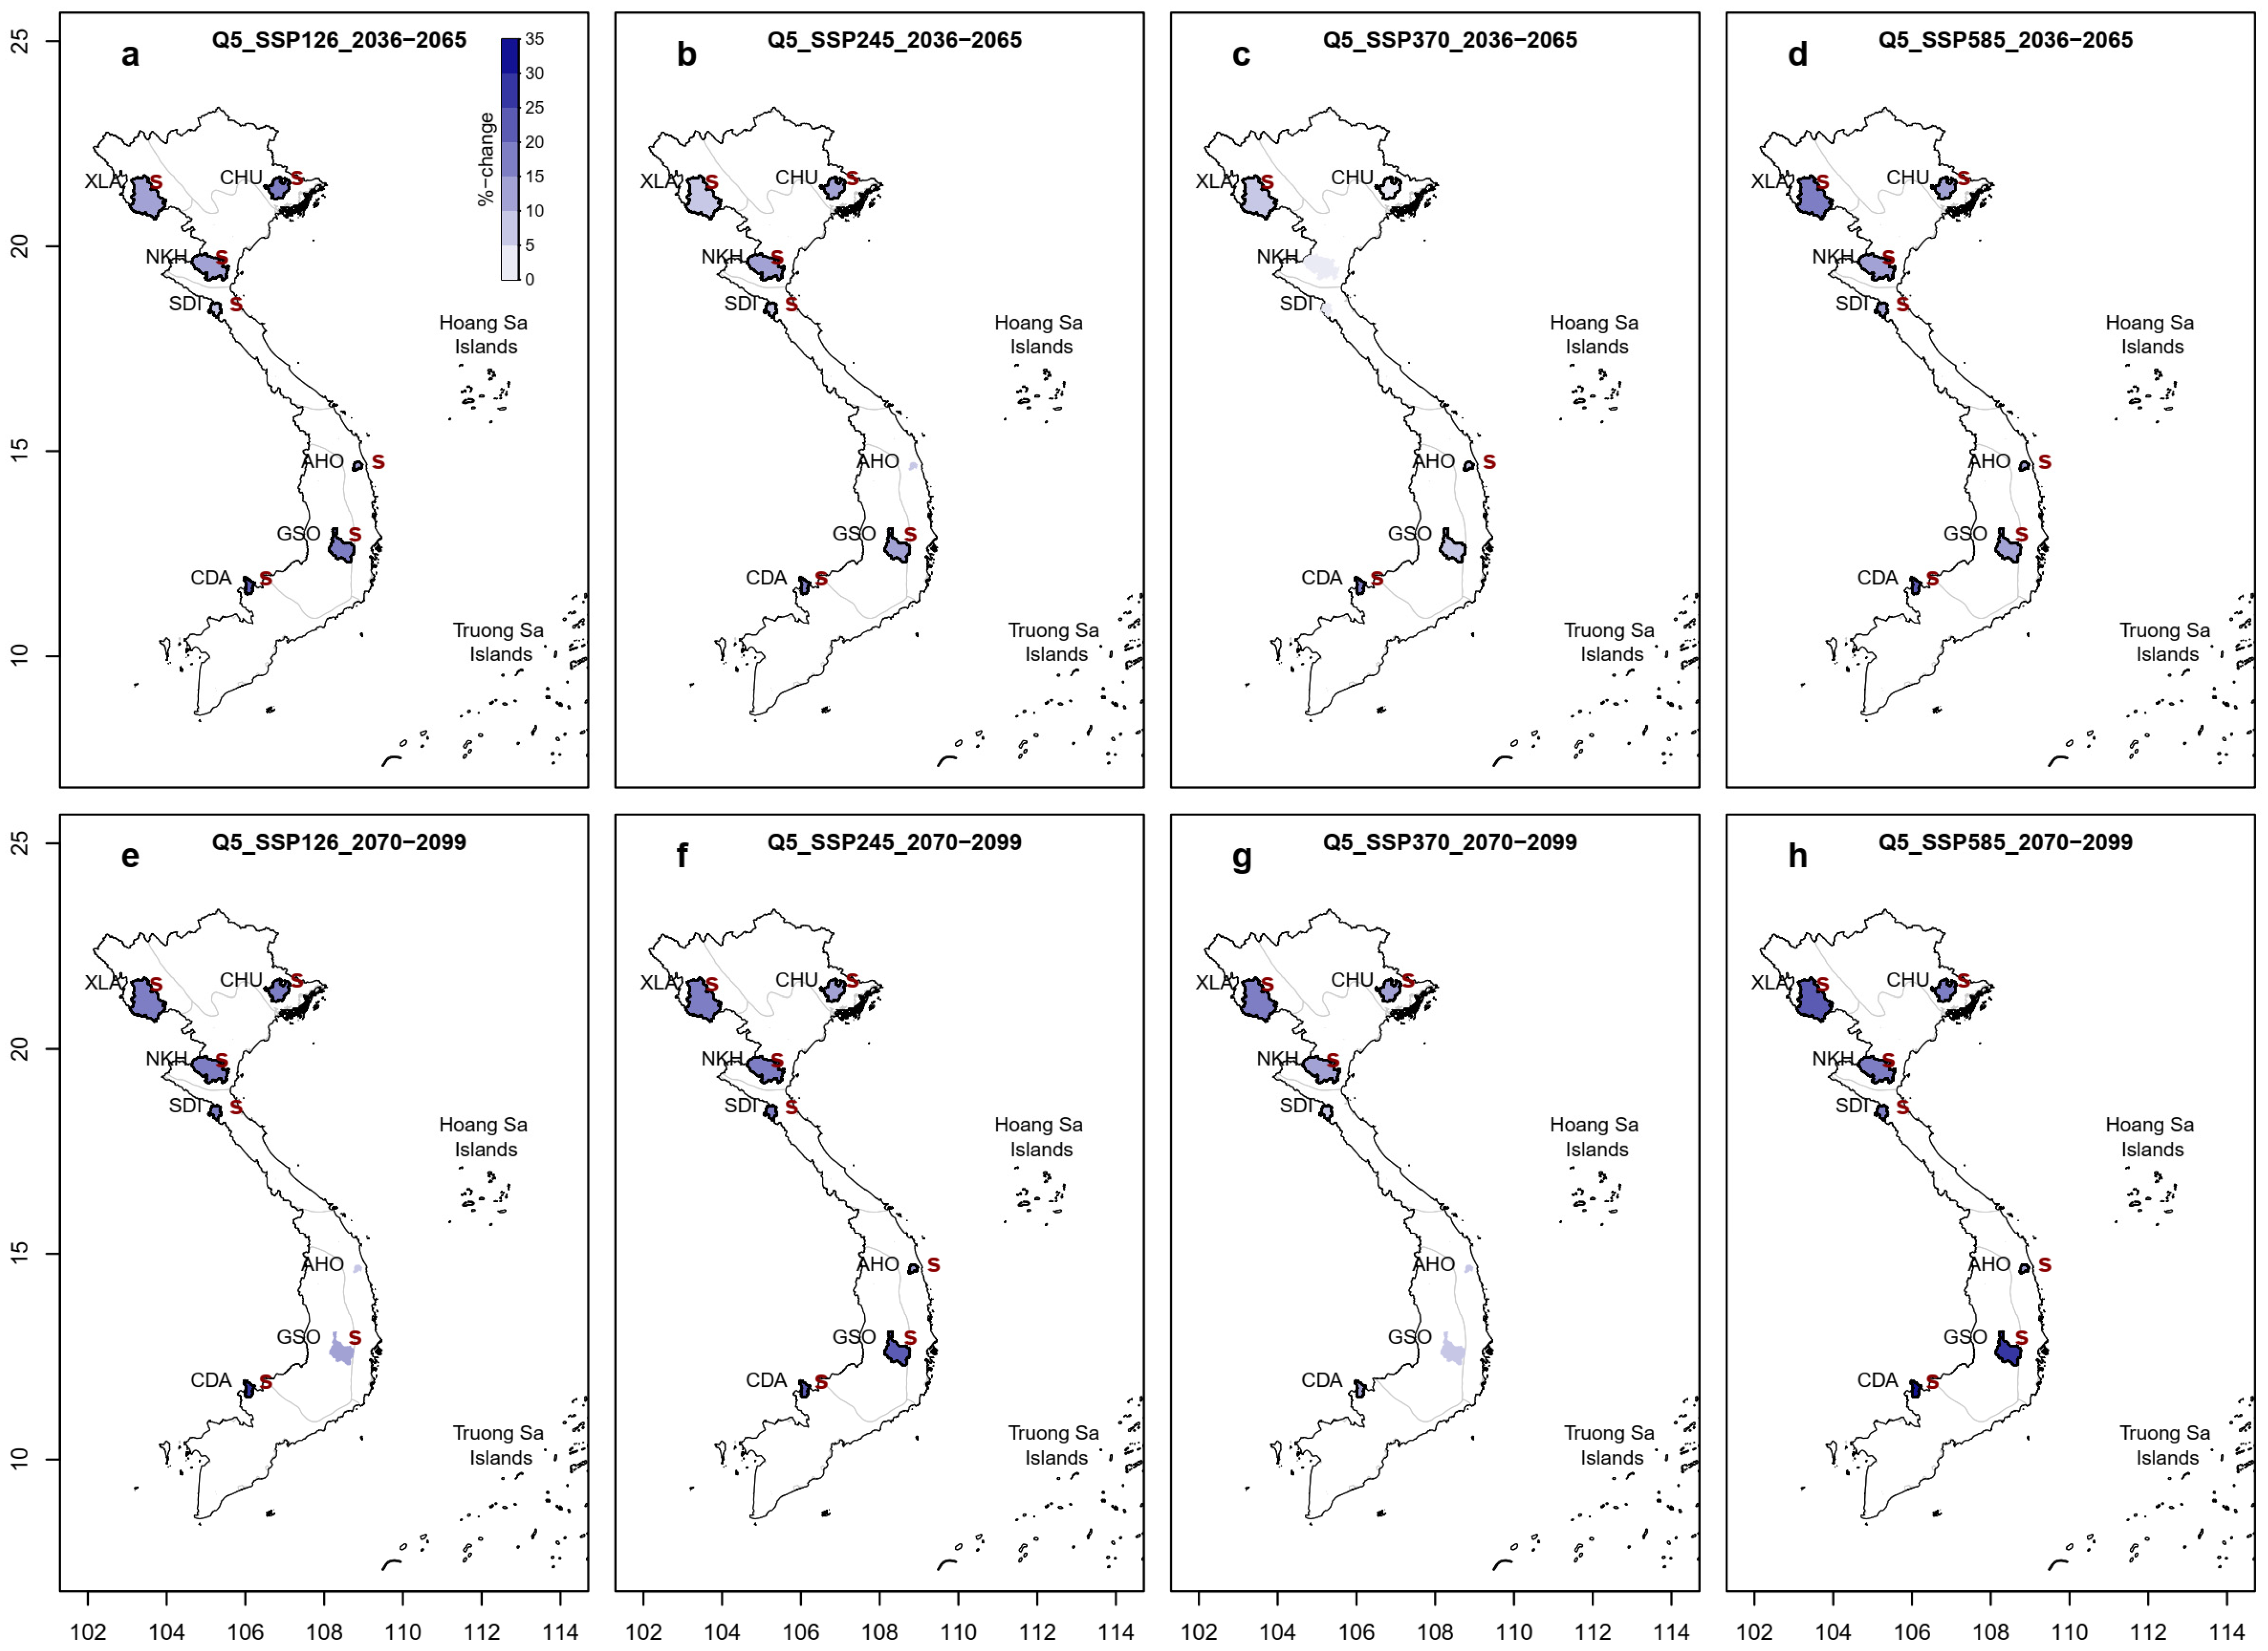
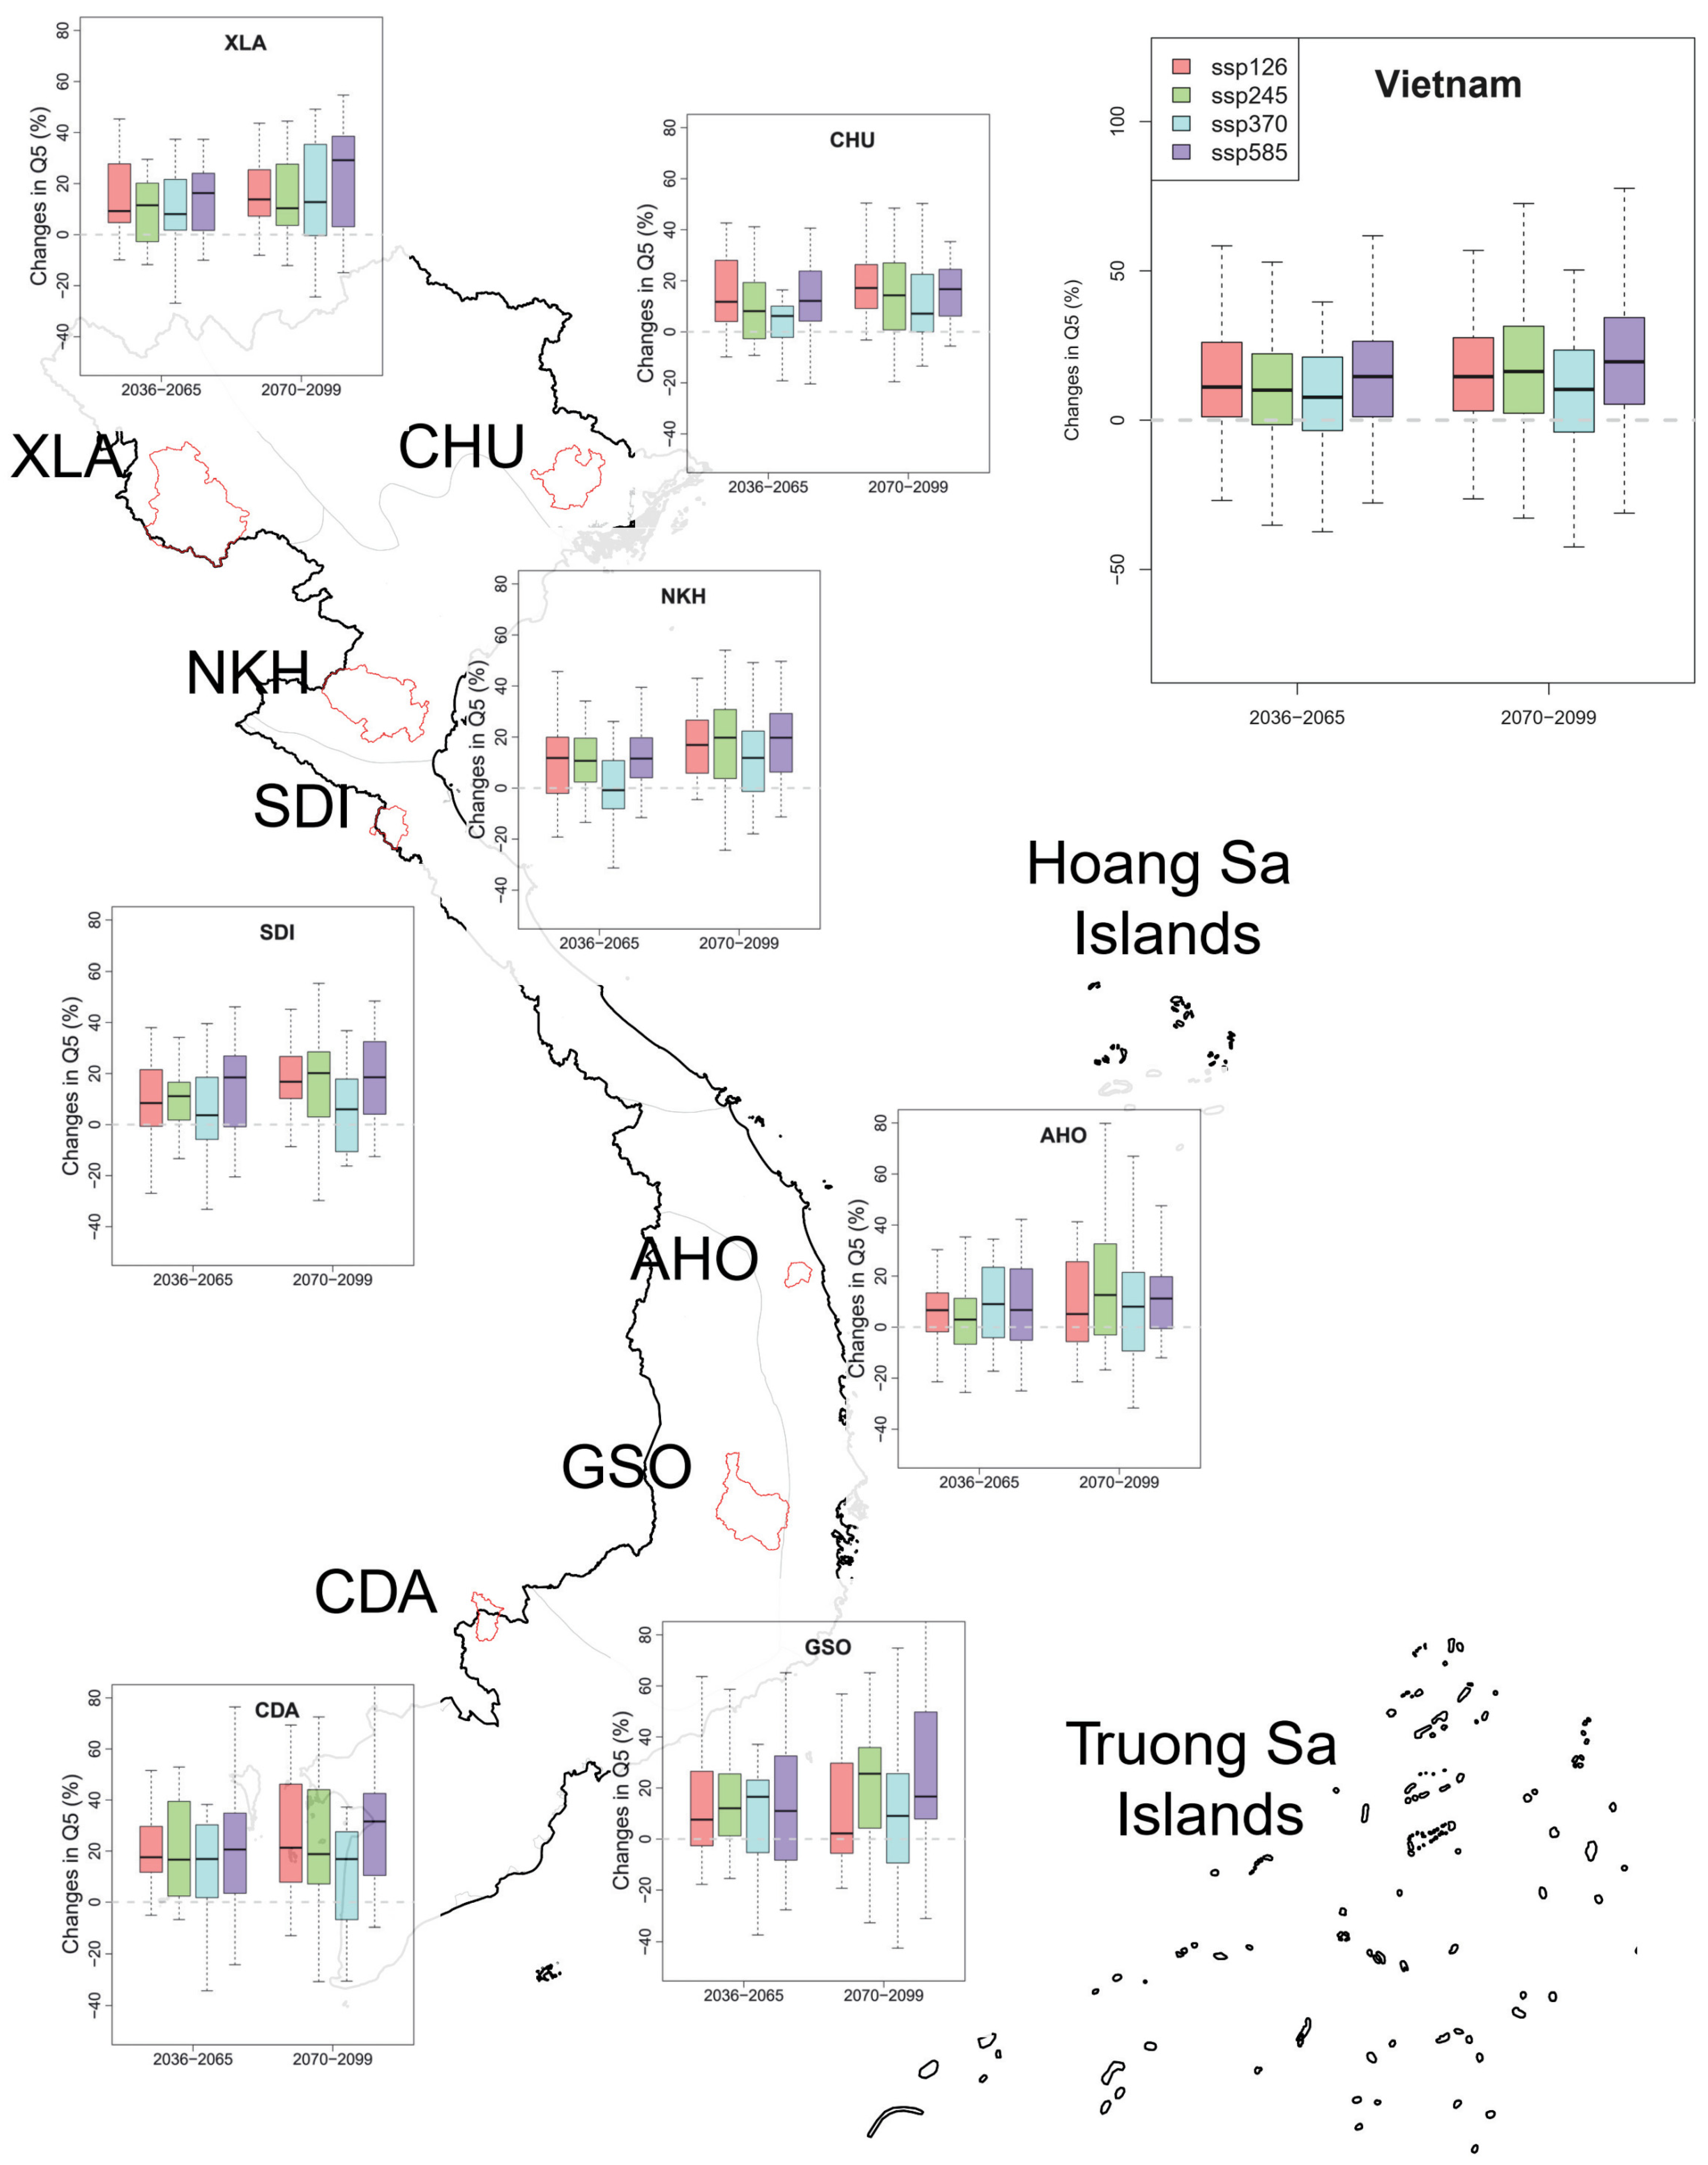
  • To assess streamflow extremes, we computed the discharge value exceeded only 5% of the time in a year (Q5).
To evaluate future changes in these extreme indices, we used spatial and box plots to support our assessment of the robustness and significance of changes. We adopted the approach used in previous work [5,12] and defined the robustness of the identified signals of changes based on the agreement across model projections (i.e., whether at least 66%, or 13 out of 20 models, consistently exhibited an increasing or decreasing signal). The significance of changes, at each catchment, was assessed using a standard two-tailed Student’s t-test between the indices computed over a future time slice (mid-century or end-century) and that computed from the reference period (i.e., from 1985 to 2014) to determine if the change was statistically significant at the 5% significance level.

3. Results

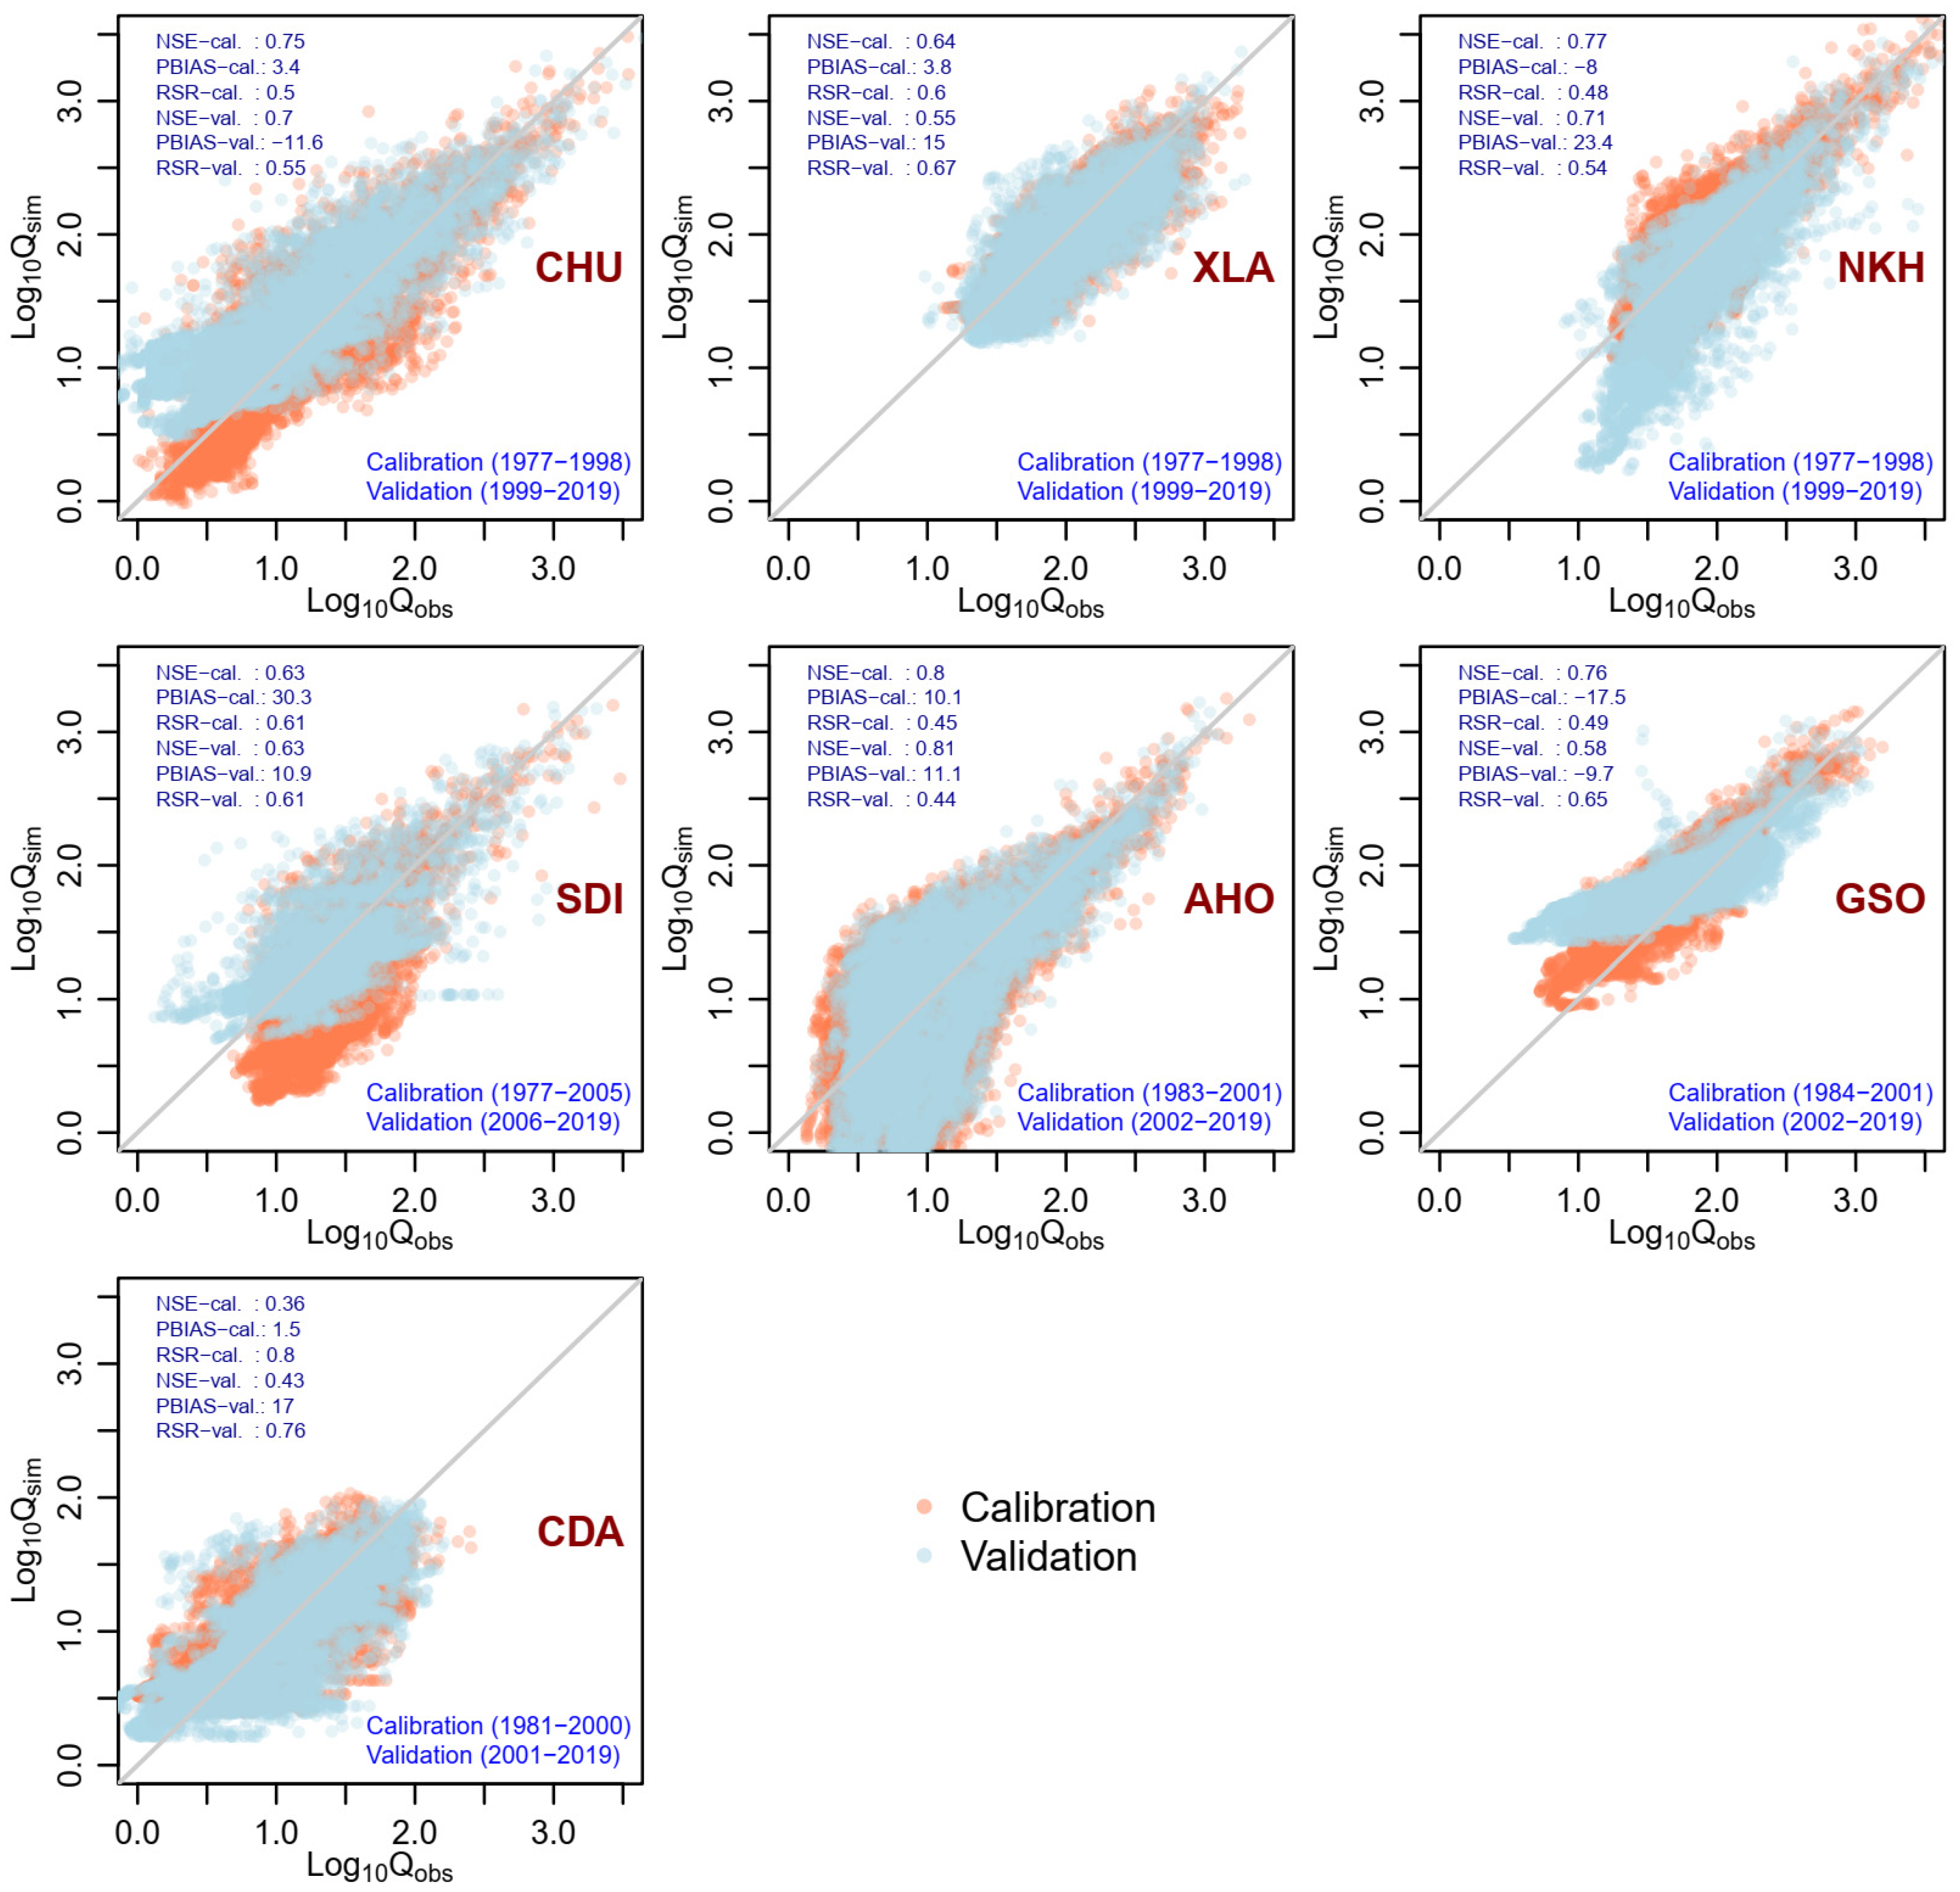
3.1. SWAT Model Performance

To enable the assessment of projected changes in streamflow extremes, an independent SWAT model at the daily timescale was first developed for each catchment. Eighteen parameters (see the full list of these parameter and the sensitivity analysis results in Table S1 of the Supplementary Materials) commonly used in streamflow modeling practices [53,54,55] were selected for our investigation. We conducted a global sensitivity analysis for the selected parameters and found that ten parameters (e.g., CN2, SOL_AWC, ESCO as shown in Table S1 of the Supplementary Materials) exhibited a significant impact on streamflow simulation over at least one catchment. Some other parameters were found to be insignificant (such as ALPHA_BF and GW_REVAP), indicating that some processes, such as groundwater dynamics, may not significantly impact streamflow generation over the study area.
Figure 3 illustrates the agreement between daily simulated and observed streamflow for the calibration and validation periods across seven selected catchments. We note that the two periods (calibration and validation) were designed to yield a similar amount of data points for model evaluation. Due to varying data quality (e.g., streamflow record is not available from 1982 to 1996 for the SDI catchment), the calibration and validation periods are not the same across the seven catchments (see notes at the bottom right of each panel). The models performed quite well over most of the assessed sites (except for the CDA catchment), yielding favorable values for the NSE, RSR, and PBIAS metrics over both the calibration and validation periods. We note that the values of NSE, RSR, and PBIAS over the CDA catchment (0.36, 0.8, and 1.5 for the calibration period; 0.43, 0.76, and 17 for the validation period, respectively) do not meet the “satisfactory” thresholds that are often reported in hydrological modeling applications [49]. This result is likely due to the absence of adequate observations of rainfall data. Specifically, the SWAT model at the CDA catchment was developed with only one rain gauge that is located outside of the catchment boundary. Overall, the models performed slightly better during the calibration period relative to the validation one, and the NSE values range from 0.36 to 0.8, the RSR values range from 0.45 to 0.8, while the PBIAS values also fall within the acceptable rating (the values range from −17.5% to 30.3%). It is important to note that the PBIAS indicates that most models tend to overestimate streamflow (for both the calibration and validation periods) across the catchments. Nevertheless, the simulation has generally captured the seasonal cycle and long-term average of the annual streamflow (see Figures S2 and S3a in the Supplementary Materials), indicating the relevance of using them for climate change assessments. The values of the Q5 index calculated from the simulated streamflow also show relatively good agreement with those calculated from the observed streamflow (see Figure S3b in the Supplementary Materials). These results further confirm the appropriateness of the calibrated models for this investigation.

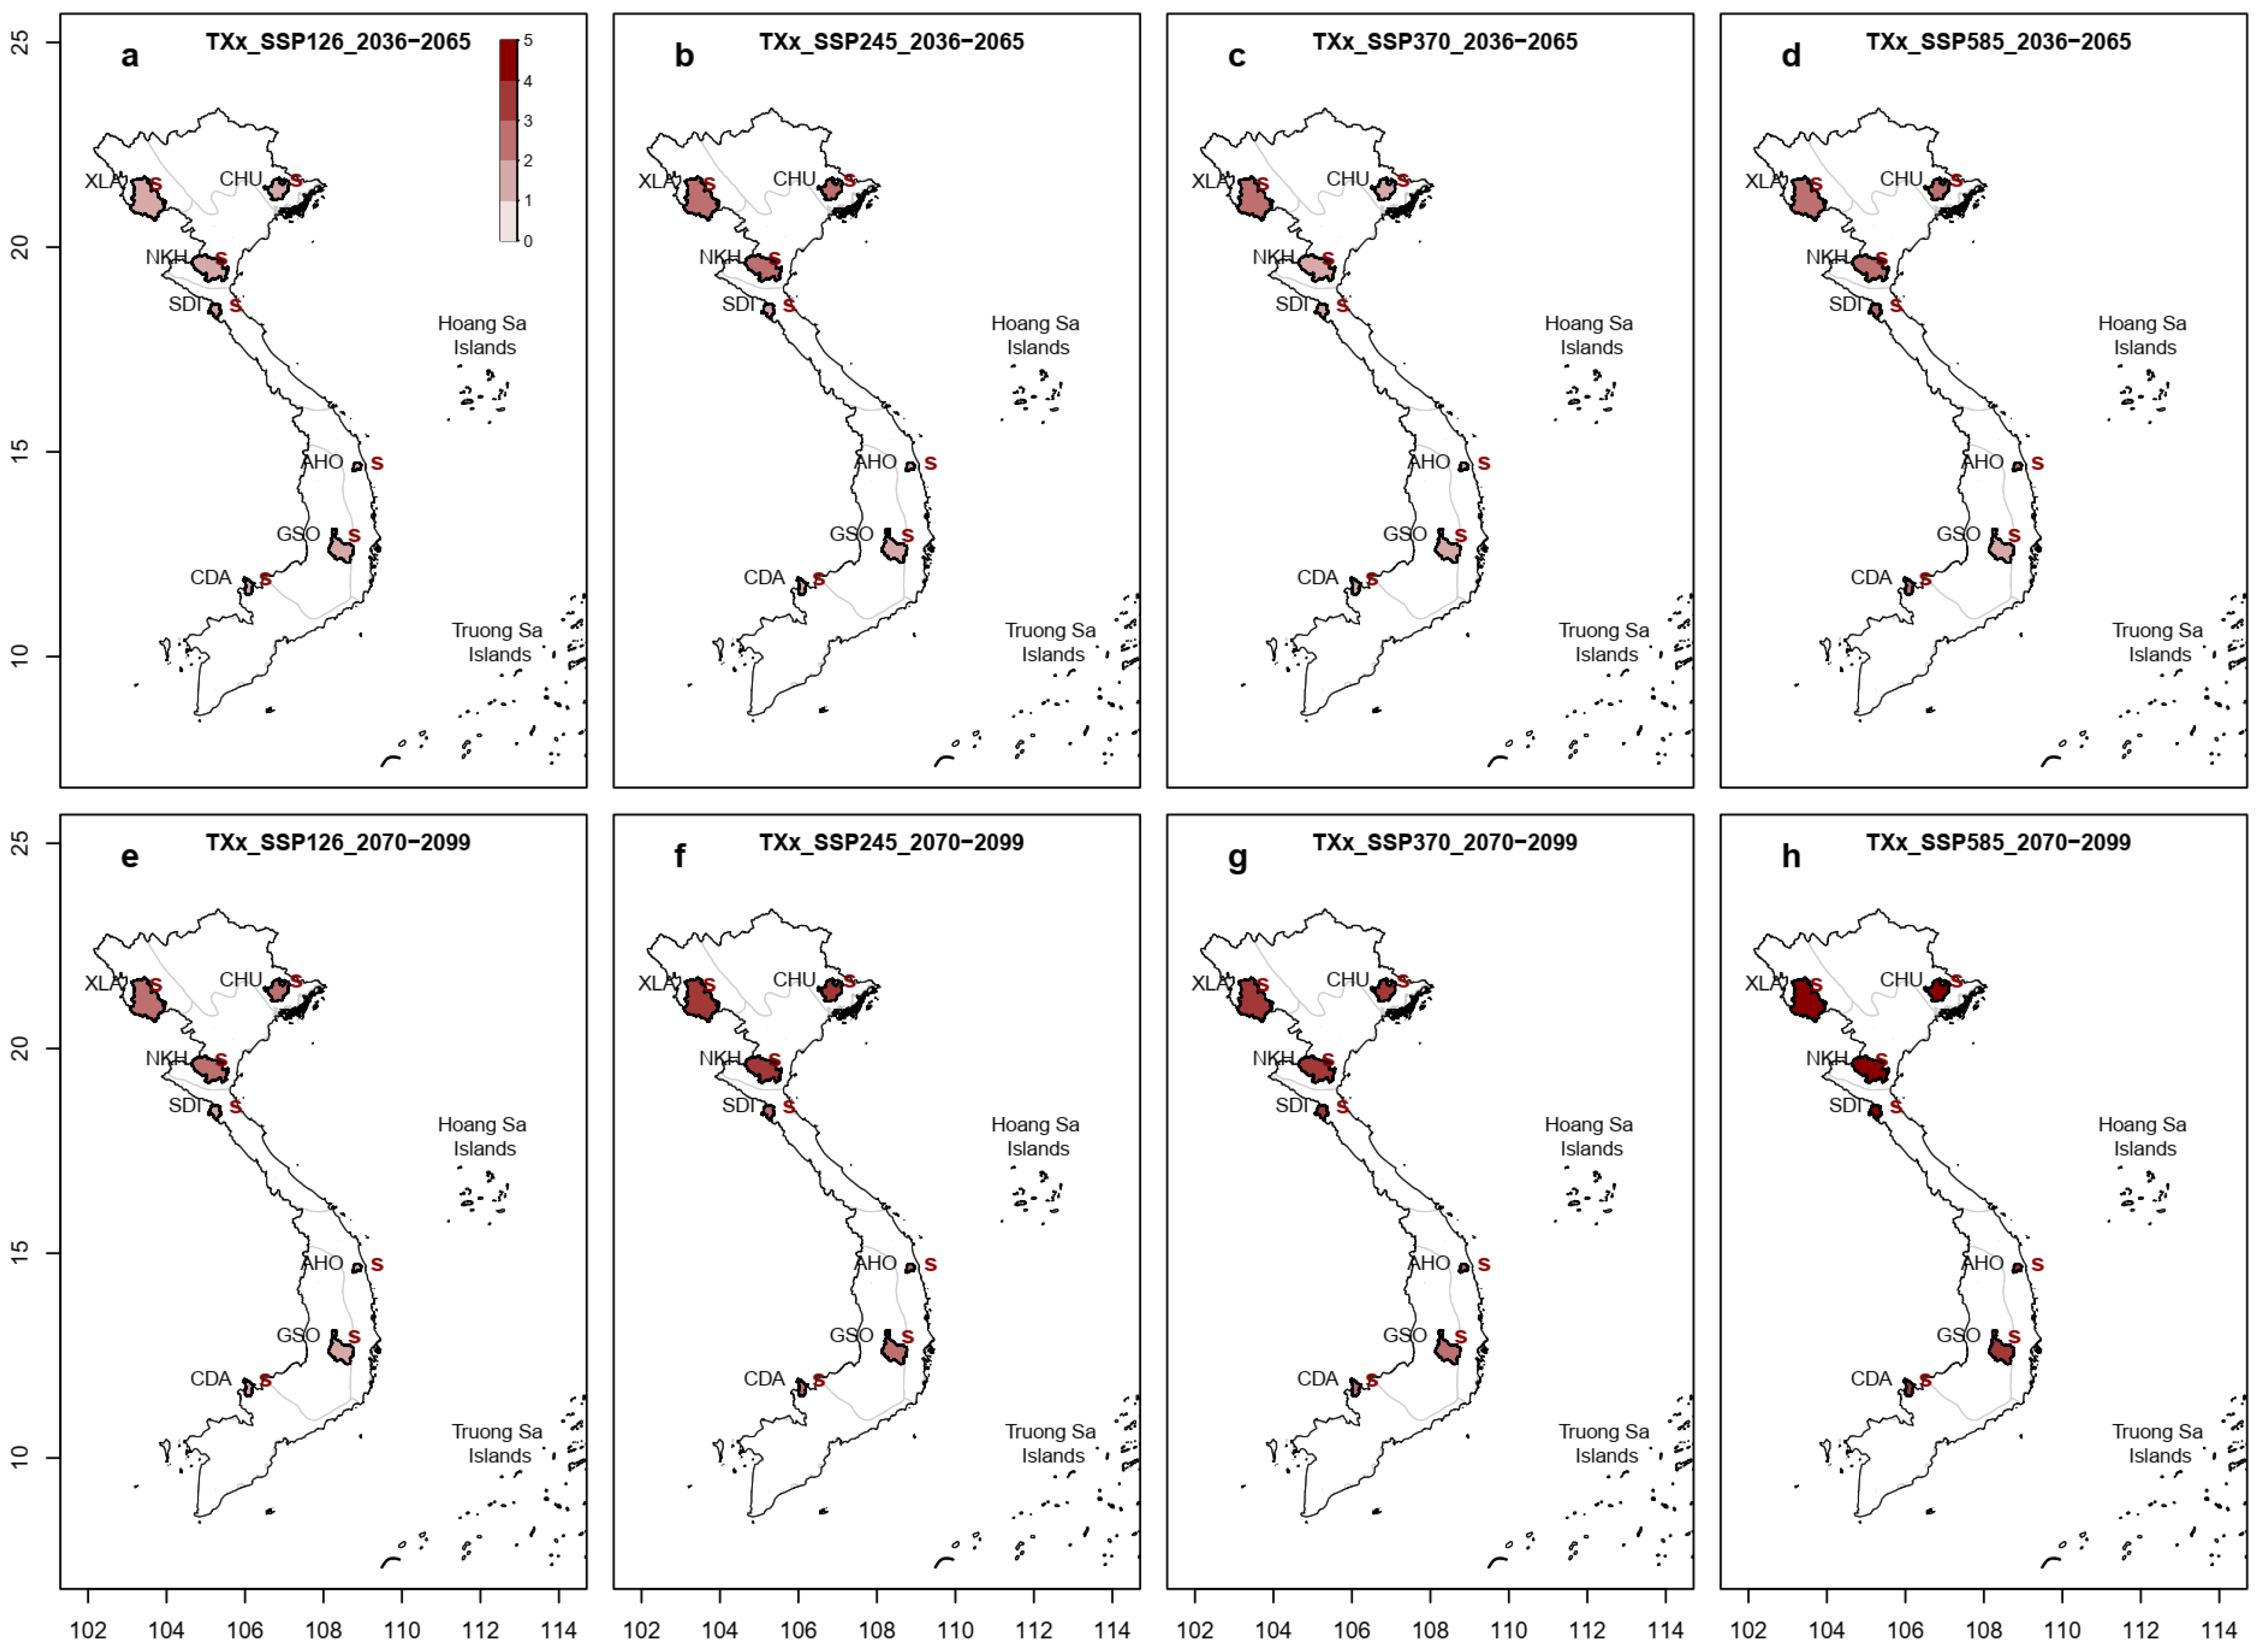
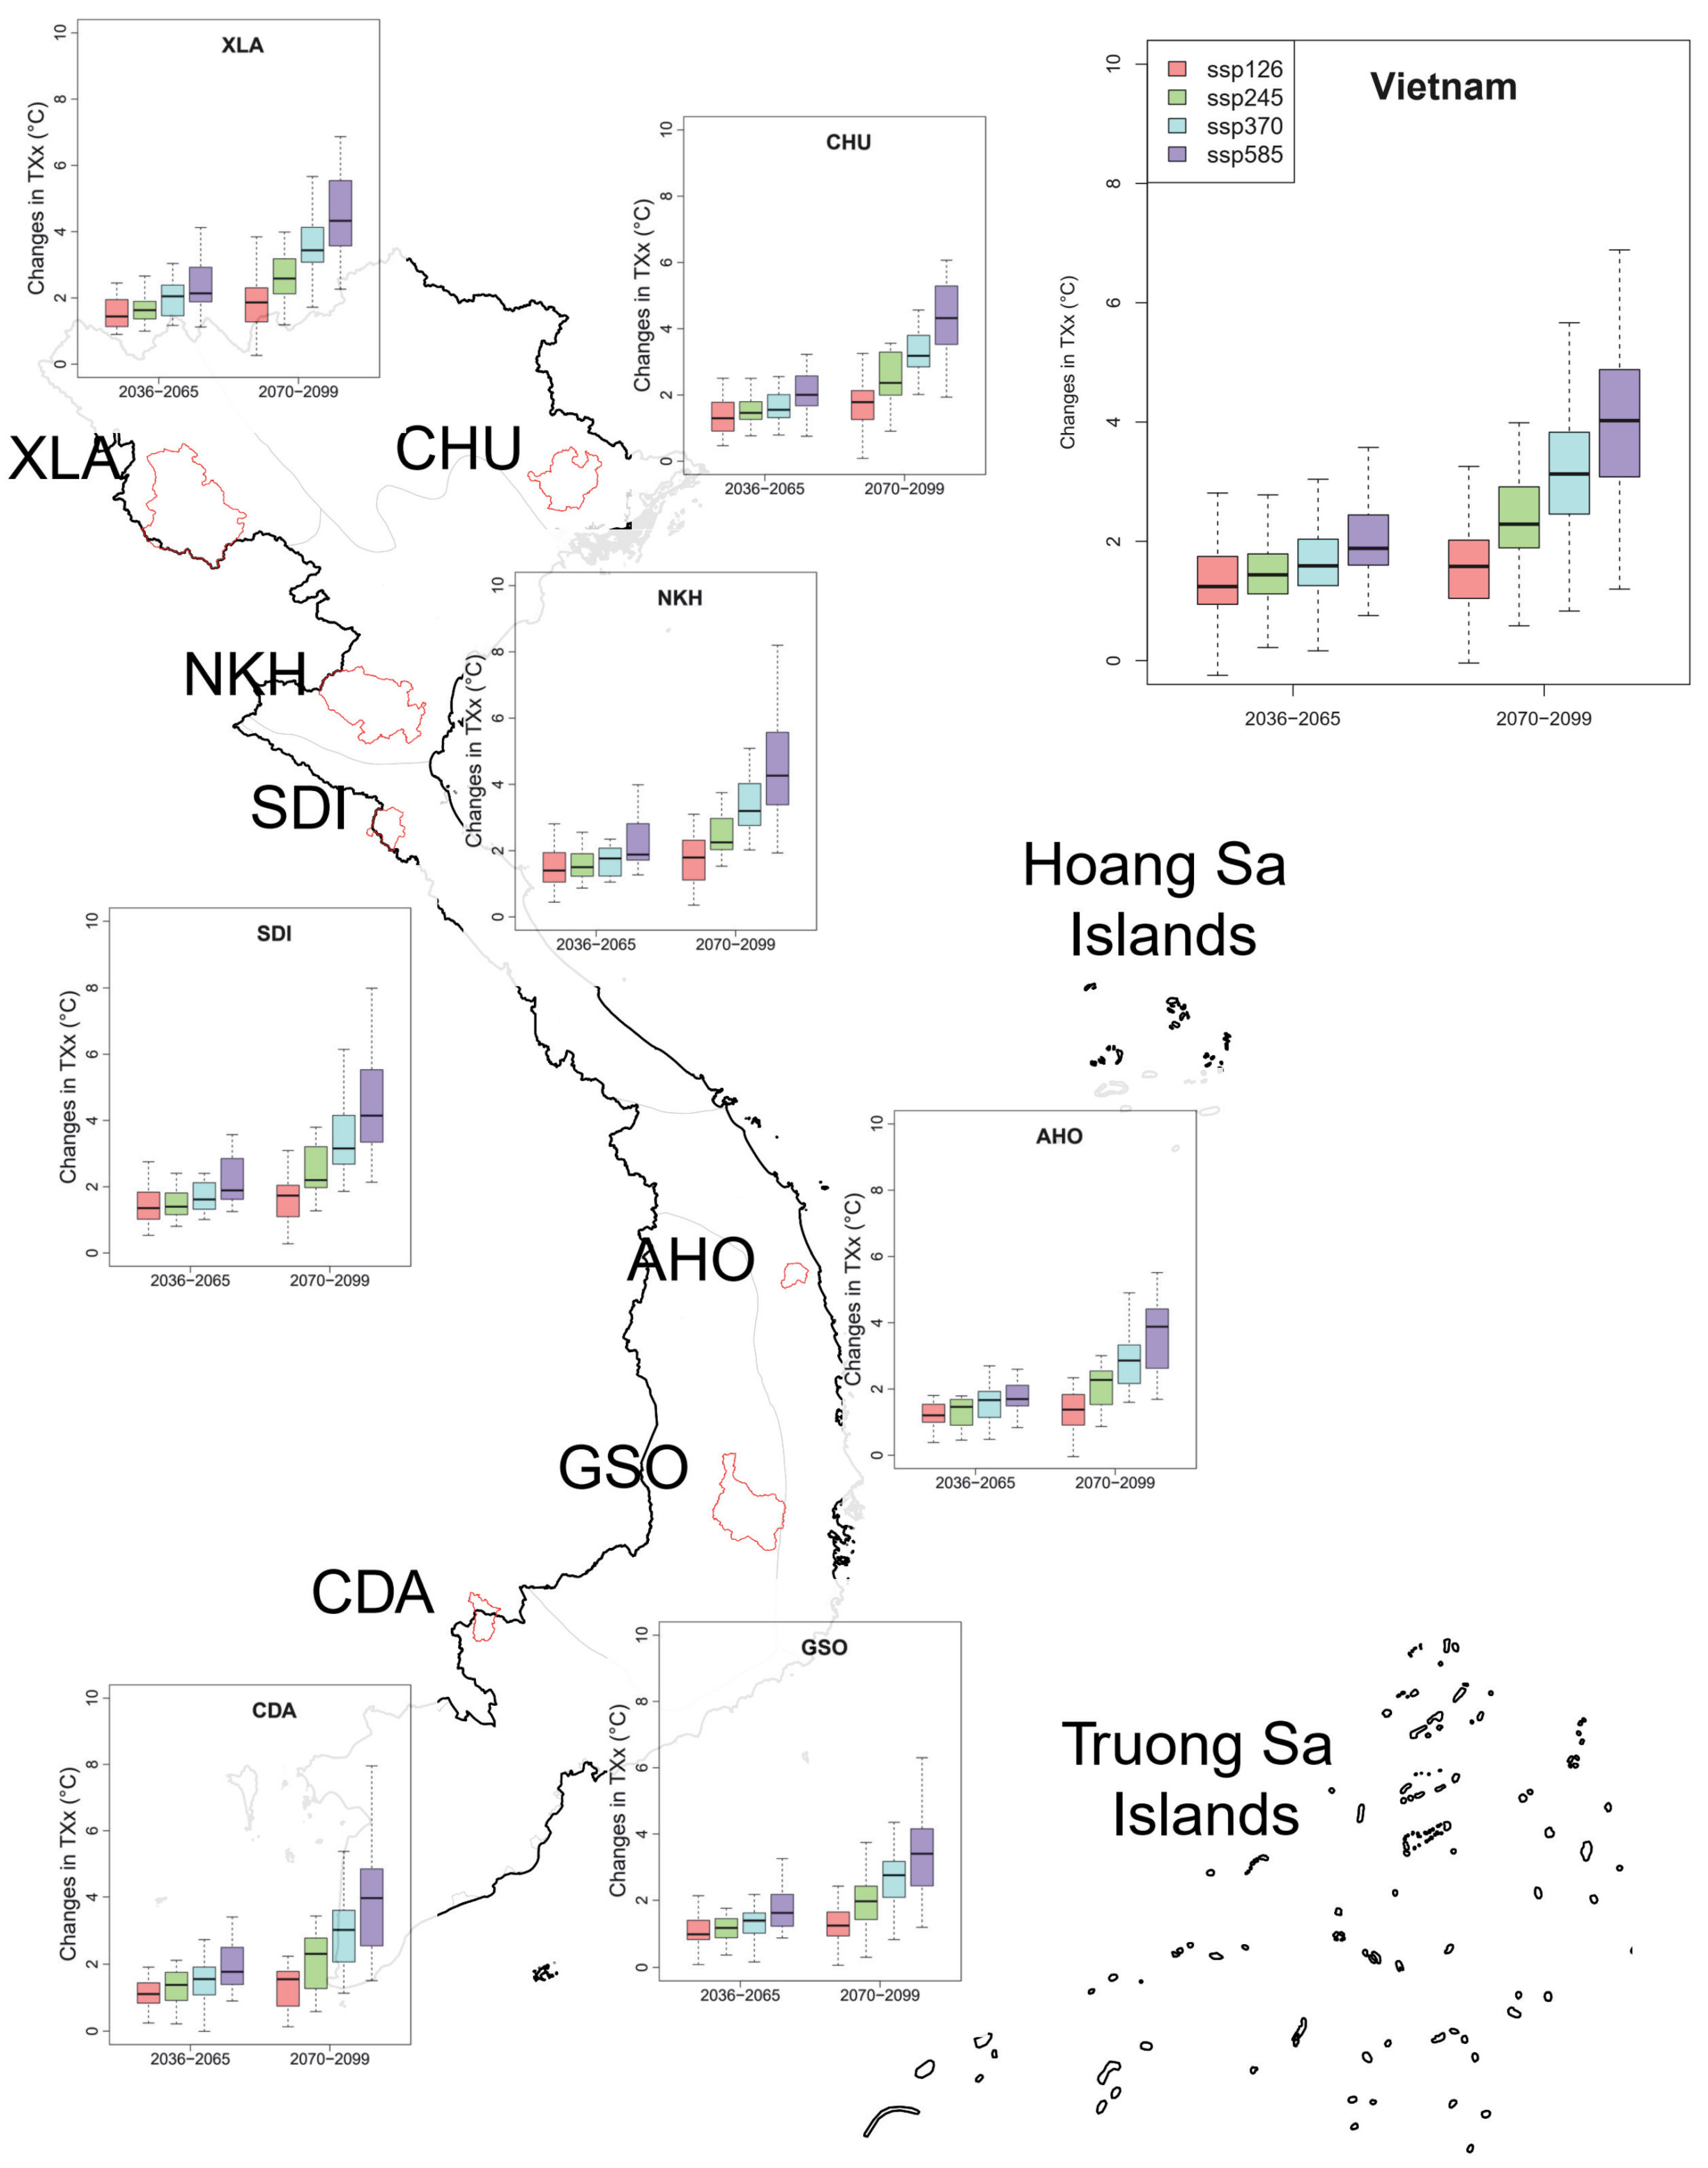
3.2. Projected Changes in Temperature Indices

To understand changes in hydro-climatic extremes across Vietnam, we first assessed the future state of extreme temperature under different emission scenarios. Figure 4 shows the ensemble mean of changes in the temperature of the annual hottest day for two future time slices (2036–2065 and 2070–2099) relative to that calculated for the reference period (1985–2014) across all assessed catchments. Regardless of emission scenario or assessed period, a dominant increase (up to 4.8 °C for the high-emission SSP5–8.5 scenario) is observed across all catchments. This analysis also shows a higher change in the TXx over the end-century time slice relative to the mid-century time slice. The magnitude of change is also higher over high-emission scenarios. This pattern aligns with extensive literature findings on this topic [56].
It is important to note that the differences between TXx calculated for the future time slices and for the reference period are statistically significant across all sites. This prominent pattern was robustly projected by nearly all 20 climate models that were used. Although in some rare cases, where the model projects a decrease in extreme temperature, these changes are minimal (less than 0.5 degrees). This pattern is consistent with the results of recent investigations into changes in extreme temperature using the CMIP6 dataset over Southeast Asia or other parts of the world. This result highlights a warming future even in the most optimistic socioeconomic pathway [46].
Figure 5 shows the spatial variation in projected changes in TXx over seven catchments as well as the full spectrum of change computed from the 20 climate models. Changes in TXx across all sites generally show a linear relationship to the emission scenario and the increase is higher for the end-century period (from 1.5 to 4.8 °C) relative to the middle of the century (from 1.3 to 2.6 °C). Figure 5 also shows that the uncertainty in the computed changes (i.e., the range illustrated by the boxplots) is also higher for the end-century period. It is important to note that the difference between the projected mid- and end-century changes in TXx for the SSP1–2.6 is relatively small when compared to the difference projected under the other scenarios (e.g., SSP2–4.5, SSP3–7.0, and SSP5–8.5). This analysis also highlights significant differences between the projected changes in TXx by the end of the century under different SSP scenarios. For instance, the analysis using the CDA catchment data shows that the average changes in TXx by the end of the century under SSP1–2.6 and SSP5–8.5 are 3 and 4 °C, respectively. Although different emission scenarios exhibit varying spatial patterns of changes (of which SSP1–2.6 and SSP5–8.5 are associated with the smallest and the highest spatial variability, respectively), a common pattern detected is that extreme temperature tends to change more rapidly over the northern catchments relative to their southern counterparts.

3.3. Projected Changes in Precipitation Indices

In a warming climate, the intensity of flood-inducing rainfall is likely to increase as the atmosphere can hold more water content [3]. This physical process poses a new challenge for sustainable development, as intensified extreme rainfall is one of the key factors amplifying floods, which subsequently implies higher costs in flood damage as well as increases in the number of deaths caused by floods. To investigate this potential risk, we computed the annual maximum daily rainfall amount (Rx1day) under four SSP scenarios and analyzed the projected changes over the selected catchments (Figure 6). We note that previous studies using CMIP5 climate projections found an overall increase in Rx1day when averaged across Southeast Asia as well as Vietnam [57,58].
Figure 6 illustrates a notable increase in Rx1day, for which the value reaches 43 mm in the SDI catchment by the end of the century under the SSP5–8.5 emission scenario (Figure 6h). In contrast to changes detected in TXx, the analysis for Rx1day shows no clear relationship between the magnitude of change and the emission scenario (the SSP3–7.0 emission scenario generally exhibits the smallest change). For instance, the averaged value of changes by the middle of the century computed under the SSP1–2.6 scenario is higher than that exhibited under the SSP2–4.5 and SSP3–7.0 scenarios over six catchments (except for SDI). Interestingly, the increase in extreme rainfall by the end of the century is not robustly detected for the SSP1–2.6 (over AHO catchment) and SSP3–7.0 (over AHO and CDA catchments) scenarios. The magnitude of change in extreme rainfall is also not statistically significant in some cases, with three catchments not showing a significant change under the SSP3–7.0 scenario by either the middle or the end of the century. These results indicate the complex relationship between rainfall extreme and greenhouse gas concentration which has been incorporated into the model structure of the GCMs used in this investigation [59].
The full spectrum of changes in projected Rx1day in Figure 7 further shows the complexity of extreme rainfall dynamics in a warming climate. The uncertainty in these changes is generally high across all catchments regardless of future time slices (except for XLA and CDA, which are associated with a range of detected changes of less than 50 mm). In some cases, the disagreement across models is high, exceeding 150 mm at the AHO catchment under the SSP5–8.5 of the 2036–2065 period, demonstrating the need to consider locally relevant policies to mitigate future flood hazards. To further assess the spatiotemporal variability in future flood hazards, the next section will discuss changes detected using the projected streamflow generated by SWAT models across the selected sites.

3.4. Projected Changes in Streamflow Indices

Numerous studies have shown that changes in precipitation extremes should not be used to directly infer changes in floods, which are modulated by many different mechanisms [60,61]. To further assess the propagation of changes in climate variables to changes in streamflow extremes, we computed and analyzed the 5% exceedance value of streamflow (Q5) from the future simulations of SWAT models across the seven catchments. We note that these catchments have undergone a strict screening process and can be considered “near-natural”. Thus, any changes detected in this analysis can be attributed to climate change rather than to human intervention. As the discharge volume across the assessed catchments varies substantially (due to varying catchment sizes and climate characteristics); we used the percentage of change (relative to the average value of the reference period) to support comparison across different catchments.
Figure 8 provides an overview of the changes and highlights a prominent increase in streamflow extremes across all scenarios. However, the signal of the changes is less robust relative to that detected from rainfall extremes. Model agreement is highest under the SSP5–8.5 scenario, as all catchments exhibit a robust increase by the middle and end of the century. On the other hand, simulations under the SSP3–7.0 scenario generally show the highest disagreement (two catchments are not associated with a robust finding across 20 members in both the mid- and end-century periods), followed by simulations under the SSP1–2.6 emission scenario. The significance test further confirms this finding as the magnitude of changes is only statistically significant over three out of seven catchments under the SSP3–7.0 scenario (regardless of the future time slices). Among the studied catchments, the AHO catchment (located in Tra Khuc River) has the weakest signal of changes in the Q5 index, for which the change is not statistically significant over the end-century (mid-century) period under two (one) emission scenarios.
The detailed assessment shown in Figure 9 highlights the complex pattern of changes in streamflow extremes relative to that detected from rainfall extremes. Generally, a higher uncertainty (indicated by a larger spread of changes computed across all simulations) in the projected changes is identified over the southern catchments relative to their northern counterparts. We note that the uncertainty is quite large, even in catchments that are associated with a low uncertainty in Rx1day changes. For instance, in the CDA catchment (the uncertainty in rainfall extreme is quite low, as discussed in Section 3.4), the changes detected across 20 simulations vary substantially, ranging from a decrease of 35% (by the middle of the century under the SSP3–7.0 emission scenario forced by the GISS.E2.1.G climate projection) to an increase of 88% (by the end of the century under the SSP5–8.5 emission scenario forced by the IPSL.CM6A.LR climate projection). This result further confirms previous findings on the importance of other processes (besides rainfall dynamics), such as infiltration and antecedent soil moisture, which determine catchment storage capacity and also play a substantial role in modulating the streamflow regime and flood generation [62,63,64]. The results of the sensitivity analysis (see Table S1 in the Supplementary Materials) demonstrate this potential issue, as the SWAT models are relatively sensitive to some relevant parameters such as ALPHA_BNK (baseflow alpha factor for bank storage) and SOL_AWC (available water capacity of the soil layer). We note that these factors are not the focus of our investigation, thus, no attempt was made to quantify the importance of these processes to future changes in streamflow extremes.

4. Summary and Conclusions

This study provides the first comprehensive assessment of projected changes in hydro-climatic extremes across Vietnam using downscaled CMIP6 forcing and a semi-distributed hydrological model. To disentangle the complex relationship between changes in climate extremes and floods, we used a large ensemble of 20 climate models, assessing changes in three extreme indices (representing temperature, rainfall, and streamflow extremes) given two future time slices (mid-century, 2036–2065; and end-century, 2070–2099).
The assessment of seven “near-natural” catchments, each characterized by a distinct climatic and geographical feature, yielded significant insights into future changes in hydro-climatic extremes across Vietnam:
  • Among the three assessed extreme indices, the annual hottest day (TXx) shows the most robust increase (up to 4.8 °C). The detected increase is also statistically significant across both future time slices, confirming previous findings on the increasing trend in extreme temperature in the Anthropocene over Vietnam.
  • Changes in maximum daily rainfall amount (Rx1day) identified in this study are less robust, but an overall increase (up to 43 mm) is detected across all analyses, although the magnitude of the change is not statistically significant in some specific cases.
  • Streamflow extremes, as indicated by the Q5 index (the value that exceeds the streamflow time series by 5% in a year), exhibit the most complex pattern of change, as well as high uncertainty across all simulations (especially over the southern catchments). Although the detected changes are not statistically significant in some cases (e.g., changes in the Q5 index over the GSO catchment—located upstream of Srepok River—are not significant over both assessed periods under the SSP3–7.0 emission scenario), a rise (up to 31%) in streamflow extremes remains the key signal, indicating a future with higher flood-related events across the country.
It is important to note that there are several uncertainties underlying our investigation. As highlighted in our evaluation of the SWAT models’ performance, simulated streamflow over some catchments exhibits positive PBIAS, demonstrating a potential bias toward wetting conditions in our assessment. CMIP6 is also known to have a ‘hot model’ problem (meaning some models simulate a climate that is too hot based on the increase in CO2) [52], which could exaggerate future changes in climate variables.
Nevertheless, our assessment demonstrates the urgent need for locally relevant flood mitigation policies in a warming climate, as the spatial pattern of change is highly heterogeneous. Considering the dominant increasing trend detected from our analysis, it is important to allocate more investment towards improving flood resilience in Vietnam. Furthermore, developing accurate early warning systems should be placed as the highest priority to reduce human losses [1]. Although early warning systems for floods are now available in many locations across the country [65,66,67], the majority of them are only at the level of scientific experiment or heavily depend on the experience of operating staff, indicating a potential risk of subjectivity. To further enhance the existing systems, it is important to leverage advances in remote sensing and climate models, for which many data products are now freely available (e.g., weather forecasts obtained from the European Centre for Medium-Range Weather Forecasts or Global Forecast System), and hydrologic models to provide flood forecasts with several days’ lead time. Last but not least, more investment should also be provided to improve, or at least to maintain, the current stream gauge network [41], which is essential for calibrating and enhancing the accuracy of future flood early warning systems.

Supplementary Materials

The following supporting information can be downloaded at: https://www.mdpi.com/article/10.3390/w16050674/s1, Table S1. SWAT model’s parameters and calibrated ranges. The “Sensitivity significance” field provides the sensitivity analysis results; an asterisk indicates that the parameter is sensitive (i.e., the p-value is smaller than 0.05) for the corresponding catchment. Figure S1. The results of the sensitivity analysis of (a) NKH, (b) CHU, and (c) AHO catchments. Parameters with low p-value and high t-statistic are the most sensitive ones. Figure S2. Simulated and observed streamflow of AHO over the calibration and validation period. Figure S3. Scatterplots between simulated and observed values across all assessed catchments for (a) annual streamflow (yearly average) and (b) Q5 index. Note that the NSE values were calculated for all data points from seven catchments.

Author Contributions

Conceptualization, methodology, data curation, software, visualization, validation, funding acquisition, writing—original draft preparation, H.X.D.; methodology, validation, software, writing—review and editing, T.H.L.; methodology, data curation, writing—review and editing, M.-H.L.; conceptualization, methodology, writing—review and editing, N.C.D.; software, review and editing, D.L.T.N. All authors have read and agreed to the published version of the manuscript.

Funding

This research was funded by Nong Lam University-Ho Chi Minh City, grant number CSCB21-MTTN-07.

Data Availability Statement

Due to the data policies of data agencies in Vietnam, the rainfall and streamflow observations used in this investigation cannot be made publicly available.

Conflicts of Interest

Author Manh-Hung Le was employed by the company Science Applications International Corporation. The remaining authors declare that the research was conducted in the absence of any commercial or financial relationships that could be construed as a potential conflict of interest.

References

  1. WMO Economic Costs of Weather-Related Disasters Soars but Early Warnings Save Lives. Available online: https://wmo.int/media/news/economic-costs-of-weather-related-disasters-soars-early-warnings-save-lives (accessed on 5 January 2024).
  2. Pörtner, H.O.; Roberts, D.C.; Adams, H.; Adler, C.; Aldunce, P.; Ali, E.; Begum, R.A.; Betts, R.; Kerr, R.B.; Biesbroek, R. Climate Change 2022: Impacts, Adaptation and Vulnerability; IPCC: Geneva, Switzerland, 2022. [Google Scholar]
  3. Fowler, H.J.; Lenderink, G.; Prein, A.F.; Westra, S.; Allan, R.P.; Ban, N.; Barbero, R.; Berg, P.; Blenkinsop, S.; Do, H.X.; et al. Anthropogenic Intensification of Short-Duration Rainfall Extremes. Nat. Rev. Earth Environ. 2021, 2, 107–122. [Google Scholar] [CrossRef]
  4. Najibi, N.; Steinschneider, S. Extreme Precipitation-Temperature Scaling in California: The Role of Atmospheric Rivers. Geophys. Res. Lett. 2023, 50, e2023GL104606. [Google Scholar] [CrossRef]
  5. Almazroui, M.; Saeed, F.; Saeed, S.; Ismail, M.; Ehsan, M.A.; Islam, M.N.; Abid, M.A.; O’Brien, E.; Kamil, S.; Rashid, I.U.; et al. Projected Changes in Climate Extremes Using CMIP6 Simulations Over SREX Regions. Earth Syst. Environ. 2021, 5, 481–497. [Google Scholar] [CrossRef]
  6. Blöschl, G. Three Hypotheses on Changing River Flood Hazards. Hydrol. Earth Syst. Sci. 2022, 26, 5015–5033. [Google Scholar] [CrossRef]
  7. Blöschl, G.; Hall, J.; Viglione, A.; Perdigão, R.A.P.; Parajka, J.; Merz, B.; Lun, D.; Arheimer, B.; Aronica, G.T.; Bilibashi, A.; et al. Changing Climate Both Increases and Decreases European River Floods. Nature 2019, 573, 108–111. [Google Scholar] [CrossRef] [PubMed]
  8. Do, H.X.; Mei, Y.; Gronewold, A.D. To What Extent Are Changes in Flood Magnitude Related to Changes in Precipitation Extremes? Geophys. Res. Lett. 2020, 47, e2020GL088684. [Google Scholar] [CrossRef]
  9. Do, H.X.; Westra, S.; Leonard, M. A Global-Scale Investigation of Trends in Annual Maximum Streamflow. J. Hydrol. 2017, 552, 28–43. [Google Scholar] [CrossRef]
  10. Sharma, A.; Wasko, C.; Lettenmaier, D.P. If Precipitation Extremes Are Increasing, Why Aren’t Floods? Water Resour. Res. 2018, 54, 8545–8551. [Google Scholar] [CrossRef]
  11. Eyring, V.; Bony, S.; Meehl, G.A.; Senior, C.A.; Stevens, B.; Stouffer, R.J.; Taylor, K.E. Overview of the Coupled Model Intercomparison Project Phase 6 (CMIP6) Experimental Design and Organization. Geosci. Model Dev. 2016, 9, 1937–1958. [Google Scholar] [CrossRef]
  12. Do, H.X.; Zhao, F.; Westra, S.; Leonard, M.; Gudmundsson, L.; Boulange, J.E.S.; Chang, J.; Ciais, P.; Gerten, D.; Gosling, S.N.; et al. Historical and Future Changes in Global Flood Magnitude—Evidence from a Model–Observation Investigation. Hydrol. Earth Syst. Sci. 2020, 24, 1543–1564. [Google Scholar] [CrossRef]
  13. Swain, D.L.; Wing, O.E.J.; Bates, P.D.; Done, J.M.; Johnson, K.A.; Cameron, D.R. Increased Flood Exposure Due to Climate Change and Population Growth in the United States. Earth’s Futur. 2020, 8, e2020EF001778. [Google Scholar] [CrossRef]
  14. Edamo, M.L.; Hatiye, S.D.; Minda, T.T.; Ukumo, T.Y. Flood Inundation and Risk Mapping under Climate Change Scenarios in the Lower Bilate Catchment, Ethiopia. Nat. Hazards 2023, 118, 2199–2226. [Google Scholar] [CrossRef]
  15. Blöschl, G.; Bierkens, M.F.P.; Chambel, A.; Cudennec, C.; Destouni, G.; Fiori, A.; Kirchner, J.W.; McDonnell, J.J.; Savenije, H.H.G.; Sivapalan, M.; et al. Twenty-Three Unsolved Problems in Hydrology (UPH)–a Community Perspective. Hydrol. Sci. J. 2019, 64, 1141–1158. [Google Scholar] [CrossRef]
  16. Do, H.X.; Gudmundsson, L.; Leonard, M.; Westra, S. The Global Streamflow Indices and Metadata Archive (GSIM)-Part 1: The Production of a Daily Streamflow Archive and Metadata. Earth Syst. Sci. Data 2018, 10, 765–785. [Google Scholar] [CrossRef]
  17. Addor, N.; Do, H.X.; Alvarez-Garreton, C.; Coxon, G.; Fowler, K.; Mendoza, P.A. Large-Sample Hydrology: Recent Progress, Guidelines for New Datasets and Grand Challenges. Hydrol. Sci. J. 2020, 65, 712–725. [Google Scholar] [CrossRef]
  18. John, A.; Douville, H.; Ribes, A.; Yiou, P. Quantifying CMIP6 Model Uncertainties in Extreme Precipitation Projections. Weather Clim. Extrem. 2022, 36, 100435. [Google Scholar] [CrossRef]
  19. World_Bank Vietnam Country Climate and Development Report; World Bank: Washington, DC, USA, 2022.
  20. Nguyen, H.Q.; Degener, J.; Kappas, M. Flash Flood Prediction by Coupling KINEROS2 and HEC-RAS Models for Tropical Regions of Northern Vietnam. Hydrology 2015, 2, 242–265. [Google Scholar] [CrossRef]
  21. Nguyen, H.Q.; Degener, J.; Kappas, M. Flash Flooding Prediction in Regions of Northern Vietnam Using the KINEROS2 Model. Hydrol. Res. 2016, 47, 1038–1052. [Google Scholar] [CrossRef]
  22. Do, T.A.T.; Do, A.N.T.; Tran, H.D. Quantifying the Spatial Pattern of Urban Expansion Trends in the Period 1987–2022 and Identifying Areas at Risk of Flooding Due to the Impact of Urbanization in Lao Cai City. Ecol. Inform. 2022, 72, 101912. [Google Scholar] [CrossRef]
  23. Nguyen, H.D.; Ardillier-Carras, F.; Touchart, L. Les Paysages de Rizières et Leur Évolution Récente Dans Le Delta Du Fleuve Gianh. Cybergeo Eur. J. Geogr. 2018. [Google Scholar] [CrossRef]
  24. Nguyen, H.D.; Fox, D.; Dang, D.K.; Pham, L.T.; Viet Du, Q.V.; Nguyen, T.H.T.; Dang, T.N.; Tran, V.T.; Vu, P.L.; Nguyen, Q.-H. Predicting Future Urban Flood Risk Using Land Change and Hydraulic Modeling in a River Watershed in the Central Province of Vietnam. Remote Sens. 2021, 13, 262. [Google Scholar] [CrossRef]
  25. Tyler, S.; Nguyen, H.; Tran, P. Urban Development and Flood Risk in Vietnam: Experience in Three Cities: Synthesis of Flood Case Studies and Planning Context; ISET: Boulder, CO, USA, 2015. [Google Scholar]
  26. Triet, N.V.K.; Dung, N.V.; Hoang, L.P.; Le Duy, N.; Tran, D.D.; Anh, T.T.; Kummu, M.; Merz, B.; Apel, H. Future Projections of Flood Dynamics in the Vietnamese Mekong Delta. Sci. Total Environ. 2020, 742, 140596. [Google Scholar] [CrossRef]
  27. Hoang, L.P.; Biesbroek, R.; Tri, V.P.D.; Kummu, M.; van Vliet, M.T.H.; Leemans, R.; Kabat, P.; Ludwig, F. Managing Flood Risks in the Mekong Delta: How to Address Emerging Challenges under Climate Change and Socioeconomic Developments. Ambio 2018, 47, 635–649. [Google Scholar] [CrossRef] [PubMed]
  28. Takagi, H.; Van Ty, T.; Thao, N.D. Investigation on Floods in Can Tho City: Influence of Ocean Tides and Sea Level Rise for the Mekong Delta’s Largest City. In Coastal Disasters and Climate Change in Vietnam; Elsevier: Amsterdam, The Netherlands, 2014; pp. 257–274. [Google Scholar]
  29. Tran, P.; Marincioni, F.; Shaw, R. Catastrophic Flood and Forest Cover Change in the Huong River Basin, Central Viet Nam: A Gap between Common Perceptions and Facts. J. Environ. Manag. 2010, 91, 2186–2200. [Google Scholar] [CrossRef] [PubMed]
  30. Vo, N.D.; Gourbesville, P.; Vu, M.T.; Raghavan, S.V.; Liong, S.-Y. A Deterministic Hydrological Approach to Estimate Climate Change Impact on River Flow: Vu Gia–Thu Bon Catchment, Vietnam. J. Hydro-Environ. Res. 2016, 11, 59–74. [Google Scholar] [CrossRef]
  31. To, T.N.; Vu, H.C.; Le, H. Impacts of Reservoir Operation and Urbanization on Flood Inundation in The Vu Gia Thu Bon Basin, Vietnam. Water Supply 2022, 22, 4656–4675. [Google Scholar] [CrossRef]
  32. Pham Quang, M.; Tallam, K. Predicting Flood Hazards in the Vietnam Central Region: An Artificial Neural Network Approach. Sustainability 2022, 14, 11861. [Google Scholar] [CrossRef]
  33. Nguyen, H.D. GIS-Based Hybrid Machine Learning for Flood Susceptibility Prediction in the Nhat Le–Kien Giang Watershed, Vietnam. Earth Sci. Inform. 2022, 15, 2369–2386. [Google Scholar] [CrossRef]
  34. Nguyen, M.T.; Sebesvari, Z.; Souvignet, M.; Bachofer, F.; Braun, A.; Garschagen, M.; Schinkel, U.; Yang, L.E.; Nguyen, L.H.K.; Hochschild, V. Understanding and Assessing Flood Risk in Vietnam: Current Status, Persisting Gaps, and Future Directions. J. Flood Risk Manag. 2021, 14, e12689. [Google Scholar] [CrossRef]
  35. Phan-Van, T.; Ngo-Duc, T.; Ho, T.M.H. Seasonal and Interannual Variations of Surface Climate Elements over Vietnam. Clim. Res. 2009, 40, 49–60. [Google Scholar] [CrossRef]
  36. Nguyen-Xuan, T.; Ngo-Duc, T.; Kamimera, H.; Trinh-Tuan, L.; Matsumoto, J.; Inoue, T.; Phan-Van, T. The Vietnam Gridded Precipitation (VnGP) Dataset: Construction and Validation. SOLA 2016, 12, 291–296. [Google Scholar] [CrossRef]
  37. Pokhrel, Y.; Burbano, M.; Roush, J.; Kang, H.; Sridhar, V.; Hyndman, D.W. A Review of the Integrated Effects of Changing Climate, Land Use, and Dams on Mekong River Hydrology. Water 2018, 10, 266. [Google Scholar] [CrossRef]
  38. Yuen, K.W.; Hanh, T.T.; Quynh, V.D.; Switzer, A.D.; Teng, P.; Lee, J.S.H. Interacting Effects of Land-Use Change and Natural Hazards on Rice Agriculture in the Mekong and Red River Deltas in Vietnam. Nat. Hazards Earth Syst. Sci. 2021, 21, 1473–1493. [Google Scholar] [CrossRef]
  39. Khoi, D.N.; Suetsugi, T. Impact of Climate and Land-Use Changes on Hydrological Processes and Sediment Yield—A Case Study of the Be River Catchment, Vietnam. Hydrol. Sci. J. 2014, 59, 1095–1108. [Google Scholar] [CrossRef]
  40. Do, Q.V.; Do, H.X.; Do, N.C.; Ngo, A.L. Changes in Precipitation Extremes across Vietnam and Its Relationships with Teleconnection Patterns of the Northern Hemisphere. Water 2020, 12, 1646. [Google Scholar] [CrossRef]
  41. Do, H.X.; Le, M.-H.; Pham, H.T.; Le, T.H.; Nguyen, B.Q. Identifying Hydrologic Reference Stations to Understand Changes in Water Resources across Vietnam-a Data-Driven Approach. Vietnam. J. Earth Sci. 2022, 44, 145–165. [Google Scholar]
  42. Rodell, M.; Houser, P.R.; Jambor, U.E.A.; Gottschalck, J.; Mitchell, K.; Meng, C.-J.; Arsenault, K.; Cosgrove, B.; Radakovich, J.; Bosilovich, M. The Global Land Data Assimilation System. Bull. Am. Meteorol. Soc. 2004, 85, 381–394. [Google Scholar] [CrossRef]
  43. Tan, M.L.; Juneng, L.; Kuswanto, H.; Do, H.X.; Zhang, F. Impacts of Solar Radiation Management on Hydro-Climatic Extremes in Southeast Asia. Water 2023, 15, 1089. [Google Scholar] [CrossRef]
  44. Zhou, J.; He, D.; Xie, Y.; Liu, Y.; Yang, Y.; Sheng, H.; Guo, H.; Zhao, L.; Zou, R. Integrated SWAT Model and Statistical Downscaling for Estimating Streamflow Response to Climate Change in the Lake Dianchi Watershed, China. Stoch. Environ. Res. Risk Assess. 2015, 29, 1193–1210. [Google Scholar] [CrossRef]
  45. Tran-Anh, Q.; Ngo-Duc, T.; Espagne, E.; Trinh-Tuan, L. A 10-Km CMIP6 Downscaled Dataset of Temperature and Precipitation for Historical and Future Vietnam Climate. Sci. Data 2023, 10, 257. [Google Scholar] [CrossRef]
  46. Arias, P.; Bellouin, N.; Coppola, E.; Jones, R.; Krinner, G.; Marotzke, J.; Naik, V.; Palmer, M.; Plattner, G.-K.; Rogelj, J. Climate Change 2021: The Physical Science Basis. In Contribution of Working Group I to the Sixth Assessment Report of the Intergovernmental Panel on Climate Change; Technical Summary; IPCC: Geneva, Switzerland, 2021. [Google Scholar]
  47. Arnold, J.G.; Srinivasan, R.; Muttiah, R.S.; Williams, J.R. Large Area Hydrologic Modeling and Assessment Part I: Model Development 1. JAWRA J. Am. Water Resour. Assoc. 1998, 34, 73–89. [Google Scholar] [CrossRef]
  48. Abbaspour, K.C.; Johnson, C.A.; Van Genuchten, M.T. Estimating Uncertain Flow and Transport Parameters Using a Sequential Uncertainty Fitting Procedure. Vadose Zo. J. 2004, 3, 1340–1352. [Google Scholar] [CrossRef]
  49. Moriasi, D.N.; Arnold, J.G.; Van Liew, M.W.; Bingner, R.L.; Harmel, R.D.; Veith, T.L. Model Evaluation Guidelines for Systematic Quantification of Accuracy in Watershed Simulations. Trans. ASABE 2007, 50, 885–900. [Google Scholar] [CrossRef]
  50. Nash, J.E.; Sutcliffe, J. V River Flow Forecasting through Conceptual Models Part I—A Discussion of Principles. J. Hydrol. 1970, 10, 282–290. [Google Scholar] [CrossRef]
  51. Massoud, E.C.; Espinoza, V.; Guan, B.; Waliser, D.E. Global Climate Model Ensemble Approaches for Future Projections of Atmospheric Rivers. Earth’s Futur. 2019, 7, 1136–1151. [Google Scholar] [CrossRef]
  52. Massoud, E.C.; Lee, H.; Gibson, P.B.; Loikith, P.; Waliser, D.E. Bayesian Model Averaging of Climate Model Projections Constrained by Precipitation Observations over the Contiguous United States. J. Hydrometeorol. 2020, 21, 2401–2418. [Google Scholar] [CrossRef]
  53. Schmalz, B.; Fohrer, N. Comparing Model Sensitivities of Different Landscapes Using the Ecohydrological SWAT Model. Adv. Geosci. 2009, 21, 91–98. [Google Scholar] [CrossRef]
  54. Singh, L.; Saravanan, S. Simulation of Monthly Streamflow Using the SWAT Model of the Ib River Watershed, India. HydroResearch 2020, 3, 95–105. [Google Scholar] [CrossRef]
  55. Tufa, F.G.; Sime, C.H. Stream Flow Modeling Using SWAT Model and the Model Performance Evaluation in Toba Sub-Watershed, Ethiopia. Model. Earth Syst. Environ. 2021, 7, 2653–2665. [Google Scholar] [CrossRef]
  56. Wootten, A.M.; Massoud, E.C.; Waliser, D.E.; Lee, H. Assessing Sensitivities of Climate Model Weighting to Multiple Methods, Variables, and Domains in the South-Central United States. Earth Syst. Dynam. 2023, 14, 121–145. [Google Scholar] [CrossRef]
  57. Ngai, S.T.; Juneng, L.; Tangang, F.; Chung, J.X.; Supari, S.; Salimun, E.; Cruz, F.; Ngo-Duc, T.; Phan-Van, T.; Santisirisomboon, J.; et al. Projected Mean and Extreme Precipitation Based on Bias-Corrected Simulation Outputs of CORDEX Southeast Asia. Weather Clim. Extrem. 2022, 37, 100484. [Google Scholar] [CrossRef]
  58. Tangang, F.; Supari, S.; Chung, J.X.; Cruz, F.; Salimun, E.; Ngai, S.T.; Juneng, L.; Santisirisomboon, J.; Santisirisomboon, J.; Ngo-Duc, T. Future Changes in Annual Precipitation Extremes over Southeast Asia under Global Warming of 2 C. APN Sci. Bull. 2018, 8, 3–8. [Google Scholar] [CrossRef]
  59. Zelinka, M.D.; Myers, T.A.; McCoy, D.T.; Po-Chedley, S.; Caldwell, P.M.; Ceppi, P.; Klein, S.A.; Taylor, K.E. Causes of Higher Climate Sensitivity in CMIP6 Models. Geophys. Res. Lett. 2020, 47, e2019GL085782. [Google Scholar] [CrossRef]
  60. Wasko, C.; Nathan, R. Influence of Changes in Rainfall and Soil Moisture on Trends in Flooding. J. Hydrol. 2019, 575, 432–441. [Google Scholar] [CrossRef]
  61. Do, H.X.; Westra, S.; Leonard, M.; Gudmundsson, L. Global-Scale Prediction of Flood Timing Using Atmospheric Reanalysis. Water Resour. Res. 2020, 56, e2019WR024945. [Google Scholar] [CrossRef]
  62. De Michele, C.; Salvadori, G. On the Derived Flood Frequency Distribution: Analytical Formulation and the Influence of Antecedent Soil Moisture Condition. J. Hydrol. 2002, 262, 245–258. [Google Scholar] [CrossRef]
  63. Le, M.-H.; Nguyen, B.Q.; Pham, H.T.; Patil, A.; Do, H.X.; Ramsankaran, R.; Bolten, J.D.; Lakshmi, V. Assimilation of SMAP Products for Improving Streamflow Simulations over Tropical Climate Region—Is Spatial Information More Important Than Temporal Information? Remote Sens. 2022, 14, 1607. [Google Scholar]
  64. Alexander, K.; Hettiarachchi, S.; Ou, Y.; Sharma, A. Can Integrated Green Spaces and Storage Facilities Absorb the Increased Risk of Flooding Due to Climate Change in Developed Urban Environments? J. Hydrol. 2019, 579, 124201. [Google Scholar] [CrossRef]
  65. Ngo, T.T.H.; Vu, B.T.; Nguyen, T.K. Early Warning Systems for Flash Floods and Debris Flows in Vietnam: A Review. Geotech. Sustain. Infrastruct. Dev. 2020, 62, 1233–1240. [Google Scholar]
  66. Nguyen, H.T.; Duong, T.Q.; Nguyen, L.D.; Vo, T.Q.N.; Tran, N.T.; Dang, P.D.N.; Nguyen, L.D.; Dang, C.K.; Nguyen, L.K. Development of a Spatial Decision Support System for Real-Time Flood Early Warning in the Vu Gia-Thu Bon River Basin, Quang Nam Province, Vietnam. Sensors 2020, 20, 1667. [Google Scholar] [CrossRef] [PubMed]
  67. Van Hoang, T.; Chou, T.Y.; Nguyen, N.T.; Fang, Y.M.; Yeh, M.L.; Nguyen, Q.H.; Nguyen, X.L. A Robust Early Warning System for Preventing Flash Floods in Mountainous Area in Vietnam. ISPRS Int. J. Geo-Inf. 2019, 8, 228. [Google Scholar] [CrossRef]
Figure 1. Assessment framework of the study.
Water 16 00674 g001
Figure 2. Locations and key features of the selected catchments for this study (AHO: An Hoa; CDA: Can Dang; CHU: Chu; GSO: Giang Son; NKH: Nghia Khanh; SDI: Son Diem; XLA: Xa La).
Water 16 00674 g002
Figure 3. Scatterplots of daily simulated and observed streamflow across all assessed catchments. The calibration and validation periods vary across catchments (noted at the bottom right of each panel) due to data availability in specific catchments. To enhance data visualization, a logarithmic transformation was applied prior to plotting. The NSE, RSR, and PBIAS values calculated over each period are also shown in the top left of each panel.
Water 16 00674 g003
Figure 4. The ensemble mean of future changes (in °C) in TXx (annual hottest daily temperature) across seven catchments. Each column features a specific emission scenario (from left to right: SSP1–2.6, SSP2–4.5, SSP3–7.0, and SSP5–8.5) while each row features a future time slice (top: 2036–2065; and bottom: 2070–2099). The value shown is computed by taking the difference between the ensemble mean of the future time slice and the ensemble mean of the reference period (1985–2014). Catchments with black boundaries show a robust sign of change (i.e., at least 13 models agree on the sign of the difference). A red “s” letter on the right-hand side of a catchment indicates that the value of change is statistically significant (i.e., significantly higher or lower than zero) at the 5% significance level. All panels share the same legend with panel (a).
Water 16 00674 g004
Figure 5. Boxplots of projected changes (in °C) in TXx across all emission scenarios and two future time slices over each of the selected catchments. The difference between a future time slice (e.g., from 2036 to 2065) relative to the reference period (1985–2014) was first calculated for each GCM and each SSP scenario. The results were then visualized by boxplots to demonstrate the whole spectrum of change from 20 selected CMIP6 GCMs (see Table 2) under different emission scenarios and future time slices. The ‘Vietnam’ inset figure (top right of the map) provides the legend to all inset boxplots and shows the distribution of changes across all catchments. All inset figures share the same y-axis range to support cross-catchment comparison.
Water 16 00674 g005
Figure 6. Same as Figure 4, but for changes in Rx1day (in mm).
Water 16 00674 g006
Figure 7. Same as Figure 5, but for changes in Rx1day (in mm).
Water 16 00674 g007
Figure 8. Same as Figure 4, but for changes in Q5 (in % relative to the mean of the 1985–2014 period).
Water 16 00674 g008
Figure 9. Same as Figure 5, but for changes in Q5 (in % relative to the mean of the 1985–2014 period).
Water 16 00674 g009
Table 1. Description of streamflow and rainfall data available for the assessed catchments.
River
System
TributaryStream Gauge NameAbb. NameNumber of Rain GaugesCatchment Area (km2)Outlet’s
Longitude
(Degree)
Outlet’s
Latitude
(Degree)
Hydro-Climate Data Coverage
Ma RiverMaXa LaXLA46430103.48521.1571975–2019
Red–Thai Binh RiverLuc NamChuCHU42090106.85621.4131958–2019
Ca RiverHieuNghia KhanhNKH34024105.10019.5091973–2019
Ca RiverNgan PhoSon DiemSDI1599105.24218.4221961–1981; 1997–2019
Tra Khuc RiverTra KhucAn HoaAHO2383108.84814.6381982–2019
Mekong RiverSrepokGiang SonGSO33100108.43612.6301978–2019
Sai Gon–Dong Nai RiverSuoi MayCan DangCDA1617106.07611.7031980–2019
Table 2. List of 24 CMIP6 GCMs and associated scenarios considered in this study.
Climate modelHistoricalSSP1–2.6SSP2–4.5SSP3–7.0SSP5–8.5
ACCESS-CM2xxxxx
ACCESS-ESM1-5xxxxx
AWI-CM-1-1-MRxxxxx
BCC-CSM2-MRxxxxx
CanESM5xxxxx
CIESMxxx-x
CMCC-ESM2xxxxx
CNRM-CM6-1-HRxxxxx
CNRM-ESM2-1xxxxx
EC-Earth3xxxxx
EC-Earth3-Vegxxxxx
FGOALS-g3xxxxx
GFDL-ESM4xxxxx
GISS-E2-1-Gxxxxx
HadGEM3-GC31-LLxxx-x
HadGEM3-GC31-MMxx---
INM-CM5-0xxxxx
IPSL-CM6A-LRxxxxx
MIROC-ES2Lxxxxx
MIROC6xxxxx
MPI-ESM1-2-HRxxxxx
MRI-ESM2-0xxxxx
NESM3xxx-x
UKESM1-0-LLxxxxx
Note: x: available; -: not available; models written in italics were removed from the analysis.
Disclaimer/Publisher’s Note: The statements, opinions and data contained in all publications are solely those of the individual author(s) and contributor(s) and not of MDPI and/or the editor(s). MDPI and/or the editor(s) disclaim responsibility for any injury to people or property resulting from any ideas, methods, instructions or products referred to in the content.

