Article

Research on CeO2 Activated Carbon Electrode Capacitance Method for Sulfate Removal from Mine Water

by
Xiujuan Feng
1,2,3,4,*,
Yanjun Zou
2,3,4,
Sékou Mohamed Condé
1,3,4,
Xiaoqing Wang
1,3,4 and
Chengliang Dong
1,3,4,*
1
School of Mines, China University of Mining and Technology, Xuzhou 221116, China
2
School of Civil and Surveying Engineering, Jiangxi University of Science and Technology, Ganzhou 341000, China
3
Industrial Technology Innovation Center for Ecological Restoration of Industrial and Mining Sites in the Petroleum and Chemical Industry, Xuzhou 221116, China
4
Mechano Chemistry Research Institute, China University of Mining and Technology, Xuzhou 221116, China
*
Authors to whom correspondence should be addressed.
Water 2024, 16(5), 675; https://doi.org/10.3390/w16050675
Submission received: 7 February 2024 / Revised: 19 February 2024 / Accepted: 21 February 2024 / Published: 25 February 2024
(This article belongs to the Topic Capacitive Deionization Technology for Water Treatment)

Abstract

:
Sulfate is a typical characteristic pollutant in mine water. Because of its high concentration and large discharge of mine water, it has become a difficult problem in mineral exploitation. Capacitive deionization (CDI) is an innovative and economical removal technology. There are few reports on the use of CDI to remove SO42− from mine water. In this study, a CeO2 activated carbon electrode with good wettability, excellent electrochemical performance, and suitable pore structure was prepared by the sol-gel method. The application of the CeO2 activated carbon electrode to the capacitive method for treating high SO42− mine water was investigated using simulated wastewater and actual mine water. The study structure shows that CeO2:activated carbon (AC) has the best wettability, the highest specific capacitance, and the lowest electrical conductivity when the mass ratio of CeO2 is 5%. At 100 mg/L, the electrode has the maximum SO42− ion specific adsorption capacity (SAC). At 1 V and 20 mL/min, this value is measured. The electrode has a SAC value of 9.36 mg/g, far higher than the AC electrode’s 4.1 mg/g. The effect of CDI process factors such the voltage, flow rate, and initial concentration was studied to find the best treatment method. SAC retention is 91% after 10 adsorption–desorption cycles, demonstrating outstanding electrode performance. Under the best CDI process (1.4 volts, 30 mL/min), mine water was treated. After 20 cycles of treatment, the concentration of SO42− in mine water decreased from 1170 mg/L to 276.46 mg/L, and the removal rate was 76.37%. This study proved that the CeO2 modified activated carbon electrode capacitance method can effectively remove sulfate ions and other ions from mine water.

1. Introduction

The mining of mineral resources also produces a large amount of mine wastewater, especially in coal mines. Sulfate is the most abundant organic salt and characteristic pollution factor in mine water. Sulfate concentrations in mine water typically range from a few hundred to several thousand milligrams per liter [1]. Compared to toxic metals, sulfates are considered contaminants with lower risk levels, but high levels of sulfate can significantly affect public water supplies by the scaling of pipes and corrosion. Additionally, excess sulfate in drinking water can affect the taste of water and cause laxative effects. Under anaerobic conditions, sulfate can, via sulfate-reducing bacteria, produce H2S, a gas that is toxic to the ecosystem [2,3,4]. Furthermore, H2S is extremely poisonous, and water that contains these compounds will impede the growth and reproduction of aquatic species, leading to their demise and the disruption of the water body’s fundamental ecological control role. Due to these detrimental impacts, the World Health Organization (WHO) and the U.S. Environmental Protection Agency (EPA) suggest a maximum level of 250 parts per million (ppm) for the sulphate content [5,6,7]. Chemical precipitation, biological methods, adsorption methods, ion exchange methods, and membrane technology have been used to remove sulfate. However, these methods have limitations. The chemical precipitation and adsorption methods will form a large amount of sludge with a high water content, and it is difficult to dewater the sludge and the sludge disposal cost is high; the biological method has high environmental requirements, and, at the same time, it is accompanied by the disposal of miscellaneous salts formed by associated elements after desulfurization. Ion exchange methods are susceptible to water quality and are costly; the cost of membrane technology is high, the membrane is prone to fouling, is difficult to recycle, and the pretreatment process is complex before water intake [3,5,6,7,8,9]. Therefore, it is necessary to study how to economically and effectively remove sulfate from mine wastewater.
Capacitive deionization technology (CDI) is an innovative approach for eliminating both positive and negative ions from water. It achieves this by employing high-capacity electrodes that operate on the principles of the double electric layer theory. Applying an electric potential to the electrodes causes them to attract and immobilize ions with opposite charges on their surfaces, resulting in the formation of a double electric layer. This layer effectively stores the charged ions from the water, thereby eliminating them [10,11]. CDI, in comparison to other deionizing technologies, offers several advantages, such as minimal energy consumption, easy maintenance and operation, rapid regeneration, environmental compatibility, and cost effectiveness. The technology shows great potential [12,13,14]. Hence, it is highly advantageous to utilize it for the remediation of sulfate in mine wastewater.
The ion removal efficacy of a CDI system is influenced by various aspects, with the selection and preparation of electrode materials being the most crucial. Over many years, individuals have created and examined several carbon materials, including activated carbon (AC) [15,16], carbon of nanotubes [17,18], carbon aerogel [19,20], activated carbon fiber [21,22], graphene [23,24], and its composites [10]. Among these carbon-based materials, activated carbon has unique characteristics, especially its low price, good pore size distribution, and strong ability to treat environmental pollutants [25]. However, its low wettability, low conductivity, and low specific capacitance limit its development in CDI [26,27]. Active carbon is usually modified or activated. Dou et al. [28] treated activated carbon with nitric acid, phosphoric acid, melamine, urea, and zinc chloride to make modifications. The results indicated that the surface of the modified activated carbon exhibited a higher concentration of oxygen or amino groups. Furthermore, it exhibited superior performance in the processes of desalination and electrical conduction. Following activation with phosphoric acid, the electro-adsorption capacity in a 500 mg/L NaCl solution increased to 15.52 mg/g, which was eight times greater than the capacity before modification. Furthermore, the amalgamation of various metal oxides with carbon can enhance both the ability of a substance to spread over a surface and its electrochemical characteristics [29]. A variety of metal oxides have been used to combine with activated carbon. You et al. [30] prepared TiO2 carrier carbon–metal oxide materials by the sol-gel method. When the TiO2 content was 50%, the highest ion removal rate (92%) was achieved. Ma et al. [31] deposited RuO2 on a carbon carrier by electrodeposition, which improved the wettability and cycling stability of the electrode. A voltage of 1.2 V was applied to a 5 mM NaCl solution, resulting in an electro-adsorption capacity of 11.26 mg/g. The rare earth oxide CeO2 is favored for its affordability, environmental compatibility, and favorable electrochemical properties. CeO2 has been identified as one of the most reactive rare earth metal oxides among known metal oxides due to its low cost, environmental friendliness, and good electrochemical properties, which improve the performance of AC in CDI. In addition, the oxidation state of cerium can be rapidly and rapidly mutated between Ce (III) and Ce (IV), thus facilitating the rapid transfer of electrons. In recent years, researchers have used CeO2/carbon composites for catalysts, fuel cells, sensors, and capacitors. For example, Fang et al. [32] prepared cerium oxide nanotube catalytic materials under simple liquid phase process conditions that have high oxidation activity for CO. In an electro-Fenton system, Li et al. [33] successfully synthesized a three-dimensional CeO2/RGO composite material via in situ deposition and hydrodynamics for use as the cathode in the efficient degradation of ciprofloxacin. Furthermore, the desalting and electrochemical characteristics of the CeO2/rGO electrode fabricated by Yousef et al. [34] were commendable. At a scanning rate of 5 mV/s, it exhibited a specific capacitance of 452.26 F/g, which was significantly greater than the capacitance of graphene nanosheets (47.01 F/g).
In this study, we prepared a CeO2-doped AC composite electrode material using the sol-gel method, which enhanced the wettability, conductivity and electrosorption capacity; then, it was utilized for capacitive deionization technology to treat sulfate in mine wastewater. The findings of this study contribute to the growing body of knowledge in the field of mine wastewater treatment and provide insights for further research and application in this area.

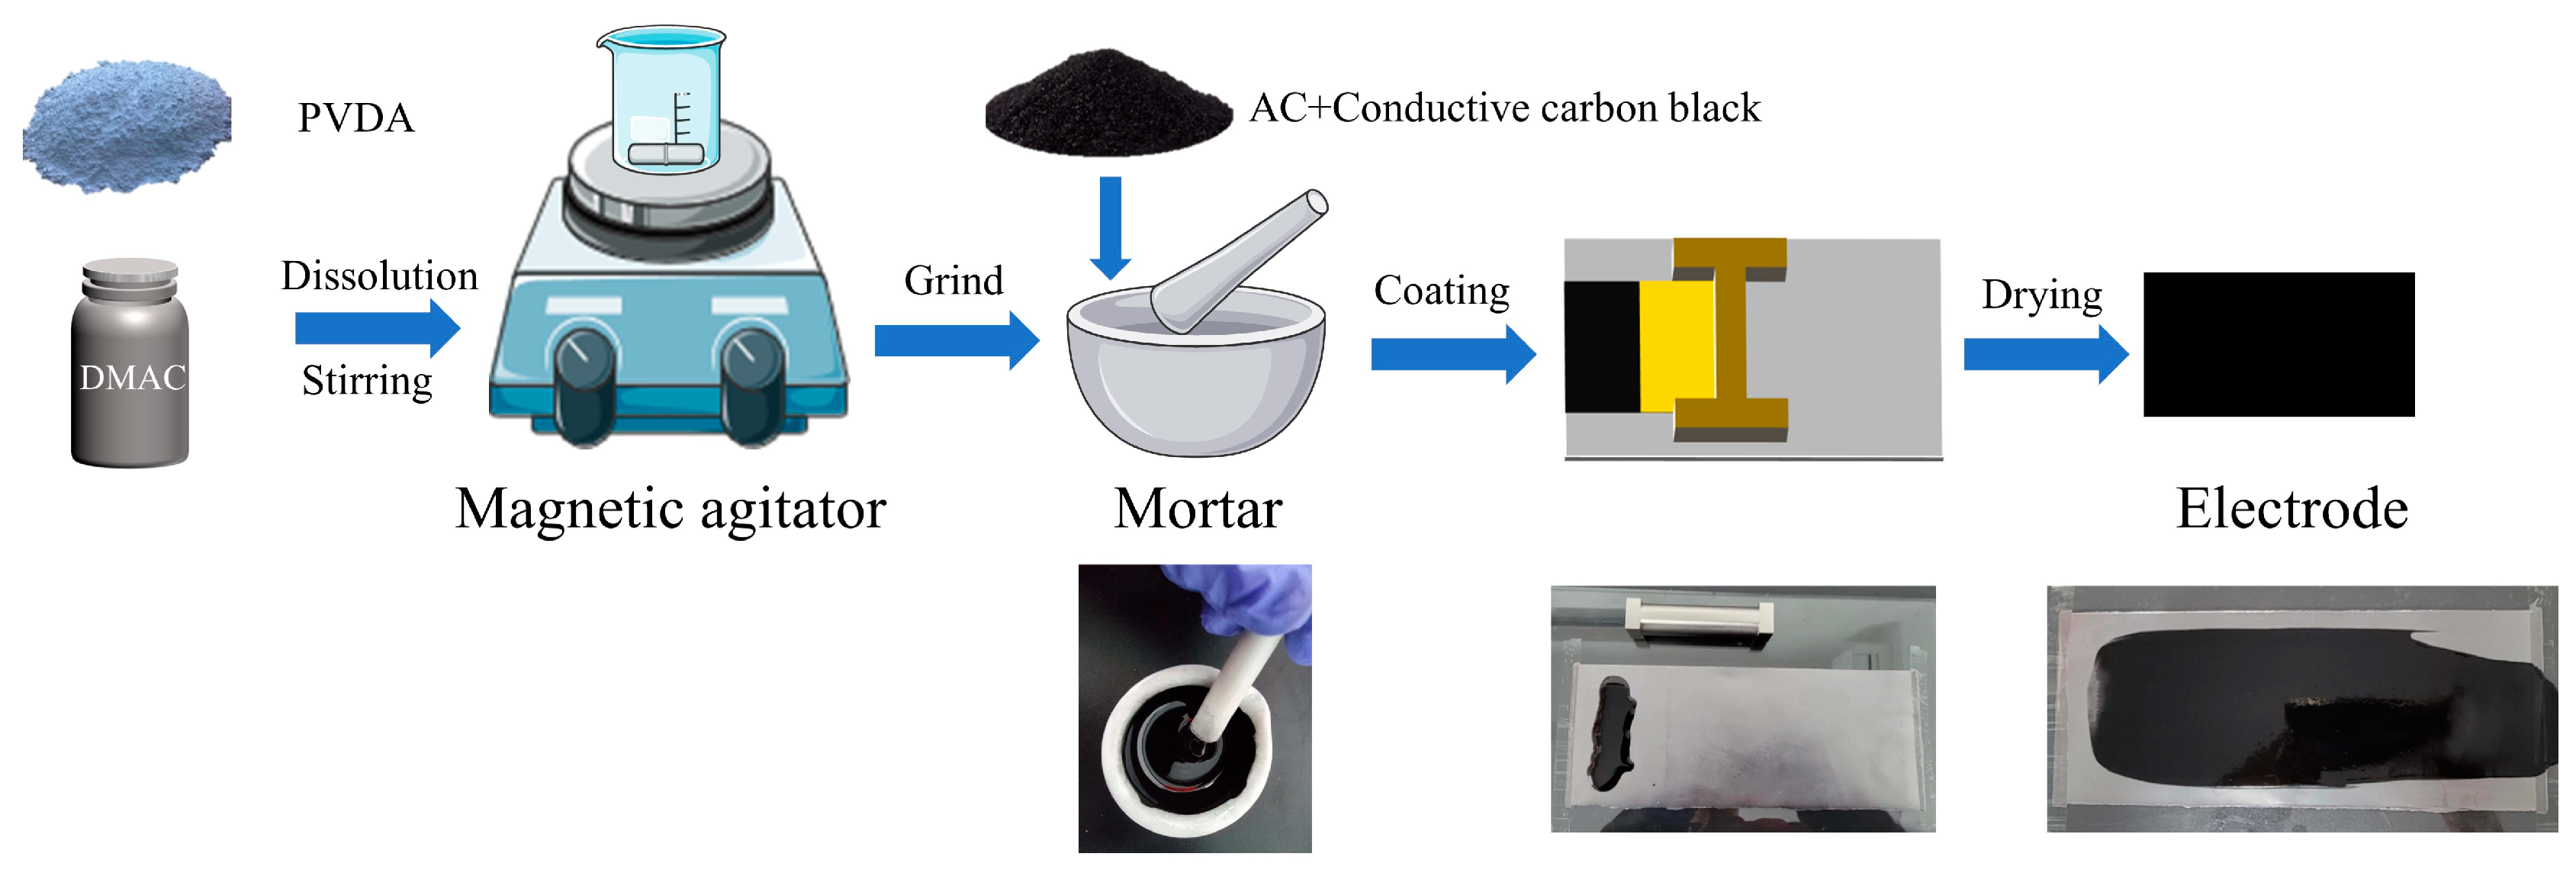
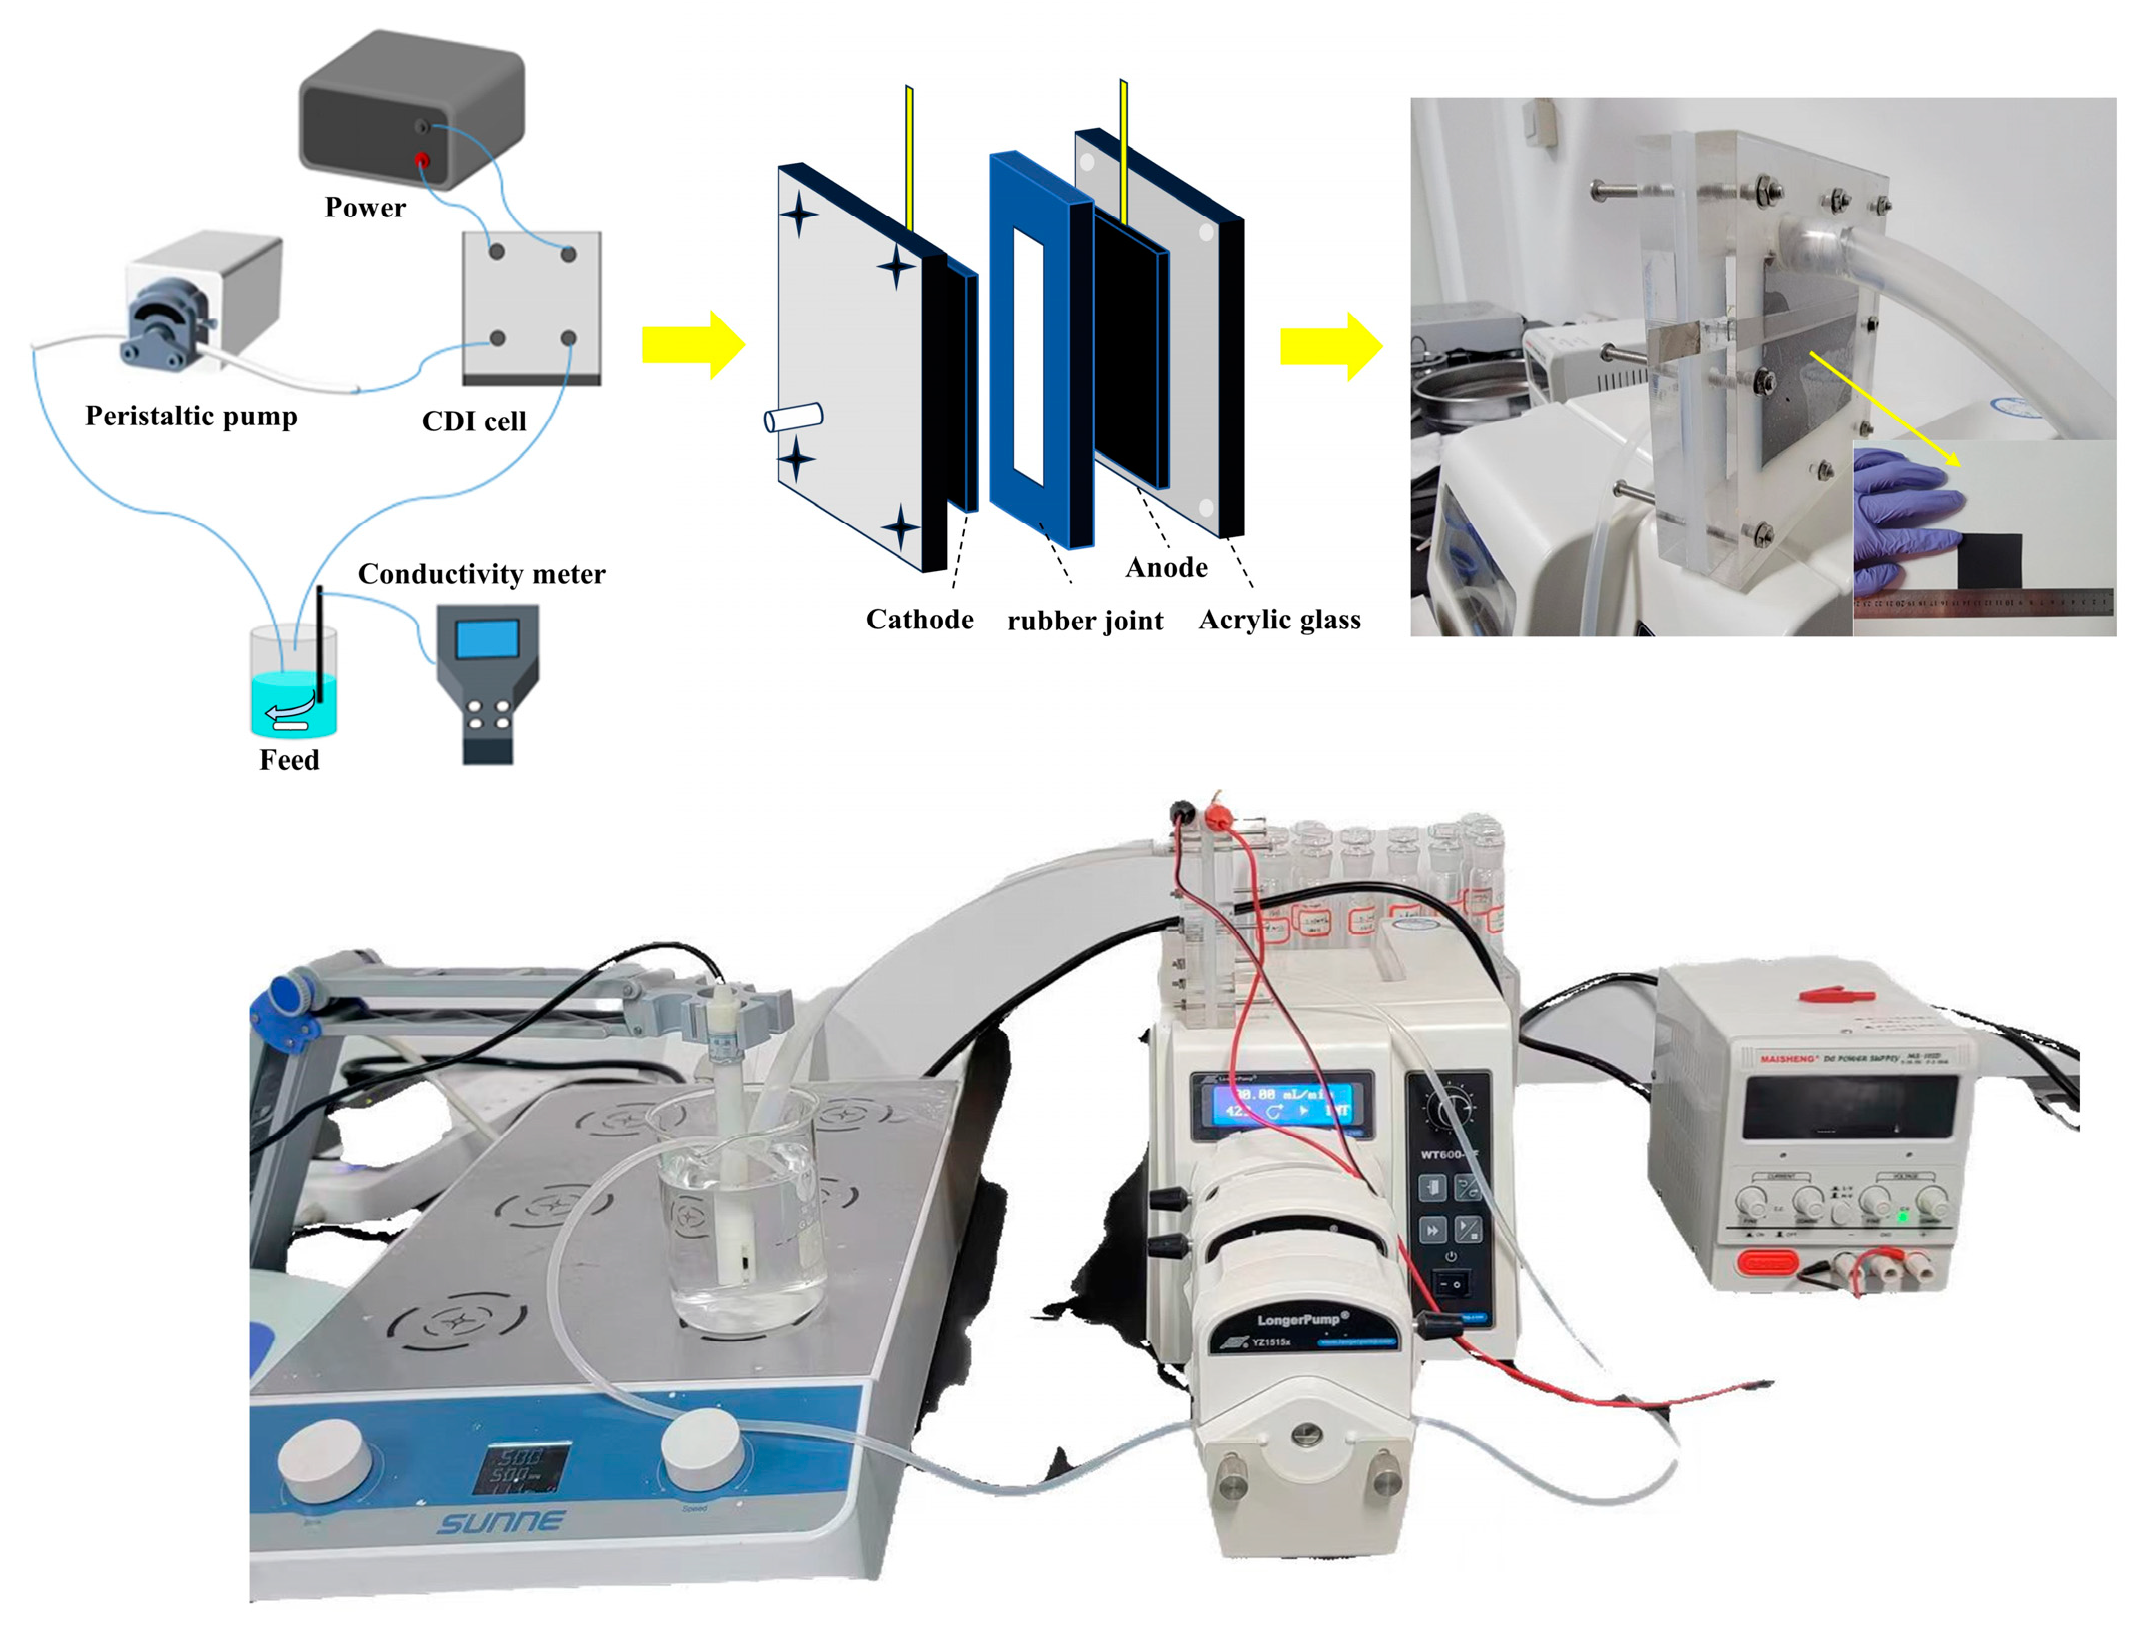
2. Materials and Methods

Test materials: activated carbon, citric acid monohydrate (C6H8O7·H2O, CAM, 98%), cerium nitrate hexahydrate (Ce(NO)3·6H2O, 99.5%), polyvinylidene fluoride (C2H2F2,PVDF, Mw = 500,000), dimethylacetamide (C4H9NO, DMAC, 99%), and anhydrous sodium sulfate (Na2SO4, 99.99%). The test water was made in the laboratory with ultra-pure water. Activated carbon was procured from Sinopharm Group Chemical Reagent Co., Ltd. (Shanghai, China) It underwent a pickling process using 5% hydrochloric acid to eliminate ash and dry impurities, ensuring its preservation for future usage. Additional reagents were procured from Shanghai Aladdin Biochemical Technology Co., Ltd. (Shanghai, China).
A total of 1.479 g of anhydrous sodium sulfate was dissolved in ultra-pure water, and a 1 g/L SO42− reserve solution was used to prepare simulated mine water with different concentrations. The actual mine water used in the test came from the underground mining area of a bauxite mine in Shanxi Province, with a pH of 7.47. The main components of the water are analyzed in Table 1.
Carbon particulate activated with CeO2 was produced via the sol-gel process. In 25 mL of deionized water, 0.31 g and 0.62 g of cerium nitrate hexahydrate and 0.45 g and 0.9 g of citric acid monohydrate were dissolved, respectively. To ensure uniform mixing, the two solutions were mixed using a magnetic agitator for one hour, followed by continuous stirring in a water bath maintained at 70 °C. The activated carbon powder was introduced into the mixture prior to the formation of the gel, and the process was maintained until a moist gel was formed. To acquire the dry gel, the obtained wet gel was dried in a blast drying oven at 105 °C for two hours. In the end, it was naturally chilled to room temperature after being heated to 650 °C at a rate of 5 °C/min in a nitrogen atmosphere for two hours in order to obtain activated carbon powder doped with 15% and 10% CeO2. The coating method was utilized to prepare a CeO2 activated carbon electrode, as illustrated in Figure 1. The mass ratio of the three components, conductive carbon black, activated carbon powder, and polyvinylidene fluoride, was calculated to be 8:1:1. A volume of 3 mL of dime-thylacetamide (DMAC) was measured using a pipetting gun before being transferred to a beaker. A total of 0.1 g of PVDF was accurately weighed with an electronic balance and slowly added to DMAC while stirring. When the PVDF was completely dissolved, the solution was poured into a quartz mortar filled with 0.8 g of activated carbon powder and 0.1 g of conductive carbon black and ground in the mortar until a honey-like, thick paste was formed. Before applying, tape a piece of graphite paper to the glass plate with scotch tape. Use the coating method to pour the grout onto the graphite paper. The coating thickness was set to 400 μm. The electrodes were coated and subsequently dried at ambient temperature for 30 min. They were then subjected to overnight heating in a drying oven at 100 °C to facilitate cross-linking and obtain CeO2/AC electrodes. The electrode material was named CeO2 (X)-AC (X = 0, 5, 10), respectively, according to the different CeO2 doping mass ratios.
Figure 2 displays the experimental gadget that was specifically designed and built for this purpose. The CDI module consists of a set of symmetrical electrodes, a rubber divider, and a plexiglass cover, all securely fastened with screws. The electrode size is 5 × 6 cm2, and the active substance mass is 0.195 g. The CDI test apparatus consists of a CDI module, a DC power source, a conductivity meter, a peristaltic pump, and a magnetic stirrer. The DC power supply ensures a consistent voltage supply to the CDI system, the peristaltic pump maintains a steady flow of water into and out of the system, the conductivity meter monitors variations in the solution’s conductivity, and the magnetic stirrer maintains uniformity in the solution. The electro-adsorption test is conducted on the experimental apparatus. Equations (1) and (2) provide the means to determine the electrode’s adsorption capacity for SO42− (mg/g) and its related electro-adsorption rate (mg/g/min):
S A C = C 0 C t V m
S A R = S A C t
The variables in the equation are defined as follows: m represents the mass of the composite material on the graphite paper (g), V represents the volume of the solution of SO42− (L), Ct represents the instantaneous concentration of the solution (mg/L), C0 represents the initial concentration of the solution (mg/L), and t represents the working period (min).
The surface morphology and content of the electrode materials were analyzed using a Hitachi Regulus 8100 scanning electron microscope (SEM, Tokyo, Japan) and an energy dispersive spectrometer (EDS). Begin by immersing the sample in absolute ethanol (AR, 99.7%) for ultrasonic dispersion treatment lasting 10 min. Subsequently, employ conductive glue to affix the dispersed test sample onto the silicon wafer of the sample stage for computer analysis. An X-ray diffractometer (Bruker D2 Phaser, Bruker, Karlsruhe, Germany) was used to examine the phase composition and crystallinity of the material. The scanning angle range was set at 10–90° with a scanning rate of 2°/min. The specific surface area and pore distribution of the material were measured using an automated analyzer (BET, Micromeritics ASAP 2460, Shanghai, China) after degassing at 200 °C for 6 h. The wettability of the electrode material was analyzed using a contact angle meter.
An Admiral electrochemical workstation from the USA was used. The platinum electrode worked as a counter electrode, whereas the Ag/AgCl electrode was used as a reference electrode. The working electrode was the CeO2(X)-AC electrode. It had a size of 1 cm2 and a mass of 6.5 × 10⁻³ g. The electrolyte was a 1 M Na2SO4 solution. A three-electrode system carried out electrochemical testing of electrode materials. Utilizing cyclic voltammetry, the electrochemical behavior of high-sulfate treatments was characterized. The scan rate was 5 to 200 mV/s, and the voltage range was −1 V to 1 V. The internal electron and electron transfer between electrode and electrolyte were analyzed by the electrochemical impedance method. As an example, the power supply voltage had an amplitude of 5 mV, and the measuring frequency ranged from 0.01 Hz to 100 kHz. Applying Formula (3), we obtain the specific capacitance (C, F/g):
C = V a V c I d V 2 m v V c V a
where Vc and Va represent high and low potentials (V), respectively. I denotes the current (A), m refers to the mass of the composite material on the working electrode (g), and V represents the scanning rate (mV/s).

3. Results and Discussion

3.1. Analysis of CeO2 Activated Carbon Materials’ Properties

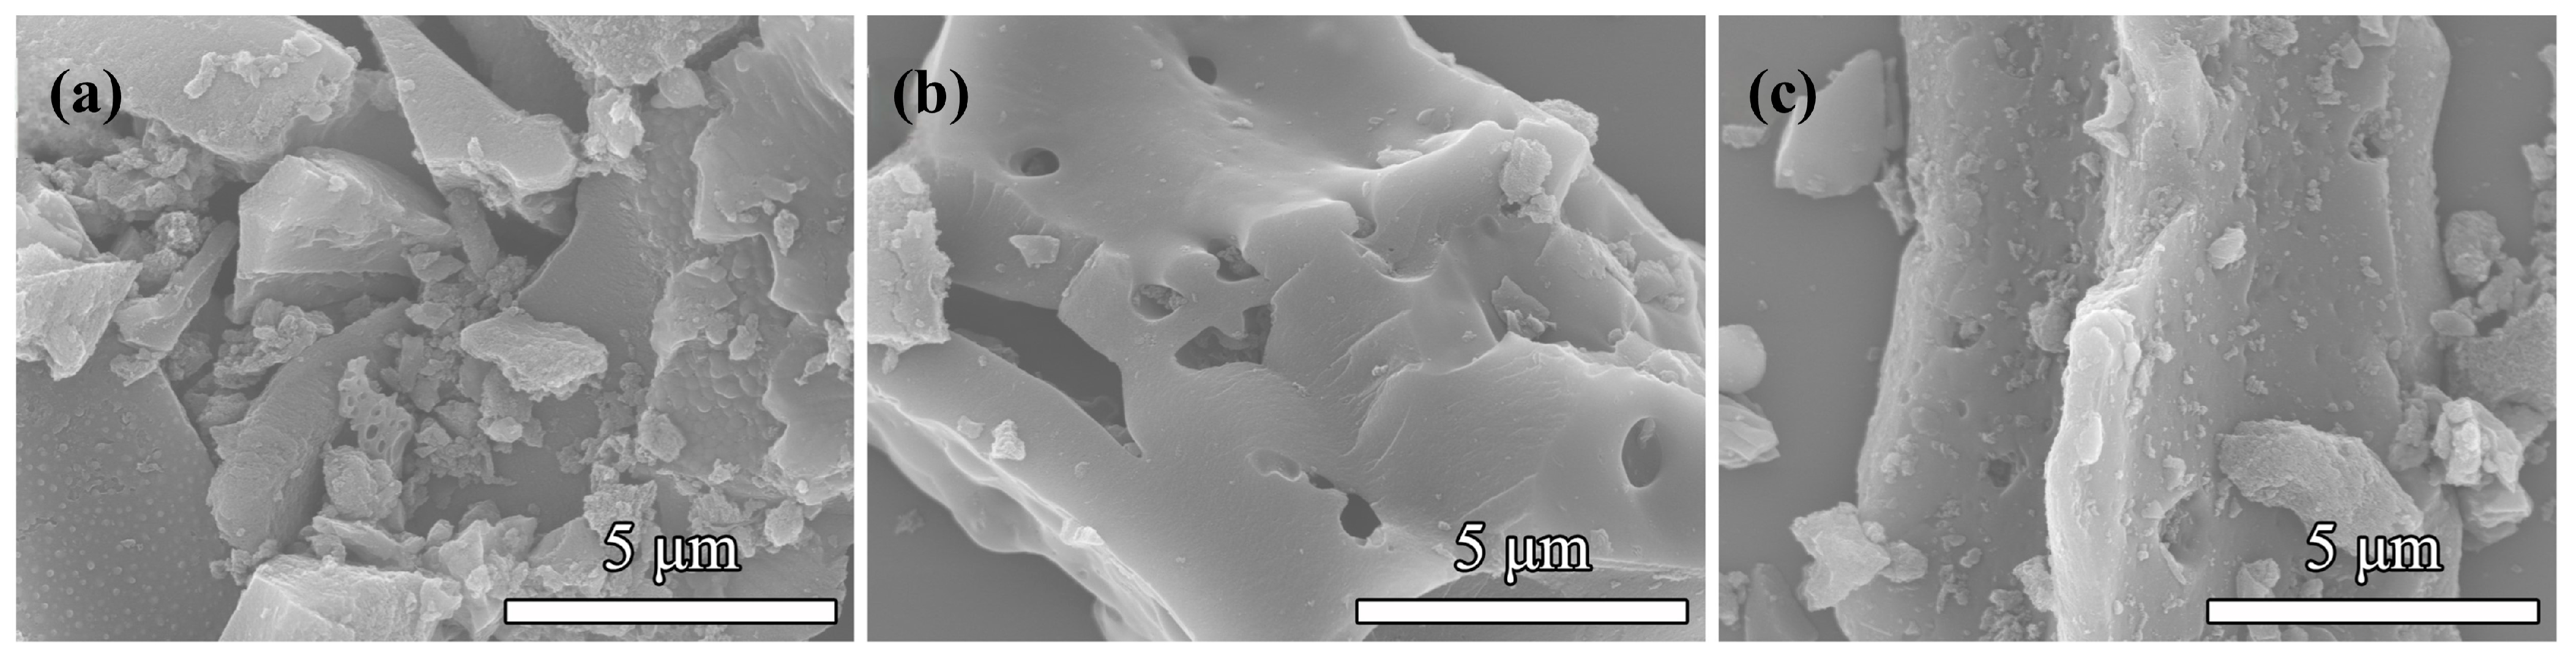
3.1.1. Microstructure and Phase Composition of CeO2 Activated Carbon Materials

The microstructure (Figure 3) and phase composition (Figure 4 and Figure 5) of AC, CeO2(5)-AC, and CeO2(10)-AC were obtained by scanning electron microscopy (SEM) and X-ray diffractometer (XRD).
According to the analysis of Figure 3a–c, it can be seen that AC, as shown in Figure 3a, has a smooth surface and small pore size, while CeO2(5)-AC, as shown in Figure 3b, has a small number of fine particles on the surface and pores, indicating that CeO2 exists on the surface of activated carbon or enters the pores in the form of fine particles. Figure 3c shows the increase in fine particles on the surface and pores of CeO2(10)-AC. The pore size of CeO2(5)-AC and CeO2 (10)-AC surfaces is larger than that of AC, because the pore size is enlarged by the gas overflow during the high-temperature sintering process. Appropriate CeO2 increases the conductivity without clogging the pores and is more conducive to the treatment of high-sulfate mine water.
The examination of Figure 4 reveals that carbon, oxygen, and cerium exhibit a uniform distribution on CeO2(5)-AC. The study of Figure 3 reveals that the diffraction peaks of all samples are broad and indistinct, suggesting that activated carbon predominantly occurs in an amorphous state. The presence of peaks at 2θ = 22.7° in the AC sample suggests that the carbon can be classified as graphitized carbon. Furthermore, a distinct peak was detected at an angle of 2θ = 26.6°, indicating the presence of the (002) crystal face of graphite structures. Additionally, a smaller and narrower peak was discovered at an angle of 2θ = 43.8°, which corresponds to the (100/100) crystal face of graphite structures, as commonly observed [35]. The presence of distinctive diffraction peaks at 2θ values of 28.5°, 33.3°, 47.5°, and 56.2° after CeO2 doping indicates the crystalline form of cerium as CeO2. The results indicate the successful preparation of the CeO2(5)-AC material.

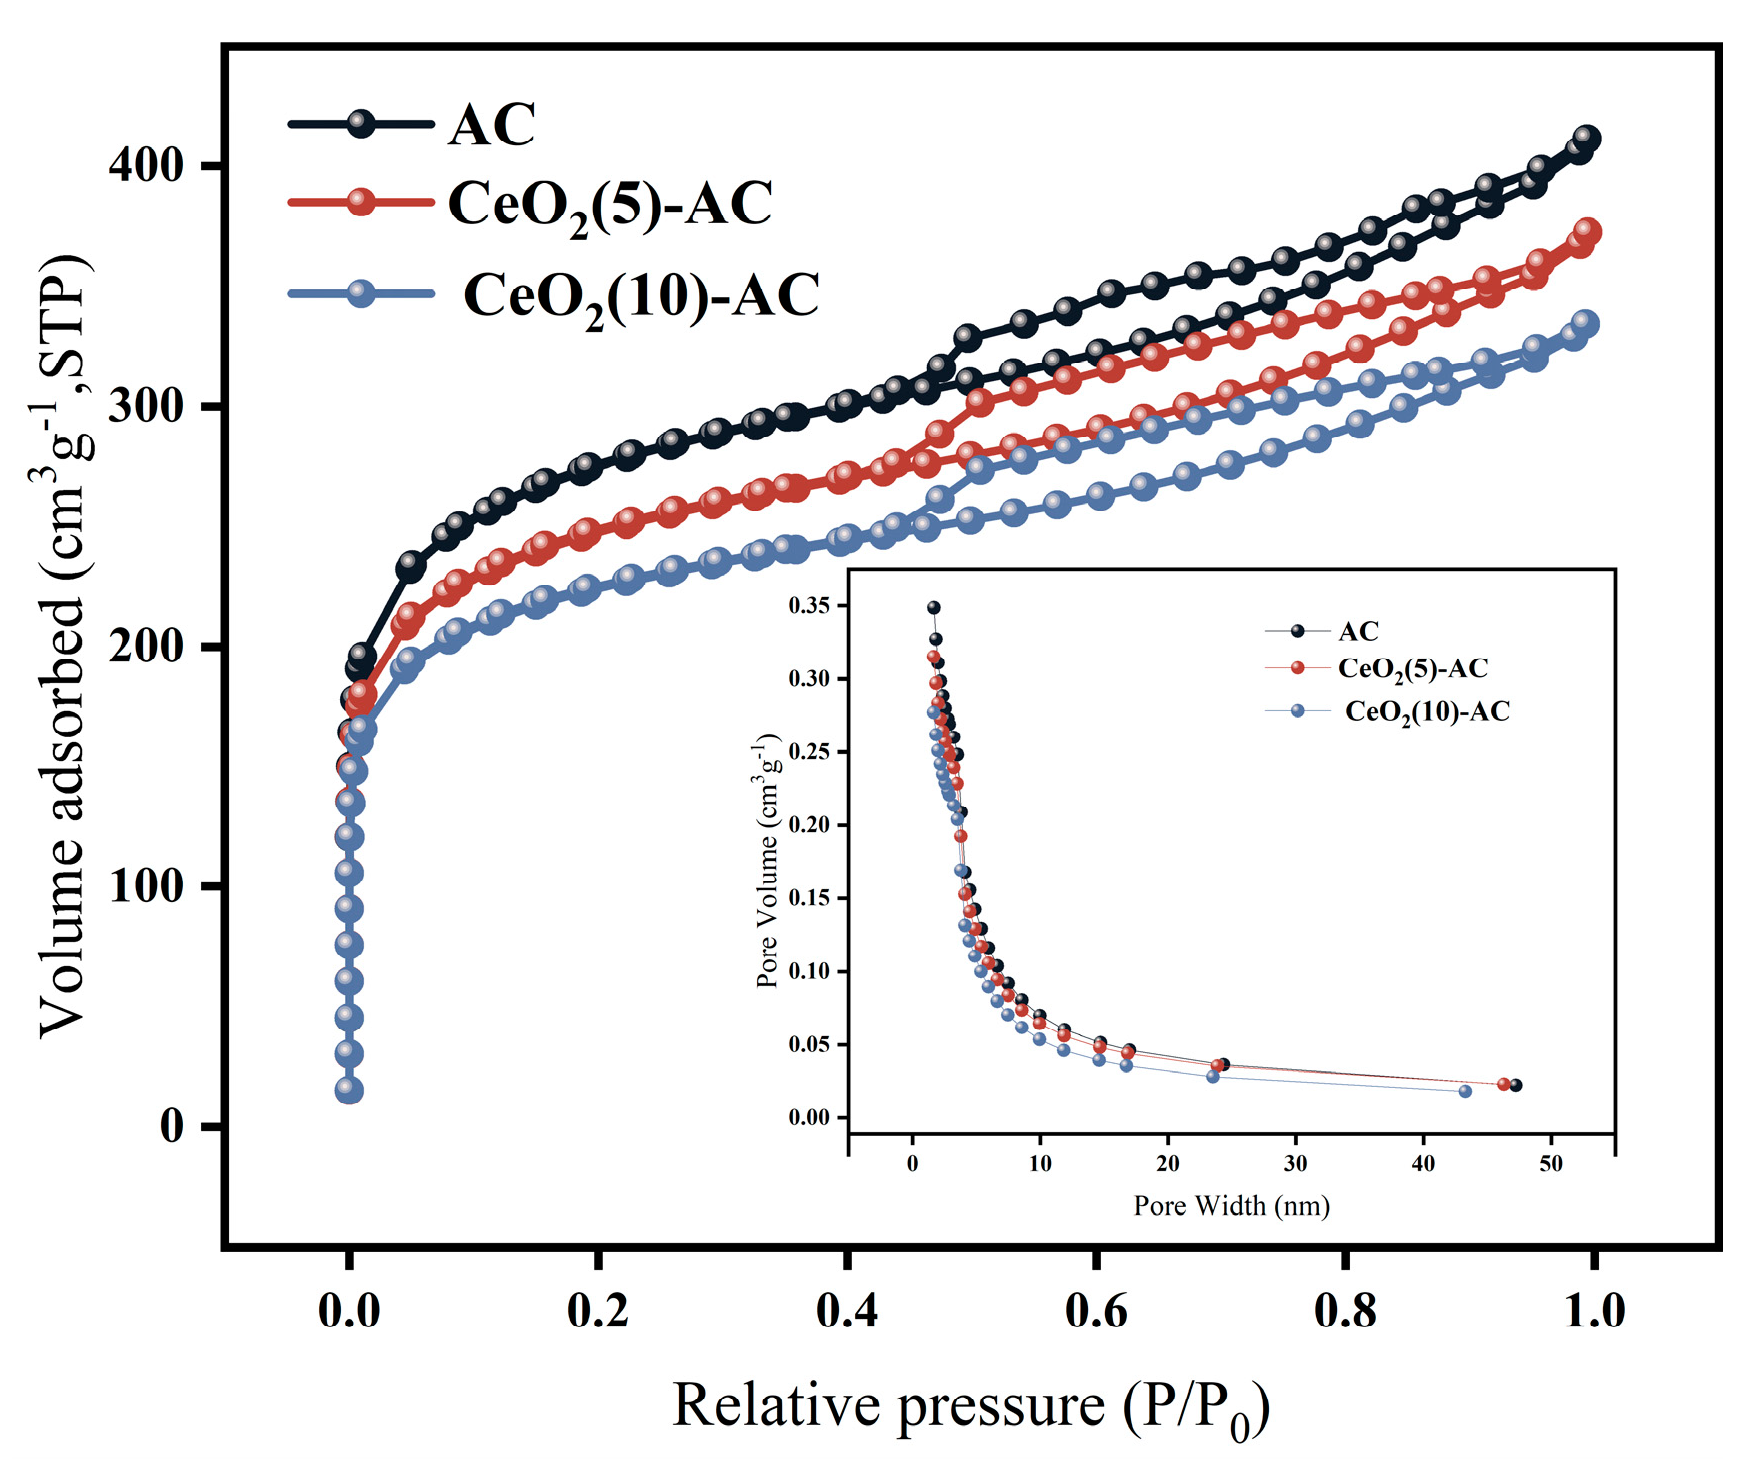
3.1.2. Specific Surface Area of the CeO2 Activated Carbon Material

The N2 adsorption–desorption isotherm and pore size characteristics of the sample were determined using nitrogen adsorption–desorption equipment. Based on the IUPAC classification, the adsorption and desorption curves of the three materials exhibit type IV adsorption curves with H4 hysteresis loops [36]. The N2 adsorption–desorption isotherm is depicted in Figure 6, while the pore characteristic values are included in Table 2.
It can be seen from the analysis in Figure 6 that the pores of the sample are mainly composed of slit micropores and mesoporous pores. After CeO2 activation, the area of the hysteresis ring of the sample increases significantly, indicating that the pore structure in the sample increases. According to the analysis in Table 2, the specific surface areas of AC, CeO2(5)-AC, and CeO2(10)-AC are 997.94, 898.11, and 813.71 m2 g−1, respectively. The Vmes/Vtot of AC, CeO2(5)-AC, and CeO2(10)-AC are 49.8, 61.4, and 58.1%, respectively. Obviously, the specific surface area decreases with the addition of CeO2. This indicates that CeO2 particles enter the pores, which can be observed in the SEM images. Appropriate microporous and mesoporous structures can improve the surface utilization of materials and facilitate ion diffusion [37,38]. While AC may have a more specific surface area, a suitable pore structure is more favorable for the performance of CDI. Hence, it is imperative to strike a harmonious equilibrium between the precise surface area and the mass load to achieve optimal desalination efficiency.

3.1.3. Wettability of the CeO2 Activated Carbon Electrode Material

The surface wettability of the electrode was assessed using the static contact angle measurement, as depicted in Figure 7.
According to the analysis of Figure 4 and Figure 7, the contact angle of the activated carbon electrode is 111.18°, which is a hydrophobic material, while the contact angle of the CeO2(5)-AC electrode is 85.29°, which is a hydrophilic material. The increase in hydrophilic energy can make it easier and faster for ions to diffuse into the electrode, thereby improving the electro-adsorption performance and obtaining good capacitance. However, when the CeO2 doping mass ratio was increased to 10 wt%, the electrode contact angle was 100.9°, which may be due to the aggregation of CeO2 fine particles on the AC surface and accumulation in the pores, which can be observed in the SEM images.

3.2. Analysis of CeO2 Activated Carbon Materials’ Properties

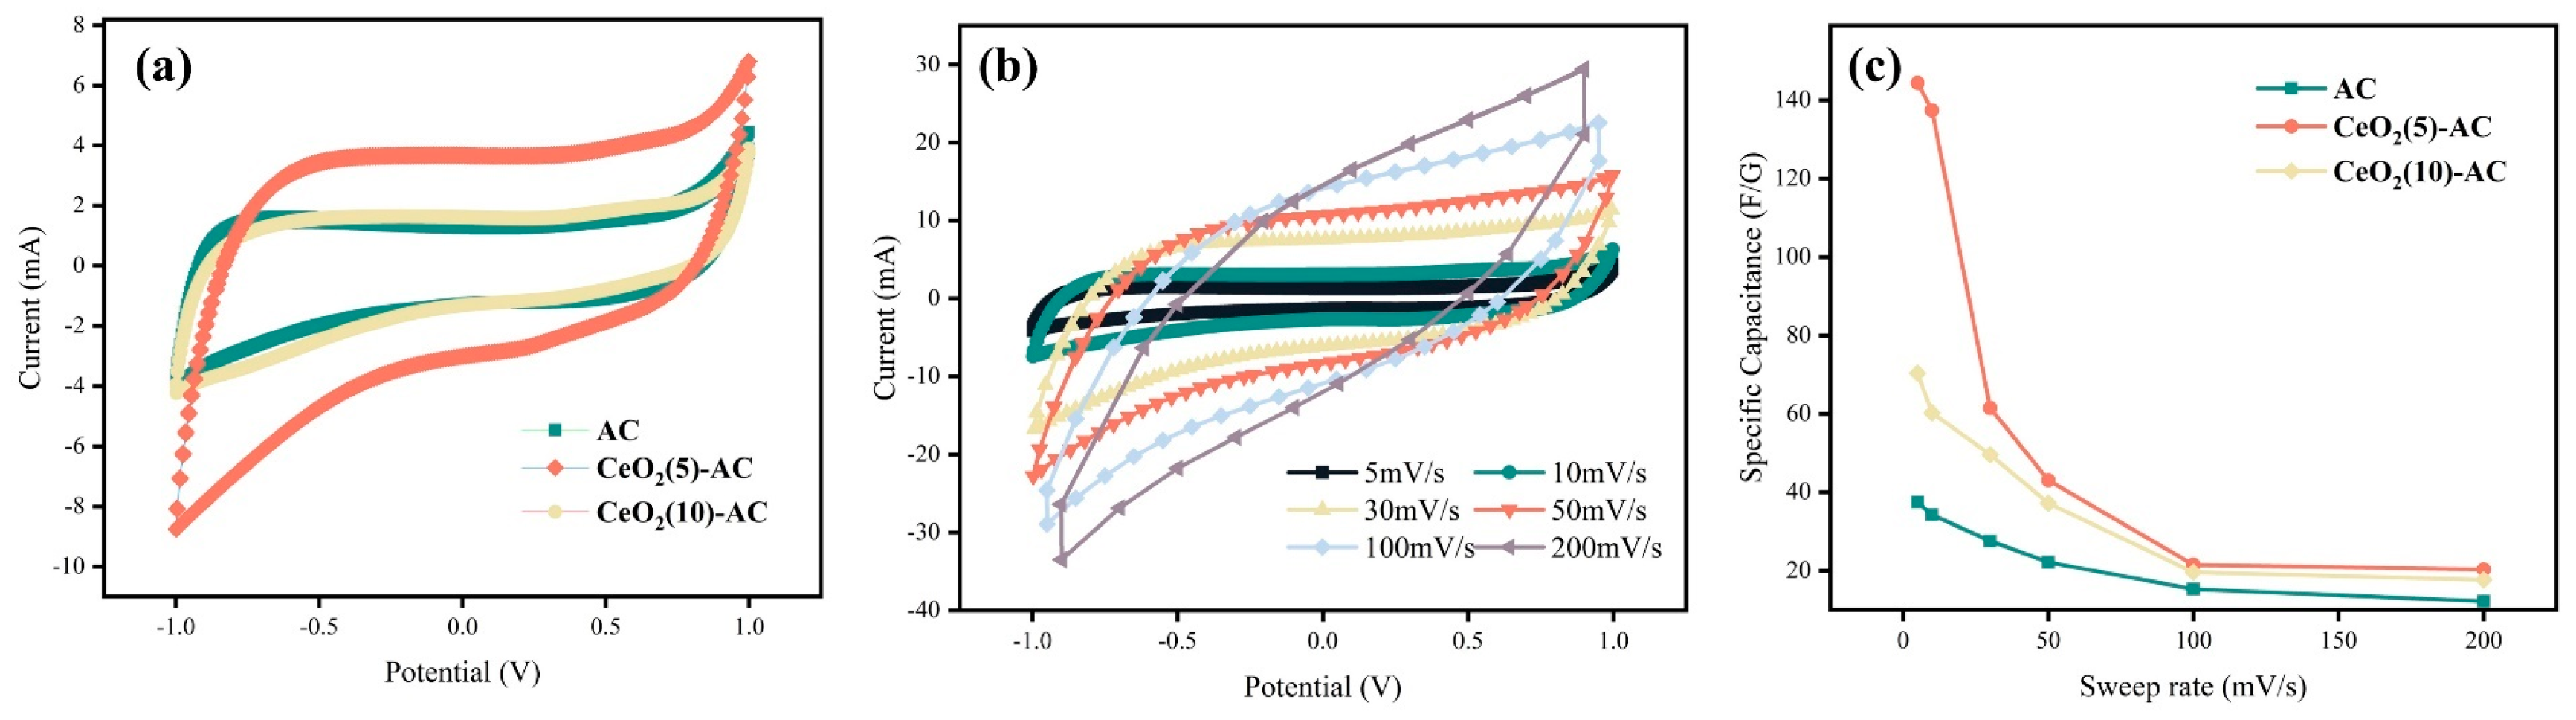
3.2.1. Cyclic Voltammetry Curve Characteristic Analysis

The cyclic voltammetry curve of the electrode obtained using electrochemical workstation is shown in Figure 8a–c.
The analysis of Figure 8a shows that the activated carbon electrode has a smaller area enclosed by its cyclic voltammetry curve than the activated CeO2 electrode. The specific capacitance is higher for the activated CeO2 electrode because the area enclosed by the cyclic voltammetry curve is larger, as the analysis of the figure reveals. Furthermore, it is worth noting that all three samples exhibit a symmetrical quasi-rectangular shape in their CV curves. These findings indicate that ions in a solution can be efficiently and quickly electro-adsorbed onto electrode materials [39]. Additionally, there is no Faraday reaction in the range of applied potentials. This shows that the electrode’s specific capacitance is the double layer capacitance (DELC), which is created by the Coulomb interaction and not the Faraday reaction [40]. The CV curve analysis of the CeO2(5)-AC electrode at various scanning rates (5 mV/s, 10 mV/s, 30 mV/s, 50 mV/s, 100 mV/s, and 200 mV/s) in Figure 8b reveals that in a 1 M Na2SO4 electrolyte, the CV curve retains its quasi-rectangular shape as the scan rate increases from 5 mV/s to 200 mV/s. This indicates that the CeO2 modified activated carbon electrode exhibits an excellent rate capability [41]. The study of Figure 8c reveals that the specific capacitance of the three electrodes diminishes as the scanning rate increases. At a low scanning rate, ions can diffuse into the pores and create a double electric layer. However, at a fast scanning rate, there is insufficient time for the formation of a double electric layer, resulting in a natural drop in capacitance [42]. Furthermore, the precise capacitance values for the AC, CeO2(5)-AC, and CeO2(10)-AC electrodes at a scanning rate of 5 mV/s are 37.48 F/g, 70.34 F/g, and 144.38 F/g, respectively. The findings indicate that the specific capacitance experiences an increase following the activation of CeO2, but decreases when the quantity of CeO2 reaches 10%. From the analysis in Figure 3, it is clear that a high CeO2 content will block the activated carbon pores, lower the electrode’s specific surface area, and make it less able to hold ions.

3.2.2. Electrochemical Impedance Spectroscopy

Electrochemical impedance testing is a way of studying internal resistance and electron transfer between electrodes and electrolytes. The electrochemical impedance spectra (Nyquist diagram) of the AC, CeO2(5)-AC, and CeO2(10)-AC electrodes were, respectively, measured based on the electrochemical workstation, as shown in Figure 9.
As can be seen from the analysis of Figure 9, each impedance spectrum curve consists of a semicircular curve for high frequencies and a diagonal line for low frequencies. The intercept between the CeO2 activated carbon electrode curve and the real axis decreases, the diffusion coefficient decreases, the diffusion impedance decreases, and the impedance of the CeO2(5)-AC electrode is the lowest. According to the analysis in Figure 7, the CeO2(5)-AC electrode has better wettability and better adhesion to aqueous solutions on its surface, which greatly reduces the interface resistance value and realizes the rapid reaction of ions.

3.3. Effect of the CeO2 Mass Ratio on the Electro-Adsorption Properties of SO42−

An engineered CDI test device was used to investigate how well the three different electrode materials could remove salt. To perform the SO42− removal test, a pair of symmetric electrodes was put into the CDI module. For the tests on the AC, CeO2(5)-AC, and CeO2(10)-AC electrodes, a SO42− solution with 100 mg/L was used. A constant flow rate of 20 mL/min and a constant voltage of 1 V were set as the operating parameters for the CDI system. Figure 10 displays the test results.
As can be seen from the analysis in Figure 10, the SAC of the three electrodes increased with the increase in time during the test and tended to reach equilibrium after 20 min. During the test, Na+ and SO42− ions are quickly transported to the negative and positive electrodes, respectively, due to the applied electric field. This results in a decrease in the concentration of SO42− in the solution. As the test progresses, the rate of increase in the specific adsorption capacity (SAC) decreases and stabilizes after 30 min of operation. The SAC values for the CeO2(5)-AC electrode, AC electrode, and CeO2(10)-AC electrode are 9.36 mg/g, 4.1 mg/g, and 8.1 mg/g, respectively. The CeO2(5)-AC electrode has the best removal effect of SO42−. It is further proved that the optimal mass ratio of CeO2:AC is 5%.

3.4. Effects of Different CDI Process Parameters on the Electro-Adsorption Properties of SO42−

The optimal process parameters were determined by exploring the influences of changes in voltage, inlet flow rate, SO42− initial concentration, and other parameters on the CDI performance of the CeO2(5)-AC electrode, and the results are illustrated in Figure 11a–c.
Upon examining Figure 11a, it is evident that the voltage improves from 0.8 V to 1.4 V, while the SAC value increases from 7.13 mg/g to 15.38 mg/g. The principle behind this is that as the operating voltage increases, the coulomb interaction becomes more potent, resulting in an intensified electrostatic attraction and enhanced adsorption capacity [43]. When the voltage moves up to 1.6 V, the adsorption capacity decreases and reaches a value of 12.35 mg/g. This is due to the formation of a dosage polarization layer on the electrolysis and electrode in high-voltage water, which reduces the powering efficiency of the CDI system. Based on the analysis presented in Figure 11b, it can be concluded that CDI exhibits the highest efficiency in removing SO42− while the water velocity is 30 mL/min. The values of the specific adsorption capacity (SAC) were measured at flow rates of 10, 20, 30, 40, and 50 mL/min, resulting in SAC values of 9.36, 12.35, 18.03, 10.44, and 8.77 mg/g, respectively. As the feed flow rate increased, the SAC value initially went up and subsequently declined. At a flow rate of 30 mL/min, the specific adsorption capacity (SAC) reached its peak value of 18.03 mg/g. However, as the flow rate further increased, the SAC value went down. The decrease in the circulation efficiency of the solution at low flow rates impedes the continuous removal of SO42− by the CDI system [44]. At high flow rates, the SO42− ions in the solution do not come into complete contact with the electrode. The analysis depicted in Figure 11c reveals that the treatment of SO42− solutions with initial concentrations of 100, 300, 500, 700, and 900 mg/L results in corresponding SAC values of 9.36, 14.1, 23.96, 36.5, and 41.7 mg/L. It is observed that SAC values exhibit an upward trend as the initial concentration increases. Each rise in salinity decreases the ionic resistance of the solution, facilitating the flow and adsorption of ions [45]. Furthermore, as per the Gouy–Chapman–Stern model, a higher initial concentration lowers the overlapping impact of the electrical double layer (EDL), enhances the capacity of the diffused EDL, facilitates the formation of double electric layers, and enhances the electrode’s conductivity [46].

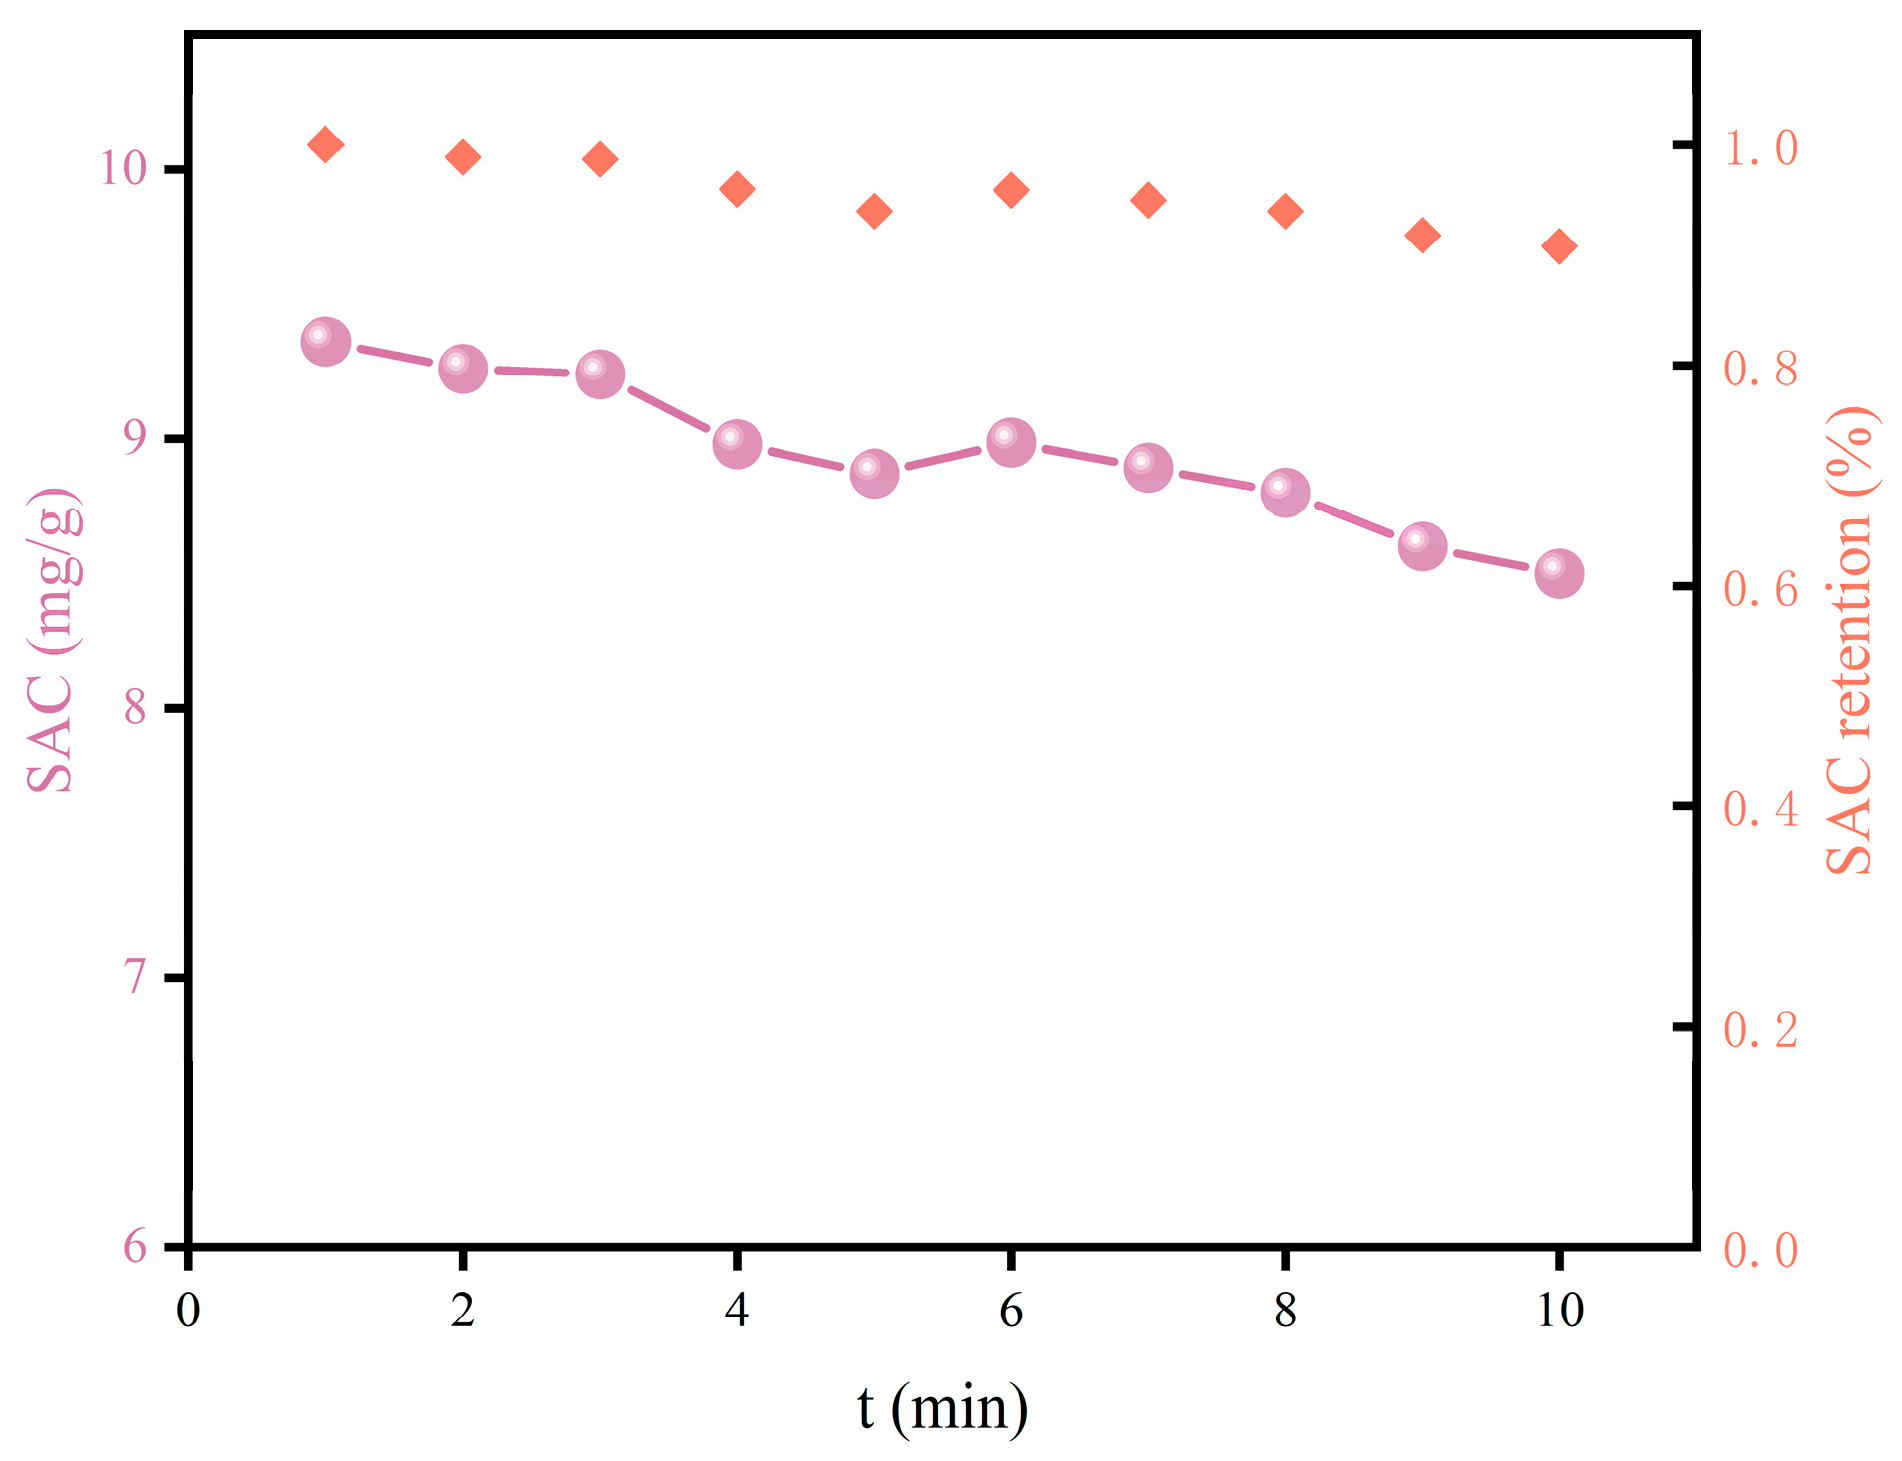
3.5. Cyclic Performance

The number of electrode material adsorption and desorption cycles is a key factor in electrode performance and operation costs. In this experiment, the SAC value and SAC retention rate were examined while the electrode was undergoing adsorption and desorption 10 times. The results are shown in Figure 12.
According to the analysis in Figure 12, the initial conductivity of the 100 mg/L SO42− solution measured by CeO2(5)-AC electrode before the electro-adsorption of salt ions was 213 μS/cm. After 20 min of system operation, the solution conductivity was significantly reduced to 182.6 μS/cm. Currently, the electrode has an electro-adsorption capacity of 9.36 mg/g. The positive and negative electrodes are connected, causing the ions that were attached to the electrodes to be released and return to the solution. The conductivity of the SO42− solution returns to its original value, and the process of regenerating the electrode is finished after each cycle of adsorption and desorption. After 10 cycles, the electrode still maintained a high SAC retention rate (91%). The results show that CeO2(5)-AC has a good regeneration ability and high stability.

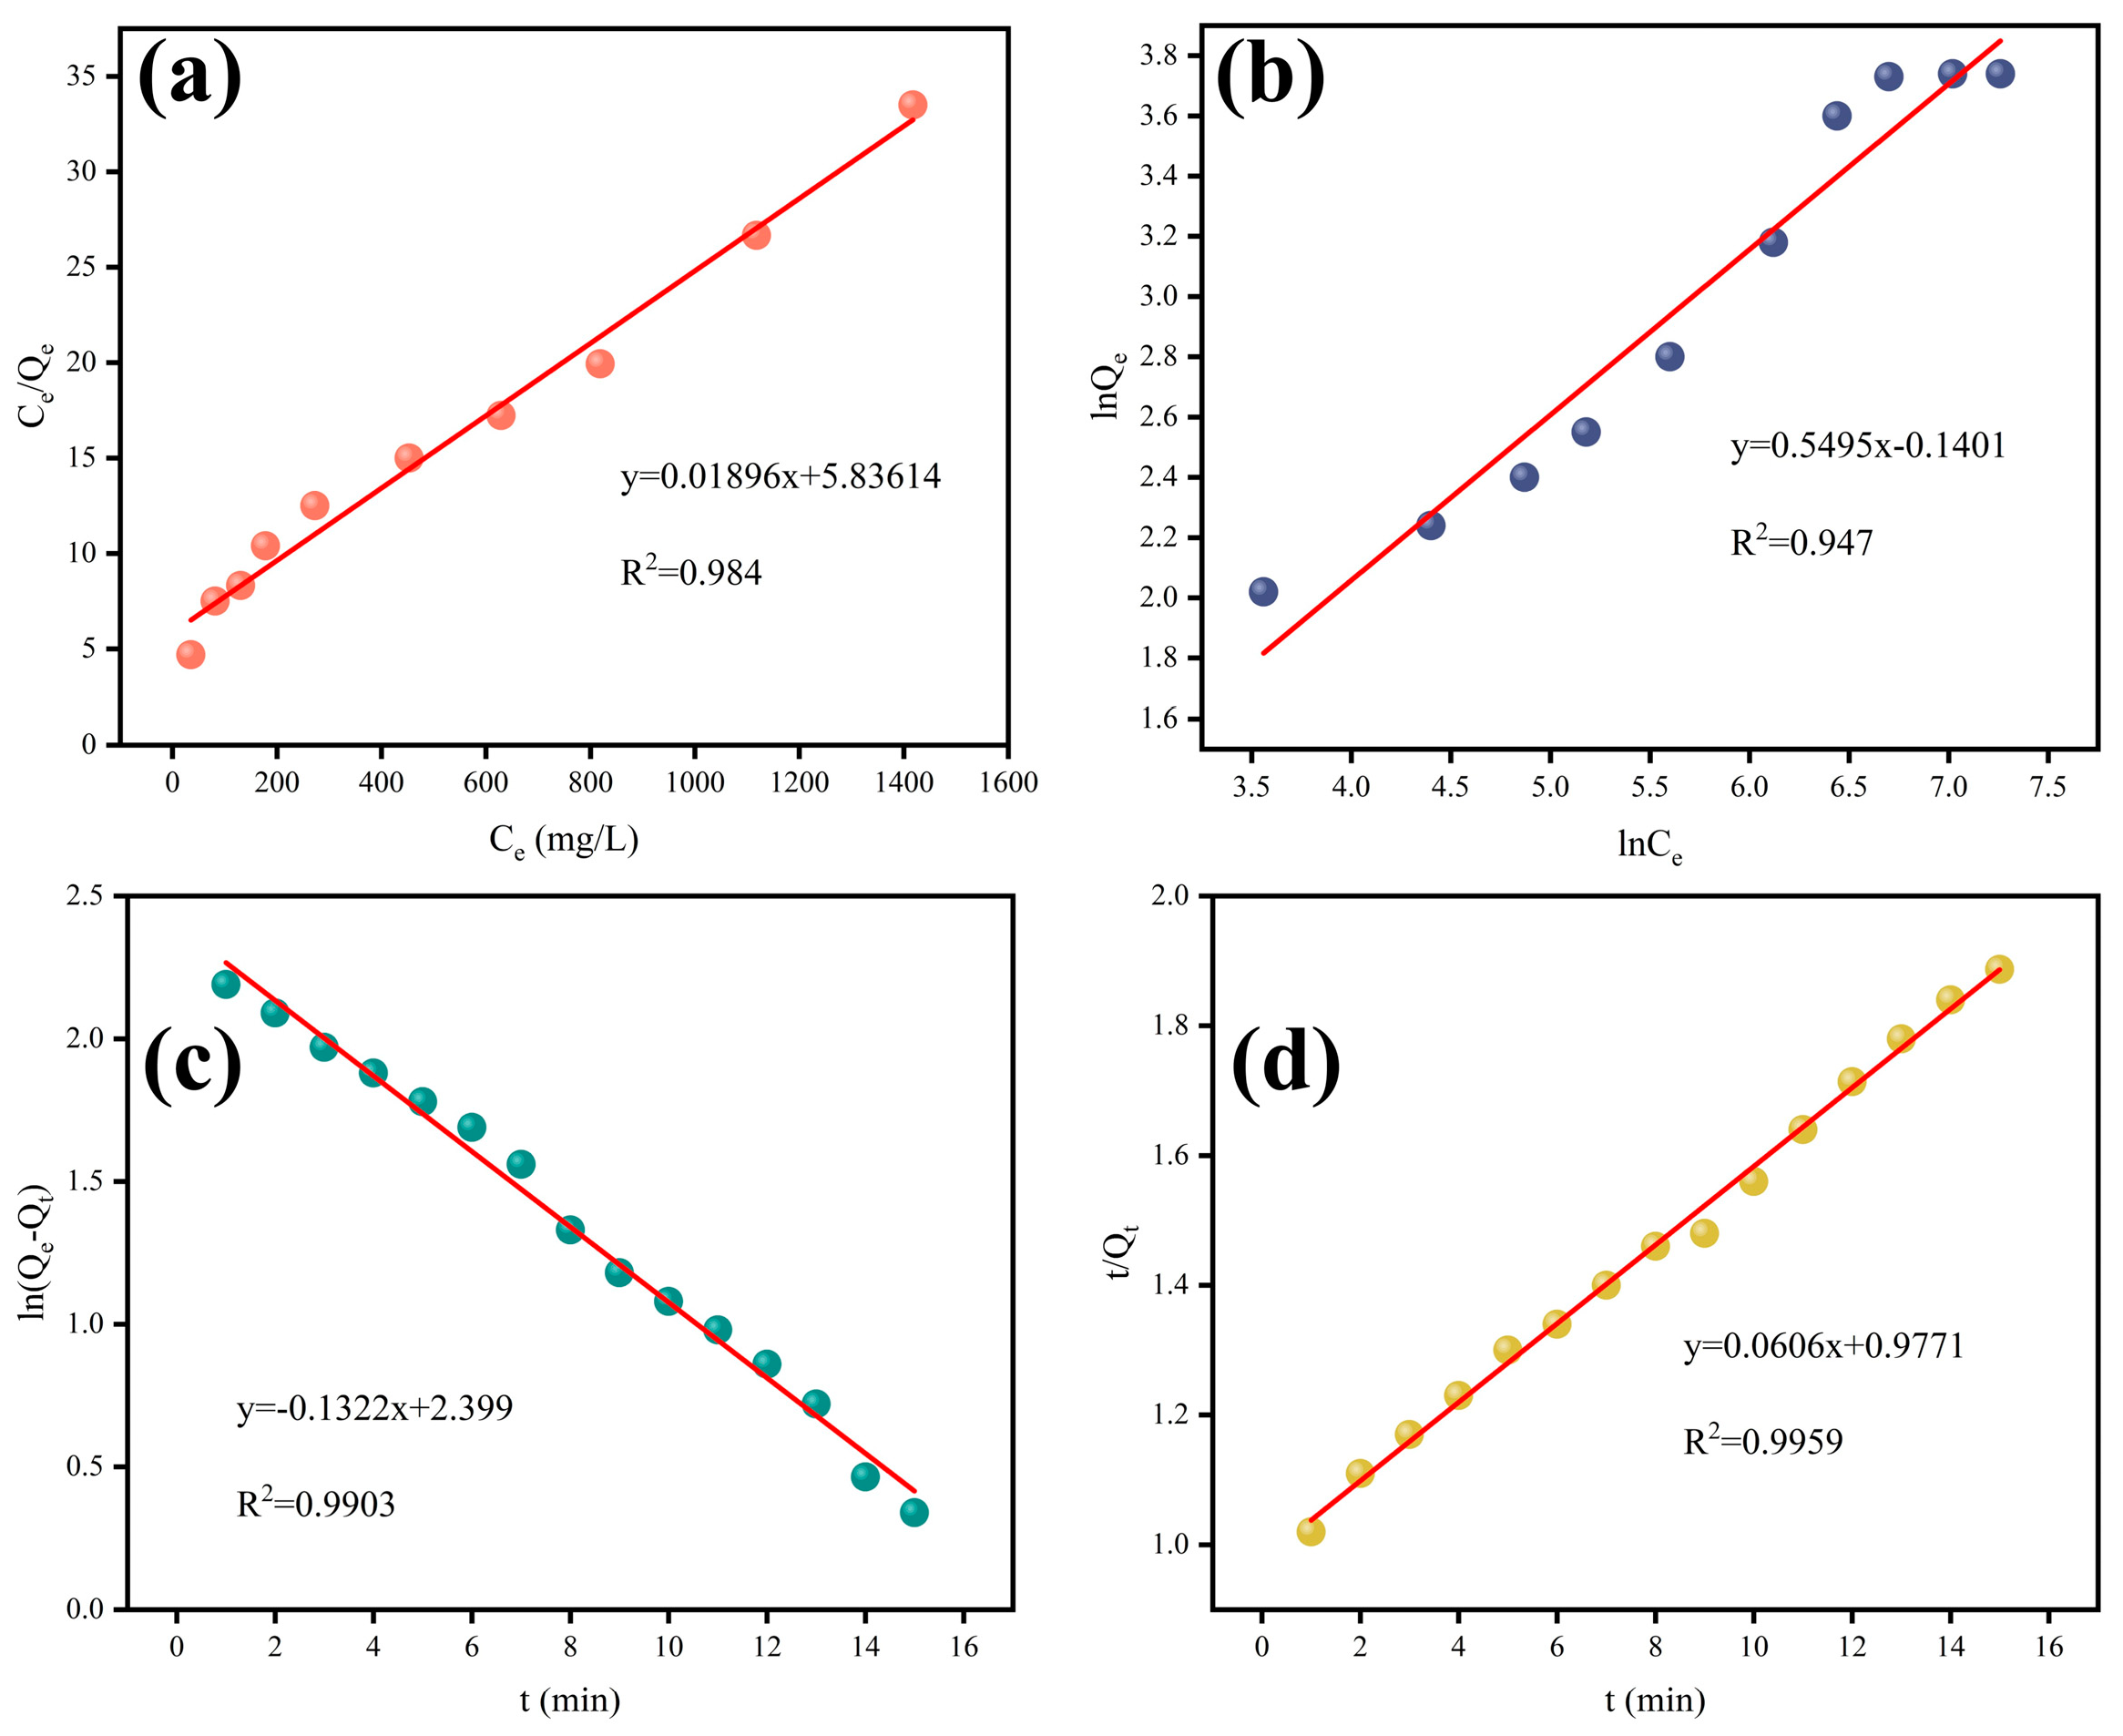
3.6. Electrosorption Isotherm and Kinetic Studies

The adsorption behavior of SO42− on the electrode material was analyzed using adsorption isotherms and adsorption kinetic models, and the results are shown in Figure 13a–d and Table 3. The isotherm and kinetic equations are shown below.
Langmuir model:
C e Q e = C e Q m + 1 Q m K L
Freundlich model:
ln Q e = ln K F + + 1 n ln C e
where Qe (mg/g) and Ce (mg/L) are the electrosorption capacity and the equilibrium concentration, respectively; Qm (mg/g) is the maximum electrosorption capacity; KL (mg/g) is the Langmuir constant; KF (mg1−n·g−1·L−n) is the Freundlich constant; and n is an inhomogeneous factor.
Pseudo first-order equation:
ln Q e Q t = ln Q e K 1 t
Pseudo second-order equation:
t Q t = 1 K 2 × Q e 2 + t Q e
where Qt (mg/g) is the electrosorption capacity at time t; K1 (min−1) and K2 (g/mg/min) are the rate constants for the pseudo first-order and second-order models, respectively.
From the analysis of Figure 13a,b, it can be seen that the Langmuir adsorption isothermal equation fits the linear relationship better, and the correlation coefficient R2 is 0.984. It indicates that the adsorption process is monolayer adsorption, the surface of the adsorbate is relatively uniform, and the theoretical maximum electroadsorption capacity of CeO2(5)-AC is 52.74 mg/g. The adsorption kinetic model is fitted by the quasi-first-order and quasi-second-order linear fitting of Figure 13c,d, and whether it conforms to the adsorption kinetic model according to the fitting correlation coefficient R2 can be seen in Table 3. The quasi-first-order adsorption rate constant K1 was 0.1322, the quasi-second-order adsorption rate constant K2 was 0.0037, and the saturated adsorption capacity Qe was 16.5 mg/g. At the same time, the quasi-primary and quasi-secondary kinetics had good fitting results, indicating that the adsorption of sulfate in solution by the CeO2(5)-AC electrode was not only physisorption but also chemisorption.

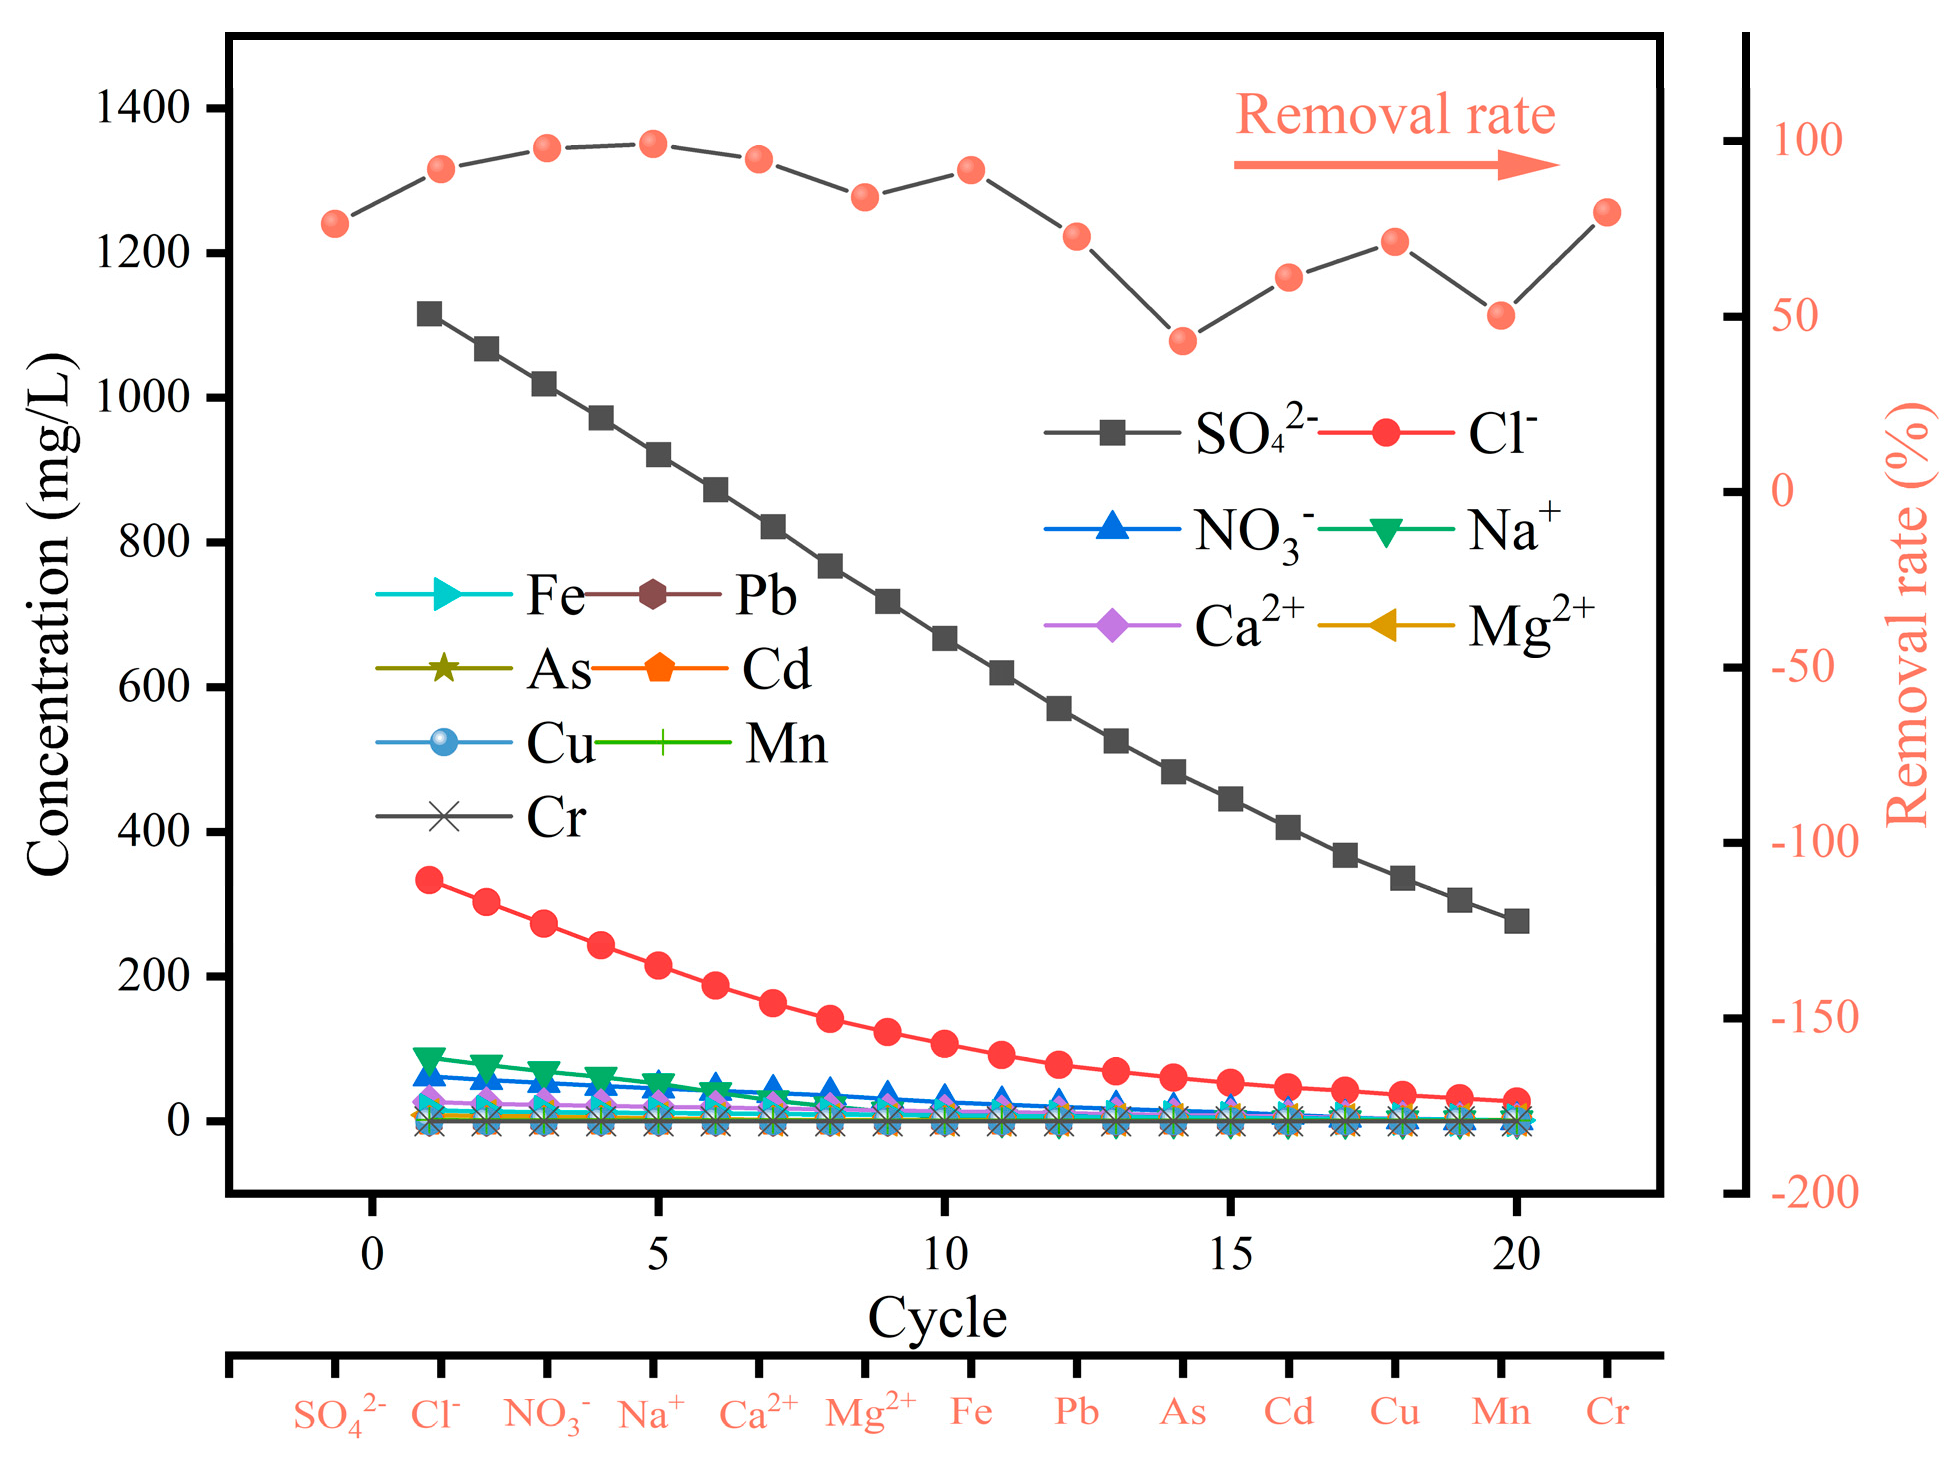
3.7. Mine Water Test

This test is mainly to explore the effect of the CDI device on treating actual mine water. The conditions are CeO2(5)-AC electrode, voltage of 1.4 V, and flow rate of 30 mL/min. The results are shown in Figure 14.
As shown in Figure 13, after 20 cycles, the concentration of SO42− in effluent water decreased from 1170 mg/L to 276.46 mg/L, and the removal rate was 76.37%. The adsorption capacity of SO42− in actual mine water by the CeO2(5)-AC electrode is lower than that in the Na2SO4 solution. The reason is that the mine water not only contains SO42− but also contains other salt ions and heavy metals, which form competitive adsorption with SO42−. After CDI treatment, the NO3 concentration decreased from 67 mg/L to 1.34 mg/L, and the removal rate was 98%. The concentration of Cl decreased from 342 mg/L to 27.36 mg/L, with a removal rate of 92%. In addition, after CDI treatment, the concentrations of heavy metals in mine water also decreased, and the removal rates of the heavy metals Fe, Pb, As, Cd, Cu, Mn, and Cr were 72.8%, 43%, 63.12%, 71.26%, 50.25%, and 79.62%, respectively. The test results show that the CeO2 activated carbon electrode capacitance method can effectively remove sulfate and co-existing ions from mine water.

4. Conclusions

In this study, a green and efficient CeO2 activated carbon electrode was prepared by the sol-gel method as a capacitive deionization electrode material for SO42− removal from mine water. After optimizing the CeO2 doping ratio and operating parameters, the CeO2(5)-AC electrode exhibited a maximum SAC of 9.36 mg/g at 1 V and 20 mL/min, which is much higher than AC (4.1 mg/g). CeO2(5)-AC had typical electric double-layer behavior and great electrochemical performance. In addition, CeO2 doping increased the hydrophilicity, specific capacitance, and electrical conductivity of AC. Meanwhile, the reasonable pore structure improved the surface utilization of the CeO2(5)-AC and was conducive to ion diffusion. The charge transfer efficiency and diffusion of AC were also enhanced. In addition, the CeO2(5)-AC electrode had good cycling performance, maintaining a SAC retention rate of 91% after 20 sorption–desorption cycles. In the optimized CDI system, CeO2(5)-AC electrodes showed excellent removal of SO42− in mine wastewater containing a variety of hetero ions. The concentration of SO42− in the mine water decreased from 1170 mg/L to 276.46 mg/L and the removal rate was 76.37% after 20 cycles. This result demonstrated that CeO2-doped AC is an efficient capacitive deionization electrode material for the treatment of mining wastewater. However, current research is still in the laboratory stage, and in order to enable the material to be applied industrially, future research should consider the desalination effect of large-size electrodes and the long-term cycling stability of the electrode material in order for it to be suitable for higher concentrations. In addition, actual mine water often contains other ions and heavy metals that can affect the removal of sulfate, which may be selectively removed by some method in the future.

Author Contributions

Conceptualization, X.F.; methodology, X.F., Y.Z., S.M.C., X.W., and C.D.; validation, Y.Z.; formal analysis, Y.Z.; investigation, X.F., Y.Z., S.M.C., X.W., and C.D.; resources, X.F.; data curation, X.F. and Y.Z.; writing—original draft, Y.Z. and S.M.C.; writing—review and editing, X.F. and S.M.C.; visualization, Y.Z.; supervision, X.F.; project administration, X.F. and C.D.; funding acquisition, X.F. All authors have read and agreed to the published version of the manuscript.

Funding

This research was funded by the National Key R&D Program of China, grant number 2021YFC2902100.

Data Availability Statement

The data that support the findings of this study are available from the corresponding author, upon reasonable request.

Conflicts of Interest

The authors declare no conflict of interest.

References

  1. Oncel, M.S.; Muhcu, A.; Demirbas, E.; Kobya, M. A comparative study of chemical precipitation and electrocoagulation for treatment of coal acid drainage wastewater. J. Environ. Chem. Eng. 2013, 1, 989–995. [Google Scholar] [CrossRef]
  2. Zuo, K.C.; Kim, J.; Jain, A.; Wang, T.X.; Verduzco, R.; Long, M.C.; Li, Q.L. Novel Composite Electrodes for Selective Removal of Sulfate by the Capacitive Deionization Process. Environ. Sci. Technol. 2018, 52, 9486–9494. [Google Scholar] [CrossRef]
  3. Zhao, F.; Rahunen, N.; Varcoe, J.R.; Chandra, A.; Avignone-Rossa, C.; Thumser, A.E.; Slade, R.C.T. Activated carbon cloth as anode for sulfate removal in a microbial fuel cell. Environ. Sci. Technol. 2008, 42, 4971–4976. [Google Scholar] [CrossRef]
  4. Chen, Y.; Wen, Y.; Zhou, Q.; Huang, J.; Vymazal, J.; Kuschk, P. Sulfate removal and sulfur transformation in constructed wetlands: The roles of filling material and plant biomass. Water Res. 2016, 102, 572–581. [Google Scholar] [CrossRef] [PubMed]
  5. Guimarães, D.; Leão, V.A. Batch and fixed-bed assessment of sulphate removal by the weak base ion exchange resin Amberlyst A21. J. Hazard. Mater. 2014, 280, 209–215. [Google Scholar] [CrossRef] [PubMed]
  6. Cravotta Iii, C.A.; Trahan, M.K. Limestone drains to increase pH and remove dissolved metals from acidic mine drainage. Appl. Geochem. 1999, 14, 581–606. [Google Scholar] [CrossRef]
  7. Tang, W.W.; He, D.; Zhang, C.Y.; Waite, T.D. Optimization of sulfate removal from brackish water by membrane capacitive deionization (MCDI). Water Res. 2017, 121, 302–310. [Google Scholar] [CrossRef] [PubMed]
  8. Nurmesniemi, E.T.; Hu, T.; Rajaniemi, K.; Lassi, U. Sulphate removal from mine water by precipitation as ettringite by newly developed electrochemical aluminium dosing method. Desalination Water Treat. 2021, 217, 195–202. [Google Scholar] [CrossRef]
  9. Zhu, M.; Yin, X.; Chen, W.; Yi, Z.; Tian, H. Removal of sulphate from mine waters by electrocoagulation/rice straw activated carbon adsorption coupling in a batch system: Optimization of process via response surface methodology. J. Water Reuse Desalination 2019, 9, 163–172. [Google Scholar] [CrossRef]
  10. Oladunni, J.; Zain, J.H.; Hai, A.; Banat, F.; Bharath, G.; Alhseinat, E. A comprehensive review on recently developed carbon based nanocomposites for capacitive deionization: From theory to practice. Sep. Purif. Technol. 2018, 207, 291–320. [Google Scholar] [CrossRef]
  11. Chu, M.; Tian, W.; Zhao, J.; Zhang, D.; Zou, M.; Lu, Z.; Jiang, J. Dual-activated biochar with a multichannel structure enhanced electrosorption capacity of capacitive deionization for sulfate removal from mining wastewater. Desalination 2023, 556, 116588. [Google Scholar] [CrossRef]
  12. Porada, S.; Zhao, R.; van der Wal, A.; Presser, V.; Biesheuvel, P.M. Review on the science and technology of water desalination by capacitive deionization. Prog. Mater. Sci. 2013, 58, 1388–1442. [Google Scholar] [CrossRef]
  13. Tang, W.W.; Kovalsky, P.; Cao, B.C.; He, D.; Waite, T.D. Fluoride Removal from Brackish Groundwaters by Constant Current Capacitive Deionization (CDI). Environ. Sci. Technol. 2016, 50, 10570–10579. [Google Scholar] [CrossRef]
  14. Oren, Y. Capacitive deionization (CDI) for desalination and water treatment—Past, present and future (a review). Desalination 2008, 228, 10–29. [Google Scholar] [CrossRef]
  15. Porada, S.; Bryjak, M.; van der Wal, A.; Biesheuvel, P.M. Effect of electrode thickness variation on operation of capacitive deionization. Electrochim. Acta 2012, 75, 148–156. [Google Scholar] [CrossRef]
  16. Chen, Z.L.; Zhang, H.T.; Wu, C.X.; Wang, Y.S.; Li, W. A study of electrosorption selectivity of anions by activated carbon electrodes in capacitive deionization. Desalination 2015, 369, 46–50. [Google Scholar] [CrossRef]
  17. Dai, K.; Shi, L.; Fang, J.; Zhang, D.; Yu, B. NaCl adsorption in multi-walled carbon nanotubes. Mater. Lett. 2005, 59, 1989–1992. [Google Scholar] [CrossRef]
  18. Zhu, G.; Wang, H.Y.; Zhang, L. A comparative study on electrosorption behavior of carbon nanotubes electrodes fabricated via different methods. Chem. Phys. Lett. 2016, 649, 15–18. [Google Scholar] [CrossRef]
  19. Farmer, J.C.; Fix, D.V.; Mack, G.V.; Pekala, R.W.; Poco, J.F. Capacitive deionization with carbon aerogel electrodes: Carbonate, sulfate, and phosphate. Int. SAMPE Tech. Conf. 1995, 27, 294–304. [Google Scholar]
  20. Kohli, D.K.; Bhartiya, S.; Singh, A.; Singh, R.; Singh, M.K.; Gupta, P.K. Capacitive deionization of ground water using carbon aerogel based electrodes. Desalination Water Treat. 2016, 57, 26871–26879. [Google Scholar] [CrossRef]
  21. Jung, C.H.; Lee, H.Y.; Moon, J.K.; Won, H.J.; Shul, Y.G. Electrosorption of uranium ions on activated carbon fibers. J. Radioanal. Nucl. Chem. 2011, 287, 833–839. [Google Scholar] [CrossRef]
  22. Liang, Q.; Hu, C.; Li, Y.; Cheng, G.; Liu, F. Removal of nitrate from drinking water by ACF electrosorption. Chin. J. Environ. Eng. 2016, 10, 3510–3514. [Google Scholar] [CrossRef]
  23. Li, H.B.; Lu, T.; Pan, L.K.; Zhang, Y.P.; Sun, Z. Electrosorption behavior of graphene in NaCl solutions. J. Mater. Chem. 2009, 19, 6773–6779. [Google Scholar] [CrossRef]
  24. Liu, P.Y.; Yan, T.T.; Shi, L.Y.; Park, H.S.; Chen, X.C.; Zhao, Z.G.; Zhang, D.S. Graphene-based materials for capacitive deionization. J. Mater. Chem. A 2017, 5, 13907–13943. [Google Scholar] [CrossRef]
  25. Cao, Z.; Hu, S.; Yu, J.; Wang, L.; Yang, Q.; Song, H.; Zhang, S. Enhanced capacitive deionization of toxic metal ions using nanoporous walnut shell-derived carbon. J. Environ. Chem. Eng. 2022, 10, 108245. [Google Scholar] [CrossRef]
  26. Foo, K.Y.; Hameed, B.H. A short review of activated carbon assisted electrosorption process: An overview, current stage and future prospects. J. Hazard. Mater. 2009, 170, 552–559. [Google Scholar] [CrossRef] [PubMed]
  27. Yasin, A.S.; Obaid, M.; Mohamed, I.M.A.; Yousef, A.; Barakat, N.A.M. ZrO2 nanofibers/activated carbon composite as a novel and effective electrode material for the enhancement of capacitive deionization performance. RSC Adv. 2017, 7, 4616–4626. [Google Scholar] [CrossRef]
  28. Dou, C.; Zhai, S.Y.; Liu, Y.Y.; Chen, P.; Yin, D.; Huang, G.T.; Zhang, L.H. Chemical modification of carbon particles to enhance the electrosorption of capacitive deionization process. J. Water Reuse Desalination 2020, 10, 57–69. [Google Scholar] [CrossRef]
  29. Zouli, N. Ceria-Incorporated Activated Carbon Composite as Electrode Material for Capacitive Deionization. Int. J. Electrochem. Sci. 2022, 17, 22042. [Google Scholar] [CrossRef]
  30. You, S.K.; Yang, J.J.; Ahn, S.; Park, S.G. Synthesis of a spherical carbon-TiO2 composite as electrode material for capacitive deionization. Int. J. Electrochem. Sci. 2019, 14, 4683–4692. [Google Scholar] [CrossRef]
  31. Ma, X.; Chen, Y.A.; Zhou, K.F.; Wu, P.C.; Hou, C.H. Enhanced desalination performance via mixed capacitive-Faradaic ion storage using RuO2-activated carbon composite electrodes. Electrochim. Acta 2019, 295, 769–777. [Google Scholar] [CrossRef]
  32. Fang, J.; Cao, Z.; Zhang, D.; Shen, X.; Ding, W.; Shi, L. Preparation and CO conversion activity of ceria nanotubes by carbon nanotubes templating method. J. Rare Earths 2008, 26, 153–157. [Google Scholar] [CrossRef]
  33. Li, Y.; Han, J.J.; Xie, B.R.; Li, Y.A.; Zhan, S.H.; Tian, Y. Synergistic degradation of antimicrobial agent ciprofloxacin in water by using 3D CeO2/RGO composite as cathode in electro-Fenton system. J. Electroanal. Chem. 2017, 784, 6–12. [Google Scholar] [CrossRef]
  34. Yousef, A.; Al-Enizi, A.M.; Mohamed, I.M.A.; El-Halwany, M.M.; Ubaidullah, M.; Brooks, R.M. Synthesis and characterization of CeO2/rGO nanoflakes as electrode material for capacitive deionization technology. Ceram. Int. 2020, 46, 15034–15043. [Google Scholar] [CrossRef]
  35. Adinaveen, T.; Vijaya, J.J.; Kennedy, L.J. Comparative Study of Electrical Conductivity on Activated Carbons Prepared from Various Cellulose Materials. Arab. J. Sci. Eng. 2016, 41, 55–65. [Google Scholar] [CrossRef]
  36. Wang, S.J.; Chen, D.Z.; Zhang, Z.X.; Hu, Y.; Quan, H.Y. Mesopore dominated capacitive deionization of N-doped hierarchically porous carbon for water purification. Sep. Purif. Technol. 2022, 290, 120912. [Google Scholar] [CrossRef]
  37. Chao, L.M.; Liu, Z.Y.; Zhang, G.X.; Song, X.N.; Lei, X.D.; Noyong, M.; Simon, U.; Chang, Z.; Sun, X.M. Enhancement of capacitive deionization capacity of hierarchical porous carbon. J. Mater. Chem. A 2015, 3, 12730–12737. [Google Scholar] [CrossRef]
  38. Song, X.; Fang, D.Z.; Huo, S.L.; Li, K.X. 3D-ordered honeycomb-like nitrogen-doped micro-mesoporous carbon for brackish water desalination using capacitive deionization. Environ. Sci.-Nano 2021, 8, 2191–2203. [Google Scholar] [CrossRef]
  39. Li, H.B.; Liang, S.; Li, J.; He, L.J. The capacitive deionization behaviour of a carbon nanotube and reduced graphene oxide composite. J. Mater. Chem. A 2013, 1, 6335–6341. [Google Scholar] [CrossRef]
  40. Hsieh, C.T.; Teng, H. Influence of oxygen treatment on electric double-layer capacitance of activated carbon fabrics. Carbon 2002, 40, 667–674. [Google Scholar] [CrossRef]
  41. Xu, Y.; Xiang, S.; Mao, H.; Zhou, H.; Wang, G.; Zhang, H.; Zhao, H. Pseudocapacitive desalination via valence engineering with spindle-like manganese oxide/carbon composites. Nano Res. 2021, 14, 4878–4884. [Google Scholar] [CrossRef]
  42. Zhang, C.Y.; He, D.; Ma, J.X.; Tang, W.W.; Waite, T.D. Faradaic reactions in capacitive deionization (CDI)—Problems and possibilities: A review. Water Res. 2018, 128, 314–330. [Google Scholar] [CrossRef] [PubMed]
  43. Wang, G.Z.; Yan, T.T.; Zhang, J.P.; Shi, L.Y.; Zhang, D.S. Trace-Fe-Enhanced Capacitive Deionization of Saline Water by Boosting Electron Transfer of Electro-Adsorption Sites. Environ. Sci. Technol. 2020, 54, 8411–8419. [Google Scholar] [CrossRef] [PubMed]
  44. Jande, Y.A.C.; Kim, W.S. Modeling the capacitive deionization batch mode operation for desalination. J. Ind. Eng. Chem. 2014, 20, 3356–3360. [Google Scholar] [CrossRef]
  45. Li, D.; Ning, X.A.; Yang, C.; Chen, X.; Wang, Y. Rich heteroatom doping magnetic carbon electrode for flow-capacitive deionization with enhanced salt removal ability. Desalination 2020, 482, 114374. [Google Scholar] [CrossRef]
  46. Wang, T.Y.; Zhang, C.Y.; Bai, L.M.; Xie, B.H.; Gan, Z.D.; Xing, J.J.; Li, G.B.; Liang, H. Scaling behavior of iron in capacitive deionization (CDI) system. Water Res. 2020, 171, 115370. [Google Scholar] [CrossRef]
Figure 1. Schematic diagram of electrode preparation.
Water 16 00675 g001
Figure 2. Schematic diagram and actual picture of the test device.
Water 16 00675 g002
Figure 3. (a) AC, (b) CeO2(5)-AC and (c) SEM image of CeO2(10)-AC.
Water 16 00675 g003
Figure 4. Mapping of CeO2(5)-AC.
Water 16 00675 g004
Figure 5. XRD patterns of AC, CeO2(5)-AC, and CeO2(10)-AC.
Water 16 00675 g005
Figure 6. The pore size distributions and N2 adsorption-desorption isotherms for AC, CeO2(5)-AC, and CeO2(10)-AC (illustration).
Water 16 00675 g006
Figure 7. Contact angles of electrode materials with different CeO2 activation mass ratios.
Water 16 00675 g007
Figure 8. (a) CV curves of AC, CeO2(5)-AC and CeO2(10)-AC electrodes at a 5 mV/s scanning rate. (b) CV curves of the CeO2(5)-AC electrode at different scanning rates (5 mV/s, 10 mV/s, 30 mV/s, 50 mV/s, 100 mV/s, and 200 mV/s). (c) The specific capacitance curves of AC, CeO2(5)-AC and CeO2(10)-AC electrodes at different scanning rates.
Water 16 00675 g008
Figure 9. Nyquist diagram of AC, CeO2(5)-AC, and CeO2(10)-AC.
Water 16 00675 g009
Figure 10. Changes in the electro-adsorption capacity of different electrodes in the electro-adsorption process.
Water 16 00675 g010
Figure 11. Effects of (a) different voltages, (b) different flow rates, and (c) different SO42− concentrations on the CDI performance of electrodes.
Water 16 00675 g011
Figure 12. SAC changes and SAC retention rate during 10 sorption–desorption cycles of the CeO2(5)-AC electrode(Purple indicates SAC, and pink indicates SAC retention).
Water 16 00675 g012
Figure 13. The Langmuir isotherm model (a), the Freundlich isotherm model (b), pseudo first-order kinetics (c), and pseudo second-order kinetics (d) of SO42− on CeO2(5)-AC electrodes.
Water 16 00675 g013
Figure 14. Changes and removal rates of salt ions and heavy metals in 20 cycles of mine water treated by CDI.
Water 16 00675 g014
Table 1. Physicochemical properties of mine water.
Salt ions and heavy metalsSO42−ClNO3−Na+Ca2+Mg2+FePbAsCdCrCuMn
Concentration
(mg/L)
11703426710227.1310.5416.470.140.05120.01260.0160.0241.93
Table 2. Pore characteristics of AC, CeO2(5)-AC and CeO2(10)-AC.
SamplesSBET (m2 g−1)Smicro (m2 g−1)Smeso (m2 g−1)Vtot (m3 g−1)Vmicro (m3 g−1)Vmeso (m3 g−1)Vmeso/Vtot (%)Mean Pore Diameter (nm)
AC997.94632.16365.780.6060.3040.30249.84.043
CeO2(5)-AC898.11510.24387.870.5470.2110.33661.44.098
CeO2(10)-AC813.71479.43334.280.4940.2070.28758.14.094
Table 3. Isotherm model and kinetic parameters for SO42− electrosorption by the CeO2(5)-AC materials.
LangmuirFreundlich
KLQmR2nKFR2
0.003252.740.9841.820.8690.947
Pseudo first-orderPseudo second-order
K1QeR2K2QeR2
0.132211.010.99030.003716.50.9959
Disclaimer/Publisher’s Note: The statements, opinions and data contained in all publications are solely those of the individual author(s) and contributor(s) and not of MDPI and/or the editor(s). MDPI and/or the editor(s) disclaim responsibility for any injury to people or property resulting from any ideas, methods, instructions or products referred to in the content.

