Article

Effect of Freeze–Thaw Cycles on Microstructure and Hydraulic Characteristics of Claystone: A Case Study of Slope Stability from Open-Pit Mines in Wet Regions

1
Guangzhou Urban Planning & Design Survey Research Institute Co., Ltd., Guangzhou 510060, China
2
Guangzhou Collaborative Innovation Center of Natural Resources Planning and Marine Technology, Guangzhou 510060, China
3
Guangdong Enterprise Key Laboratory for Urban Sensing, Monitoring and Early Warning, Guangzhou 510060, China
4
School of Hydraulic and Electric Power, Heilongjiang University, Harbin 150080, China
*
Author to whom correspondence should be addressed.
Water 2024, 16(5), 640; https://doi.org/10.3390/w16050640
Submission received: 13 December 2023 / Revised: 25 January 2024 / Accepted: 10 February 2024 / Published: 22 February 2024

Abstract

:
The action of freeze–thaw (F–T) cycles of claystone exerts a profound impact on the slope stability of open-pit mines in water-rich regions. Microstructural changes are observed as a crucial factor in determining the hydraulic characteristics and mechanical behaviors of claystone. The present work integrates a micro-X-ray computed tomography (Micro-CT) scanner, equipped with image processing and three-dimensional (3D) reconstruction capabilities, employed to observe the microstructure of claystone under varying numbers of F–T cycles (0, 10, 20, 30, and 50). Furthermore, seepage numerical simulations based on Micro-CT measurements are conducted to evaluate the hydraulic characteristics. Through meticulous microscopic observation and mechanical analysis, the damage mechanism induced by F–T cycles is revealed and the evolutionary characteristics are analyzed. The two-dimensional (2D) images of 3D reconstructed models unveil the gradual initiation propagation and coalescence of an intricate fissuring network in claystone during the F–T cycles. As the number of F–T cycles increases from 0 to 50, the 3D porosity exhibits exponential growth. Additionally, the influence of F–T cycles substantially enhances the connectivity of fissures. The seepage numerical simulations demonstrate that the evolutionary progression of fissures substantially augments the number of flow paths and enhances permeability. The increase in permeability follows an exponential trend, reflecting the distribution and evolution of fissures under F–T cycles. The impact on permeability arises from a combination of micromechanical properties and the microstructure of claystones. The present research tries to elucidate the microscopic evolution of fissures and their corresponding hydraulic properties in water-saturated claystone, offering significant insights for investigating the slope stability of open-pit mines in regions.

1. Introduction

In water-rich regions subject to seasonal freezing, the freeze–thaw (F–T) cycle induced by temperature fluctuations gives rise to various engineering disasters, such as frost heave of pavement, cracking of rocks surrounding tunnels, and slope instability of open-pit mines [1,2]. The northeast regions of China experience pronounced atmospheric temperature changes during the winter–spring transition, causing the geomaterials in slopes to undergo multiple F–T cycles [3]. The phase change of water during F–T results in the transportation of pore fluid, causing periodic shifts in the moisture state in rocks and soils, posing a significant challenge to the construction and maintenance of open-pit mining engineering projects [4,5]. Hence, investigating the impact of F–T cycles on the physical and mechanical characteristics of rocks is essential for practical applications in open-pit mining engineering.
Claystone refers to a fine-grained clastic sedimentary rock resulting from the transformation of weakly consolidated clay under moderate geologic influences, such as dehydration, recrystallization, and cementation [6,7]. The content of clay grains in claystone is usually greater than 50%, and the particle size is below the range of 0.005~0.0039 mm. The minerals of claystone mainly consist of kaolinite, montmorillonite, hydromica, and chlorite [8]. Characterized by a complex formation process, high contents of clay minerals, and susceptibility to environmental changes, claystone is categorized as a typical discontinuous medium with primary fissures, joints, faults, and other structurally weak surfaces [9]. Groundwater is an inevitable factor in mining engineering, and the impact of water erosion on claystone can progressively compromise support structures [10]. This issue is particularly prevalent in high-steep slopes, presenting serious risks to the safety and maintenance of open-pit mines [11]. The weak bonding strength and intrinsic microfissures in claystone contribute to its deterioration, manifesting as collapse, expansion, and seepage upon exposure to water transitioning from liquid to solid phases [12]. The coupled effect of unsaturated flows in claystone has significant influence on the strength and stability of slope engineering, especially in water-rich regions.
The alteration of structural surfaces significantly impacts the microstructural properties of rock, influencing the formation and extension of newborn fissures. Weakly consolidated rocks, such as mudstone, claystone, and expansive softrock, in water-rich regions, are susceptible to structural degradation due to F–T cycles in seasonally frozen environments. Extensive experimental studies, which include unconfined compressive tests [13], triaxial shear tests [14], Brazilian tensile tests [15], point loading tests [16], and split Hopkinson pressure bar tests [17] on weakly consolidated rocks, have consistently demonstrated a noteworthy decline in its mechanical properties with an increasing number of F–T cycles. Hong et al. (2021) proposed a predictive model for uniaxial compressive strength of expansive soft rock that integrates F–T cycles, based on the elastic-plastic theory, and fatigue damage mechanics [18]. Adopting a statistical damage mechanics perspective, Zeng et al. (2019) introduced a piecewise constitutive model to predict stress–strain curve characteristics under uniaxial compression of mudstone after multiple F–T treatments [19]. Hou et al. (2022) observed an increase in cracking connectivity with an escalation in the number of F–T cycles, causing a weakened strength of anhydrite rock through crack propagation analysis [20]. In triaxial shear experiments, Fan et al. (2020) concluded that cyclic F–T action on weakly bonding rocks essentially expands existing micro-defects and connects secondary fissures driven by the pressure of frost heave [21]. However, the above publications mainly concern the macroscopic characteristics of claystone under F–T cycles, and the microstructure of water-saturated rocks in seasonal frozen areas is subjected to complex environmental disturbances. To reveal the deterioration mechanism, it is imperative to explore the structural changes of pores and fissures in rocks under the action of F–T cycles.
The presence of primary defects alters the pathways of water infiltration and diminishes the permeability resistance of rock, thereby increasing the risk of slope instability. With extreme climatic changes, the occurrence of geologic hazards in open-pit mining engineering is expected to intensify due to F–T cycles [22]. Consequently, studies of cracking behavior in rocks have garnered widespread interests across various fields, including engineering geology, geotechnical engineering, edaphology, and hydrogeology [23]. Previous literature reviews indicate that the deterioration of rocks resulting from multiple F–T cycles has been analyzed using theoretical and experimental methods, with a focus on granite, sandstone, limestone, and mudstone [24,25,26]. Nevertheless, few microscopic experiments have been performed on the weakening mechanisms and microstructure of claystone. Micron-sized X-ray computed tomography (Micro-CT), as a novel non-destructive technique, offers novel opportunities for reconstructing the microstructure of rocks and soils [27]. Micro-CT measurement provides high-spatial-resolution and complete 3D data, enabling accurate extraction and quantitative characterization of pore distributions in rocks [28]. Therefore, the quantitative characterization of the emergence and evaluation of propagating fissures in claystone during F–T cycles offers an important reference for investigating the disaster mechanism of engineering performance.
This manuscript explores the evolutionary characteristics of fissures in claystone and their correlation with hydraulic properties under the action of F–T cycles. First, the Micro-CT technique is employed to examine the initial microstructure of water-saturated claystone. Subsequently, claystone specimens undergo 10 to 50 F–T cycles within a wide temperature range of −20 °C to +20 °C. Micro-CT measurements are conducted at intervals of 10, 20, 30, and 50 F–T cycles, capturing the 2D grayscale images and reconstructing 3D fissure models. This enables both the qualitative and quantitative study of microstructural variations. Eventually, numerical simulations for seepage and permeability tests are employed to evaluate the hydraulic characteristics of claystone. This research enhances our understanding of the microstructure and engineering characteristics of claystone in water-rich and seasonally frozen regions.

2. Materials and Methods

2.1. Claystone

The experimental claystone material is derived from a slope in an open-pit mine located in Hegang, Heilongjiang Provence, China. The sampling site, situated in a seasonally frozen region, features a complex topography and abundant groundwater resources. Natural claystone samples are collected automatically using a medium-sized core drill. Based on basic ASTM standards, physical, strength, and mineralogical tests are conducted to characterize the physical properties of the material, with detailed results provided in Table 1. The X-ray diffraction test, following ASTM D4926-15(2015) [29], indicates that the claystone consists of non-clay minerals including quartz (32.8%), feldspar (13.5%), and mica (8.4%), and clay minerals including montmorillonite (12.9%) and kaolinite (24.4%). Figure 1 presents the typical geological profiles of the sampling site obtained from four boreholes. The top layer comprises colluvial claystone with a thickness within 7.0 m. Beneath it lies a layer of weathered earth, ranging in thickness from 7.5 to 9.0 m. Further below is a layer of dark grey saprocollite with a thickness of approximately 20.0 m. Notably, claystone exhibits similar physical and mechanical properties at different depths, characterized by a dark gray appearance and high clay content. The water table is around 3.5 m below the ground level, and the collected samples are in a water-saturated state.

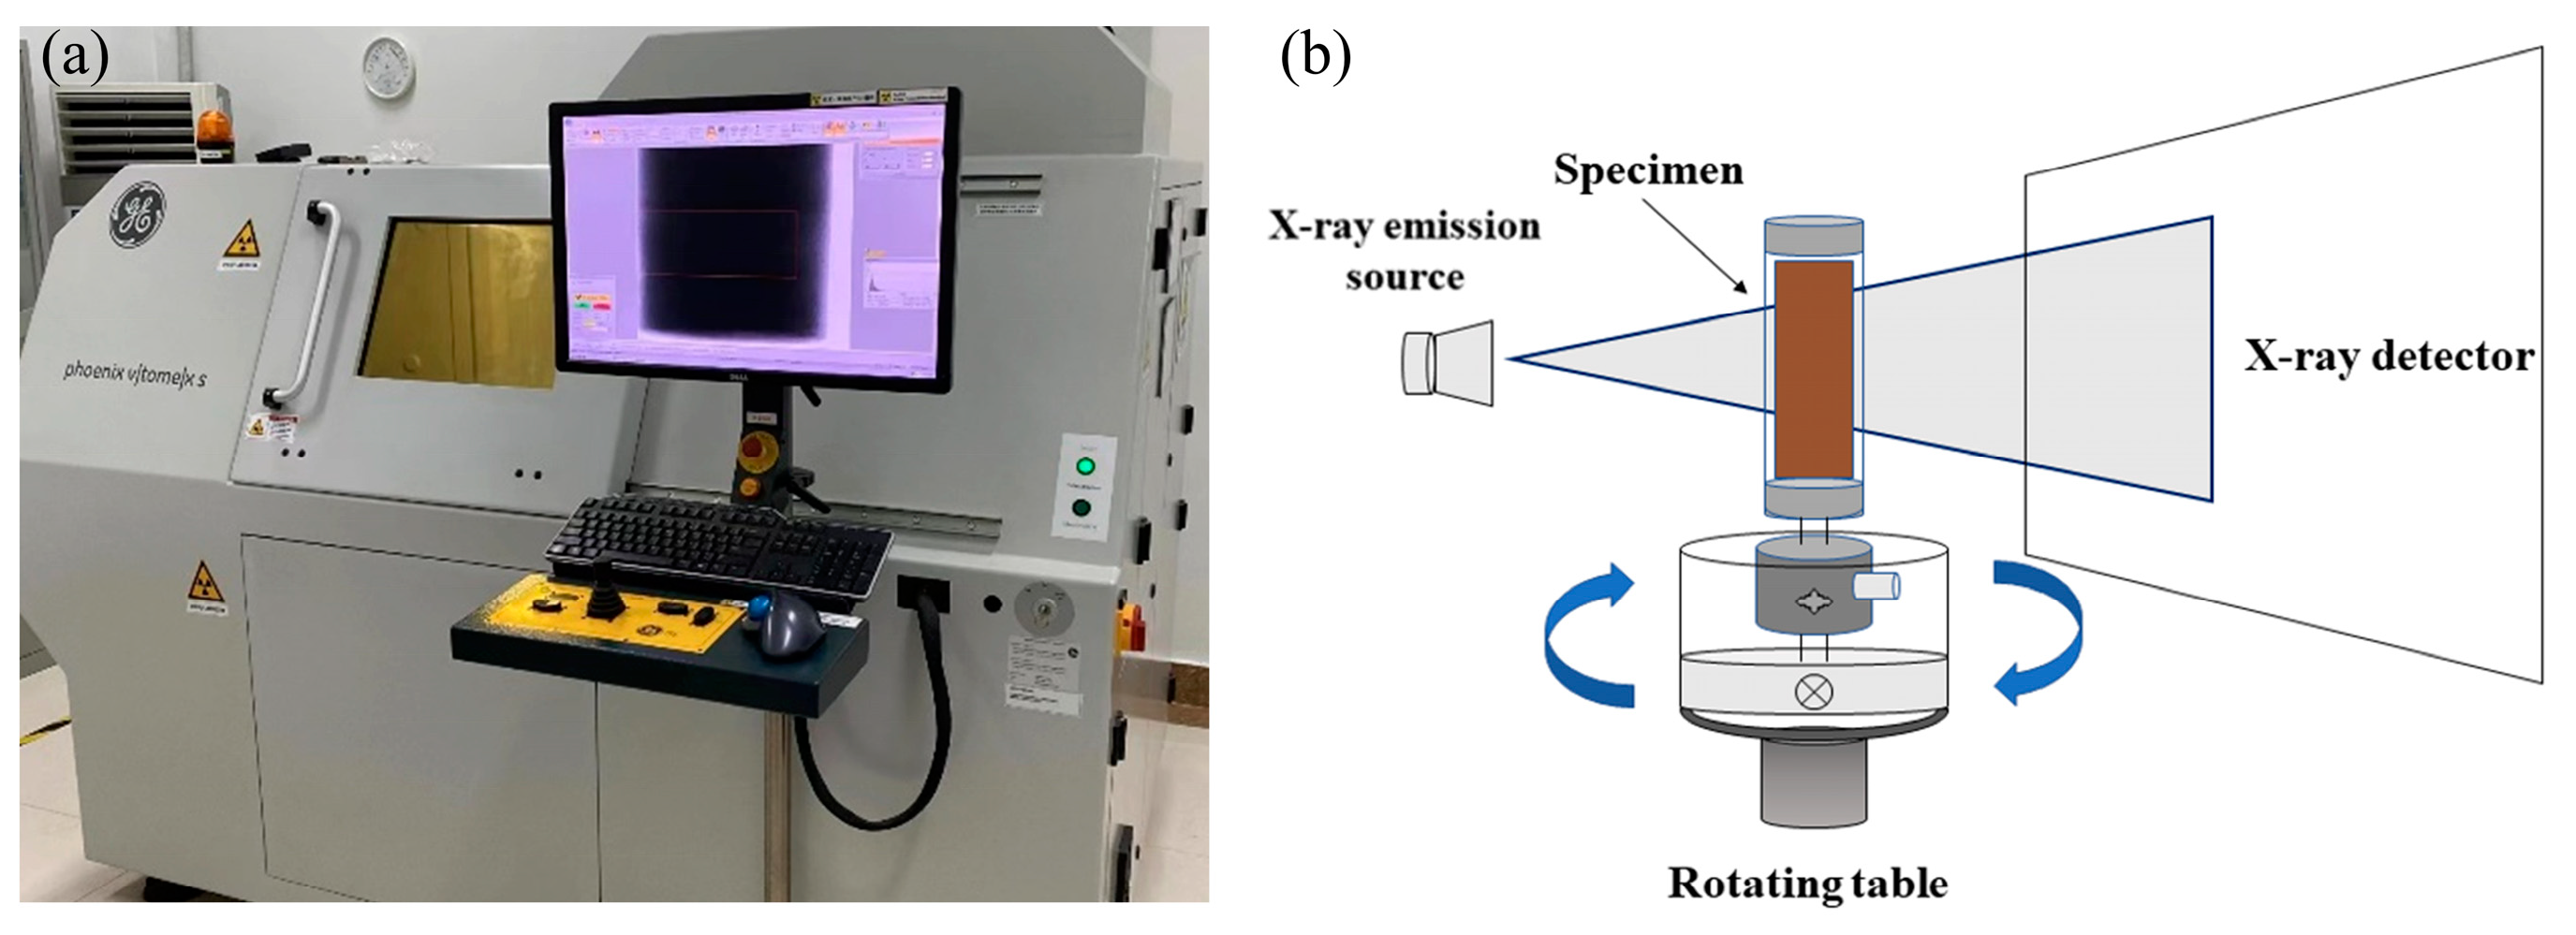
2.2. Experimental Apparatus and Testing Method

To assess the influence of F–T cycles on claystone, freezing and thawing procedures are conducted on the standard specimens of 50 × 100 mm (diameter × height). In this experiment, a selected sample is investigated during the freeze–thaw cycles. Before the F–T cycles, the claystone specimens are fully water-saturated in a vacuum saturator at room temperature. Firstly, the specimens are wrapped in plastic wrap and then frozen in a temperature- and humidity-controlled container at −20 °C for 24 h. Subsequently, a temperature controller facilitates the thawing of the frozen specimens at 20 °C for 48 h to achieve equilibration. In this research, claystone specimens under different numbers of F–T cycles (0, 10, 20, 30, and 50 times) are selected for Micro-CT scans using a Micro-CT scanner (phoenix v|tome|x s) produced by Waygate Technologies Co., LTD in Huerth, Germany to examine their microstructural features. The maximum detection diameter and length of the device are 500 mm and 740 mm, respectively, the scanning accuracy is 0.1 μm, and the highest ray energy is 10 kV. In this study, the resolution of the images obtained by micro-CT scanning is 20 μm. As depicted in Figure 2, the scanner emits X-rays to penetrate the specimens on a rotating table, then detected by an X-ray sensor. After scanning, grayscale images with high resolution for each specimen are captured and processed by a computer.

3. Results

3.1. Two-Dimensional Distribution of Fissures

The Micro-CT scanning device was employed to characterize the internal meso-structure of claystone. Leveraging the correlation between the X-ray intensity and the density of different components, materials with varying densities in the specimen are segmented into different regions in the greyscale images. Utilizing a binary image segmentation technique, mesoscopic defects including pores and fissures in claystone are extracted and displayed for subsequent quantitative analysis. The binary image segmentation technique aims to mark the air voids and background in the grayscale images with two opposite colors. The OTSU algorithm, which is widely considered as an effective approach for threshold selection, is used in this study. The pores and fissures in the claystone are preliminarily discriminated, which provides a basis for the extraction and analysis of quantization feature. Representative images of specimens at various F–T cycles are extracted for comparison, as depicted in Figure 3. The number and size of interconnecting fissures running lengthwise in the 2D images exhibit a significant increase with an escalating number of F–T cycles. The micro-defects in claystone manifest as small pores at the undisturbed state when the number of F–T cycles is 0 and 10. As the number of F–T cycles increases to 30, mesoscopic fissures gradually propagate and converge due to frost and thaw damage, forming several irregular and oblique pathways. By the time the number of F–T cycles reaches 50, major fissures propagate inward from the specimen’s edge, enhancing the material’s heterogeneity.
The random distribution of mesoscopic defects experienced by claystone is attributed to inherent anisotropy of the rock microstructure. To illustrate the distribution nonuniformity of the pores and fissures in claystone, their total area in a specific layer of the Micro-CT image is calculated by pixel counts. Subsequently, the area—porosity ρsi along the lengthways direction and the mean ratio of area—porosity ρsm of the specimen at different numbers of F–T cycles are determined using Equations (1) and (2), respectively.
ρ si = S fi S i × 100 %
ρ sm = 1 k i = 1 k S f i S i × 100 %
In the above expressions, i is the serial number of the slice, k represents the total number of scanned images, Sfi refers to the total area of fissures at the i-th slice of scanned images, and Si signifies the total area of the i-th slice of scanned images.
The distribution curves of area–porosity and the height of specimens under different numbers of F–T cycles are depicted in Figure 4. It is evident that with an increase in the number of F–T cycles, the area–porosity curve exhibits a rising trend, with the extent of fluctuation gradually increasing. The standard deviation, variance, average value, and median of the area–porosity of the specimen are calculated to quantitatively illustrate the distribution of fissures in the Micro-CT images, as detailed in Table 2. Pores and fissures extracted from the Micro-CT images alter greatly along with axial direction and demonstrate noticeable discreteness. The increase in the number of F–T cycles results in a rise in the variance of the area–porosity from 0.145 to 0.332 and standard deviation from 0.375 to 0.575. The data statistics indicate that the action of F–T cycles enhances the spatial complexity of pores and fissures inside the claystone, which becomes more apparent as the number of F–T cycles increases.

3.2. Three-Dimensional Distribution of Fissures

While high-quality 2D images can capture the internal structure of claystone at a specific height, they lack the depth and immersive display needed for a comprehensive understanding. Consequently, 3D reconstruction models are created to quantitatively analyze the fissures in the claystone subjected to F–T cycles. To refine subsequent analysis and processing, fissures with dynamically connected properties are meticulously isolated using the 3D connectivity algorithm in the image analysis platform [29]. The pores in claystone are divided into isolated pores and connected fissures according to the volumetric and geometric characteristics [28]. Specifically, the connected fissures have a volume greater than 0.1 mm3 and a length–width ratio greater than 3. Defects with a connecting relationship are designated as interconnected fissures, while the remaining defects are categorized as isolated pores. The 3D model illustrating the distribution of pores and fissures in the specimen is visually separated and displayed, as given in Figure 5. The digital models of isolated pores and interconnecting fissures, each with distinct volume sizes, are differentiated and displayed for enhanced clarity and identification.
Numerous studies have suggested that rocks function as porous mediums containing multiple defects, with the volume and connectivity of fissures calculable using data from 3D reconstructed models [30]. Building upon the earlier segmentation of the 3D model, the volumes of different types of fissures in the scanned sample are determined through voxel counting. Subsequently, the volume porosity ρ3d and the connectivity λ are calculated by Equations (3) and (4), respectively. In this research, ρ3d signifies the proportion of the volume occupied by total defects relative to the total volume of specimen, while λ denotes the proportion of interconnected fissures to the total volume of defects [31].
ρ 3 d = i m V i c f + i m V i i f V t o l
λ = i m V i c f i m v i c f + i m v i i f × 100 %
where V i c f denotes the pixel volume of interconnected fissures, V i i f stands for the pixel volume of isolated fissures, and Vtol refers to the total pixel volume of the entire sample.
The variations in volume porosity ρ3d and connectivity λ are presented in Figure 6. Regression analysis of the number of F–T cycles and porosity reveals that the ρ3d of claystone exhibits a nonlinear increasing trend as N increases, following a specific exponential function. This can be attributed to the initial stage of F–T cycles, where there are few fissures on the surface of the claystone, resulting in slow development of microstructure damage and a relatively gradual increase in porosity. As the number of F–T cycles continues, deep damage emerges in the interior of the specimen, increasing the number of fissures and enhancing the porosity of the claystone.
Furthermore, the degree of connectivity exhibits a linear increase within a limited range of the number of F–T cycles, as illustrated in Figure 7. The initial claystone suffers from few interconnected fissures, with defects primarily in the form of isolated fissures. The degree of connectivity for the initial claystone is 36.5%, which approaches 80% at 50 F–T cycles. This phenomenon indicates that the defect volume of the claystone is predominantly influenced by interconnected fissures. Consequently, the collective findings from imaging and quantitative analysis illustrate that the cracking in claystone was induced by the formation of ice lenses during freezing. This leads to an evolution from localized and isolated pores to interconnected fissures, ultimately resulting in major fissures throughout the specimen, thus significantly compromising its integrity. Therefore, F–T cycle exerts a substantial impact on the morphology and spatial distribution characteristics of fissures in claystone. Meanwhile, the 3D reconstruction model effectively reflects the dynamic evolution of pores and fissures visually and qualitatively.
Based on the computational outcomes from the 3D reconstruction model, the volume values for pores and fissures at different F–T cycles are subjected to statistical analysis, as demonstrated in Figure 8. As the number of F–T cycles increases, the volume of total and interconnected fissures experiences a significant increase, while the volume of isolated pores increases firstly and then decreases. When the number of F–T cycles increases from 0 to 50, the total volume porosity of pores and fissures expands from 1.97 mm3/g to 5.58 cm3/g, representing a remarkable 183.2% increase. Moreover, the change in the volume of interconnecting fissures surpasses that of isolated pores significantly, signaling a pivotal transformation in the microstructure of claystone under the action of F–T cycles. During the F–T cycles, isolated pores gradually expand, converge, and coalesce into an intricate network of fissures with larger volumes. Notably, the volume of isolated pores exhibits an initial increase followed by a subsequent decrease throughout the entire process of F–T cycles. This phenomenon can be attributed to the initiation of newly formed isolated pores and simultaneous merging of existing isolated pores, leading to the formation of connected fissures and consequent reduction in isolated pore count. Generally, the claystone specimen rarely generates interconnecting fissures of small size in the initial stage of F–T cycles (0~10 cycles). Particularly during the freezing phase, the increase in frost stress raises the tensile stress among grains. When the tensile stress exceeds the critical value, microscopic fissures expand. In subsequent F–T cycles (10~30 cycles), fissures continue to be affected by tensile stress, accelerating the extension and propagation of fissures. Upon reaching 50 F–T cycles, the weakening of cohesion is reduced with the gradual dissipation of frost stress, stabilizing the fissure network. This intricate network of fissures plays a significant role in determining the hydraulic properties of rocks [32].

3.3. Permeability Properties

The seepage simulations adopted the Navier–Stokes equations for governing the rules of fluid flows in porous media. The flows are considered free particles driven by velocity-distributed functions of discrete lattice nodes. The simplified governing equation for the movement pattern of flows is shown in Equation (5).
ρ v t + v v = ρ f p + μ 2 v
where t denotes time, ρ represents the density of fluid, p denotes the differential pressure, v denotes the velocity of flows, f denotes the tensor of internal volume force, and denotes the Laplace operator.
According to Darcy’s law, we can calculate the value of absolute permeability (K) by the following equation.
K = Q μ L A Δ P
where Q (m3/s) denotes the volumetric flow, μ (Pa·s) denotes the viscosity coefficient, L (m) denotes the length of the model, A (m2) represents the sectional area of the model, and Δ P (Pa) denotes the fluid pressure difference.
Permeability (K) is an important hydraulic parameter of rocks, and seriously affects the stability of open-pit slope [33]. It can be calculated by the aforementioned method based on the 3D numerical seepage simulation, offering a foundation for evaluating the hydraulic properties of claystone. In this investigation, the distribution and movement of fluid flows in claystone are configured, where the interconnected fissures act as favorable channels for fluid flows, which is referred to as effective fissures, under a pressure difference. Figure 9 illustrates the 3D models of velocity streamlines during the seepage process in the effective fissures of claystone for visualization. The color of streamlines indicates the flow velocity of the water. The red streamline is faster than the blue one. The density of streamline distribution represents the seepage capacity in the numerical model, with higher density indicating greater permeability. Under the initial condition, the 3D model exhibits the least complete seepage flow path, with localized distribution and most streamlines interrupted midway. The few intact streamlines appear lighter in color, indicating higher seepage velocities. This is attributed to the poor connectivity of fissures and insufficient favorable channels for fluid flows. As the number of F–T cycles increases to 50, the distribution density of streamlines in the seepage simulations continues to rise, accompanied by an increase in the width of streamlines. This phenomenon signifies that the action of F–T cycles induces variations of fissures in morphological factors, which has been observed and documented in previous studies. Furthermore, the variation of permeability calculated via seepage simulations under different F–T cycles is provided in Figure 10. Permeability (K) of claystone increases with deepening F–T damage, as effective fissures emerge and facilitate the water flow through the specimen. Under the influence of F–T cycles, permeability of the rock specimen increases tremendously, indicating that fissuring of claystone weakens its waterproof characteristics.

4. Discussion

To validate the feasibility and accuracy of seepage simulation, flexible wall permeameter measurements are performed on the undisturbed claystone specimen herein. As listed in Table 1, the average K of the claystone in its natural state is measured as 2.88 × 10⁻⁸ D, slightly lower than the value (K = 3.19 × 10⁻⁸ D) calculated based on the Micro-CT scanning results. Such discrepancy may be attributed to small differences in cracking between the parallel and scanned specimens and the limited resolution of the Micro-CT scanner. Overall, the relative error between values calculated in the two methods is less than 10%, falling within an acceptable range. Therefore, the results validate the effectiveness of using numerical seepage simulation based on 3D fissure models from Micro-CT scans to estimate the hydraulic properties of rocks.
Permeability of claystone is influenced by various factors, including mineral composition, particle distribution and size, and pore structure. All fissures in claystone facilitate water infiltration, with effective fissures serving as direct and effective seepage channels. Therefore, permeability is directly affected by porosity and connectivity. In this research, correlations among the fissure parameters, including volume porosity ϕd, connectivity ηc, and hydraulic parameter K, are analyzed, with specific observations given in Figure 11. Regression analysis reveals that the K of the claystone increases exponentially with ϕd and linearly with ηc. The results of seepage numerical simulations indicate that the connectivity of fissures greatly impact the permeability of rocks. As microstructural damage deepens, isolated fissures with small volumes among rock grains expand, interconnect, and develop into effective fissures, resulting in enlargement and continuous expansion of interconnected fissures in the claystone. Furthermore, it leads to a gradual increase in the number and volume of seepage channels while enhancing the hydraulic properties. Consequently, the effective fissures induced by the action of F–T cycles not only weaken the integrity of the rocks but also augment the permeability in the claystone, potentially leading to frost heave damage and geotechnical hazards on open-pit slopes in wet regions. Generally, traditional methods in previous studies used for the characterization of microscopic damage in claystone are mainly based on mechanical and permeability experiments. The methodology of Micro-CT scanning and seepage simulation adopted in this study provides a possible way to explore microstructure damage and performance degradation caused by freeze–thaw cycles in rocks.

5. Conclusions

This investigation reveals the microscopic evolution of fissures and their hydraulic properties in water-saturated claystone in open-pit mines of wet regions utilizing Micro-CT scanning results. The following conclusions can be drawn:
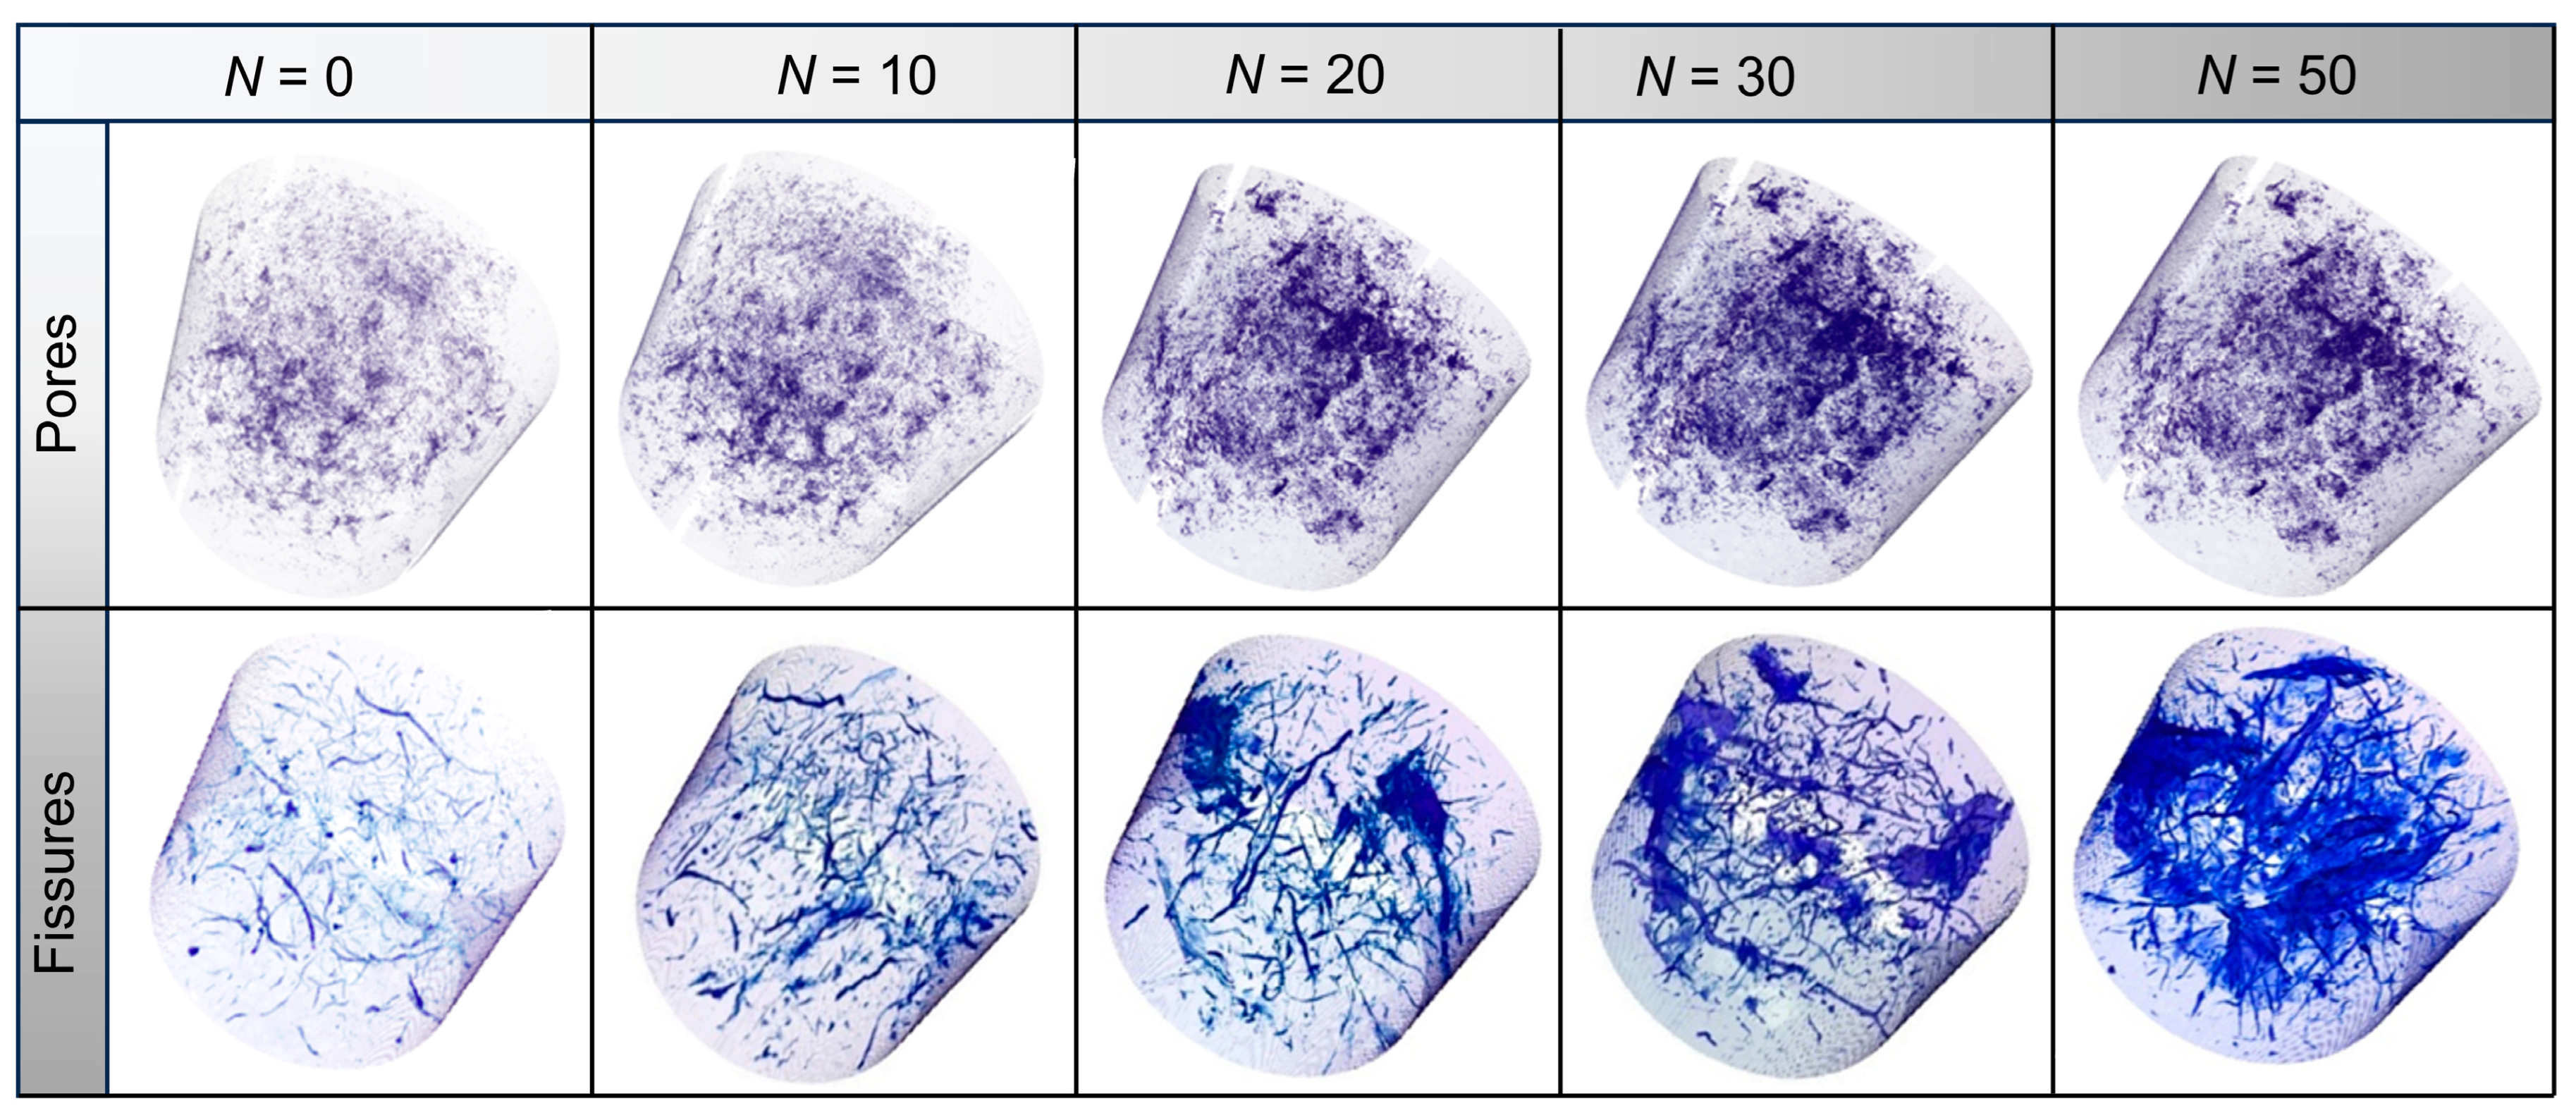
  • Micro-CT results disclose that undisturbed claystone initially possesses numerous isolated fissures, which gradually develop and expand, ultimately forming many interconnected fissures under the action of F–T cycles. Grayscale images obtained by Micro-CT scanning provide valuable insights into the changing pattern of internal fissures during multiple F–T cycles.
  • The 3D fissures reconstructed by 2D grayscale slices visually illustrate the morphological changes in microstructure of claystone during F–T cycles.
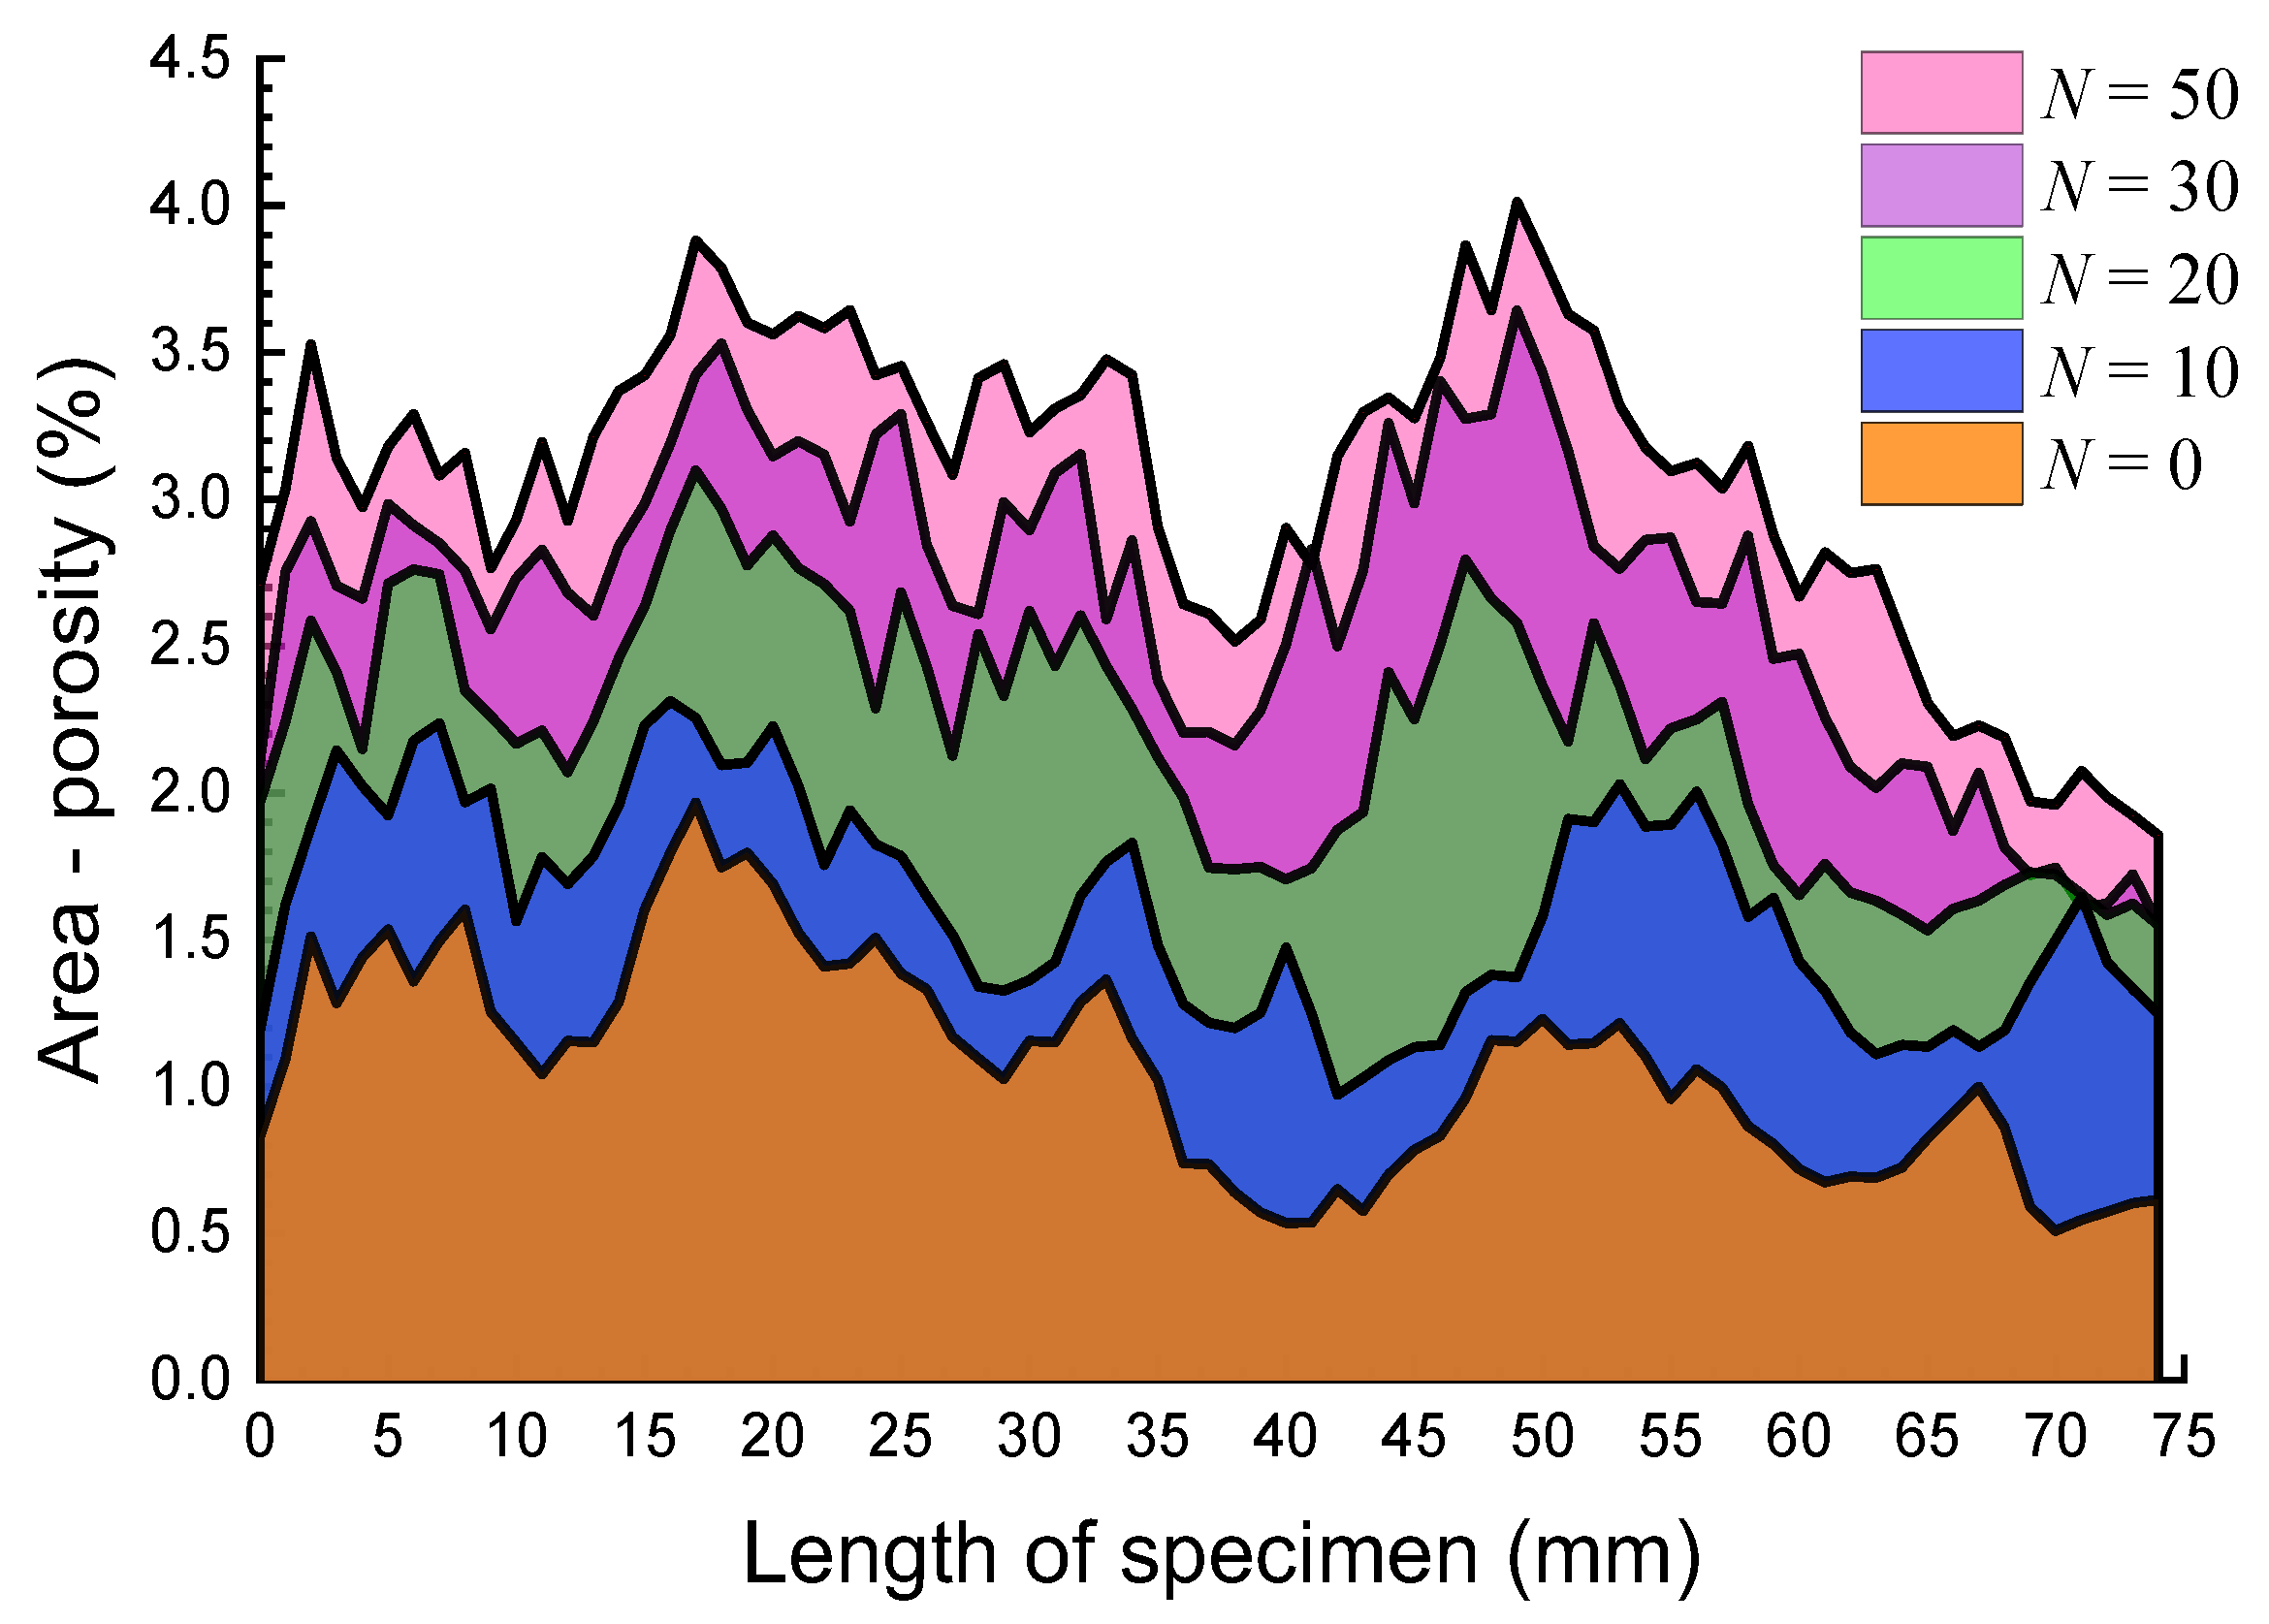
  • Pores and fissures extracted from the Micro-CT images change greatly along with axial direction and demonstrate noticeable discreteness. The heterogeneity of pore distribution indicates that F–T cycles enhance the spatial complexity in distribution of fissures in claystone.
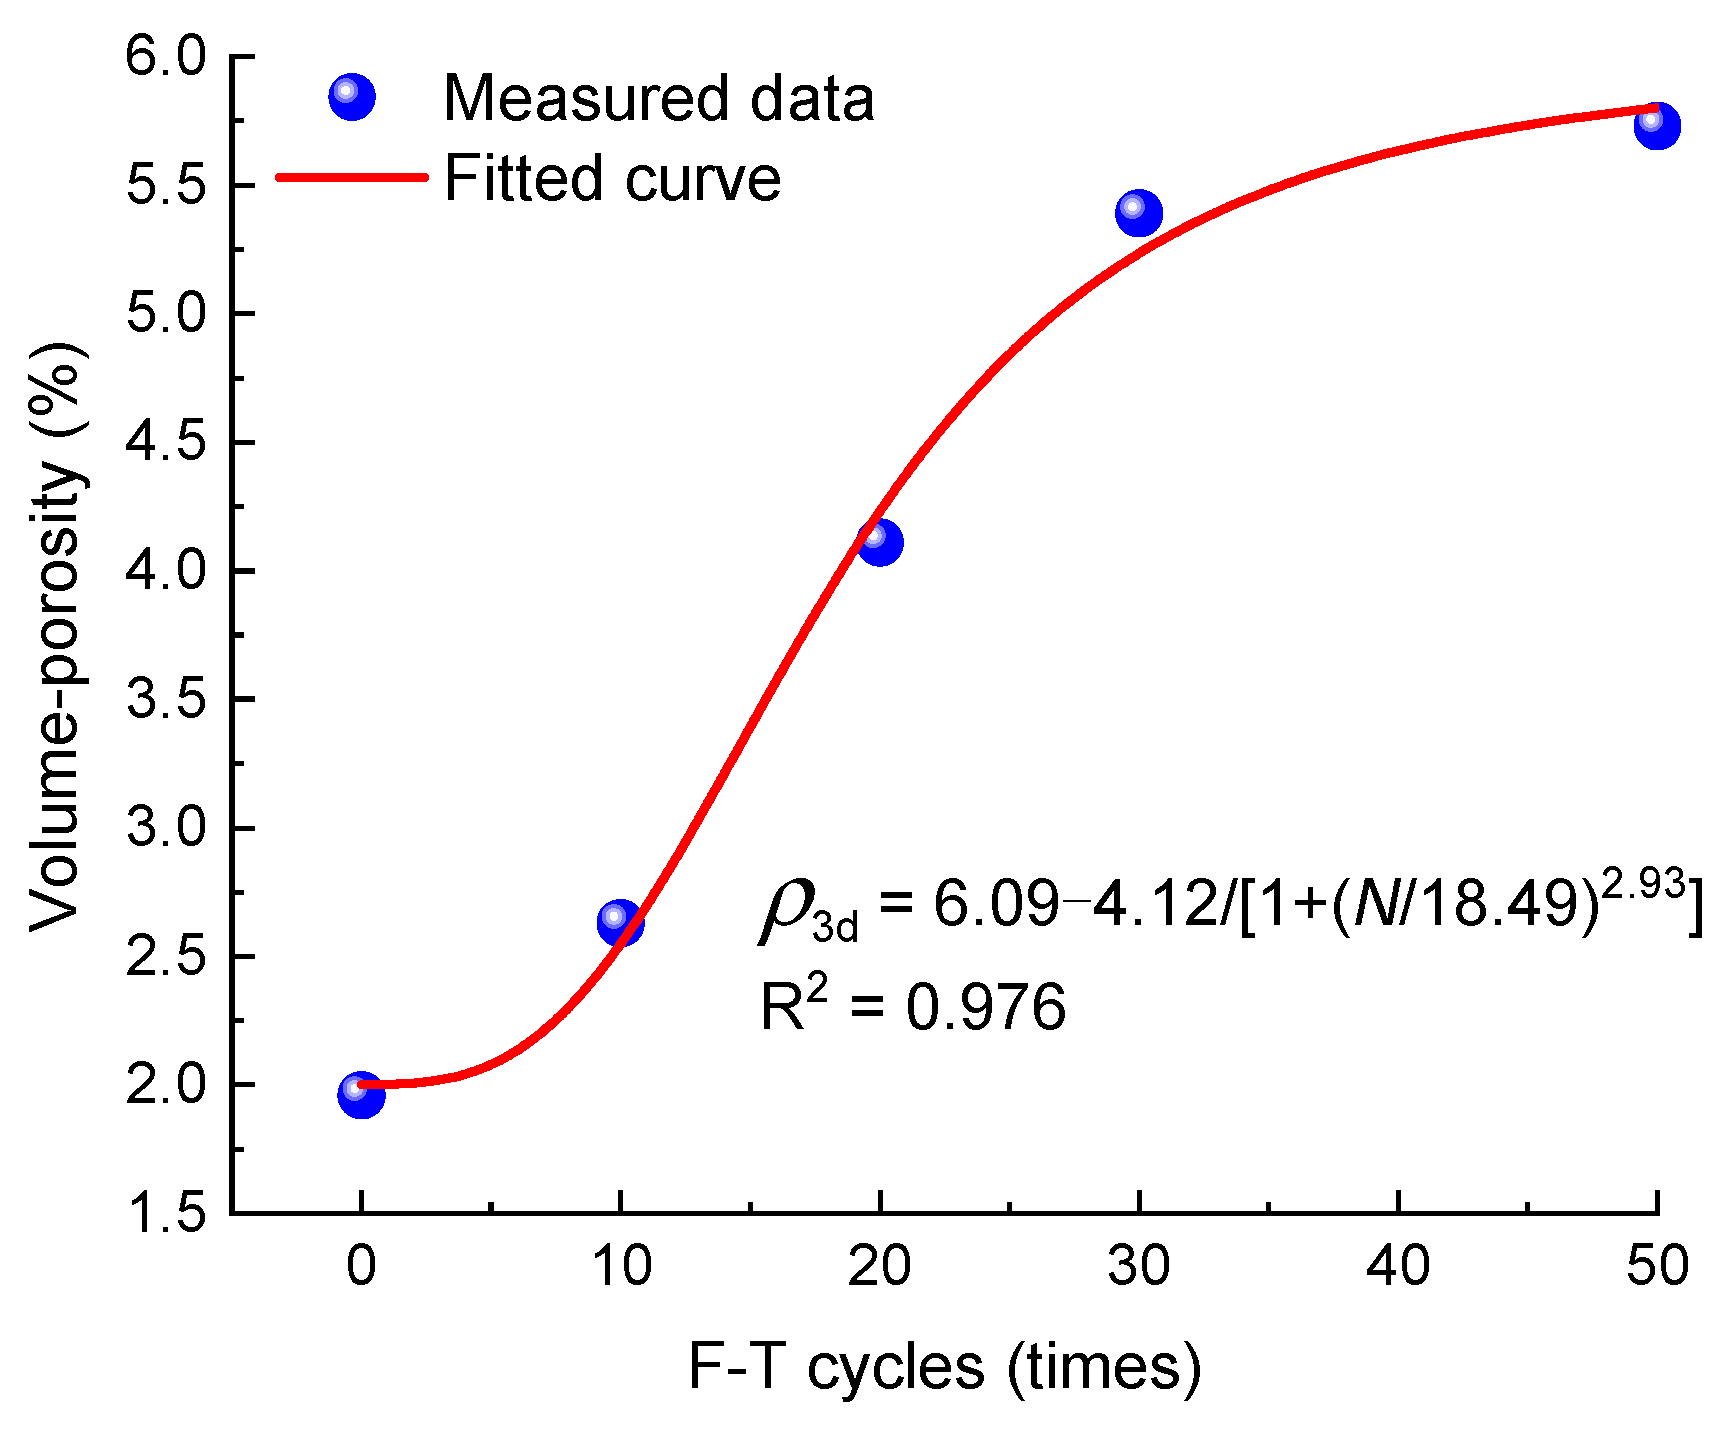
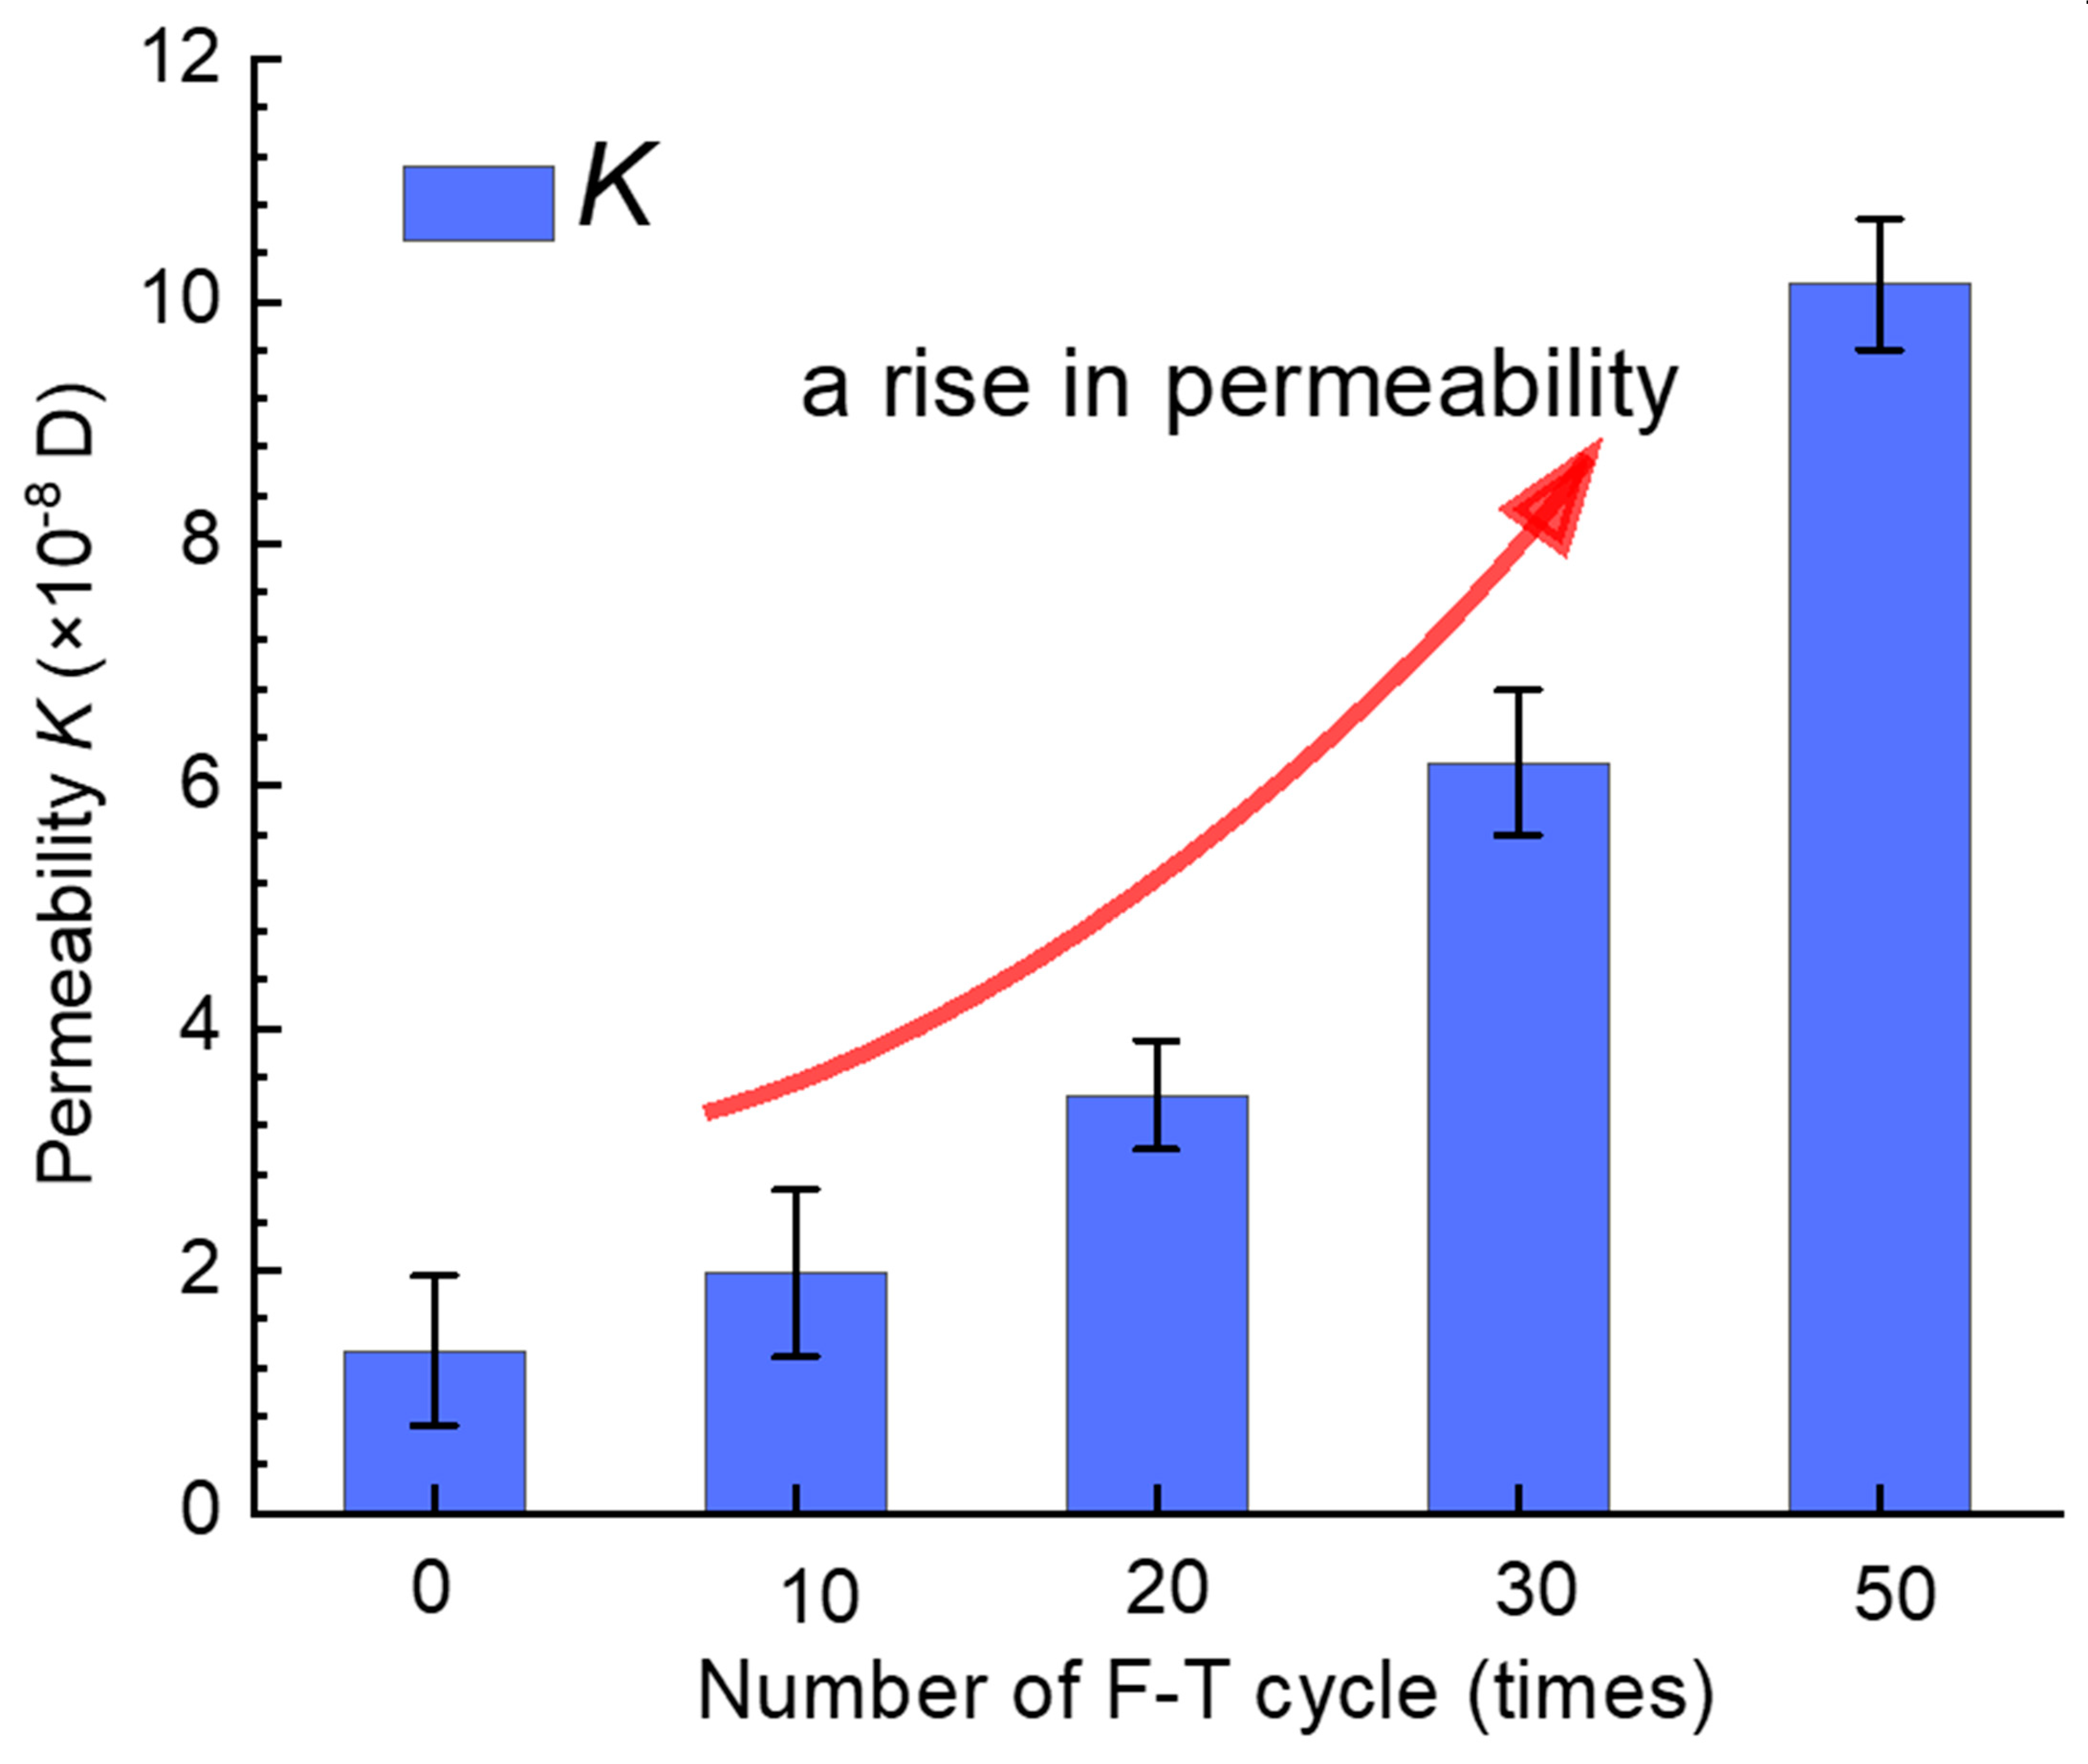
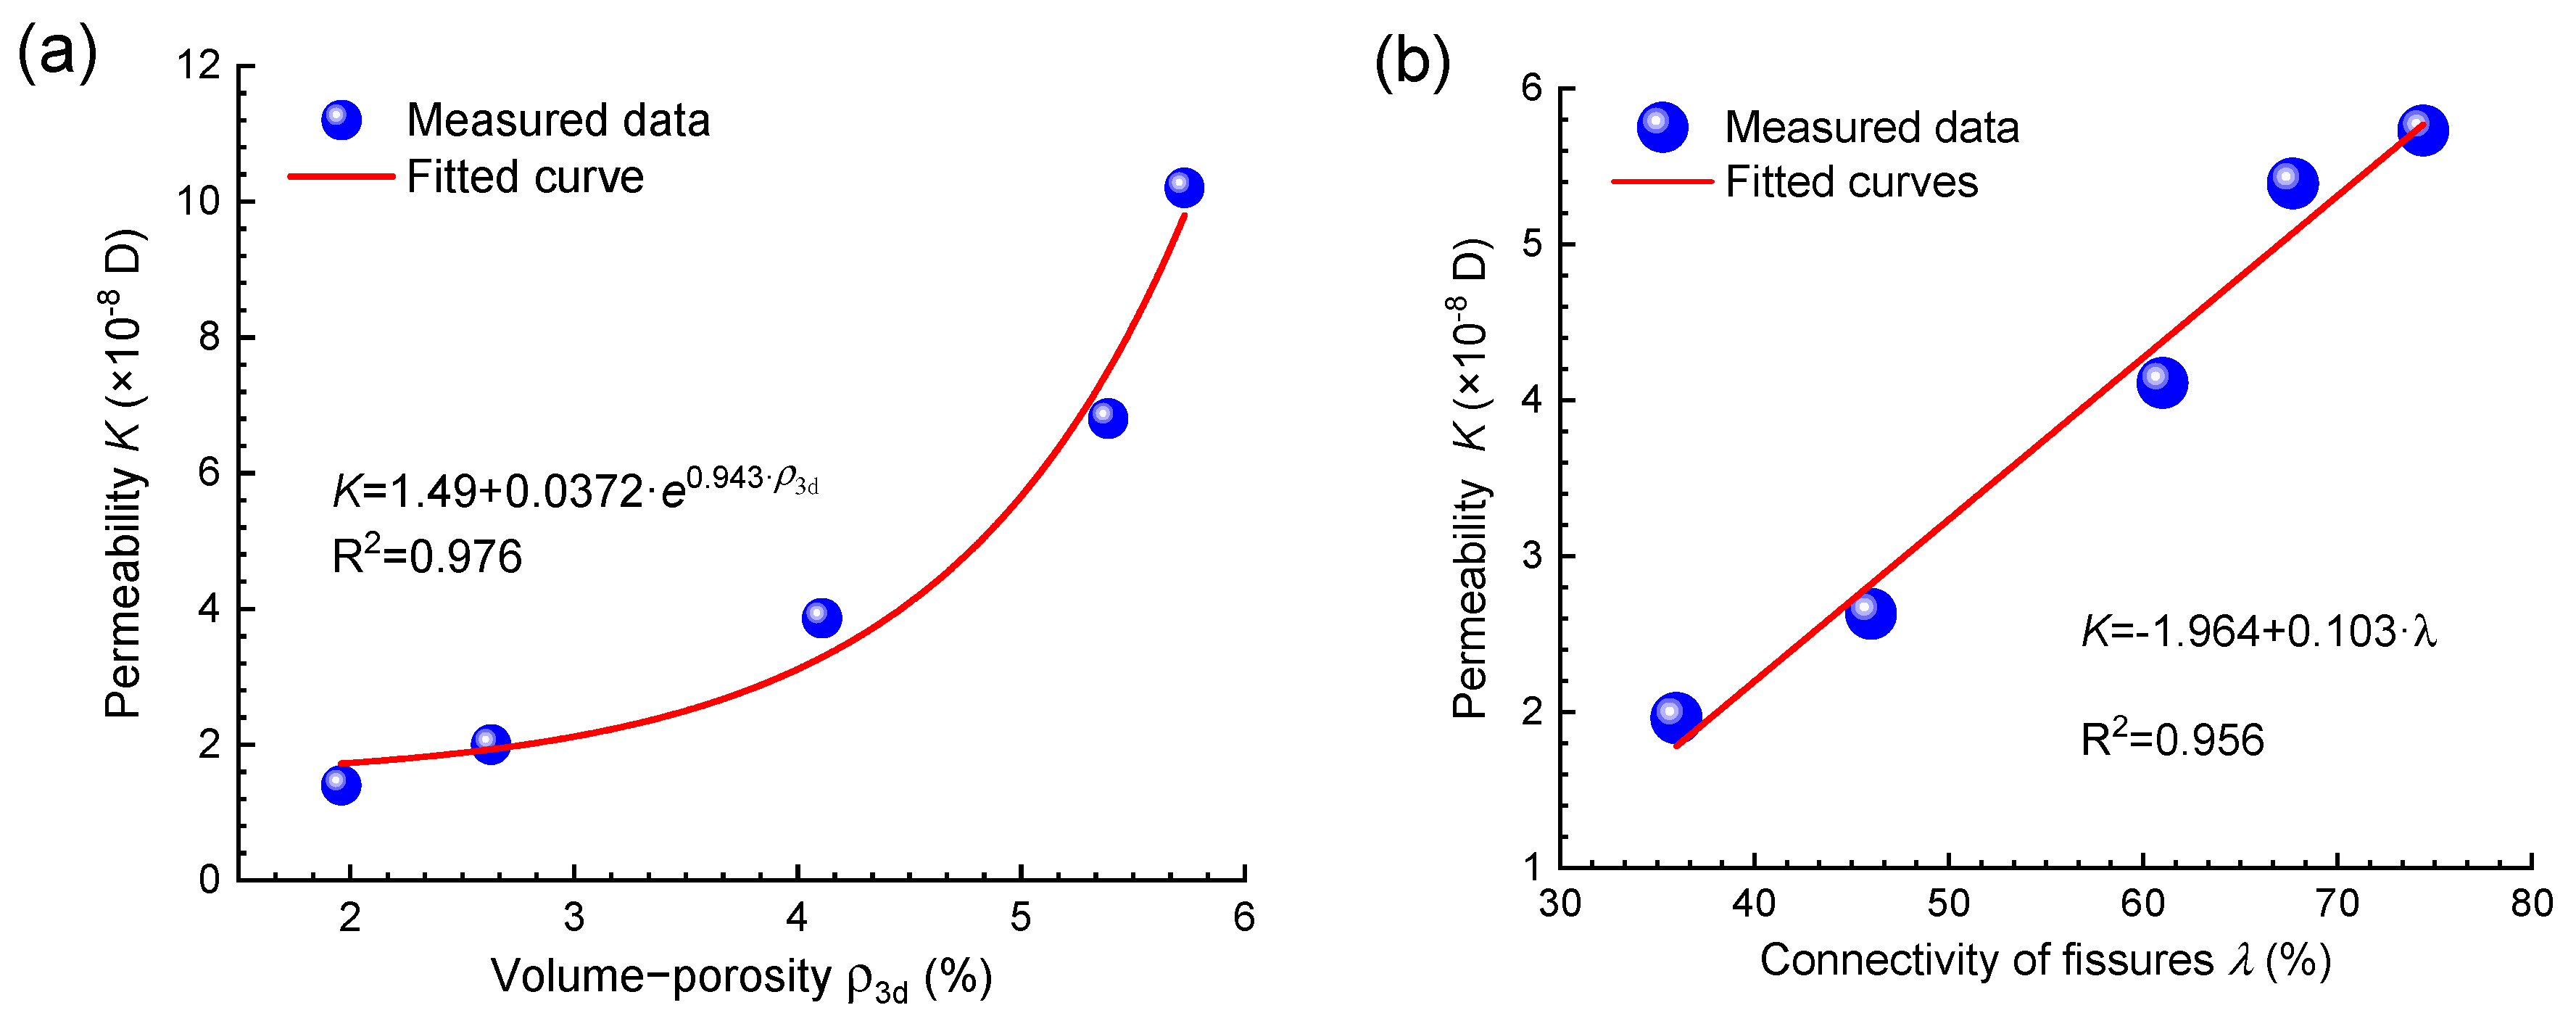
  • Macroscopic fissures in claystone result from the accumulation of tiny internal fissures through continuous sprouting and confluence. As the number of F–T cycles increases from 0 to 50, the porosity volume of internally interconnected fissures increases significantly for interconnected fissures. These findings signify that interconnected fissures are the key factor determining the degree of fissure development in claystones under the action of F–T cycles.
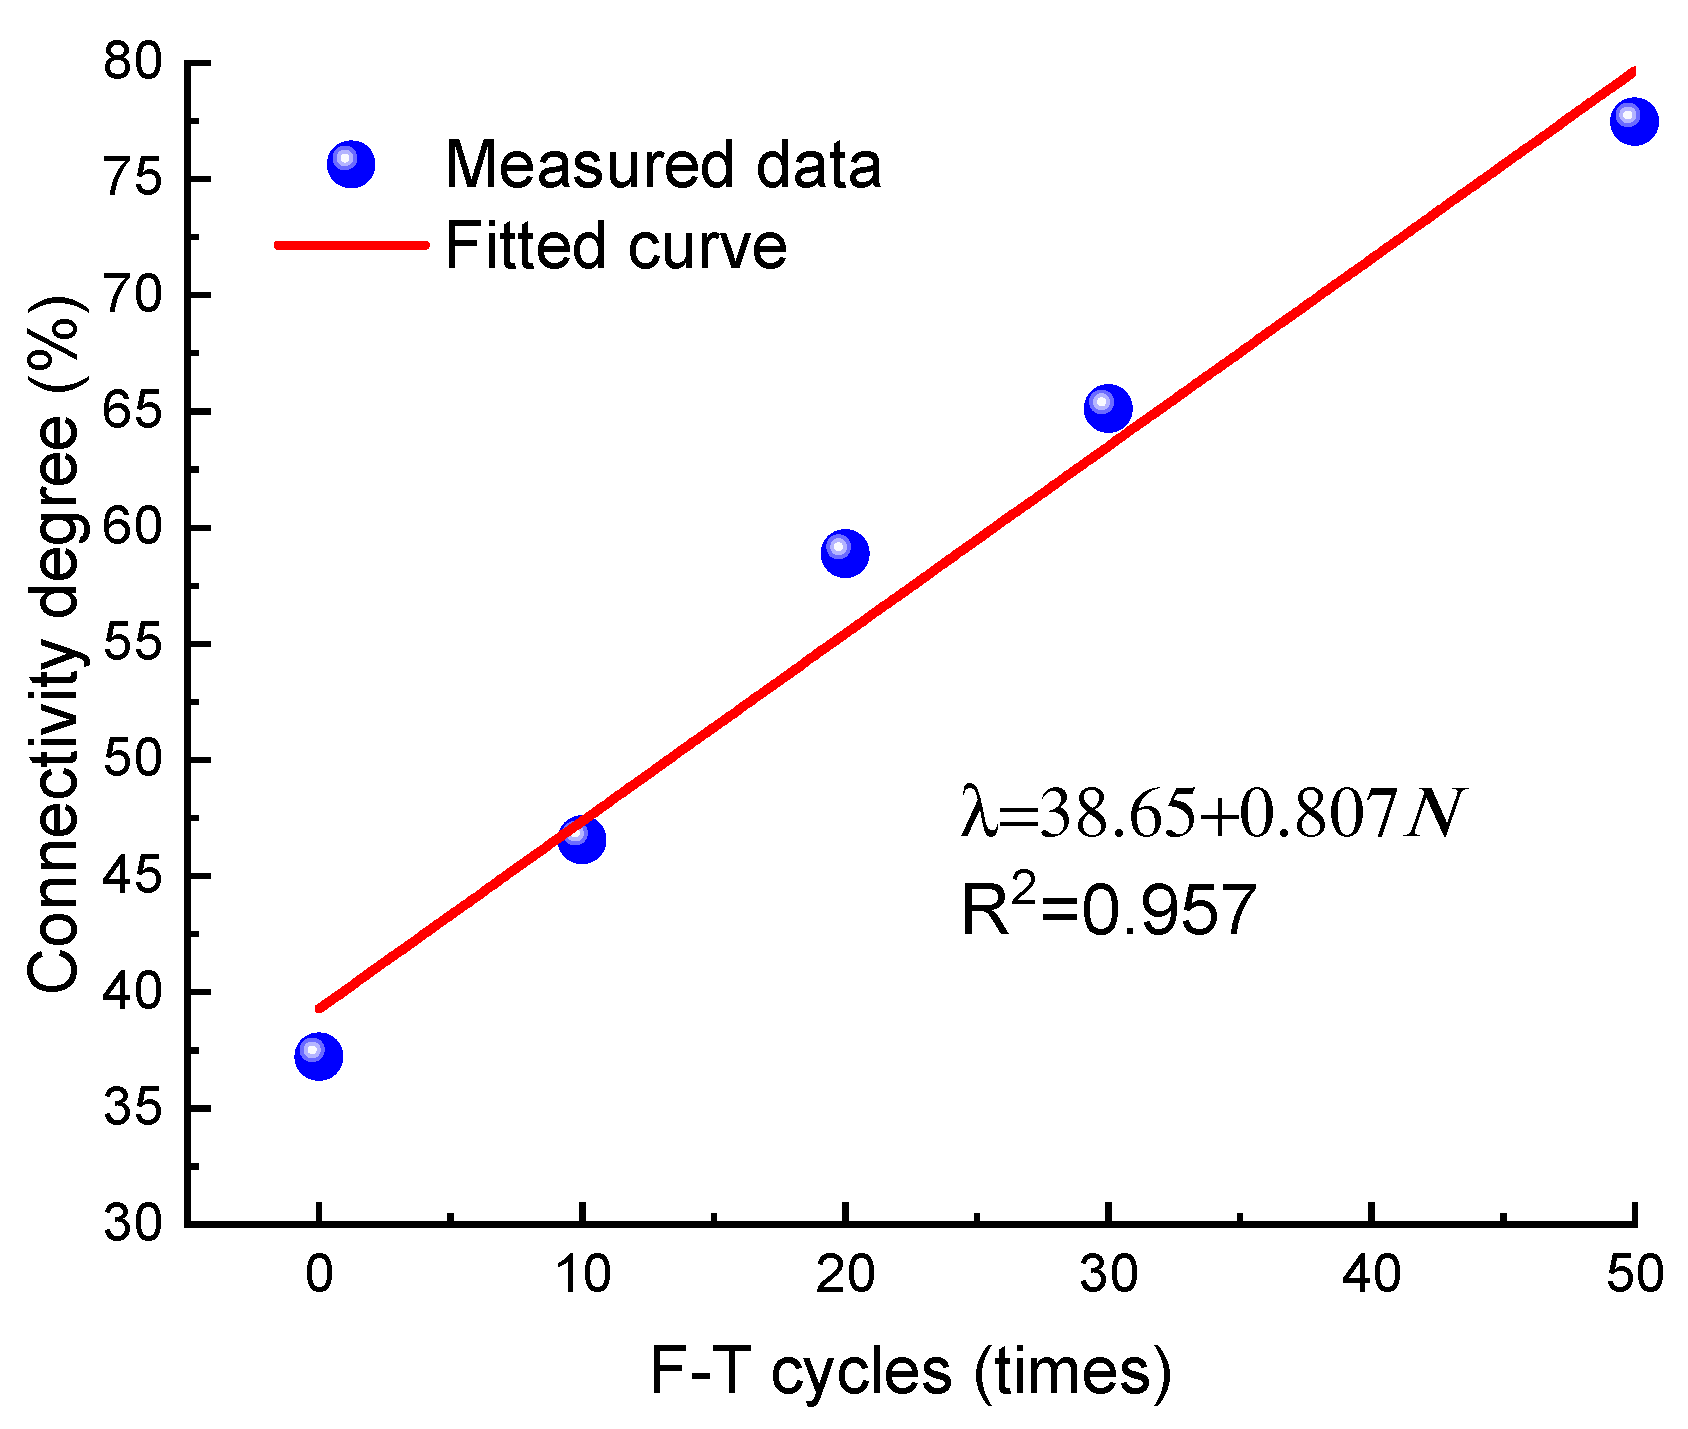
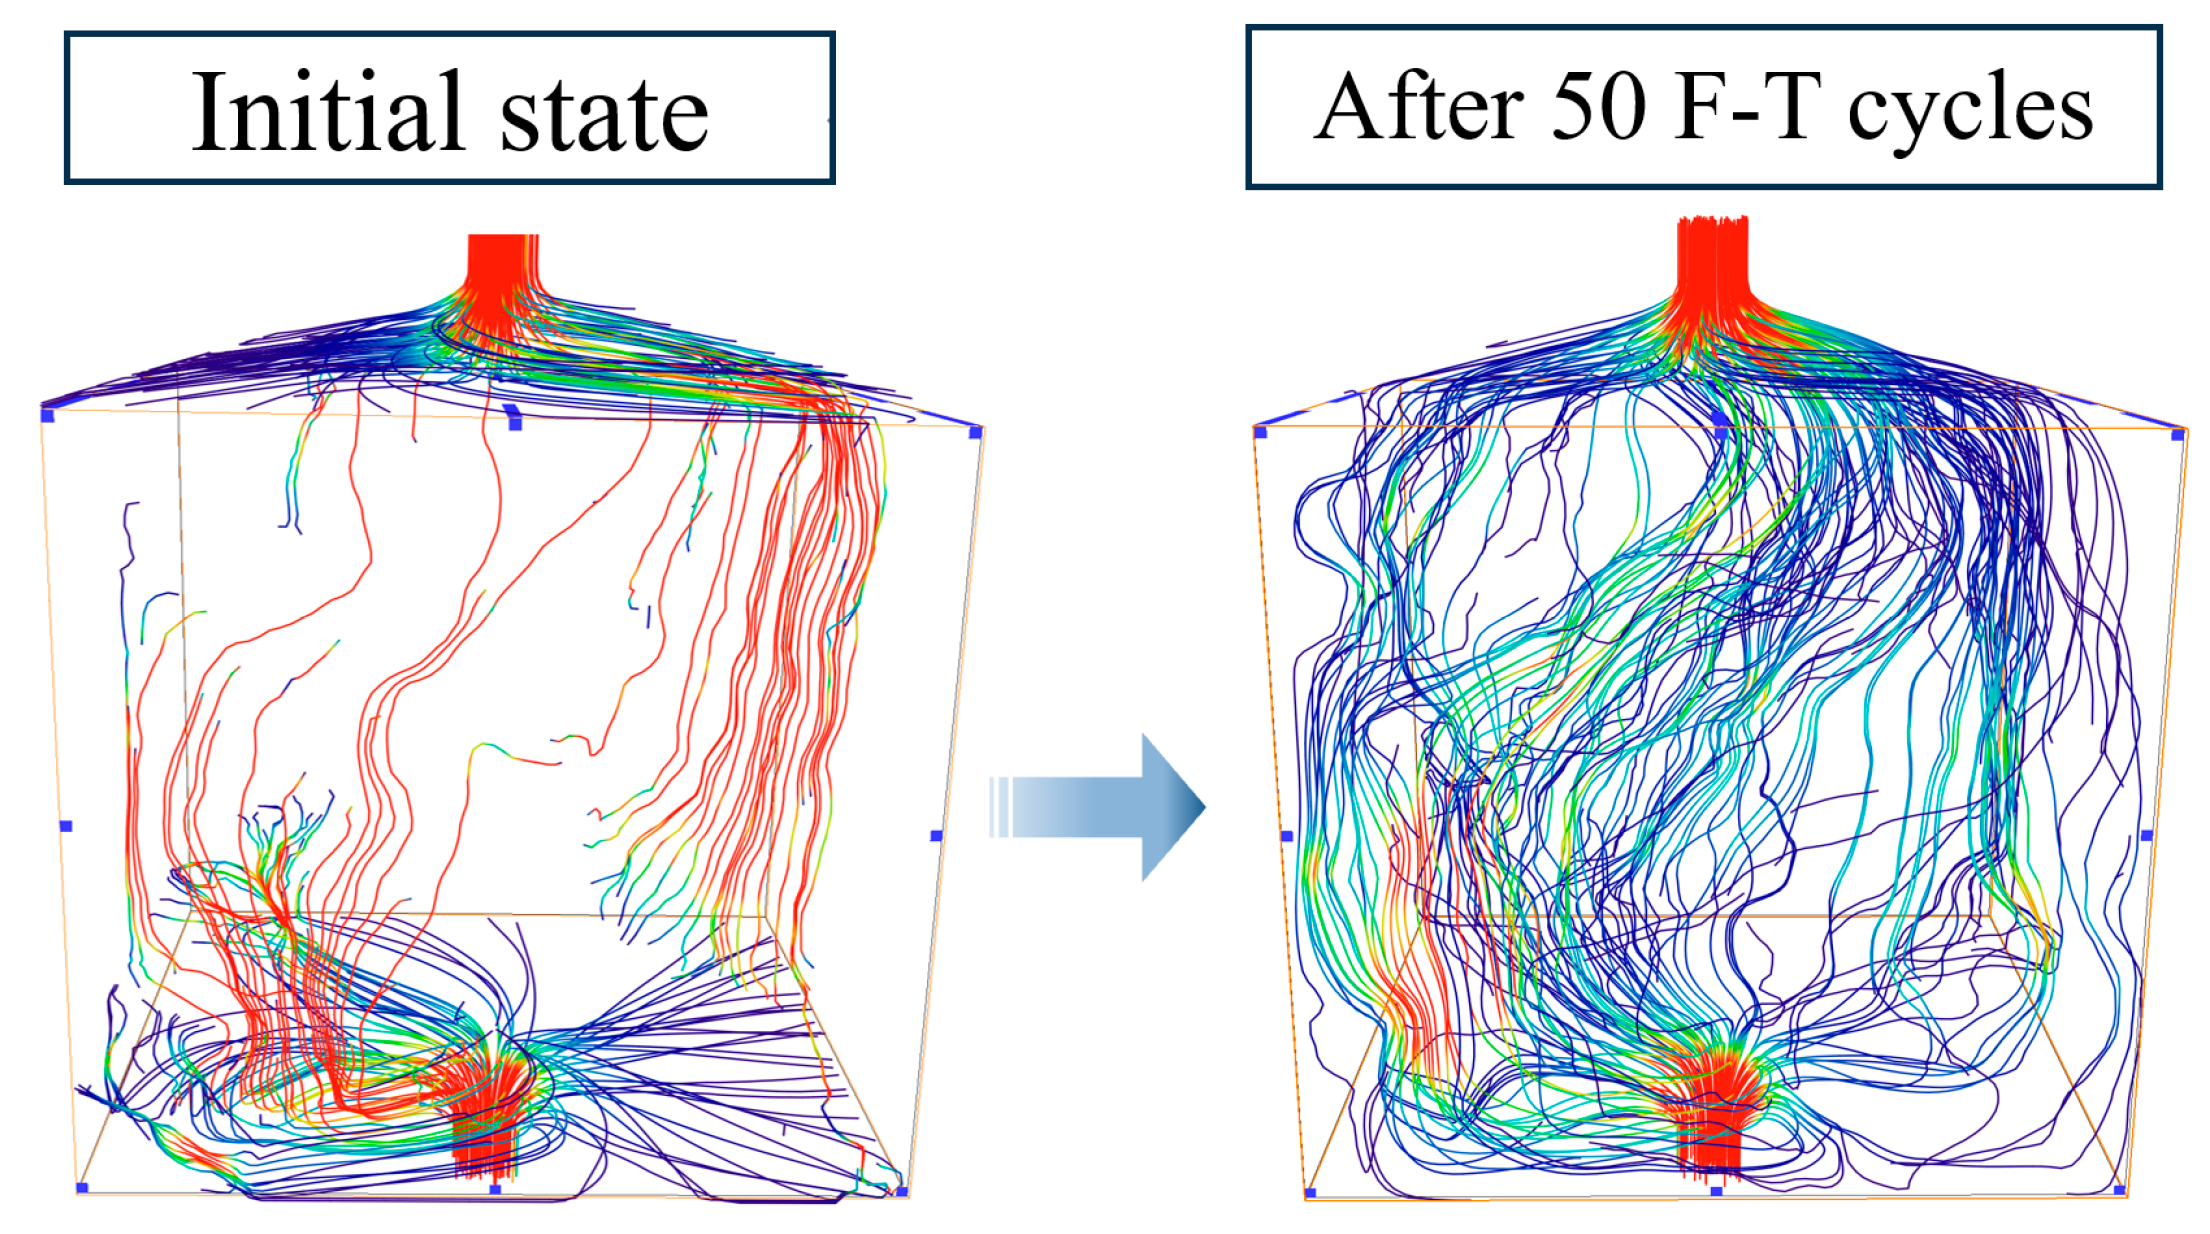
  • Extracting interconnected fissures with dynamic connectivity properties is a crucial foundation for numerical simulation of the seepage property of claystones. The evolutionary rule of permeability is verified through both numerical seepage simulation and experimental results.
  • The propagating fissures resulting from F–T cycles not only weaken the integrity of rocks but also augment permeability in claystone, potentially leading to frost heave damage and geotechnical hazards of open-pit slopes in wet regions.

Author Contributions

Conceptualization, Z.L. (Zhifang Liu) and Q.Z.; methodology, Y.X.; software, Y.X. and Z.L. (Zhu Liang); formal analysis, W.L. (Wenlong Li); validation, W.L. (Wei Liu) and J.H.; investigation, Z.L. (Zhifang Liu); writing—original draft preparation, Y.X.; writing—review and editing, Z.L. (Zhifang Liu); supervision, Q.Z.; funding acquisition, Z.L. (Zhifang Liu) and Q.Z. All authors have read and agreed to the published version of the manuscript.

Funding

This research was funded by the Collaborative Innovation Center for Natural Resources Planning and Marine Technology of Guangzhou (No. 2023B04J0301, No. 2023B04J0326), the Key-Area Research and Development Program of Guangdong Province (No. 2020B0101130009), the Guangdong Enterprise Key Laboratory for Urban Sensing, Monitoring and Early Warning (No. 2020B121202019), the Science and Technology Foundation of Guangzhou Urban Planning & Design Survey Research Institute (Grant No. RDI2230204019, RDI2220204080), and the Guangdong natural resources department science and technology project (GDZRZYKJ2023004).

Data Availability Statement

Some or all data, models, or code that support the findings of this study are available from the corresponding author upon reasonable request.

Acknowledgments

The authors greatly appreciated the support from the anonymous reviewers for their valuable comments.

Conflicts of Interest

Author Zhifang Liu, Wei Liu, Jianyu Huang, Zhu Liang, Qinghua Zhang and Wenlong Li was employed by the company Guangzhou Urban Planning & Design Survey Research Institute. The remaining authors declare that the research was conducted in the absence of any commercial or financial relationships that could be construed as a potential conflict of interest.

References

  1. Lu, Y.; Liu, S.H.; Zhang, Y.G.; Wang, L.J.; Li, Z. Hydraulic conductivity of gravelly soils with various coarse particle contents subjected to freeze–thaw cycles. J. Hydrol. 2021, 598, 126302. [Google Scholar] [CrossRef]
  2. Ma, Q.Y.; Ma, D.D.; Yao, Z.M. Influence of freeze-thaw cycles on dynamic compressive strength and energy distribution of soft rock specimen. Cold Reg. Sci. Technol. 2018, 153, 10–17. [Google Scholar] [CrossRef]
  3. Azmatch, T.F.; Sego, D.C.; Arenson, L.U.; Biggar, K.W. Using soil freezing characteristic curve to estimate the hydraulic conductivity function of partially frozen soils. Cold Reg. Sci. Technol. 2012, 83, 103–109. [Google Scholar] [CrossRef]
  4. Guo, P.; Gong, X.; Wang, Y.; Lin, H.; Zhao, Y. Analysis of observed performance of a deep excavation straddled by shallowly buried pressurized pipelines and underneath traversed by planned tunnels. Tunn. Undergr. Space Technol. 2023, 132, 104946. [Google Scholar] [CrossRef]
  5. Musa, A.; Liu, Y.; Wang, A.Z.; Niu, C.Y. Characteristics of soil freeze–thaw cycles and their effects on water enrichment in the rhizosphere. Geoderma 2016, 264, 132–139. [Google Scholar] [CrossRef]
  6. Ponomaryov, A.; Sychkina, E. Analysis of strain anisotropy and hydroscopic property of clay and claystone. Appl. Clay Sci. 2015, 114, 161–169. [Google Scholar] [CrossRef]
  7. Chen, W.Z.; Li, F.F.; Lei, J.; Yu, H.D.; Ma, Y.S. Study on creep characteristics of claystone under thermo-hydro-mechanical coupling. Rock Mech. Rock Eng. 2020, 41, 379–388. (In Chinese) [Google Scholar]
  8. Ibrahim, R.K.; Ismail, N.R.; Omar, H.M. Thermal Effects on Compressive Strength of Local Limestone and Claystone. Sci. J. Koya Univ. 2017, 5, 61–66. [Google Scholar] [CrossRef]
  9. Jia, Y.; Bian, H.B.; Duveau, G.; Poutrel, A. Numerical modeling of the influence of steel corrosion on the thermohydro-mechanical response of the Callovo-Oxfordian claystone. Comput. Geotech. 2016, 71, 247–260. [Google Scholar] [CrossRef]
  10. Tang, Y.Q.; Yan, J.J. Effect of freeze–thaw on hydraulic conductivity and microstructure of soft soil in Shanghai area. Environ. Earth Sci. 2015, 73, 7679–7690. [Google Scholar] [CrossRef]
  11. Belmokhtar, M.; Delage, P.; Ghabezloo, S.; Tang, A.M.; Menaceur, H.; Conil, N. Poroelasticity of the Callovo-Oxfordian Claystone. Rock Mech. Rock Eng. 2017, 50, 871–889. [Google Scholar] [CrossRef]
  12. Yang, C.; Zhou, K.P.; Xiong, X.; Deng, H.W.; Pan, Z. Experimental investigation on rock mechanical properties and infrared radiation characteristics with freeze-thaw cycle treatment. Cold Reg. Sci. Technol. 2021, 183, 103232. [Google Scholar] [CrossRef]
  13. Kong, L.M.; Yu, A.L.; Liang, K.; Qi, J.L. Influence of bimodal structure on the soil freezing characteristic curve in expansive soils. Cold Reg. Sci. Technol. 2022, 194, 103437. [Google Scholar] [CrossRef]
  14. Wang, L.P.; Li, N.; Qi, J.L.; Tian, Y.Z.; Xu, S.H. Study on the physical index change and triaxial compression test of intact hard rock subjected to freeze-thaw cycles. Cold Reg. Sci. Technol. 2019, 160, 39–47. [Google Scholar]
  15. Liu, H.; Yun, Y.H.; Jin, L.; Lin, J.H.; Zhang, Y.; Luo, Y.; Ren, J.X. Study on tensile damage characteristics of sandstone under freeze-thaw cycles. Sci. Cold Arid Reg. 2021, 13, 379–393. [Google Scholar]
  16. Zhang, X.L.; Jin, J.X.; Liu, X.L.; Wang, Y.K.; Li, Y.H. Study on the Influence of Saturation on Freeze-Thaw Damage Characteristics of Sandstone. Materials 2023, 16, 2309. [Google Scholar] [CrossRef]
  17. Ke, B.; Zhang, C.Y.; Liu, C.J.; Ding, L.M.; Zheng, Y.; Li, N.; Wang, Y.X.; Lin, H. An experimental study on characteristics of impact compression of freeze-thawed granite samples under four different states considering moisture content and temperature difference. Environ. Earth Sci. 2021, 80, 661. [Google Scholar] [CrossRef]
  18. Xia, C.; Liu, Z.; Zhou, C.Y. Strength Deterioration Model of Soft Rock Considering Mesoscopic Bonding-Expansion Coupling Mechanism under Freeze-Thaw Cycles. Sustainability 2022, 14, 11766. [Google Scholar] [CrossRef]
  19. Zeng, Z.X.; Kong, L.W. Effect of wetting-drying-freezing-thawing cycles on the swelling behaviour of the Yanji mudstone. Environ. Earth Sci. 2019, 78, 435. [Google Scholar] [CrossRef]
  20. Hou, C.; Jin, X.G.; He, J.; Li, H.L. Experimental studies on the pore structure and mechanical properties of anhydrite rock under freeze-thaw cycles. J. Rock Mech. Geotech. 2022, 14, 781–797. [Google Scholar] [CrossRef]
  21. Fan, L.; Xu, C.; Wu, Z. Effects of cyclic freezing and thawing on the mechanical behavior of dried and saturated sandstone. Bull. Eng. Geol. Environ. 2020, 79, 755–765. [Google Scholar] [CrossRef]
  22. Wang, X.D.; Li, S.Y.; Sun, Y.F.; Zhang, C.B.; Liu, G.W. Influence of freeze-thaw cycling on the soil mechanical properties of open-pit mine dump under different moisture contents. Environ. Earth Sci. 2021, 80, 279. [Google Scholar] [CrossRef]
  23. Takarli, M.; Prince, W.; Siddique, R. Damage in granite under heating/cooling cycles and water freeze-thaw condition. Int. J. Rock Mech. Min. Sci. 2008, 45, 1164–1175. [Google Scholar] [CrossRef]
  24. Golaszewski, J.; Golaszewska, M.; Cygan, G. Performance of ordinary and self-compacting concrete with limestone after freeze-thaw cycles. Buildings 2003, 12, 2003. [Google Scholar] [CrossRef]
  25. Mousavi, S.Z.S.; Tavakoli, H.; Moarefvand, P.; Rezaei, M. Assessing the effect of freezing-thawing cycles on the results of the triaxial compressive strength test for calc-schist rock. Int. J. Rock Mech. Min. Sci. 2019, 123, 104090. [Google Scholar] [CrossRef]
  26. Li, F.F.; Chen, W.Z.; Wu, Z.G.; Yu, H.D.; Li, M.; Zhang, Z.F.; Zha, F.S. Laboratory Study of Effective Stress Coefficient for Saturated Claystone. Appl. Sci. 2023, 13, 10592. [Google Scholar] [CrossRef]
  27. An, R.; Wang, Y.X.; Zhang, X.; Chen, C.; Liu, X.; Cai, S. Quantitative characterization of drying-induced cracks and permeabilityof granite residual soil using micron-sized X-ray computed tomography. Sci. Total Environ. 2023, 876, 163213. [Google Scholar] [CrossRef] [PubMed]
  28. An, R.; Kong, L.W.; Zhang, X.W.; Li, C.S. Effects of dry-wet cycles on three-dimensional pore structure and permeability characteristics of granite residual soil using X-ray micro computed tomography. J. Rock Mech. Geotech. Eng. 2022, 14, 851–860. [Google Scholar] [CrossRef]
  29. ASTM D4926-15; Standard Test Method for Gamma Alumina Content in Catalysts and Catalyst Carriers Containing Silica and Alumina by X-ray Powder Diffraction. ASTM: West Conshohocken, PA, USA, 2015.
  30. Chai, M.T.; Zhang, J.M.; Zhang, H.; Mu, Y.H.; Sun, G.C.; Yin, Z.H. A method for calculating unfrozen water content of silty clay with consideration of freezing point. Appl. Clay Sci. 2018, 161, 474–481. [Google Scholar] [CrossRef]
  31. Park, J.; Hyun, C.U.; Park, H.D. Changes in microstructure and physical properties of rocks caused by artificial freeze–thaw action. Bull. Eng. Geol. Environ. 2015, 74, 555–565. [Google Scholar] [CrossRef]
  32. Van, J.F.; De, K.T.; De, S.G.; Veerle, C. Uniaxial compressive strength measurements of limestone plugs and cores: A size comparison and X-ray CT study. Bull. Eng. Geol. Environ. 2019, 78, 5301–5310. [Google Scholar]
  33. Gao, H.D.; An, R.; Zhang, X.W.; Wang, G.; Liu, X.Y.; Xu, Y.Q. Dynamic evolution of desiccation cracks and their relationship with the hydraulic properties of expansive soil. Int. J. Geomech. 2024, 24, 04023299. [Google Scholar] [CrossRef]
Figure 1. Geological section of the studied site.
Water 16 00640 g001
Figure 2. The apparatus of Micro-CT scanning tests: (a) real device; (b) schematic diagram.
Water 16 00640 g002
Figure 3. Two-dimensional grayscale images of the claystone at different numbers of F–T cycles.
Water 16 00640 g003
Figure 4. Area–porosity at different heights of the specimen.
Water 16 00640 g004
Figure 5. Three-dimensional reconstructed models of pores and fissures at different numbers of F–T cycles.
Water 16 00640 g005
Figure 6. Variation in volume–porosity with distinct numbers of F–T cycles.
Water 16 00640 g006
Figure 7. Variation in connectivity degree with varying numbers of F–T cycles.
Water 16 00640 g007
Figure 8. Volume porosity of claystone under different numbers of F–T cycles.
Water 16 00640 g008
Figure 9. Seepage streamlines of claystone before and after F–T cycles. The color of streamlines indicates the flow velocity of the water. The red streamline is faster than the blue one.
Water 16 00640 g009
Figure 10. Variation in permeability with the number of F–T cycles.
Water 16 00640 g010
Figure 11. Variation in hydraulic properties with fissure parameters: (a) Kϕd relationships; (b) Kηc relationships.
Water 16 00640 g011
Table 1. Physical and mineralogical properties of the claystone.
Physical PropertyValue
Moisture content (%)22.9
Density (g/cm3)2.09
Specific gravity2.70
Initial porosity (%)11.9
P-wave velocity (m/s)2336
Permeability (cm/s)1.03 × 10−5
Unconfined compressive strength (MPa)2.68
Mineral Composition (%)Value
Quartz32.8
Feldspar13.5
Hydromica8.4
Montmorillonite12.9
Kaolinite24.4
Chlorite4.3
Others0.7
Table 2. Values and dispersion degrees of area–porosity.
Number of F–T CyclesStandard DeviationVarianceAveraged Value (%)Median (%)
00.3750.1451.1281.112
100.4070.1671.6291.528
200.4610.2112.2362.089
300.5270.2772.7092.716
500.5750.3325.9543.172
Disclaimer/Publisher’s Note: The statements, opinions and data contained in all publications are solely those of the individual author(s) and contributor(s) and not of MDPI and/or the editor(s). MDPI and/or the editor(s) disclaim responsibility for any injury to people or property resulting from any ideas, methods, instructions or products referred to in the content.

