Article

Effect of Aeration and External Carbon Source on Nitrogen Removal and Distribution Patterns of Related-Microorganisms in Horizontal Subsurface Flow Constructed Wetlands

Institute of Environment and Ecology, Shandong Normal University, No. 1 University Road, Changqing District, Jinan 250358, China
*
Author to whom correspondence should be addressed.
Water 2024, 16(5), 632; https://doi.org/10.3390/w16050632
Submission received: 23 January 2024 / Revised: 17 February 2024 / Accepted: 19 February 2024 / Published: 21 February 2024

Abstract

:
Nitrogen pollution of surface water is still a critical issue worldwide. In this study, a total of four treatments were conducted in horizontal subsurface flow constructed wetlands (HSSFCWs) to explore the removal rate of nitrogen in the carbon-deficient wastewater, including combination of aeration and external carbon source (CW_CA), external carbon source (CW_C), aeration (CW_A), and control group without aeration and carbon source (CW_CK). Results showed that the removal rates of total nitrogen (TN) in the enhanced treatments were increased compared with CW_CK. The highest removal rates of COD (66.56%), NH4+-N (73.51%), NO3-N (79.31%), and TN (76.19%) were observed in the CW_CA treatment. The bacterial community structure at the fore and rear ends of HSSFCWs was simultaneously changed in the CW_CA and CW_C treatments, respectively. The highest richness index at both the fore and rear ends of HSSFCWs was found in the CW_CA treatment. The richness and diversity indices of CW_C declined at the fore ends of HSSFCWs, but increased at the rear ends of HSSFCWs. Furthermore, the functional bacteria and genes significantly changed among different treatments. At the fore ends of HSSFCWs, the highest relative abundance of nitrifiers and absolute abundance of amoA and nxrA were obtained in CW_A, and the highest relative abundance of denitrifying bacteria and absolute abundance of nirS, nirK, nosZ were found in CW_C. However, at the rear ends of HSSFCWs, the highest relative abundance of nitrifiers and denitrifying bacteria as well as the absolute abundance of related genes were also observed in the CW_CA treatment. Overall, CW_CA improved the nitrogen removal rate by increasing the abundance of nitrogen-converting functional microbes and the genes associated with nitrification and denitrification.

1. Introduction

Eutrophication is a widespread global pollution issue. The discharge of nitrogen from sewage is a key factor contributing to the eutrophication of the aquatic environment [1]. The effluent of wastewater treatment plants (WWTPs) is one of the important pollution sources of nitrogen. With increasingly stringent regulations on surface water quality, it is crucial to identify an economical and effective technology for nitrogen removal. Constructed wetlands (CWs) have been extensively used to treat sewage containing low concentrations of nitrogen because of their cost-effective construction and maintenance costs [2].
Nitrogen is primarily removed through the biological transformation process in CWs. It has been broadly accepted that sequential nitrification and denitrification processes are the most important nitrogen removal pathways in CWs [3]. So far, aerobic nitrification and heterotrophic denitrification are still the main pathways in the process of nitrogen removal. However, dissolved oxygen (DO) is deficient in horizontal subsurface flow constructed wetlands (HSSFCWs) due to the flooding condition and inadequate reoxygenation of the substrate. Current research has shown that artificial aeration could facilitate the reoxygenation and improve the nitrification process [4]. Previous studies have indicated that employing external carbon sources could effectively improve the removal rate of TN in CWs [5]. Therefore, artificial aeration and the addition of external organic carbon become more crucial when treating sewage with a low COD/TN ratio in HSSFCWs [6,7,8]. Studies have shown that the removal efficiency of NH4+-N was improved with the concentration of DO varying between 0.8 mg·L−1 and 9.0 mg·L−1 in the CWs under artificial aeration conditions [9,10]. The optimal COD/TN ratio ranged from 4 to 10, depending on the variety of CWs, substrates, influent loads and temperatures [11,12,13,14]. Most of the previous studies were conducted with sufficient DO and carbon sources, leading to resource wastage and secondary pollution. Utilizing micro-aeration and restricted carbon sources proves to be an economical approach for addressing the secondary effluent of WWTPs.
The nitrogen removal pathway can be altered by environmental factors; among them, DO and COD/TN ratio were found to be the predominant factors. Existing evidence showed that partial nitrification, anammox, and denitrification occurred simultaneously with a DO level of 0.8 mg·L−1 and a COD/TN ratio of 2 to 6 in CWs [9]. The nitrogen removal pathways mentioned above can be intuitively understood by observing changes in bacterial community structure and the population of bacteria related to nitrogen transformation. Microbial species and quantity in the CWs were closely linked to the conversion, circulation, and removal of nitrogen [11]. It was noted that operating parameters of CWs can greatly affect either nitrifiers or heterotrophic denitrifying bacteria [15]. Compared to non-aeration CWs, the aeration CWs increased the relative abundance of ammonia-oxidizing bacteria (AOB) and nitrite-oxidizing bacteria (NOB) by more than threefold [16]. The impact of aeration on denitrifying bacteria was more intricate. Aeration enhanced the growth of denitrifying bacteria in vertical flow constructed wetlands with low COD/TN, but this effect was diminished in conditions with high COD/TN [9]. Under limited DO and carbon source conditions, the competition between different microbial groups could result in an unbalanced spatial distribution of microorganisms within the CWs. However, as far as we know, most of the prior research has focused on the spatial distribution of nitrogen levels and microbial communities in the constructed wetlands system model [3,17,18]. Limited information was available about the distribution pattern of microorganisms in the pilot-scale horizontal subsurface flow constructed wetlands. Furthermore, micro-aeration and limited carbon sources were used in CWs to treat secondary effluent of the WWTP could reduce the risk of nitrogen pollution. Nonetheless, the contribution of aeration and external carbon sources to the removal rate of nitrogen was still unclear. Therefore, elucidating the removal efficiency of nitrogen and the microbial mechanism behind the nitrogen removal process is crucial, especially under conditions of limited aeration and external carbon sources.
For this, a combination of micro-aeration and limitation carbon source methods was used to explore the changes in the efficiency of the removal of pollutants (COD, TN, NH4+-N, and NO3-N) in pilot-scale HSSFCWs. Furthermore, the variation and spatial distribution characteristics of bacteria and genes related to nitrogen transformation were analyzed to reveal the microbial mechanism of micro-aeration and restricted carbon sources on nitrogen removal.

2. Materials and Methods

2.1. Experiment Setup Location

This study was carried out in pilot-scale HSSFCWs (Jinan, China). Each HSSFCW unit had an overall surface area of 24 m2 (width 4 m, length 6 m) and a depth of 110 cm. The substrate layers comprising coarse sand (10 cm), coarse gravel (30 cm), fine gravel (30 cm), sand (20 cm), and soil (20 cm) were sequentially filled from the bottom upwards [19]. A peristaltic pump, in conjunction with a flow distributor, provided comparable influent to each unit. A device to incorporate carbon sources and aeration was installed in the separate wetland unit. In the HSSFCWs, Phragmites communis was cultivated at a density of 16 plants per square meter [19].

2.2. Experimental Design

Four HSSFCW units were used in this experiment: CW_CK (without aeration and carbon source), CW_A (aeration), CW_C (external carbon source), and CW_CA (combination of aeration and external carbon source). The CW_CA and CW_A treatments were aerated with an airflow rate of 0.80 ± 0.02 L min−1. In CW_CA and CW_C treatments, methanol was introduced to modify the COD/TN ratio to 5 according to the preliminary experiment. Consequently, the concentration of COD attained 65 mg·L−1. The pump and carbon dosing equipment were installed at the inlet end of the HSSFCW. The effluent from the Jinan West Wastewater Treatment Plant served as the influent for the HSSFCWs. The effluent of WWTPs adheres to the Class A criteria set by the Discharge Standard of Pollutants for Municipal Wastewater Treatment Plant [20]. The average concentrations of CODCr, TN, TP, NH4+-N, and NO3-N in the influent were 40.00, 13.00, 2.01, 2.00 and 9.50 mg·L−1, respectively. The rate of hydraulic loading was 0.33 m3·m−2·d−1. The study took place between 1 July and 30 September 2022. On average, temperatures reached 22 ± 4 °C during nighttime and 31 ± 4 °C throughout the day.

2.3. Water Samples Analysis

Water samples were collected at 10:00 am every 6 days. The effluent and influent samples were tested simultaneously in triplicate. The concentrations of COD, TN, NH4+-N, and NO3-N were measured following the method outlined by Wang et al. [21].

2.4. DNA Extraction, Bacterial Sequencing, and qPCR

Post-experiment, samples of the substrate were gathered from the layer of fine gravel, sand, and soil at both the fore ends (1.0 m from the influent) and rear ends (1.0 m from the effluent) of the HSSFCWs. Using the S-shaped sampling method, five samples of the substrate were collected and subsequently mixed comprehensively. Quickly transferred to the laboratory, the samples were stored at −20 °C before being used to collect eluate. The mixed substrate of fine gravel (100 g) and sand (100 g) was washed with Mili-Q water, and microbial samples were obtained following the methods outlined by Fu et al. [22]. Each sample was duplicated thrice. DNA was isolated from 0.30 ± 0.02 g of a mixed sample of elution matrix (0.2 g) and soil (0.1 g) using the DNA isolation kit (MoBio, Miami, FL, USA). Subsequently, the isolated DNA was preserved at a temperature of −20 °C for further analysis.
The bacterial 16S rRNA gene of microbial DNA from the HSSFCWs was amplified by the universal primers 341F (5′-CCTACGGGNGGCWGCAG-3′) and 805R (5′-G ACTACHVGGGTATCTAATCC-3′). Each sample at the 5′ ends of the primers was marked with a unique barcode, facilitating the categorization of various samples during Illumina MiSeq sequencing (LC-Bio Technology Co., Ltd., Hangzhou, China). Sequences of superior quality were grouped into operational taxonomic units (OTUs) through the establishment of a 97% sequence identity (UPARSE version 7.1). The classification process was conducted using QIIME 1.8.0 at a 70% confidence threshold [23].
The copy number of nitrogen transformation genes was measured using the Real-Time Quantitative PCR Detection System (Bio-Rad, Irvine, CA, USA). Five functional genes (amoA, nxrA, nirS, nirK, nosZ) were measured, and the primer sequences as well as protocol followed the method outlined by Lai et al. [24]. In the 20 μL qPCR reaction mixture, there was 10 μL of SYBR Green qPCR Master Mix (2×) (Thermo Scientific, Waltham, MA, USA), 1 μL of DNA, 0.80 μL of both forward and reverse primers, and 8.2 μL of ddH2O. To create the standard curve, plasmid DNA with the correct target gene was diluted tenfold in a series. For every quantitative test, a trio of negative controls was implemented. Reactions exhibiting amplification efficiencies ranging from 90% to 110% and only one peak in the melting curve were used for gene abundance assessment.

2.5. Statistical Analysis

The data were statistically examined through SPSS 19.0. A one-way analysis of variance (ANOVA) was employed to determine the minimal difference at the 95% confidence level. Principal coordinate analysis (PCoA), utilizing the Bray–Curtis metric, was employed to evaluate the similarity or dissimilarity of the bacterial community. Mothur (version 1.30.1) was employed to evaluate the bacterial diversity and community richness. The figures were generated utilizing Origin 2018.

3. Results and Discussion

3.1. Effect of Aeration and External Carbon Source on the Overall Performance of HSSFCWs

The concentration of pollutants in the effluent and their removal efficiencies varied significantly among the four treatments (Table 1). The introduction of external carbon sources significantly enhanced the removal rate of NO3-N (p < 0.05), reaching an average value of 79.31% and 78.07% in the treatments of combination of aeration and carbon sources (CW_CA) and external carbon source (CW_C), respectively. This finding aligned with earlier research using different carbon sources like wheat straw and glucose, potentially enhancing the activities of denitrifying bacteria [21,22] and expediting the removal of NO3-N [25]. Compared to CW_CK, the removal rate of NO3-N in the aeration treatment (CW_A) decreased from 65.01% to 58.59% (Table 1). Anaerobic bacteria were responsible for diminishing NO3-N during the denitrification phase [26], while the elevated DO level due to aeration markedly impeded the proliferation and activity of anaerobic bacteria [27]. Interestingly, there was no significant difference in the removal rate of NO3-N between the CW_CA and CW_C treatments (p > 0.05, Table 1). These findings suggested a more intricate interplay of aeration and external carbon sources, potentially altering the pathways of the NO3-N removal process.
The removal rate of NH4+-N differed across the four treatments, contrasting with NO3-N. The removal rate of NH4+-N for CW_A (76.27 ± 2.06%) and CW_CA (73.51 ± 1.65%) was higher than that of CW_CK (64.78 ± 1.14%) and CW_C (61.21 ± 1.52%) (Table 1). Comparable findings have been documented in earlier research, suggesting that aeration could enhance the removal efficiencies of NH4+-N in subsurface wastewater infiltration systems [28]. The aerobic chemoautotrophic microbes played a critical role in NH4+-N removal during the nitrification process [29]. Aeration could elevate the concentration of DO and enhance the biodiversity of aerobic microbes, sequentially promoting the removal rate of NH4+-N [29]. There was no significant disparity in the removal rate of NH4+-N between CW_A and CW_CA treatments (Table 1). Conversely, previous research indicated a reduction in the removal rate of NH4+-N when exposed to external carbon sources, which was attributed to incremental oxygen consumption under conditions of inadequate dissolved oxygen [30,31]. The variance might stem from the diverse microenvironments within the CWs, influenced by the concentration of pollutants and the operation conditions.
The removal efficiency of TN was increased in the CW_A, CW_CA and CW_C treatments compared with CW_CK. The highest average removal rate of TN was exhibited in CW_CA, reaching 76.19%, followed by CW_A (71.81%) and CW_C (67.52%) (Table 1). The removal efficiency of TN in CW_A treatment was higher than that in CW_C. Previous study found that aeration played a more crucial role in the removal rate of TN compared to carbon source, and it was found that the removal rate of TN increased from 27% to 99% with an increase of DO concentration from 0.45 to 5.71 mg·L−1 in the HSSFCWs [26]. For nitrification, the optimal concentration of DO exceeded 1.5 mg·L−1, whereas for denitrification, it remained below 0.5 mg·L−1 [32,33]. The findings of our study indicated that CW_CA exhibited superior TN removal efficiency, even with restricted DO and carbon sources. The combined impact of aeration and carbon source proved advantageous for multiple pathways of nitrogen elimination. Consistently, the highest average removal rate of COD was also found in the CW_CA treatment (Table 1). Compared to CW_CK, the concentration of COD was increased in the CW_C treatment, while it was decreased in the CW_CA treatment. These results suggested that aeration could reduce the risk of secondary contamination caused by external carbon sources. The primary degradation of COD occurred via the breakdown of aerobic microbes [34], and the aeration process was beneficial for aerobic bacteria and improved the removal rate of COD [35].

3.2. Effect of Aeration and External Carbon Sources on Bacterial Community Structure

3.2.1. α-Diversity

The bacterial community structure at the fore and rear ends of HSSFCWs was analyzed to identify the microbial mechanism of aeration and external carbon sources on nitrogen removal. The α-diversity reflects the variation in bacteria under different treatments. It is represented by the richness (observed species and Chao1 indices) and diversity (Shannon and Simpson indices) of the bacterial community. In the fore ends of HSSFCWs, the richness and diversity indices of CW_C were significantly lower than those of the other treatments, and there was no significant difference among CW_CK, CW_A and CW_CA treatments. CW_CA exhibited the highest richness index at both the fore and rear ends of HSSFCWs (Table 2). The results indicated that external carbon sources fostered bacterial competition and promoted propagation of predominant bacteria in the CW_C treatment. In contrast, CW_CA created suitable environments for diverse bacterial species, enhancing the bacterial richness index. It is widely believed that the microbial population plays a key role in the performance of constructed wetlands [36]. Research by Fu et al. [22] indicated that integrating carbon sources with aeration enhanced microbial propagation and optimized the microbial community structure. The bacterial richness and diversity indices at the fore ends (F_CW_CK, F_CW_A, F_CW_C, F_CW_CA) and rear ends (R_CW_CK, R_CW_A, R_CW_C, R_CW_CA) of HSSFCWs showed diverse responses to external carbon sources and aeration. At the fore ends of HSSFCWs, F_CW_C led to a reduction in bacterial richness and diversity indices, whereas under aeration conditions, incorporating carbon sources (F_CW_CA) enhanced the richness and diversity index. Aeration not only influenced the nitrifiers but also promoted the conversion of methanol. Furthermore, the richness and diversity indices were different in the fore and rear ends of HSSFCWs. In the rear ends of HSSFCWs, there was a rise in the richness and diversity indices of CW_C, suggesting a reduction in the inhibitory effect of carbon source on bacterial richness and diversity in the rear ends of HSSFCWs. There was no notable alteration in the richness and diversity indices of CW_A between the fore and rear ends of HSSFCWs, indicating minimal impact of aeration on bacterial richness and diversity indices. The diversity index of CW_CA decreased in the rear ends of HSSFCWs compared with that in the fore ends of HSSFCWs. However, the richness index of CW_CA remained stable between the fore and rear ends of HSSFCWs. The finding suggested that the external carbon source had a greater influence on bacterial richness and diversity indices than aeration.

3.2.2. Bacterial Community Composition

A total of 28 phyla were identified in the substrate samples of HSSFCWs. PCoA results revealed that the bacterial community composition was clustered into four distinct groups (Figure 1). The first group comprised F_CW_A, R_CW_A and F_CW_CA. The second group comprised R_CW_C, F_CW_CK and R_CW_CK. The third group included F_CW_C. The fourth group included R_CW_CA. At the phylum level, the bacterial communities at the fore and rear ends of HSSFCWs were differently affected by aeration and external carbon sources. The bacterial community was significantly influenced by CW_C at the fore ends of HSSFCWs, but was slightly affected at the rear ends of HSSFCWs. Nonetheless, the bacterial community composition of CW_A did not demonstrate significant differences between the fore and rear ends of HSSFCWs. The bacterial community composition of CW_CA treatment had no significant difference with CW_A, indicating the effect of aeration was more pronounced at the fore ends of HSSFCWs. However, the unique microenvironment of CW_CA treatment at the rear ends of HSSFCWs resulted in differences in the bacterial community compared to other treatments.
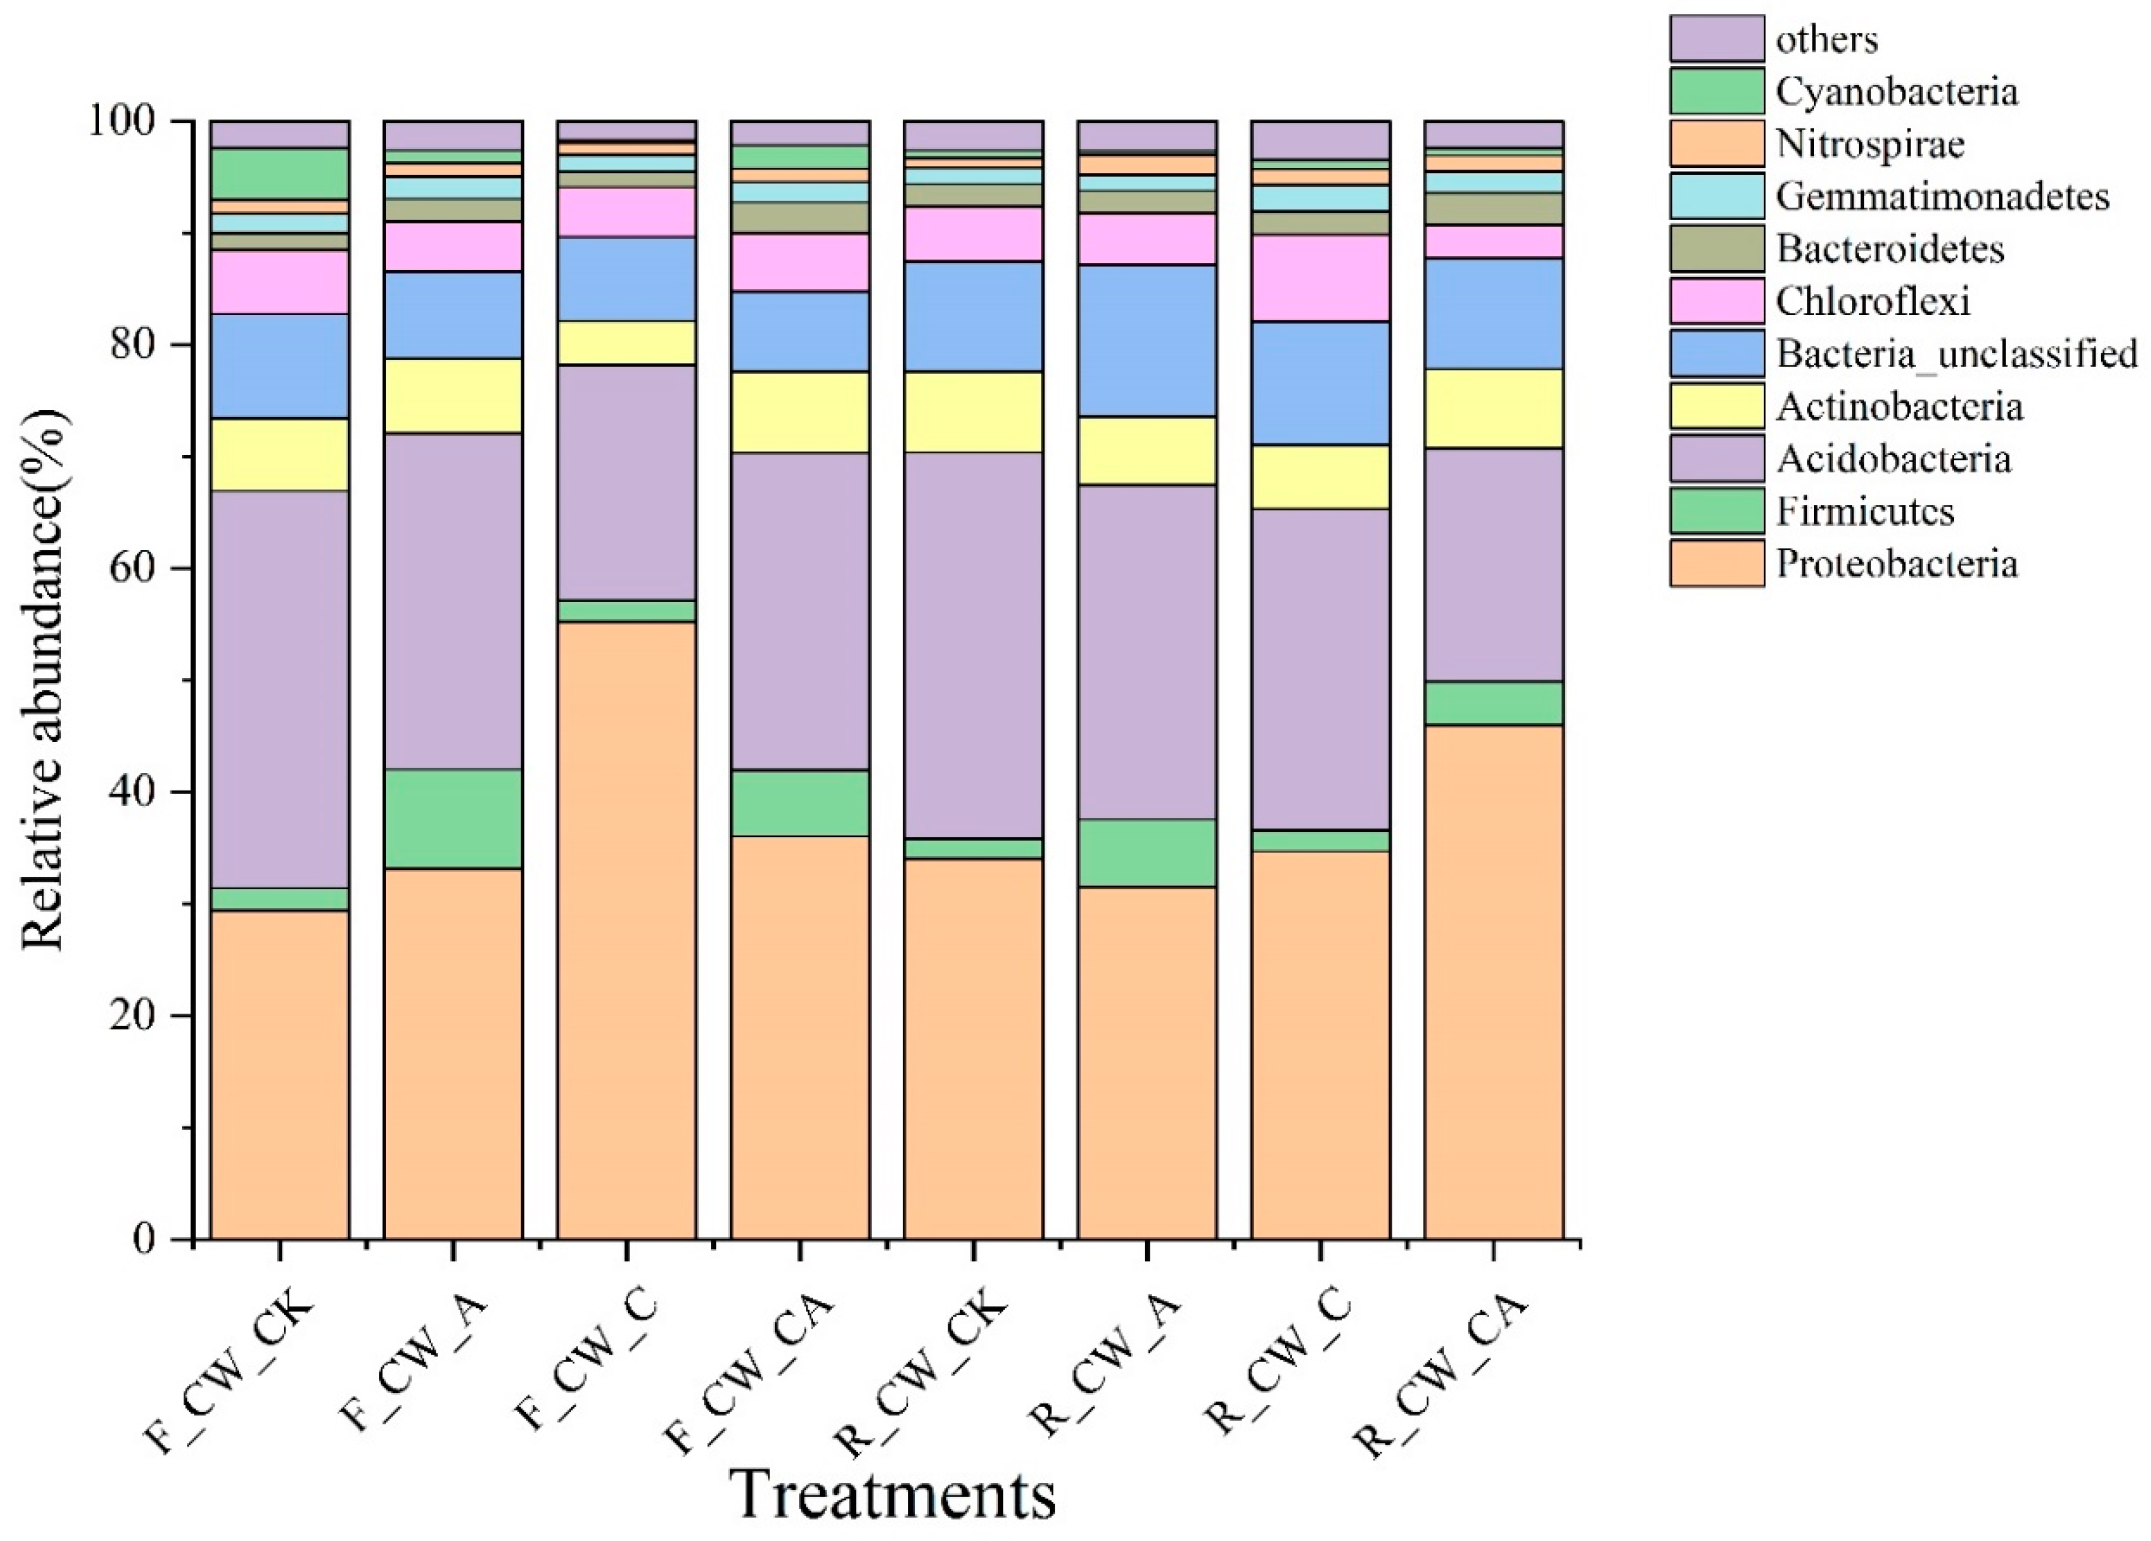
The top 10 phyla with a high relative abundance are presented in Figure 2. The Proteobacteria, Acidobacteria, Actinobacteria, Chloroflexi, and Bacteroidetes constituted the main phyla across all HSSFCWs. Over 80% of the total sequences were accounted for by the five phyla, and comparable bacterial communities were observed in wastewater treatment systems [37]. The relative abundance of Proteobacteria accounted for the largest proportion (29.40–45.95%) in all treatments, except for CW_CK. Research indicated a widespread presence of Proteobacteria across various types of CWs [38,39]. This phylum encompasses a diverse range of functional bacteria associated with carbon and nitrogen [40]. CW_C exhibited a higher relative abundance of Proteobacteria at the fore ends than that at the rear ends of HSSFCWs, suggesting that the external carbon source was crucial in the transformation of carbon and nitrogen in the fore ends of HSSFCWs. Existing evidence indicated that bacteria located at the fore ends of CWs tend to prefer easily metabolized compounds [41]. Methanol, as a small molecular organic carbon, could be easily utilized by bacteria. Rapid consumption occurred at the fore ends of HSSFCWs, resulting in minimal influence on the bacterial community at the rear ends of HSSFCWs. In addition to F_CW_C, R_CW_CA also had a higher relative abundance of Proteobacteria, suggesting that the carbon source had a critical influence on the microbes in the CW_CA treatment at the rear ends of HSSFCWs. Following Proteobacteria, Acidobacteria was the second most abundant phylum among the collected samples, accounting for 20.85% to 35.52%. Compared to CW_CK, there was a reduction in the relative abundance of Acidobacteria across all treatments, particularly in the F_CW_C and R_CW_CA treatments. Likewise, the relative abundance of Actinobacteria in the CW_C treatment also significantly decreased at both the fore and rear ends of HSSFCWs. Previous studies indicated that Actinobacteria and Acidobacteria were key species in the transformation of carbon and nitrogen in CWs [42]. Earlier research had noted that Acidobacteria was involved in litter decomposition [43], while Actinobacteria played a role in the process of denitrification [24]. The relative abundance of Actinobacteria and Acidobacteria was decreased in this study, which was attributed to the alteration of the carbon source through the addition of methanol. Among the 10 dominant phyla, Firmicutes was the only phylum that was enhanced in the CW_A treatment at both the fore and rear ends of HSSFCWs. Certain genera belonging to the Firmicutes phylum are involved in aerobic denitrification. Further study is required to ascertain the presence of the aerobic denitrification process in CW_A treatment, and its contribution to the removal rate of TN.

3.3. Microbial Mechanism of Aeration and External Carbon Source on Nitrogen Transformation

3.3.1. Genera Related to Nitrogen Transformation

More than 200 genera were identified in each sample. Among these, the genera related to nitrogen removal (ammonia-oxidizing, nitrite-oxidizing, denitrification, and anaerobic ammonium-oxidizing) were selected (Figure 3). The relative abundance of nitrifiers was 2.76–5.72% and 4.03–5.31% at the fore and rear ends of HSSFCWs, respectively. The highest relative abundance of nitrifiers was observed in F_CW_A and R_CW_CA at the fore and rear ends of HSSFCWs, respectively. The lowest relative abundance of nitrifiers in both the fore and rear ends of HSSFCWs was observed in the CW_C treatment. Four types of ammonia-oxidizing bacteria (Sphingomonas, Arthrobacter, Nitrosospira, and Prosthecobacter) and three types of nitrite-oxidizing bacteria (Nitrospira, Candidatus_Nitrotoga, and Nitrobacter) were identified in all samples (Table S1). Sphingomonas was the predominant ammonia-oxidizing bacterium, and Nitrospira was the predominant nitrite-oxidizing bacterium. Aeration was found to be beneficial in promoting the growth and reproduction of nitrifiers in the CWs [16]. Compared to CW_CK, the CW_A and CW_CA treatments led to a rise in the relative abundance of Sphingomonas and Arthrobacter at the fore ends of HSSFCWs, indicating that aeration could provide suitable conditions for these two bacteria. Simultaneously, the relative abundance of Nitrospira in the CW_A and CW_CA treatments was also boosted at the rear ends of HSSFCWs. The increase in the related nitrifier revealed that the CW_A and CW_CA treatments enhanced the ammonia-oxidizing and nitrite-oxidizing processes at the fore and rear ends of HSSFCWs, respectively.
The relative abundance of denitrifying bacteria accounted for 7.35% to 35.56% and 7.26% to 25.79% at the fore and rear ends of HSSFCWs, respectively. The highest relative abundance of denitrifying bacteria at the fore and rear ends of HSSFCWs was found in F_CW_C and R_CW_CA, respectively. The addition of carbon sources significantly increased the relative abundance of denitrifying bacteria at the fore ends of HSSFCWs, while it had no evident impact on the denitrifying bacteria at the rear end of CW_C. The high relative abundance of nitrifiers and denitrifying bacteria in the substrate sample of CW_CA led to the concurrent conversion of ammonium and nitrate. This could explain the high TN removal rate observed in the CW_CA treatment. These findings were consistent with previous studies. Xia et al. [44] reported that the removal of total inorganic nitrogen primarily occurred in the zone with a high relative abundance of nitrifiers and denitrifying bacteria in the vertical subsurface flow constructed wetlands. Thirty-eight and forty-one genera related to denitrification were detected at the fore and rear ends of the four treatments, respectively. The leading genera responsible for denitrification were Acinetobacter (0.48–30.07%), Gaiella (0.71–1.08%), Pseudomonas (0.47–3.09%), and Rhizobium (0.66–1.02%) (Table S1). Most of the denitrifying bacteria identified in this study were heterotrophic and enriched in the CW_C and CW_CA treatments. For instance, CW_C and CW_CA exhibited the highest relative abundance of Acinetobacter at the fore and rear ends of HSSFCWs, reaching 30.07% and 14.21%, respectively. These heterotrophic denitrifying bacteria played a significant role in the removal of both COD and TN in HSSFCWs [44]. Moreover, autotrophic denitrifying genera, such as Thiobacillus and Lysobacter, were also observed in various treatments, which could complete the denitrification process using sulfide as electron donors [16].
Anaerobic ammonia-oxidizing bacteria were also found in the substrate, with their relative abundance ranging from 0.006% to 0.019%. This suggested that the anammox process was not the predominant process for nitrogen elimination. Anaerobic ammonium-oxidizing genera, such as Planctomyces and Pirellula, were also identified in HSSFCWs. The highest abundance of Planctomyces (0.013%) was observed in the F_CW_CA sample, while Pirellula (0.011%) was predominant in the R_CW_A sample. The existence of the above-mentioned genera suggested the existence of various nitrogen conversion routes within the HSSFCWs.

3.3.2. Functional Genes Related to Nitrogen Transformation

The contribution of nitrifiers and denitrifying bacteria to nitrogen removal was indicated by the abundance of functional genes related to nitrogen [45,46]. The absolute abundance of amoA, nxrA, nirS, nirK and nosZ at both the fore and rear ends of HSSFCWs is depicted in Figure 4. The functional genes amoA and nxrA are associated with the nitrification process. The process of aeration (CW_A and CW_CA) significantly increased the absolute abundance of amoA (p < 0.05) at the fore ends of HSSFCWs. The absolute abundance of amoA in CW_A and CW_CA amounted to 4.56 × 10⁴ and 3.72 × 10⁴ copies·g−1 substrate, respectively. The absolute abundance of amoA in all treatments decreased in the rear ends of HSSFCWs, but the abundance of amoA in the CW_A and CW_CA treatments remained higher than that in other treatments at the rear ends of HSSFCWs. The absolute abundance of amoA in CW_A was higher than that in CW_CA at the fore ends of HSSFCWs, while the opposite results appeared at the rear ends of HSSFCWs. These results indicated that the addition of carbon sources partially inhibited nitrification even under the aeration condition. nxrA is another important gene related to nitrification. Aeration significantly increased the abundance of nxrA at the fore ends of HSSFCWs. The absolute abundance of amoA in CW_A and CW_CA treatments was higher than that in other treatments. The highest absolute abundance of nxrA in the fore and rear ends of HSSFCWs was observed in the CW_A and CW_CA treatments, reaching 8.22 × 10³ and 6.07 × 10³ copies·g−1 substrate, respectively. The aeration process provided sufficient DO to facilitate the proliferation, breeding, and biochemical activities of aerobic ammonia-oxidizing bacteria, thereby enhancing their activity [36]. The copy number of the amoA gene was 2.60 to 6.12 times higher than that of nxrA, aligning with the findings of Pelissari et al. [47]. Ammonia-oxidizing bacteria oxidize NH4+-N to NO2--N, thereby providing substrates for nitrite-oxidizing bacteria to oxidize NO2--N to NO3-N [48]. At the rear ends of HSSFCWs, a steady decrease was observed in the disparity between the absolute abundance of amoA and nxrA, indicating that the conversion rate of NH4+-N to NO2-N by ammonia-oxidizing bacteria was reduced in the rear ends of HSSFCWs.
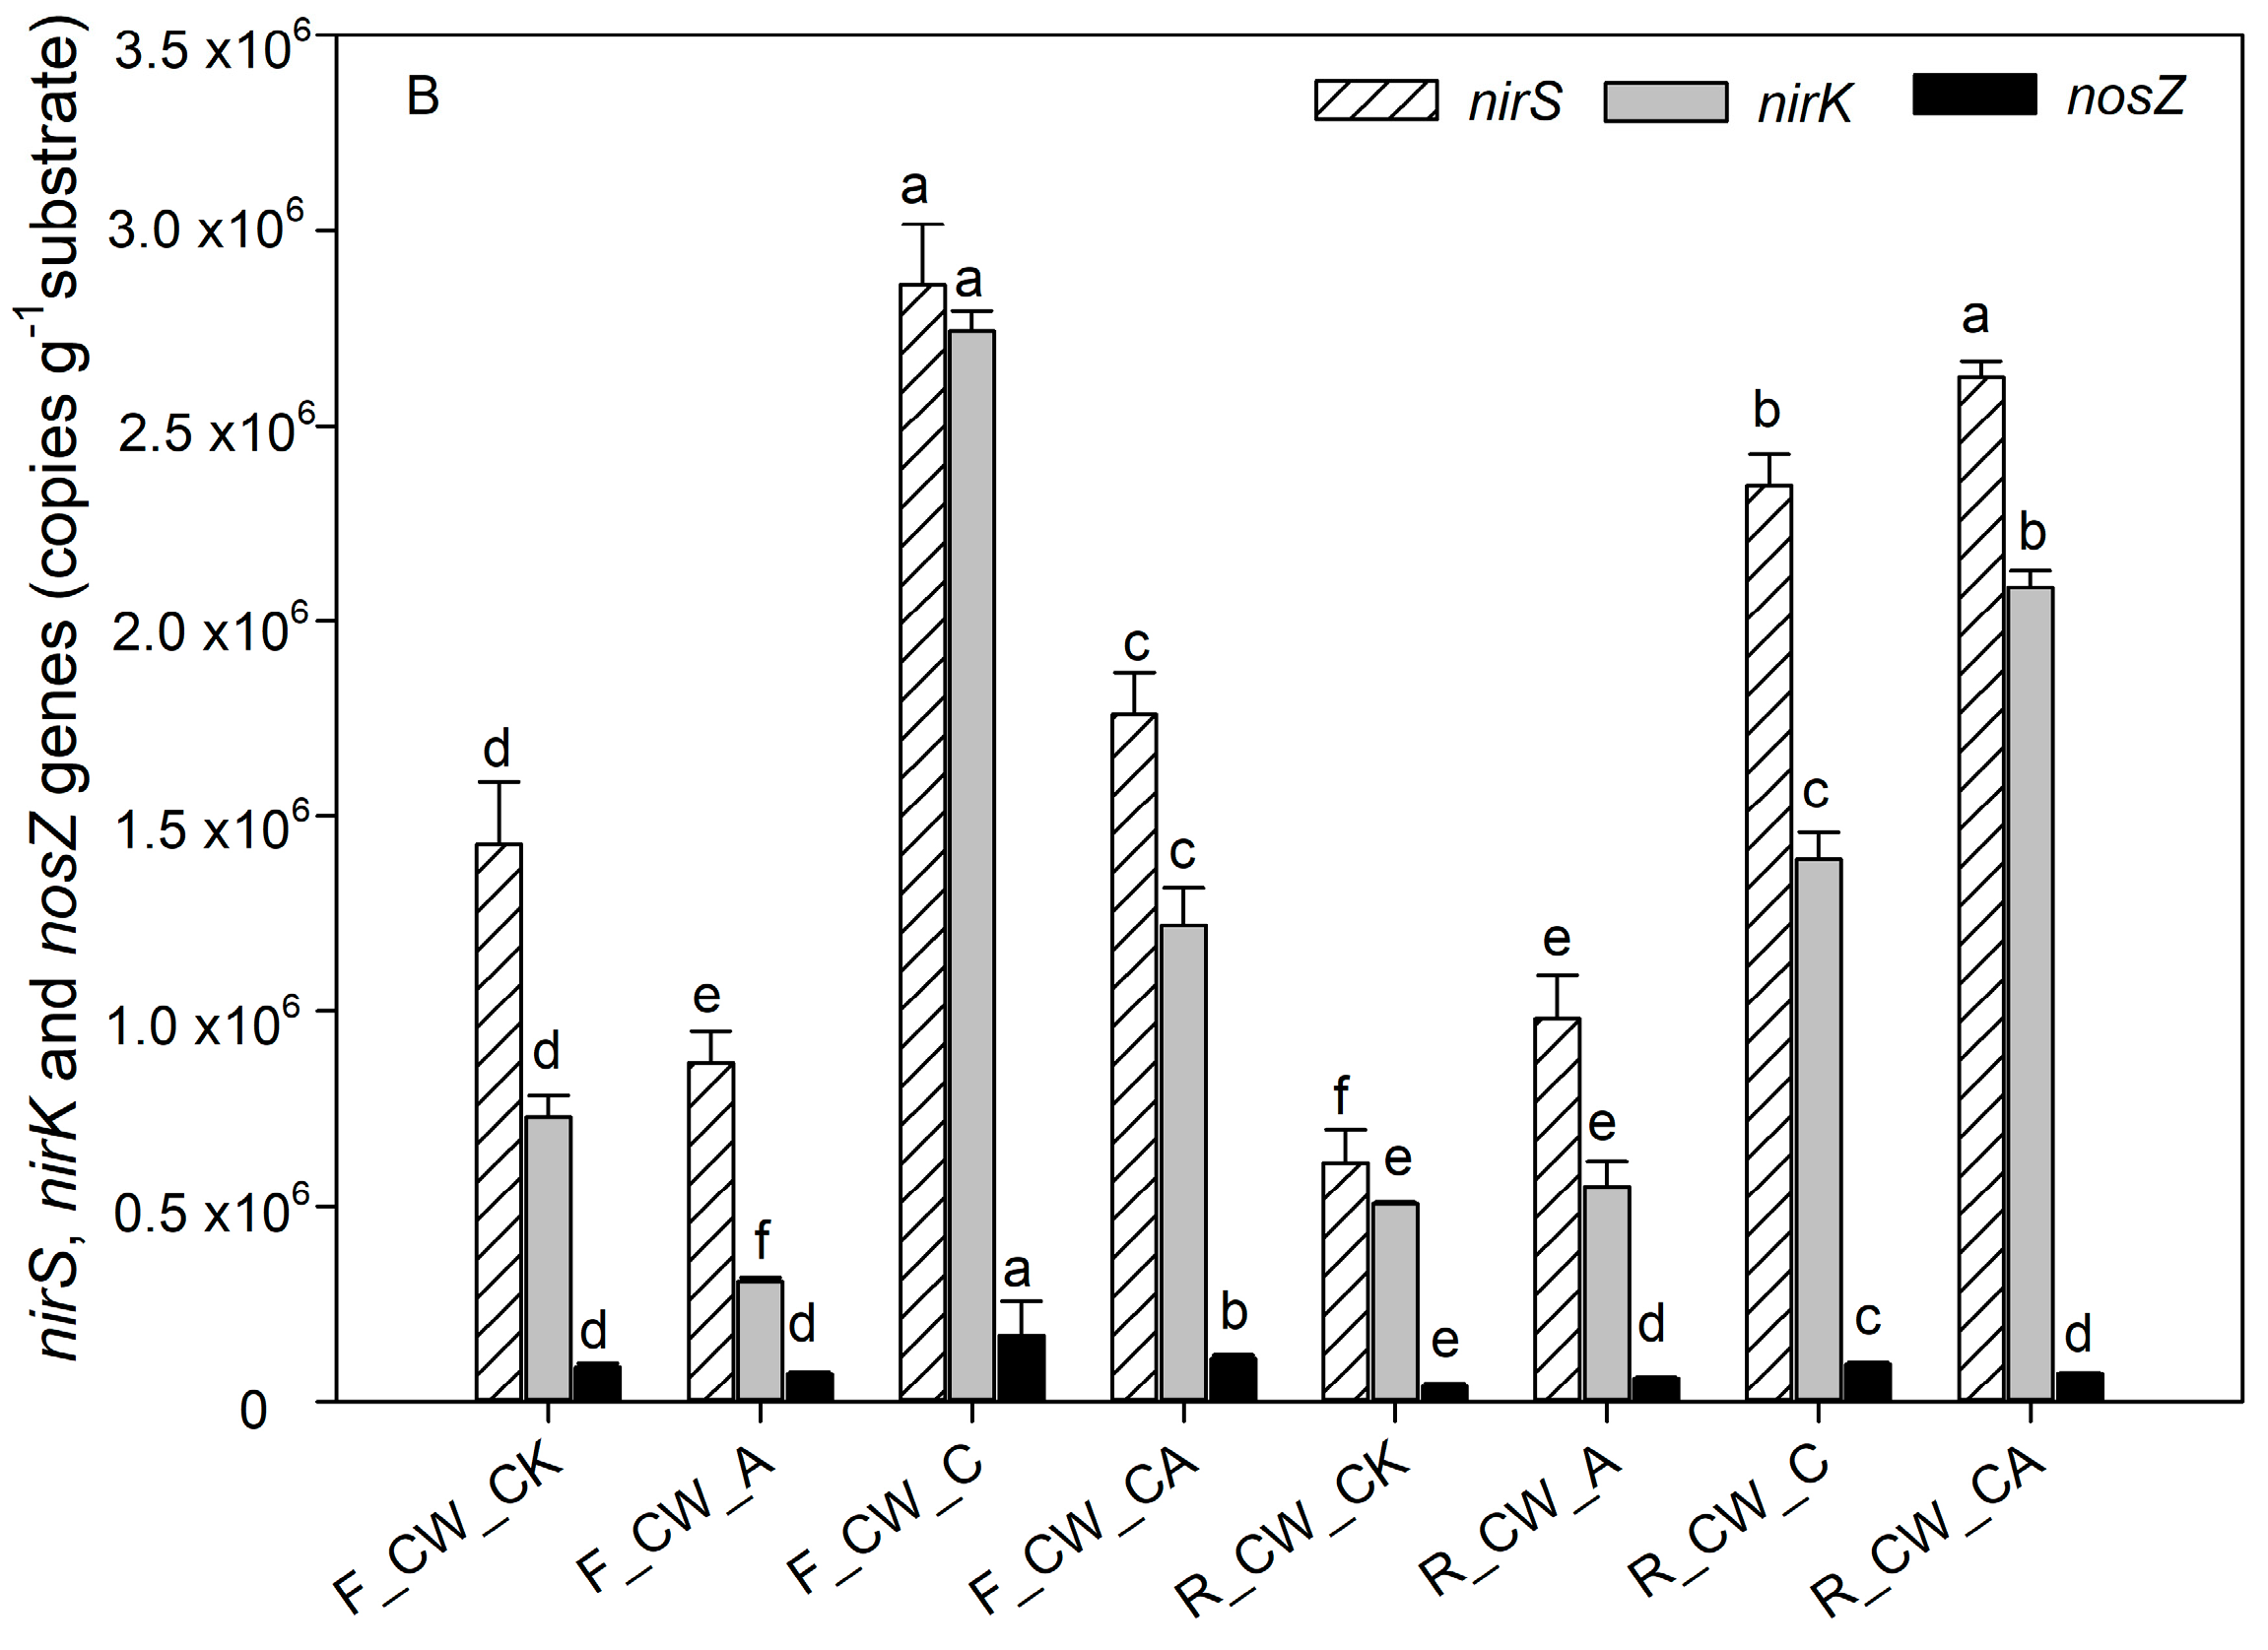
Denitrification is a stepwise process facilitated by reductase. The absolute abundances of nirS, nirK, and nosZ serve as strong indicators of denitrification activity [49]. nirS and nirK were the key genes related to the transformation of NO2 to NO, while the nosZ gene played a crucial role in the conversion from N2O to N2. The addition of carbon sources led to a rise in the abundance of these genes. The highest abundance of nirS and nirK at the fore end of HSSFCWs was observed in the CW_C treatment, reaching 2.86 × 10⁶ copies·g−1 substrate and 2.74 × 10⁶ copies·g−1 substrate, respectively. Comparable findings were also observed in the research by Hou et al. [50]; there was a notable increase in the absolute abundance of nirS and nirK when the COD/TN ratio ranged from 1 to 4 in the constructed wetlands. In addition to CW_C, CW_CA treatment also enhanced the gene abundance of nirS and nirK. Previous research also found that the absolute abundance of nirS and nirK significantly increased in the vertical subsurface flow constructed wetlands with limited aeration (1.00 L·min−1) when the COD/TN reached 9.4 [35]. The impact of an external carbon source on the abundance of nirS and nirK in aerated environments was complex, and it varied depending on the state of CWs. Compared to the absolute abundance of nirS and nirK at the fore ends of HSSFCWs, the absolute abundance of nirS and nirK in the CW_C treatment decreased at the rear ends of HSSFCWs, whereas it increased in the CW_CA treatment at the rear ends of HSSFCWs. These results were consistent with the variation in the abundance of denitrifying bacteria (Figure 3). At the rear ends of HSSFCWs, a higher absolute abundance of nirS and nirK was observed in CW_CA treatment compared to CW_C, suggesting that the CW_CA treatment was more conducive to the process of microbial denitrification at the rear ends of HSSFCWs. The high absolute abundance of the nosZ gene served as an indicator for complete heterotrophic denitrification [51]. The abundance of nosZ ranged from 4.03 × 10⁴ to 1.70 × 10⁵ copies·g−1 substrate. The highest absolute abundance of nosZ at both the fore and rear ends of HSSFCWs was observed in the CW_C treatment, suggesting that CW_C created favorable conditions for complete denitrification in HSSFCWs. Above all, treatments with carbon and aeration provided suitable conditions for the survival of microbes. CW_C and CW_A enhanced the removal rate of TN by amplifying bacteria and genes involved in nitrogen transformation at the fore ends of HSSFCWs. Nonetheless, CW_CA improved the removal rate of TN by increasing bacteria and genes related to nitrogen transformation at both the fore and rear ends of HSSFCWs.
Overall, the combination of aeration and carbon sources could improve the removal efficiency of nitrogen in treating the tail water of WWTPs. The removal rates of TN in the CW_A, CW_C and CW_CA treatments were 71.81%, 67.52% and 76.19%, respectively. CW_A increased the removal rate of TN by enhancing the relative abundance of nitrifier and genes related to nitrification in the fore ends of HSSFCWs. Similarly, CW_C improved the removal rate of TN by enhancing the relative abundance of denitrifying bacteria and genes related to denitrification in the fore ends of HSSFCWs. However, the denitrifying bacteria or nitrifiers as well as the related genes were less abundant than those of CW_C and CW_A at the fore ends of HSSFCWs, respectively. It remained unclear if the cooccurrence of aeration and external carbon sources adversely impact microorganisms. Therefore, more efforts are needed to explore a better approach for providing the DO and external carbon sources. For example, the devices for supplying DO and carbon sources were installed separately at the fore and rear ends of HSSFCWs, respectively. Furthermore, to reduce costs, it is crucial to delve deeper into novel carbon sources, such as the activated sludge fermentation liquid and plant fermentation liquid, leveraging their cost-effectiveness and waste recycling potential.

4. Conclusions

Constructed wetlands are an effective way to remove nitrogen from water, but the removal rate significantly depended on DO and the COD/TN ratio. Therefore, four treatment groups (CW_CA, CW_A, CW_C, and CW_CK) were designed in this study to explore the most suitable conditions for nitrogen removal. The highest removal rate of TN and NO3-N was observed in the CW_CA treatment, and CW_A significantly enhanced the removal rate of NH4+-N. Furthermore, the bacteria and functional genes related to nitrogen transformation also changed significantly under the condition of aeration and external carbon sources. For example, the relative abundance of nitrifiers and the absolute abundance of genes related to nitrification was increased in CW_A; the relative abundance of denitrifying bacteria and the absolute abundance of genes related to denitrification was increased in CW_C. Compared to CW_CK, the relative abundance of nitrifiers and denitrifying bacteria, as well as the absolute abundance of genes related to nitrification and denitrification all exhibited increase patterns in the CW_CA treatment at both fore and rear ends of HSSFCWs. The increase in these bacteria and functional genes related to nitrogen transformation, as well as the biotransformation of the nitrogen that occurred both in the fore and rear ends of HSSFCWs, promoted the removal of nitrogen in the CW_CA treatment. In summary, the research confirmed that the optimized conditions of HSSFCWs (with an aeration rate of 0.80 ± 0.02 L·min−1 and a COD/TN ratio of 5) could achieve the purification of the tail water of WWTP by optimizing the functional bacterial composition.

Supplementary Materials

The following supporting information can be downloaded at: https://www.mdpi.com/article/10.3390/w16050632/s1, Table S1: Functional bacteria for nitrogen removal at different treatments in the fore and rear end of HSSFCWs.

Author Contributions

H.Z.: Formal analysis, Investigation, Visualization, Writing—original draft. R.L.: Investigation, Data curation. Y.S.: Investigation, Data curation. F.P.: Methodology, Writing—review and editing, Funding acquisition. All authors have read and agreed to the published version of the manuscript.

Funding

This research was funded by [National Natural Science Foundation of China] grant number [41801089].

Data Availability Statement

Data are contained within the article and Supplementary Materials.

Conflicts of Interest

The authors declare no conflict of interest.

References

  1. Price, J.R.; Ledford, S.H.; Ryan, M.O.; Toran, L.; Sales, C.M. Wastewater treatment plant effluent introduces recoverable shifts in microbial community composition in receiving streams. Sci. Total Environ. 2018, 613–614, 1104–1116. [Google Scholar] [CrossRef]
  2. Vymazal, J. Constructed Wetlands for Wastewater Treatment: Five Decades of Experience. Environ. Sci. Technol. 2011, 45, 61–69. [Google Scholar] [CrossRef]
  3. Ding, Y.; Wang, W.; Song, X.; Wang, Y. Spatial distribution characteristics of environmental parameters and nitrogenous compounds in horizontal subsurface flow constructed wetland treating high nitrogen-content wastewater. Ecol. Eng. 2014, 70, 446–449. [Google Scholar] [CrossRef]
  4. Liu, G.; He, T.; Liu, Y.; Chen, Z.; Li, L.; Huang, Q.; Xie, Z.; Xie, Y.; Wu, L.; Liu, J. Study on the purification effect of aeration-enhanced horizontal subsurface-flow constructed wetland on polluted urban river water. Environ. Sci. Pollut. Res. 2019, 26, 12867–12880. [Google Scholar] [CrossRef]
  5. Zhang, F.; Ma, C.; Huang, X.; Liu, J.; Lu, L.; Peng, K.; Li, S. Research progress in solid carbon source-based denitrification technologies for different target water bodies. Sci. Total Environ. 2021, 782, 146669. [Google Scholar] [CrossRef]
  6. Wu, S.; Kuschk, P.; Brix, H.; Vymazal, J.; Dong, R. Development of constructed wetlands in performance intensifications for wastewater treatment: A nitrogen and organic matter targeted review. Water Res. 2014, 57, 40–55. [Google Scholar] [CrossRef]
  7. Ong, S.A.; Uchiyama, K.; Inadama, D.; Ishida, Y.; Yamagiwa, K. Performance evaluation of laboratory scale up-flow constructed wetlands with different designs and emergent plants. Bioresour. Technol. 2010, 101, 7239–7244. [Google Scholar] [CrossRef]
  8. Wang, R.; Zhao, X.; Liu, H.; Wu, H. Elucidating the impact of influent pollutant loadings on pollutants removal in agricultural waste-based constructed wetlands treating low C/N wastewater. Bioresour. Technol. 2019, 273, 529–537. [Google Scholar] [CrossRef]
  9. Wang, J.; Hou, J.; Xia, L.; Jia, Z.; He, X.; Li, D.; Zhou, Y. The combined effect of dissolved oxygen and COD/N on nitrogen removal and the corresponding mechanisms in intermittent aeration constructed wetlands. Biochem. Eng. J. 2020, 153, 107400. [Google Scholar] [CrossRef]
  10. Wu, H.; Fan, J.; Zhang, J.; Ngo, H.H.; Guo, W.; Hu, Z.; Lv, J. Optimization of organics and nitrogen removal in intermittently aerated vertical flow constructed wetlands: Effects of aeration time and aeration rate. Int. Biodeterior. Biodegrad. 2016, 113, 139–145. [Google Scholar] [CrossRef]
  11. Zhu, H.; Yan, B.; Xu, Y.; Guan, J.; Liu, S. Removal of nitrogen and COD in horizontal subsurface flow constructed wetlands under different influent C/N ratios. Ecol. Eng. 2014, 63, 58–63. [Google Scholar] [CrossRef]
  12. Chen, X.; Zhu, H.; Yan, B.; Shutes, B.; Tian, L.; Wen, H. Optimal influent COD/N ratio for obtaining low GHG emissions and high pollutant removal efficiency in constructed wetlands. J. Clean. Prod. 2020, 267, 122003. [Google Scholar] [CrossRef]
  13. Li, Y.H.; Li, H.B.; Xu, X.Y.; Wang, S.Q.; Pan, J. Does carbon-nitrogen ratio affect nitrous oxide emission and spatial distribution in subsurface wastewater infiltration system? Bioresour. Technol. 2018, 250, 846–852. [Google Scholar] [CrossRef]
  14. Fu, G.; Yu, T.; Ning, K.; Guo, Z.; Wong, M.-H. Effects of nitrogen removal microbes and partial nitrification-denitrification in the integrated vertical-flow constructed wetland. Ecol. Eng. 2016, 95, 83–89. [Google Scholar] [CrossRef]
  15. Vymazal, J. The use constructed wetlands with horizontal sub-surface flow for various types of wastewater. Ecol. Eng. 2009, 35, 1–17. [Google Scholar] [CrossRef]
  16. Fan, J.; Zhang, J.; Guo, W.; Liang, S.; Wu, H. Enhanced long-term organics and nitrogen removal and associated microbial community in intermittently aerated subsurface flow constructed wetlands. Bioresour. Technol. 2016, 214, 871–875. [Google Scholar] [CrossRef]
  17. Wu, H.; Ma, W.; Kong, Q.; Liu, H. Spatial-temporal dynamics of organics and nitrogen removal in surface flow constructed wetlands for secondary effluent treatment under cold temperature. Chem. Eng. J. 2018, 350, 445–452. [Google Scholar] [CrossRef]
  18. Sun, H.; Yang, Z.; Wei, C.; Wu, W. Nitrogen removal performance and functional genes distribution patterns in solid-phase denitrification sub-surface constructed wetland with micro aeration. Bioresour. Technol. 2018, 263, 223–231. [Google Scholar] [CrossRef]
  19. Ministry of Ecology and Environment of the People’s Republic of China. Technical Guide of Constructed Wetland Water Purification System; Ministry of Ecology and Environment of the People’s Republic of China: Beijing, China, 2021. [Google Scholar]
  20. GB 18918-2002; Discharge Standard of Pollutants for Municipal Wastewater Treatment Plant. Ministry of Ecology and Environment of the People’s Republic of China: Beijing, China, 2002.
  21. Wang, W.; Gao, J.; Guo, X.; Li, W.; Tian, X.; Zhang, R. Long-term effects and performance of two-stage baffled surface flow constructed wetland treating polluted river. Ecol. Eng. 2012, 49, 93–103. [Google Scholar] [CrossRef]
  22. Fu, G.; Huangshen, L.; Guo, Z.; Zhou, Q.; Wu, Z. Effect of plant-based carbon sources on denitrifying microorganisms in a vertical flow constructed wetland. Bioresour. Technol. 2017, 224, 214–221. [Google Scholar] [CrossRef]
  23. Jia, L.; Li, C.; Zhang, Y.; Chen, Y.; Li, M.; Wu, S.; Wu, H. Microbial community responses to agricultural biomass addition in aerated constructed wetlands treating low carbon wastewater. J. Environ. Manag. 2020, 270, 110912. [Google Scholar] [CrossRef]
  24. Lai, X.; Zhao, Y.; Pan, F.; Yang, B.; Wang, H.; Wang, S.; He, F. Enhanced optimal removal of nitrogen and organics from intermittently aerated vertical flow constructed wetlands: Relative COD/N ratios and microbial responses. Chemosphere 2020, 244, 125556. [Google Scholar] [CrossRef] [PubMed]
  25. Shen, Z.; Zhou, Y.; Wang, J. Comparison of denitrification performance and microbial diversity using starch/polylactic acid blends and ethanol as electron donor for nitrate removal. Bioresour. Technol. 2013, 131, 33–39. [Google Scholar] [CrossRef] [PubMed]
  26. Liu, H.; Hu, Z.; Zhang, Y.; Zhang, J.; Xie, H.; Liang, S. Microbial nitrogen removal of ammonia wastewater in poly (butylenes succinate)-based constructed wetland: Effect of dissolved oxygen. Appl. Microbiol. Biotechnol. 2018, 102, 9389–9398. [Google Scholar] [CrossRef]
  27. Li, H.; Liu, F.; Luo, P.; Chen, X.; Chen, J.; Huang, Z.; Peng, J.; Xiao, R.; Wu, J. Stimulation of optimized influent C:N ratios on nitrogen removal in surface flow constructed wetlands: Performance and microbial mechanisms. Sci. Total Environ. 2019, 694, 133575. [Google Scholar] [CrossRef]
  28. Song, S.; Pan, J.; Wu, S.; Guo, Y.; Yu, J.; Shan, Q. Effects of chemical oxygen demand (COD)/N ratios on pollutants removal in the subsurface wastewater infiltration systems with/without intermittent aeration. Water Sci. Technol. 2016, 73, 2662–2669. [Google Scholar] [CrossRef]
  29. Ding, Y.; Wang, W.; Liu, X.; Song, X.; Wang, Y.; Ullman, J.L. Intensified nitrogen removal of constructed wetland by novel integration of high rate algal pond biotechnology. Bioresour. Technol. 2016, 219, 757–761. [Google Scholar] [CrossRef]
  30. Zhou, X.; Wang, M.; Wen, C.; Liu, D. Nitrogen release and its influence on anammox bacteria during the decay of Potamogeton crispus with different values of initial debris biomass. Sci. Total Environ. 2019, 650, 604–615. [Google Scholar] [CrossRef]
  31. Wang, W.; Song, X.; Li, F.; Ji, X.; Hou, M. Intensified nitrogen removal in constructed wetlands by novel spray aeration system and different influent COD/N ratios. Bioresour. Technol. 2020, 306, 123008. [Google Scholar] [CrossRef] [PubMed]
  32. Hocaoglu, S.M.; Insel, G.; Cokgor, E.U.; Orhon, D. Effect of low dissolved oxygen on simultaneous nitrification and denitrification in a membrane bioreactor treating black water. Bioresour. Technol. 2011, 102, 4333–4340. [Google Scholar] [CrossRef]
  33. Ye, F.; Li, Y. Enhancement of nitrogen removal in towery hybrid constructed wetland to treat domestic wastewater for small rural communities. Ecol. Eng. 2009, 35, 1043–1050. [Google Scholar] [CrossRef]
  34. Zhou, X.; Wang, R.; Liu, H.; Wu, S.; Wu, H. Nitrogen removal responses to biochar addition in intermittent-aerated subsurface flow constructed wetland microcosms: Enhancing role and mechanism. Ecol. Eng. 2019, 128, 57–65. [Google Scholar] [CrossRef]
  35. Liu, F.F.; Fan, J.; Du, J.; Shi, X.; Zhang, J.; Shen, Y. Intensified nitrogen transformation in intermittently aerated constructed wetlands: Removal pathways and microbial response mechanism. Sci. Total Environ. 2019, 650, 2880–2887. [Google Scholar] [CrossRef] [PubMed]
  36. Zhang, S.; You, J.; An, N.; Zhao, J.; Wang, L.; Cheng, Z.; Ye, J.; Chen, D.; Chen, J. Gaseous toluene powered microbial fuel cell: Performance, microbial community, and electron transfer pathway. Chem. Eng. J. 2018, 351, 515–522. [Google Scholar] [CrossRef]
  37. Shu, D.; He, Y.; Yue, H.; Wang, Q. Metagenomic and quantitative insights into microbial communities and functional genes of nitrogen and iron cycling in twelve wastewater treatment systems. Chem. Eng. J. 2016, 290, 21–30. [Google Scholar] [CrossRef]
  38. Chen, D.; Gu, X.; Zhu, W.; He, S.; Huang, J.; Zhou, W. Electrons transfer determined greenhouse gas emissions in enhanced nitrogen-removal constructed wetlands with different carbon sources and carbon-to-nitrogen ratios. Bioresour. Technol. 2019, 285, 121313. [Google Scholar] [CrossRef] [PubMed]
  39. Yang, Z.; Yang, L.; Wei, C.; Wu, W.; Zhao, X.; Lu, T. Enhanced nitrogen removal using solid carbon source in constructed wetland with limited aeration. Bioresour. Technol. 2018, 248, 98–103. [Google Scholar] [CrossRef]
  40. Gao, L.; Zhou, W.; Huang, J.; He, S.; Yan, Y.; Zhu, W.; Wu, S.; Zhang, X. Nitrogen removal by the enhanced floating treatment wetlands from the secondary effluent. Bioresour. Technol. 2017, 234, 243–252. [Google Scholar] [CrossRef]
  41. Button, M.; Nivala, J.; Weber, K.P.; Aubron, T.; Muller, R.A. Microbial community metabolic function in subsurface flow constructed wetlands of different designs. Ecol. Eng. 2015, 80, 162–171. [Google Scholar] [CrossRef]
  42. Liu, L.; Li, N.; Tao, C.; Zhao, Y.; Gao, J.; Huang, Z.; Zhang, J.; Gao, J.; Zhang, J.; Cai, M. Nitrogen removal performance and bacterial communities in zeolite trickling filter under different influent C/N ratios. Environ. Sci. Pollut. Res. Int. 2020, 28, 15909–15922. [Google Scholar] [CrossRef]
  43. Zhu, T.; Gao, J.; Huang, Z.; Shang, N.; Gao, J.; Zhang, J.; Cai, M. Comparison of performance of two large-scale vertical-flow constructed wetlands treating wastewater treatment plant tail-water: Contaminants removal and associated microbial community. J. Environ. Manag. 2021, 278, 111564. [Google Scholar] [CrossRef] [PubMed]
  44. Xia, Z.; Liu, G.; She, Z.; Gao, M.; Zhao, Y.; Guo, L.; Jin, C. Performance and bacterial communities in unsaturated and saturated zones of a vertical-flow constructed wetland with continuous-feed. Bioresour. Technol. 2020, 315, 123859. [Google Scholar] [CrossRef] [PubMed]
  45. Coban, O.; Kuschk, P.; Kappelmeyer, U.; Spott, O.; Martienssen, M.; Jetten, M.S.; Knoeller, K. Nitrogen transforming community in a horizontal subsurface-flow constructed wetland. Water Res. 2015, 74, 203–212. [Google Scholar] [CrossRef] [PubMed]
  46. Hu, Y.; He, F.; Ma, L.; Zhang, Y.; Wu, Z. Microbial nitrogen removal pathways in integrated vertical-flow constructed wetland systems. Bioresour. Technol. 2016, 207, 339–345. [Google Scholar] [CrossRef]
  47. Pelissari, C.; Avila, C.; Trein, C.M.; Garcia, J.; de Armas, R.D.; Sezerino, P.H. Nitrogen transforming bacteria within a full-scale partially saturated vertical subsurface flow constructed wetland treating urban wastewater. Sci. Total Environ. 2017, 574, 390–399. [Google Scholar] [CrossRef]
  48. Fan, J.; Zhang, B.; Zhang, J.; Ngo, H.H.; Guo, W.; Liu, F.; Guo, Y.; Wu, H. Intermittent aeration strategy to enhance organics and nitrogen removal in subsurface flow constructed wetlands. Bioresour. Technol. 2013, 141, 117–122. [Google Scholar] [CrossRef]
  49. Li, J.; Wang, J.T.; Hu, H.W.; Cai, Z.J.; Lei, Y.R.; Li, W.; Zhang, M.Y.; Li, Z.M.; Zhu, Y.N.; Cui, L.J. Changes of the denitrifying communities in a multi-stage free water surface constructed wetland. Sci. Total Environ. 2019, 650, 1419–1425. [Google Scholar] [CrossRef]
  50. Hou, J.; Wang, X.; Wang, J.; Xia, L.; Zhang, Y.; Li, D.; Ma, X. Pathway governing nitrogen removal in artificially aerated constructed wetlands: Impact of aeration mode and influent chemical oxygen demand to nitrogen ratios. Bioresour. Technol. 2018, 257, 137–146. [Google Scholar] [CrossRef]
  51. Harter, J.; Krause, H.M.; Schuettler, S.; Ruser, R.; Fromme, M.; Scholten, T.; Kappler, A.; Behrens, S. Linking N2O emissions from biochar-amended soil to the structure and function of the N-cycling microbial community. ISME J. 2014, 8, 660–674. [Google Scholar] [CrossRef] [PubMed]
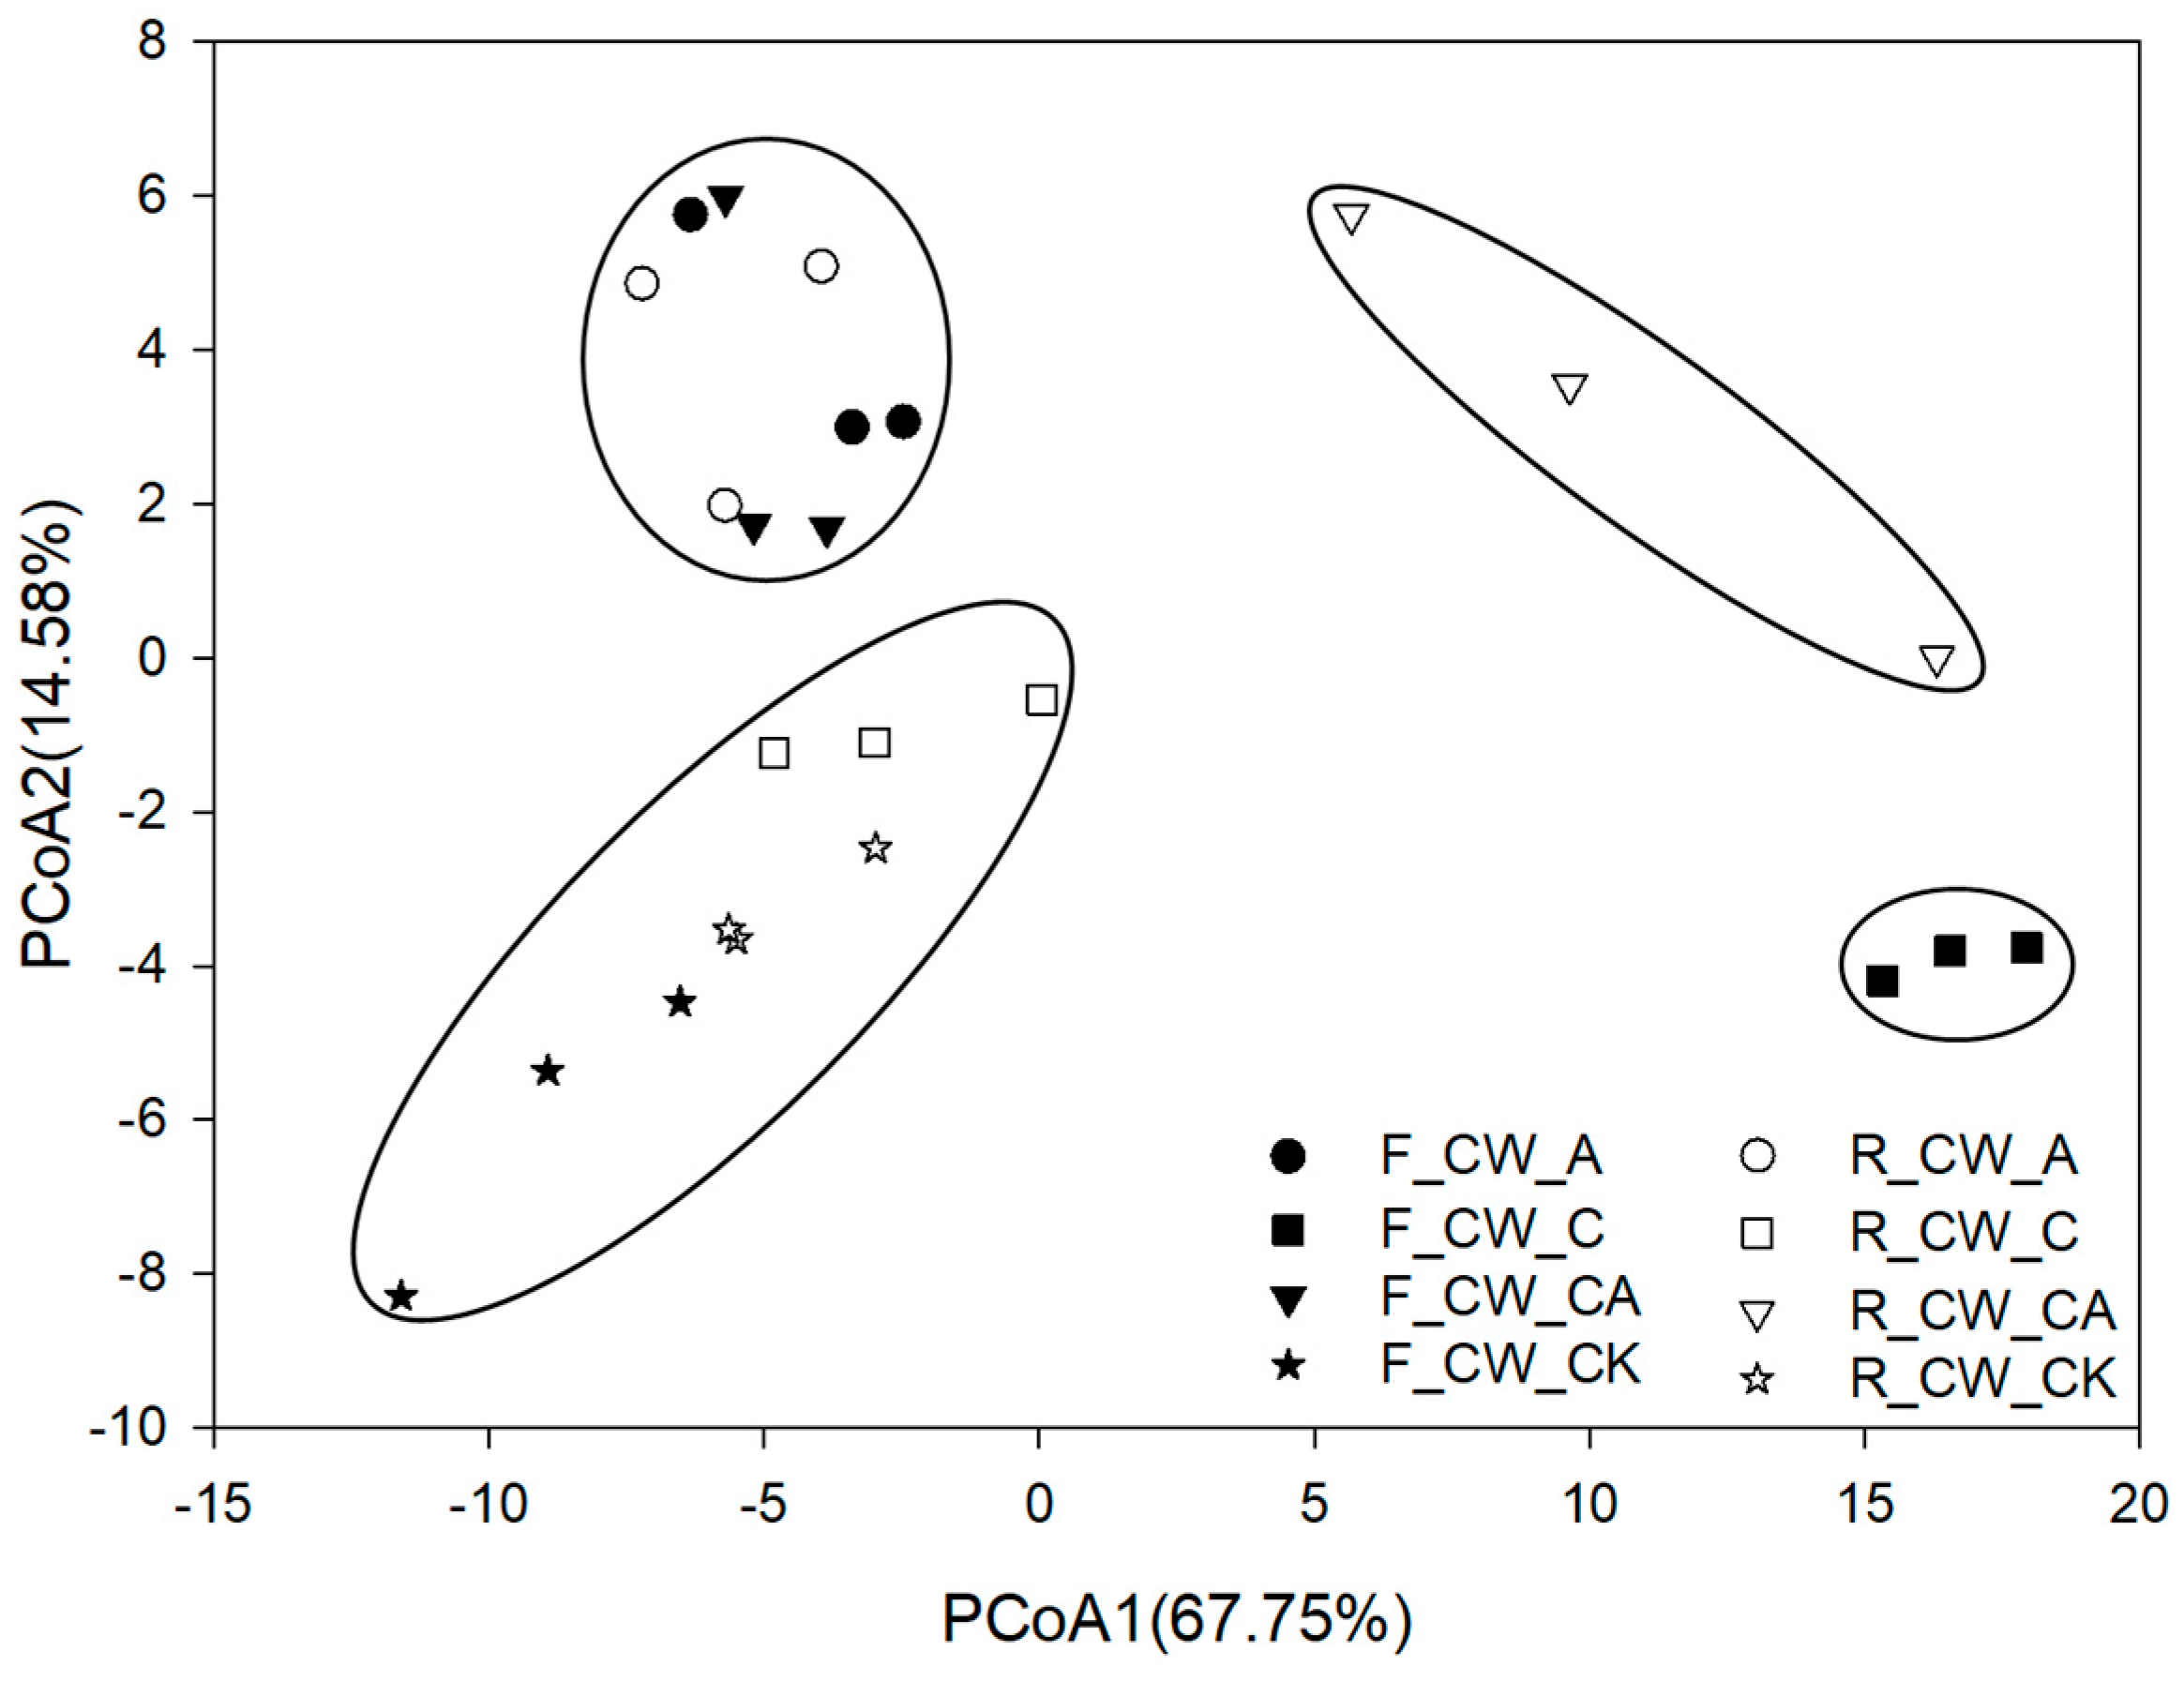
Figure 1. Principal coordinate analysis of bacterial community composition at phylum level. Treatments are as given in Table. 2. Values in parentheses on the axis labels indicate the percentage variation accounted for by each axis.
Water 16 00632 g001
Figure 2. The relative abundances of bacterial communities at the phylum level in the substrates of different constructed wetlands. The phyla not included among the top 10 in the bacterial composition were defined as others. Treatments are as given in Table 2.
Water 16 00632 g002
Figure 3. Relative abundance of functional genera (ammonia-oxidizing bacteria, nitrite-oxidizing bacteria, denitrifying bacteria, anaerobic ammonium-oxidizing bacteria) in different treatments. Treatments are as given in Table 2. AMX in the figure represents anaerobic ammonium-oxidizing bacteria.
Water 16 00632 g003
Figure 4. The absolute abundance of nitrogen-related functional genes based on q-PCR analysis in four HSSFCWs: (A) nitrification-related genes (amoA and nxrA), (B) denitrification-related genes (nirS, nirK and nosZ). Error bars are the standard errors. Different letters for the same gene represent significant differences among the samples (p < 0.05). Treatments are as given in Table 2.
Water 16 00632 g004aWater 16 00632 g004b
Table 1. The average effluent concentration and removal efficiency in four treatments.
Item Effluent Concentration Removal Rate (%)
CW_CKCW_ACW_CCW_CACW_CKCW_ACW_CCW_CA
COD (mg·L−1)20.79 ± 0.76b16.86 ± 1.04c30.01 ± 1.13a21.74 ± 0.91b48.02 ± 1.61b57.84 ± 1.52a53.83 ± 1.27b66.56 ± 1.32a
NH4+-N (mg·L−1)0.70 ± 0.03a0.47 ± 0.01b0.78 ± 0.03a0.53 ± 0.02b64.78 ± 1.14b76.27 ± 2.06a61.21 ± 1.52b73.51 ± 1.65a
NO3-N (mg·L−1)4.02 ± 0.13b4.76 ± 0.24a2.52 ± 0.32c2.38 ± 0.24c65.01 ± 1.97b58.59 ± 2.58c78.07 ± 2.28a79.31 ± 2.82a
TN (mg·L−1)4.77 ± 0.38a3.66 ± 0.13c4.22 ± 0.41b3.10 ± 0.21d63.28 ± 1.38d71.81 ± 1.29b67.52 ± 2.77c76.19 ± 2.19a
DO (mg·L−1)0.50 ± 0.01b1.81 ± 0.05a0.10 ± 0.01c1.69 ± 0.03a----
pH7.57 ± 0.01a7.48 ± 0.01a7.46 ± 0.01a7.56 ± 0.01a----
Note: Mean ± SD, n = 40. Different letters indicate significant differences among the four treatments of the effluent concentration or removal rate at p < 0.05. CW_CK, CW_A, CW_C, and CW_CA represent control, aeration treatment, external carbon source treatment, aeration, and external carbon source treatment.
Table 2. Bacterial richness and diversity indices of different treatments.
TreatmentsObserved_SpeciesChao1ShannonSimpson
F_CW_CK2373 ± 146a3778 ± 252a9.76 ± 0.199a0.996 ± 0.001a
F_CW_A2336 ± 231a3695 ± 347a9.66 ± 0.388a0.994 ± 0.003a
F_CW_C2064 ± 55b3482 ± 251b8.50 ± 0.089b0.973 ± 0.003b
F_CW_CA2495 ± 111a3919 ± 230a9.94 ± 0.015a0.997 ± 0.001a
R_CW_CK2187 ± 115b3616 ± 309b9.739 ± 0.098a0.997 ± 0.002a
R_CW_A2353 ± 94a4104 ± 201a9.740 ± 0.141a0.995 ± 0.001a
R_CW_C2450 ± 44a4134 ± 288a10.099 ± 0.034a0.998 ± 0.001a
R_CW_CA2478 ± 199a4326 ± 104a9.163 ± 1.144b0.964 ± 0.052b
Note: ±indicates standard deviation. Different letters of each column represent significant differences among the samples (p < 0.05). F_CW_CK, F_CW_A, F_CW_C, and F_CW_CA represent the treatment of control, aeration treatment, carbon adding treatment, and a combination of aeration and carbon source at the fore ends of HSSFCWs. R_CW_CK, R_CW_A, R_CW_C, and R_CW_CA represent the treatment of control, aeration treatment, carbon adding treatment, and a combination of aeration and carbon source at the rear ends of HSSFCWs.
Disclaimer/Publisher’s Note: The statements, opinions and data contained in all publications are solely those of the individual author(s) and contributor(s) and not of MDPI and/or the editor(s). MDPI and/or the editor(s) disclaim responsibility for any injury to people or property resulting from any ideas, methods, instructions or products referred to in the content.