
Kinetics of Decolorization of Reactive Textile Dye via Heterogeneous Photocatalysis Using Titanium Dioxide

 , , , and
Abstract
1. Introduction
2. Materials and Methods
2.1. Materials, Equipment, and Reagents
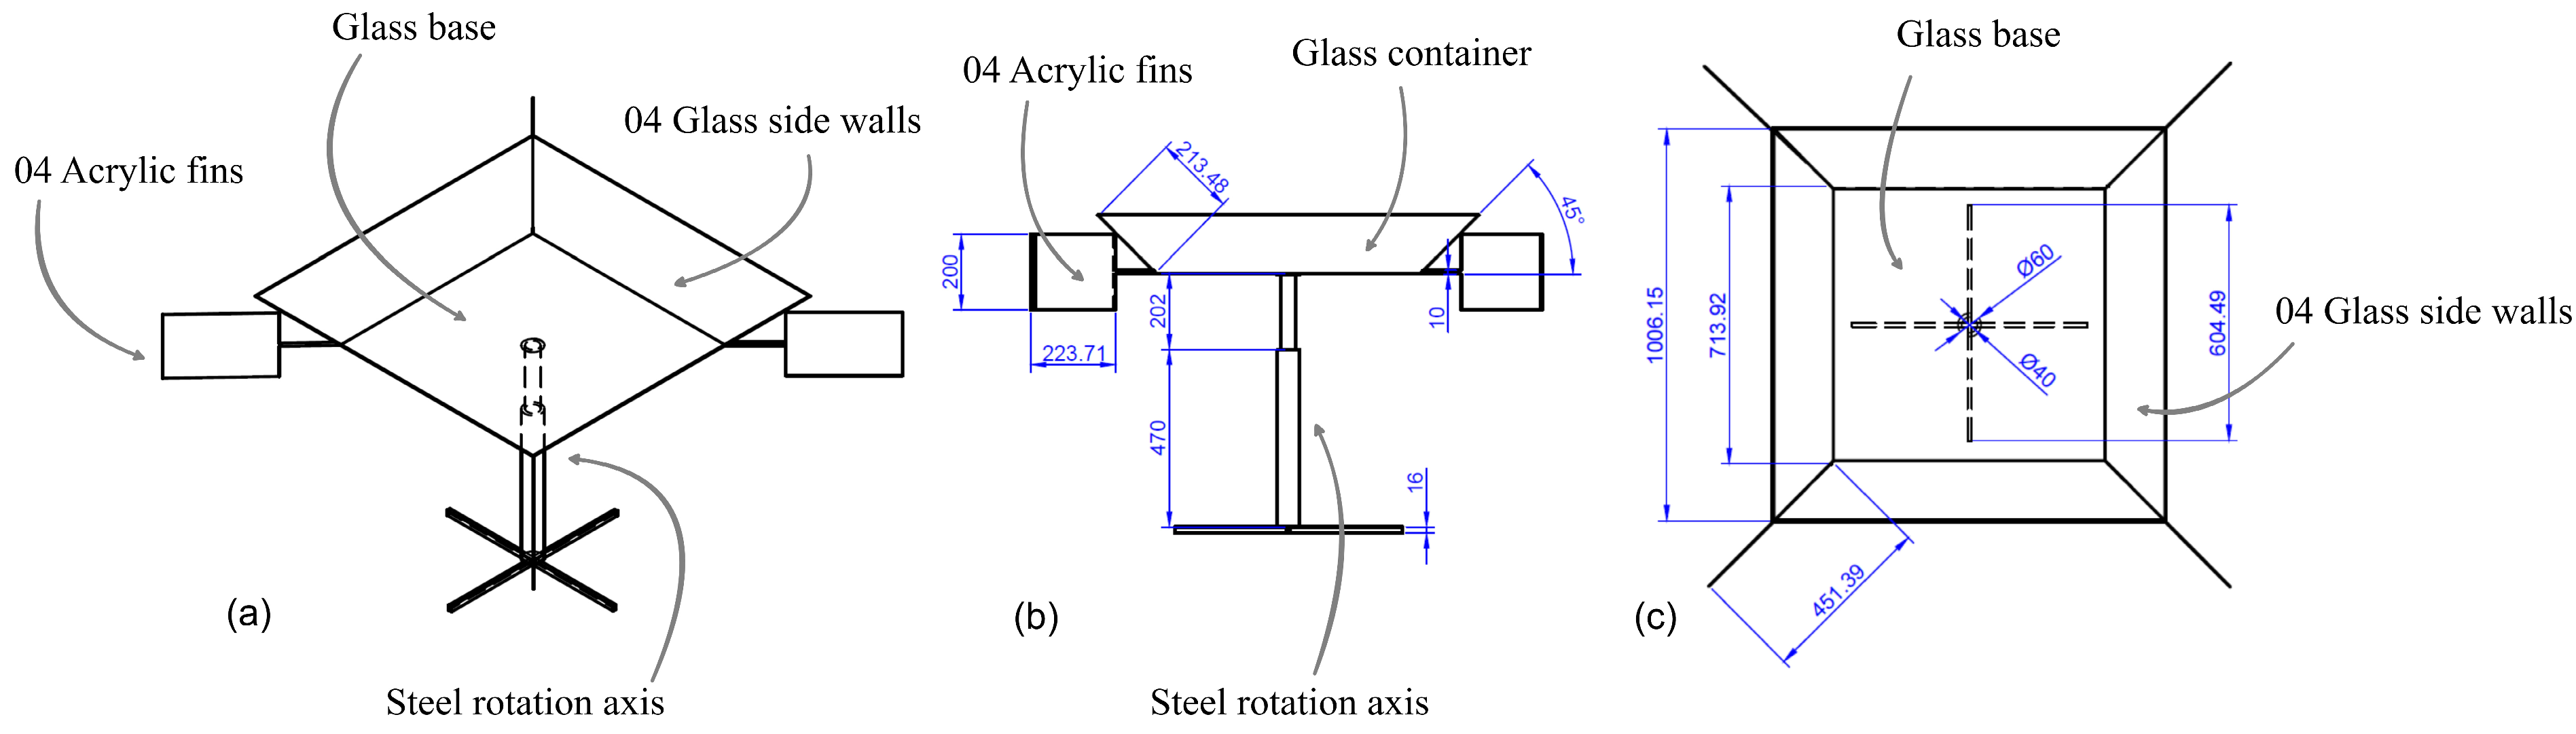
2.2. Design of the Mini Eolic Turbins
2.3. Design of the Mobile Equipment for the Reactors
2.4. Experimental Procedure
2.5. Analysis and Data Treatment
- : Reaction rate constant (ppm/s)
- : Adsorption rate constant (ppm−1)
- : Dye concentration (ppm)
- r: Reaction speed (ppm/s)
3. Results
3.1. Data Collection
3.1.1. Solar Radiation Record
3.1.2. Data and Analysis of the Dye Solutions
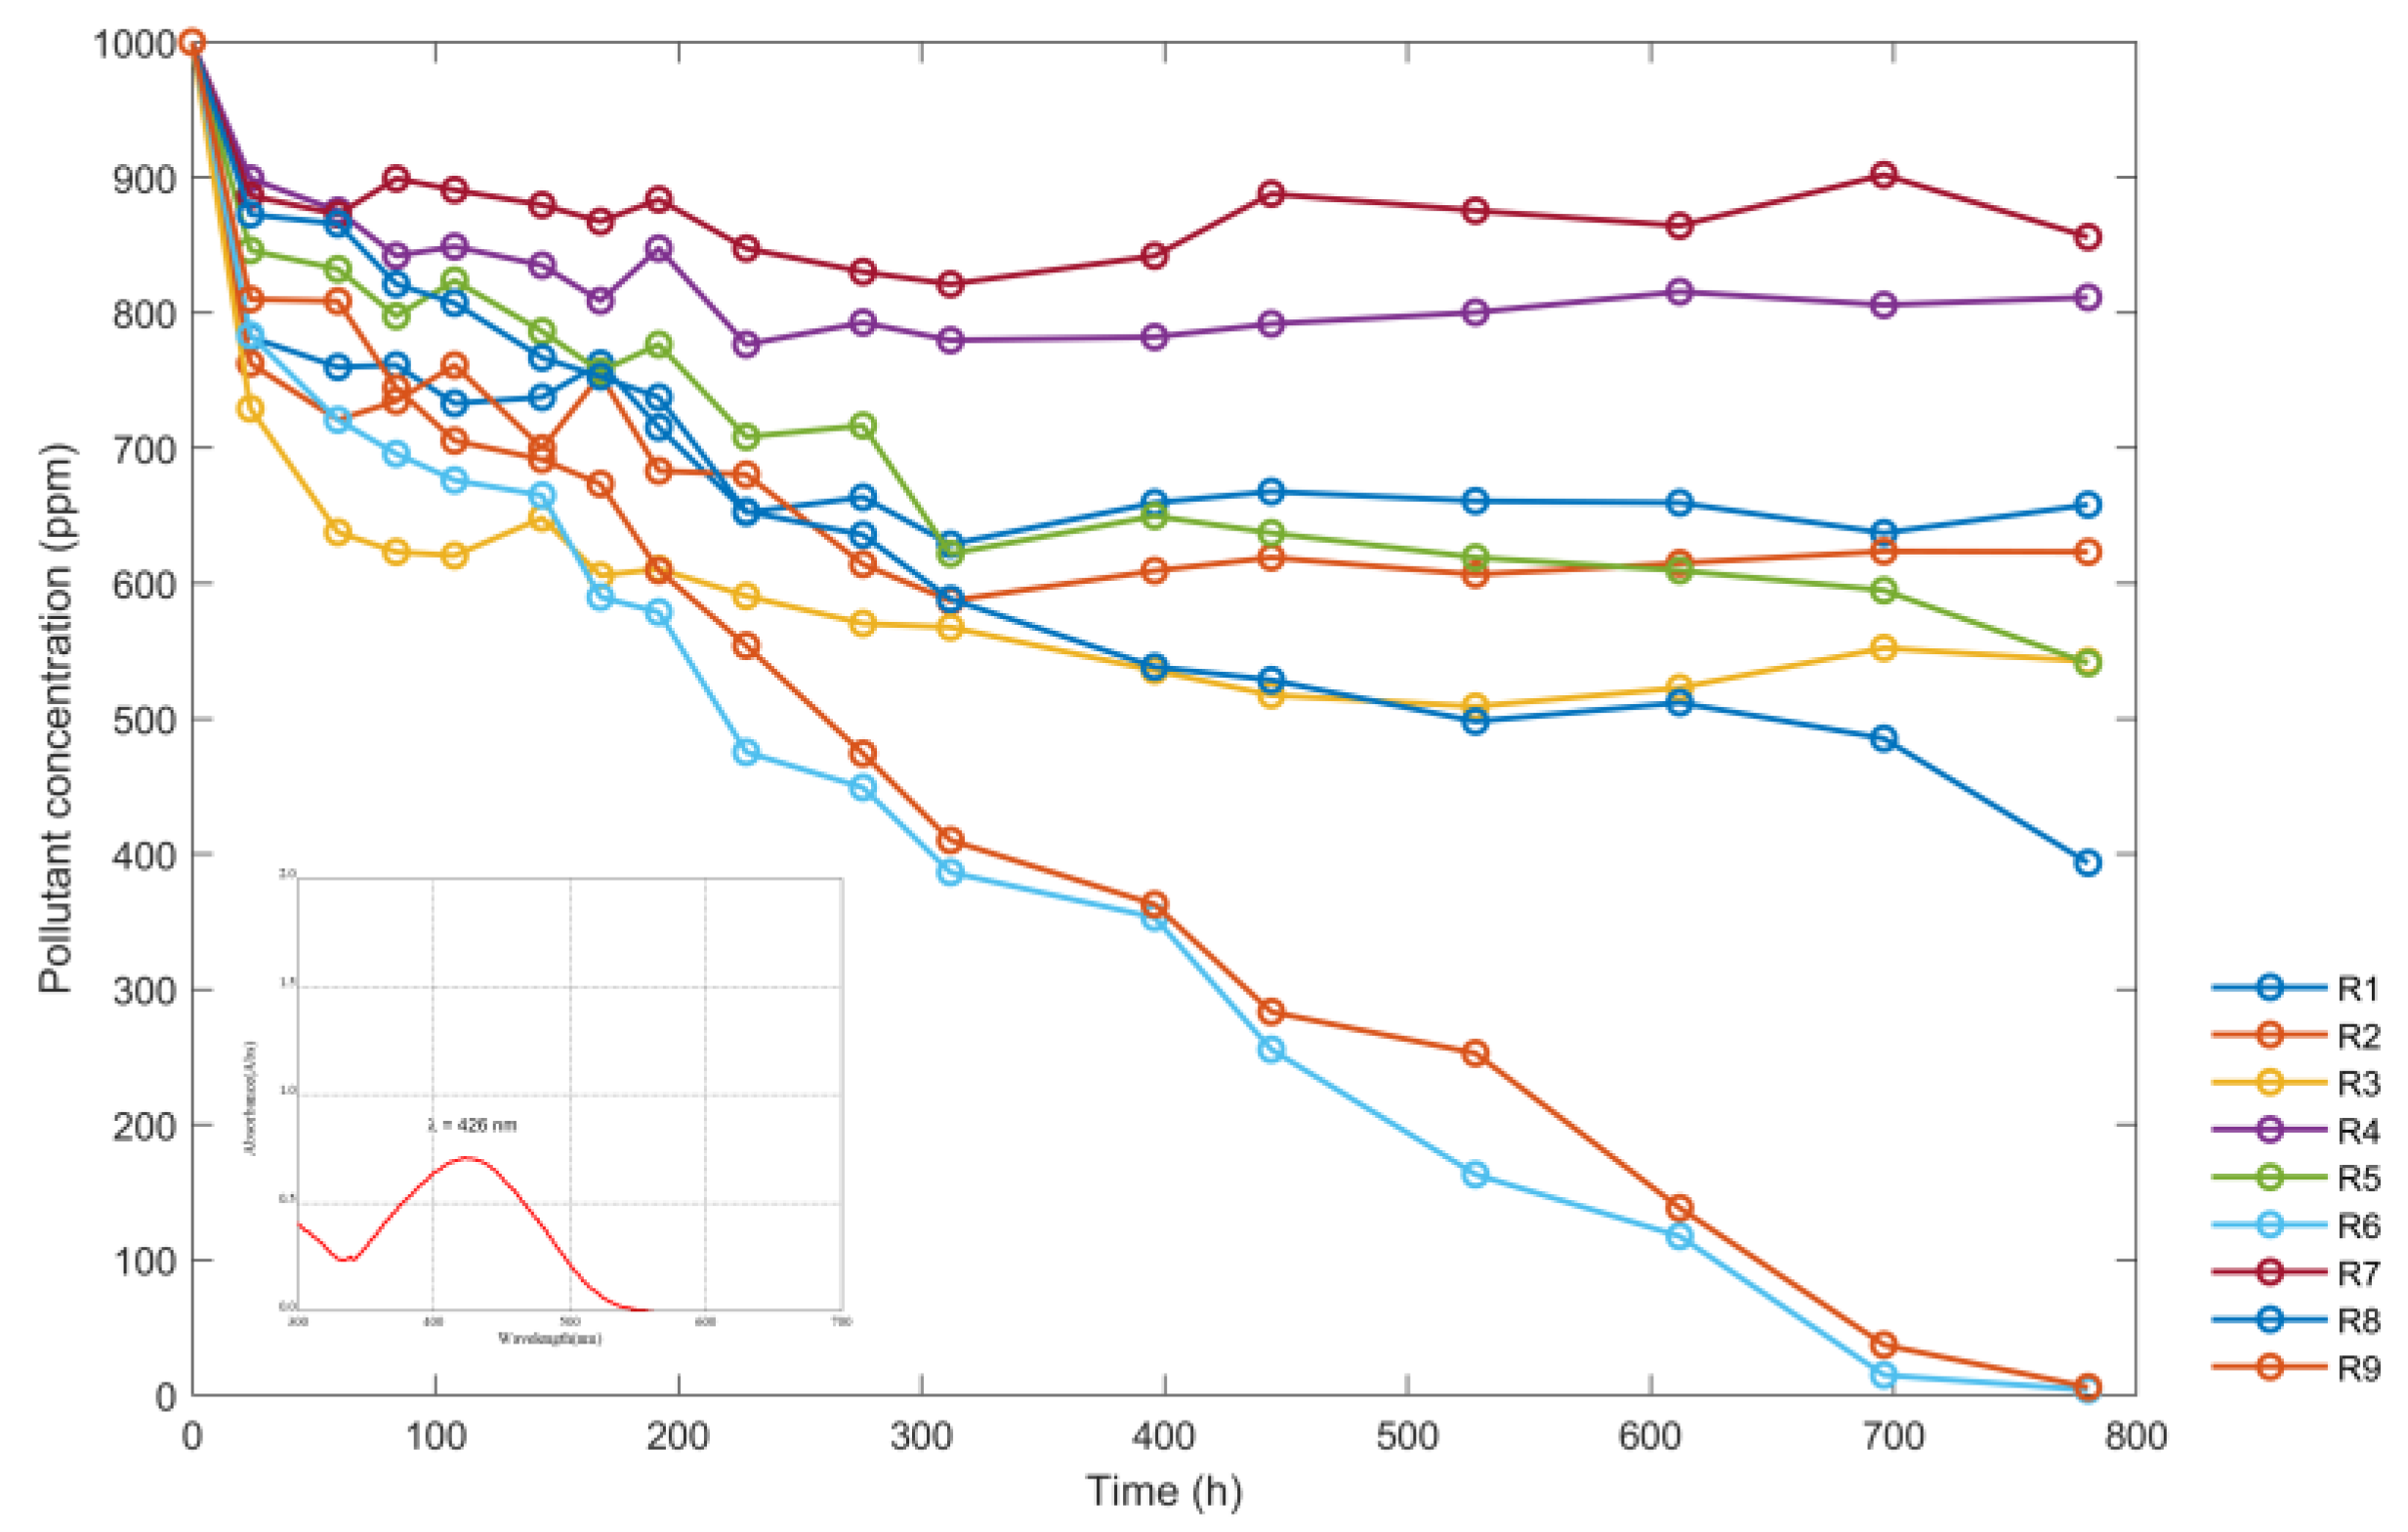
3.1.3. Analysis Data of the Sumireact Supra Yellow s-hbu Solutions
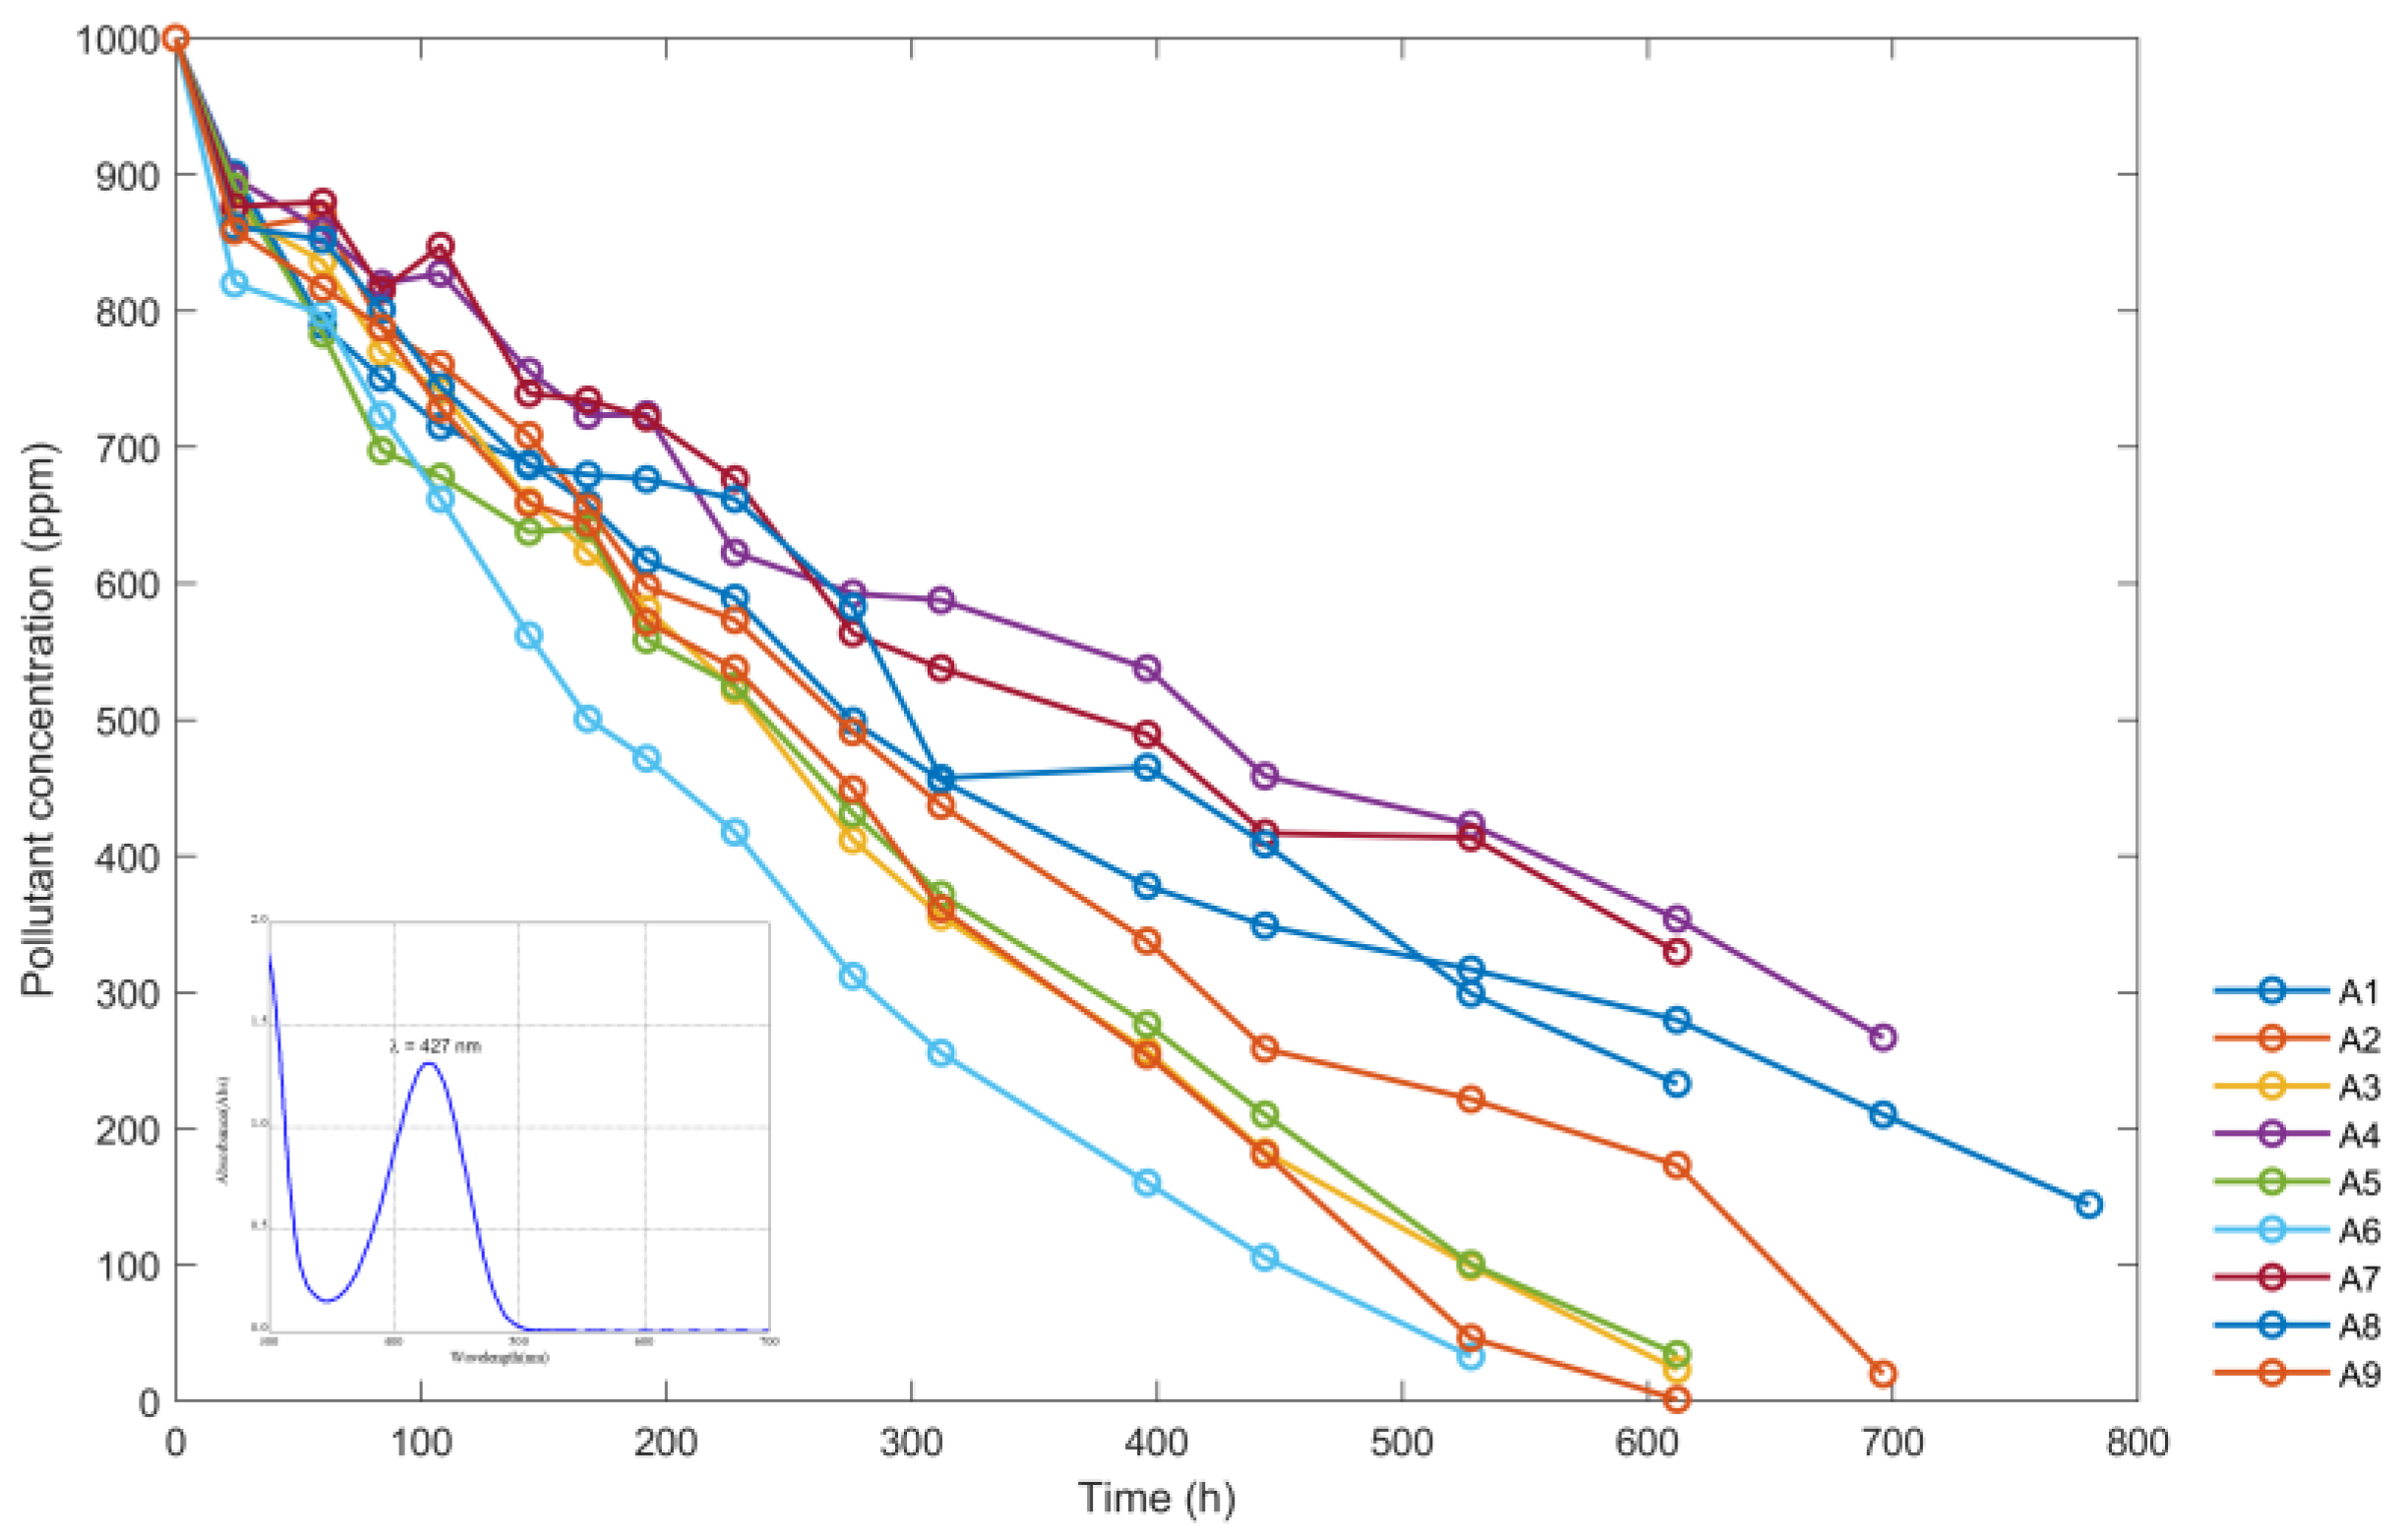
3.1.4. Data Analysis for the Sumifix Supra Lemon-Yellow e-xf Solutions
3.2. Discoloration Kinetics
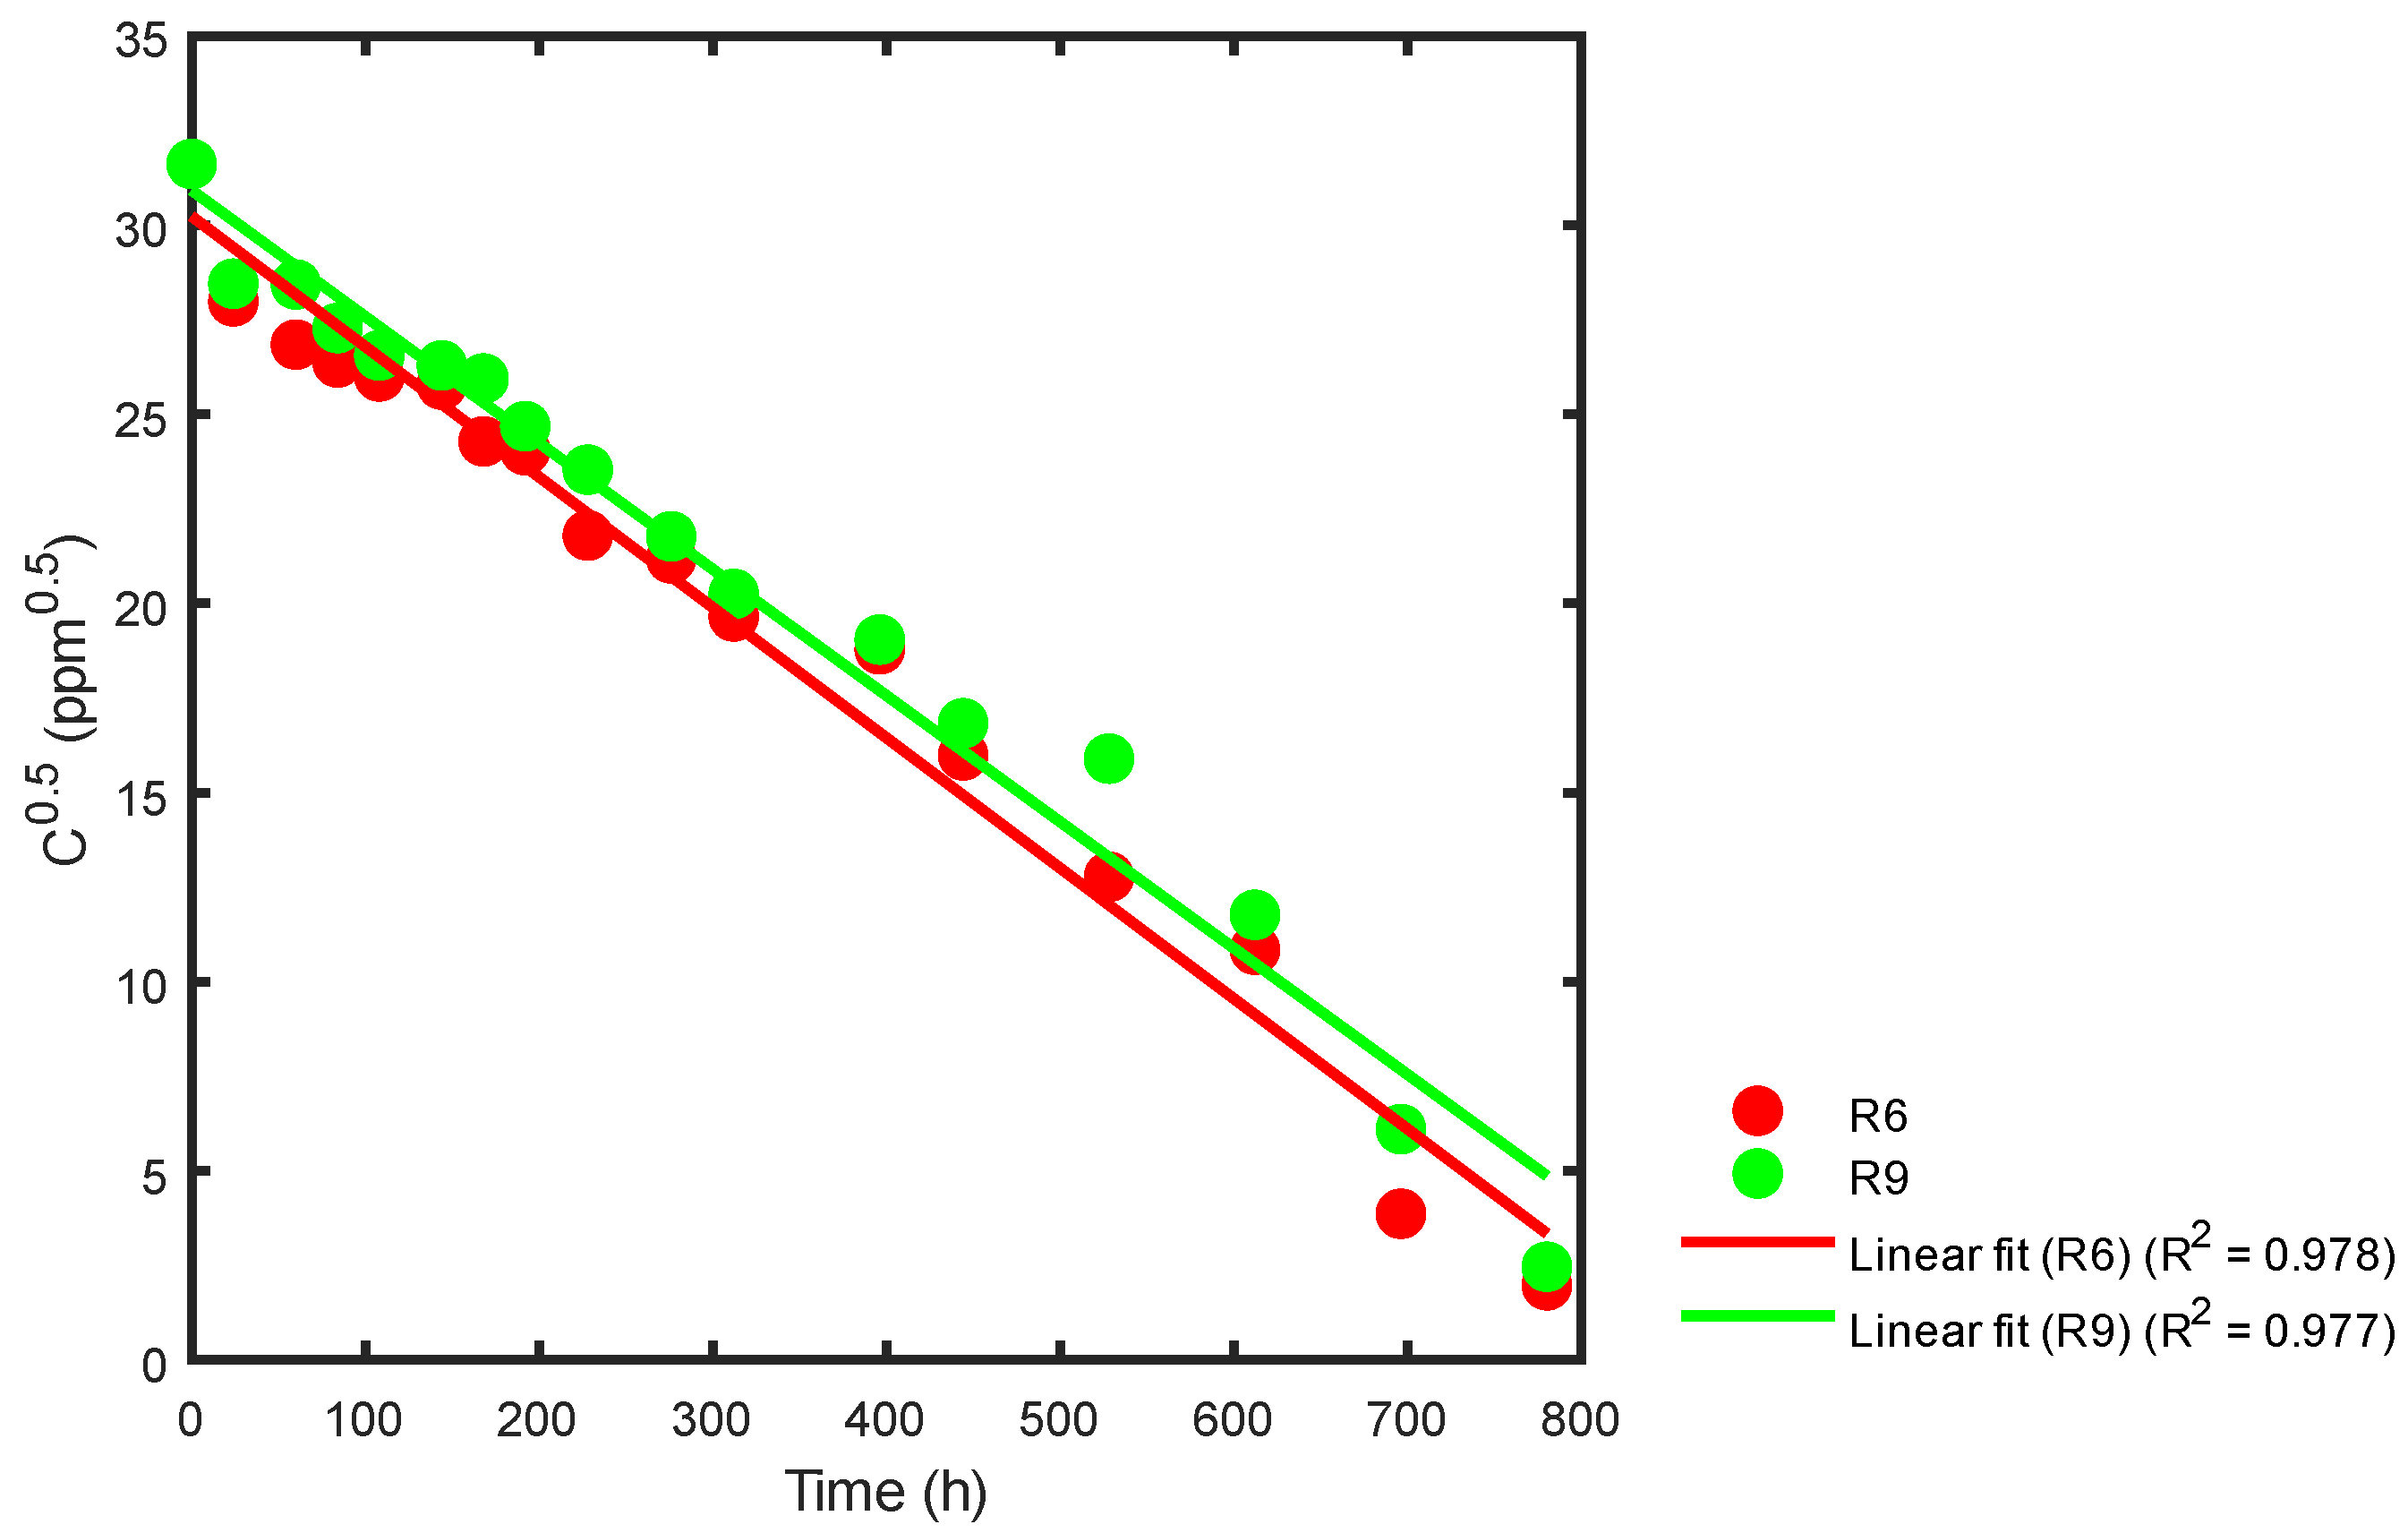
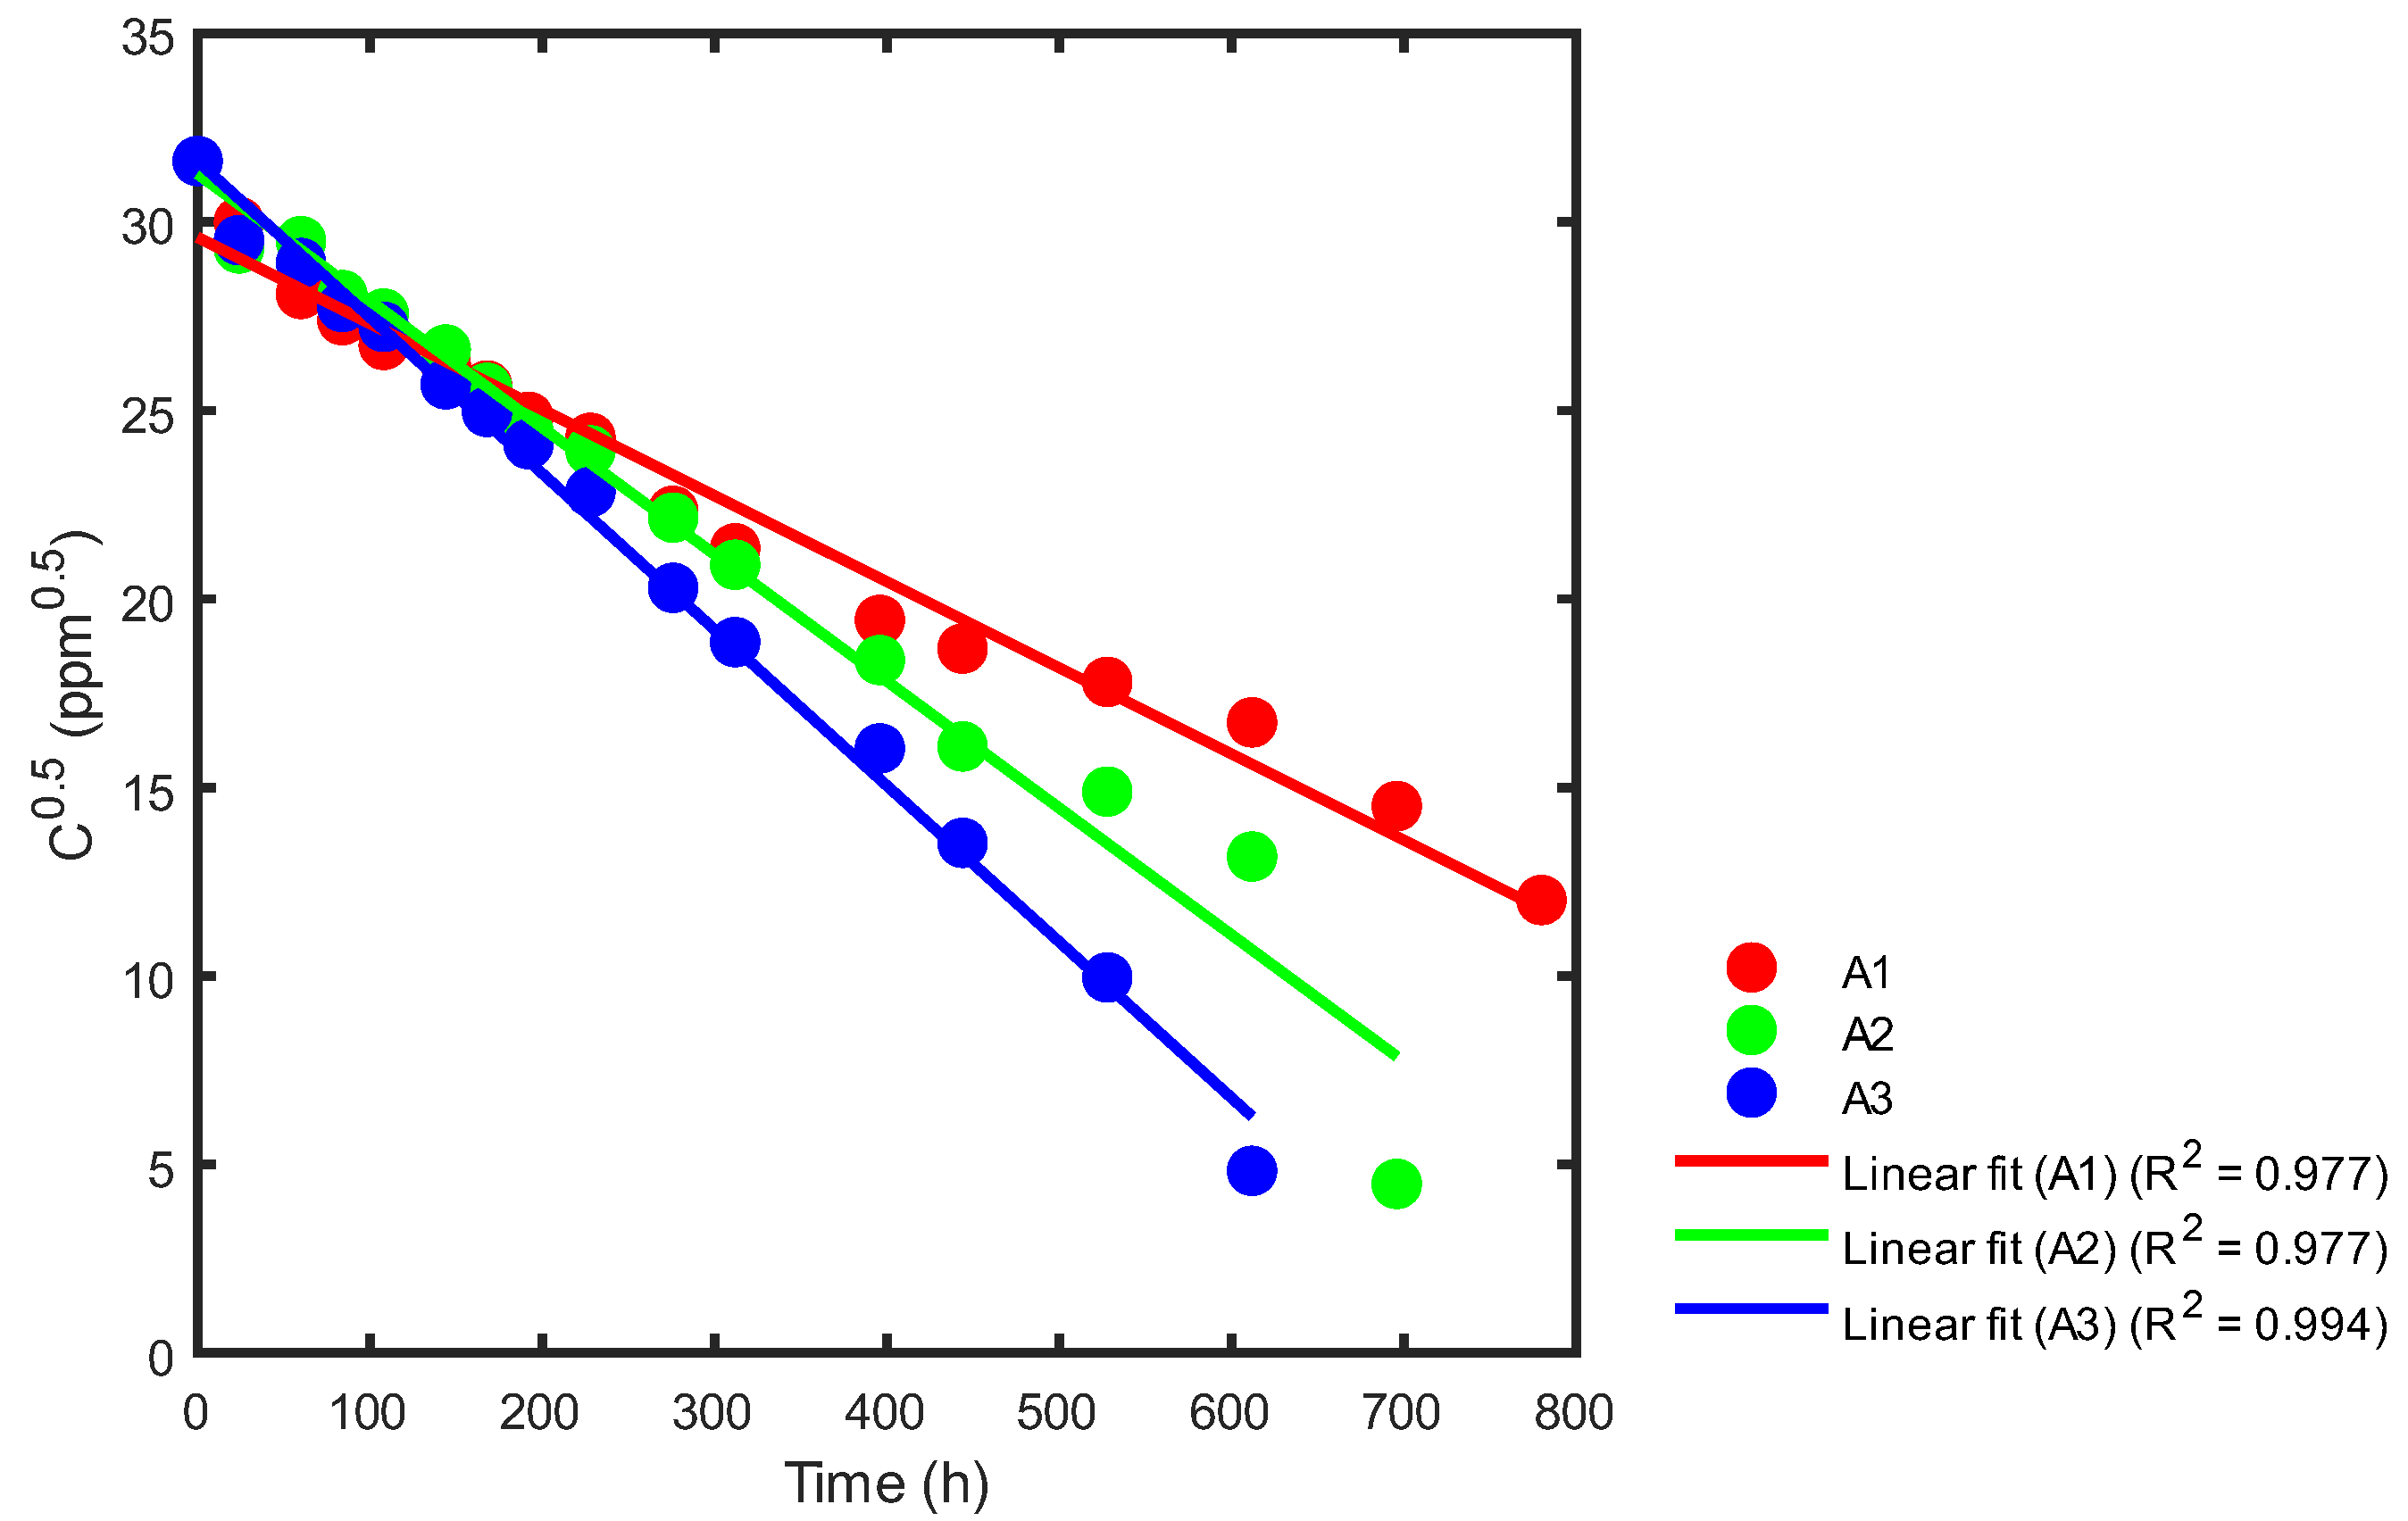
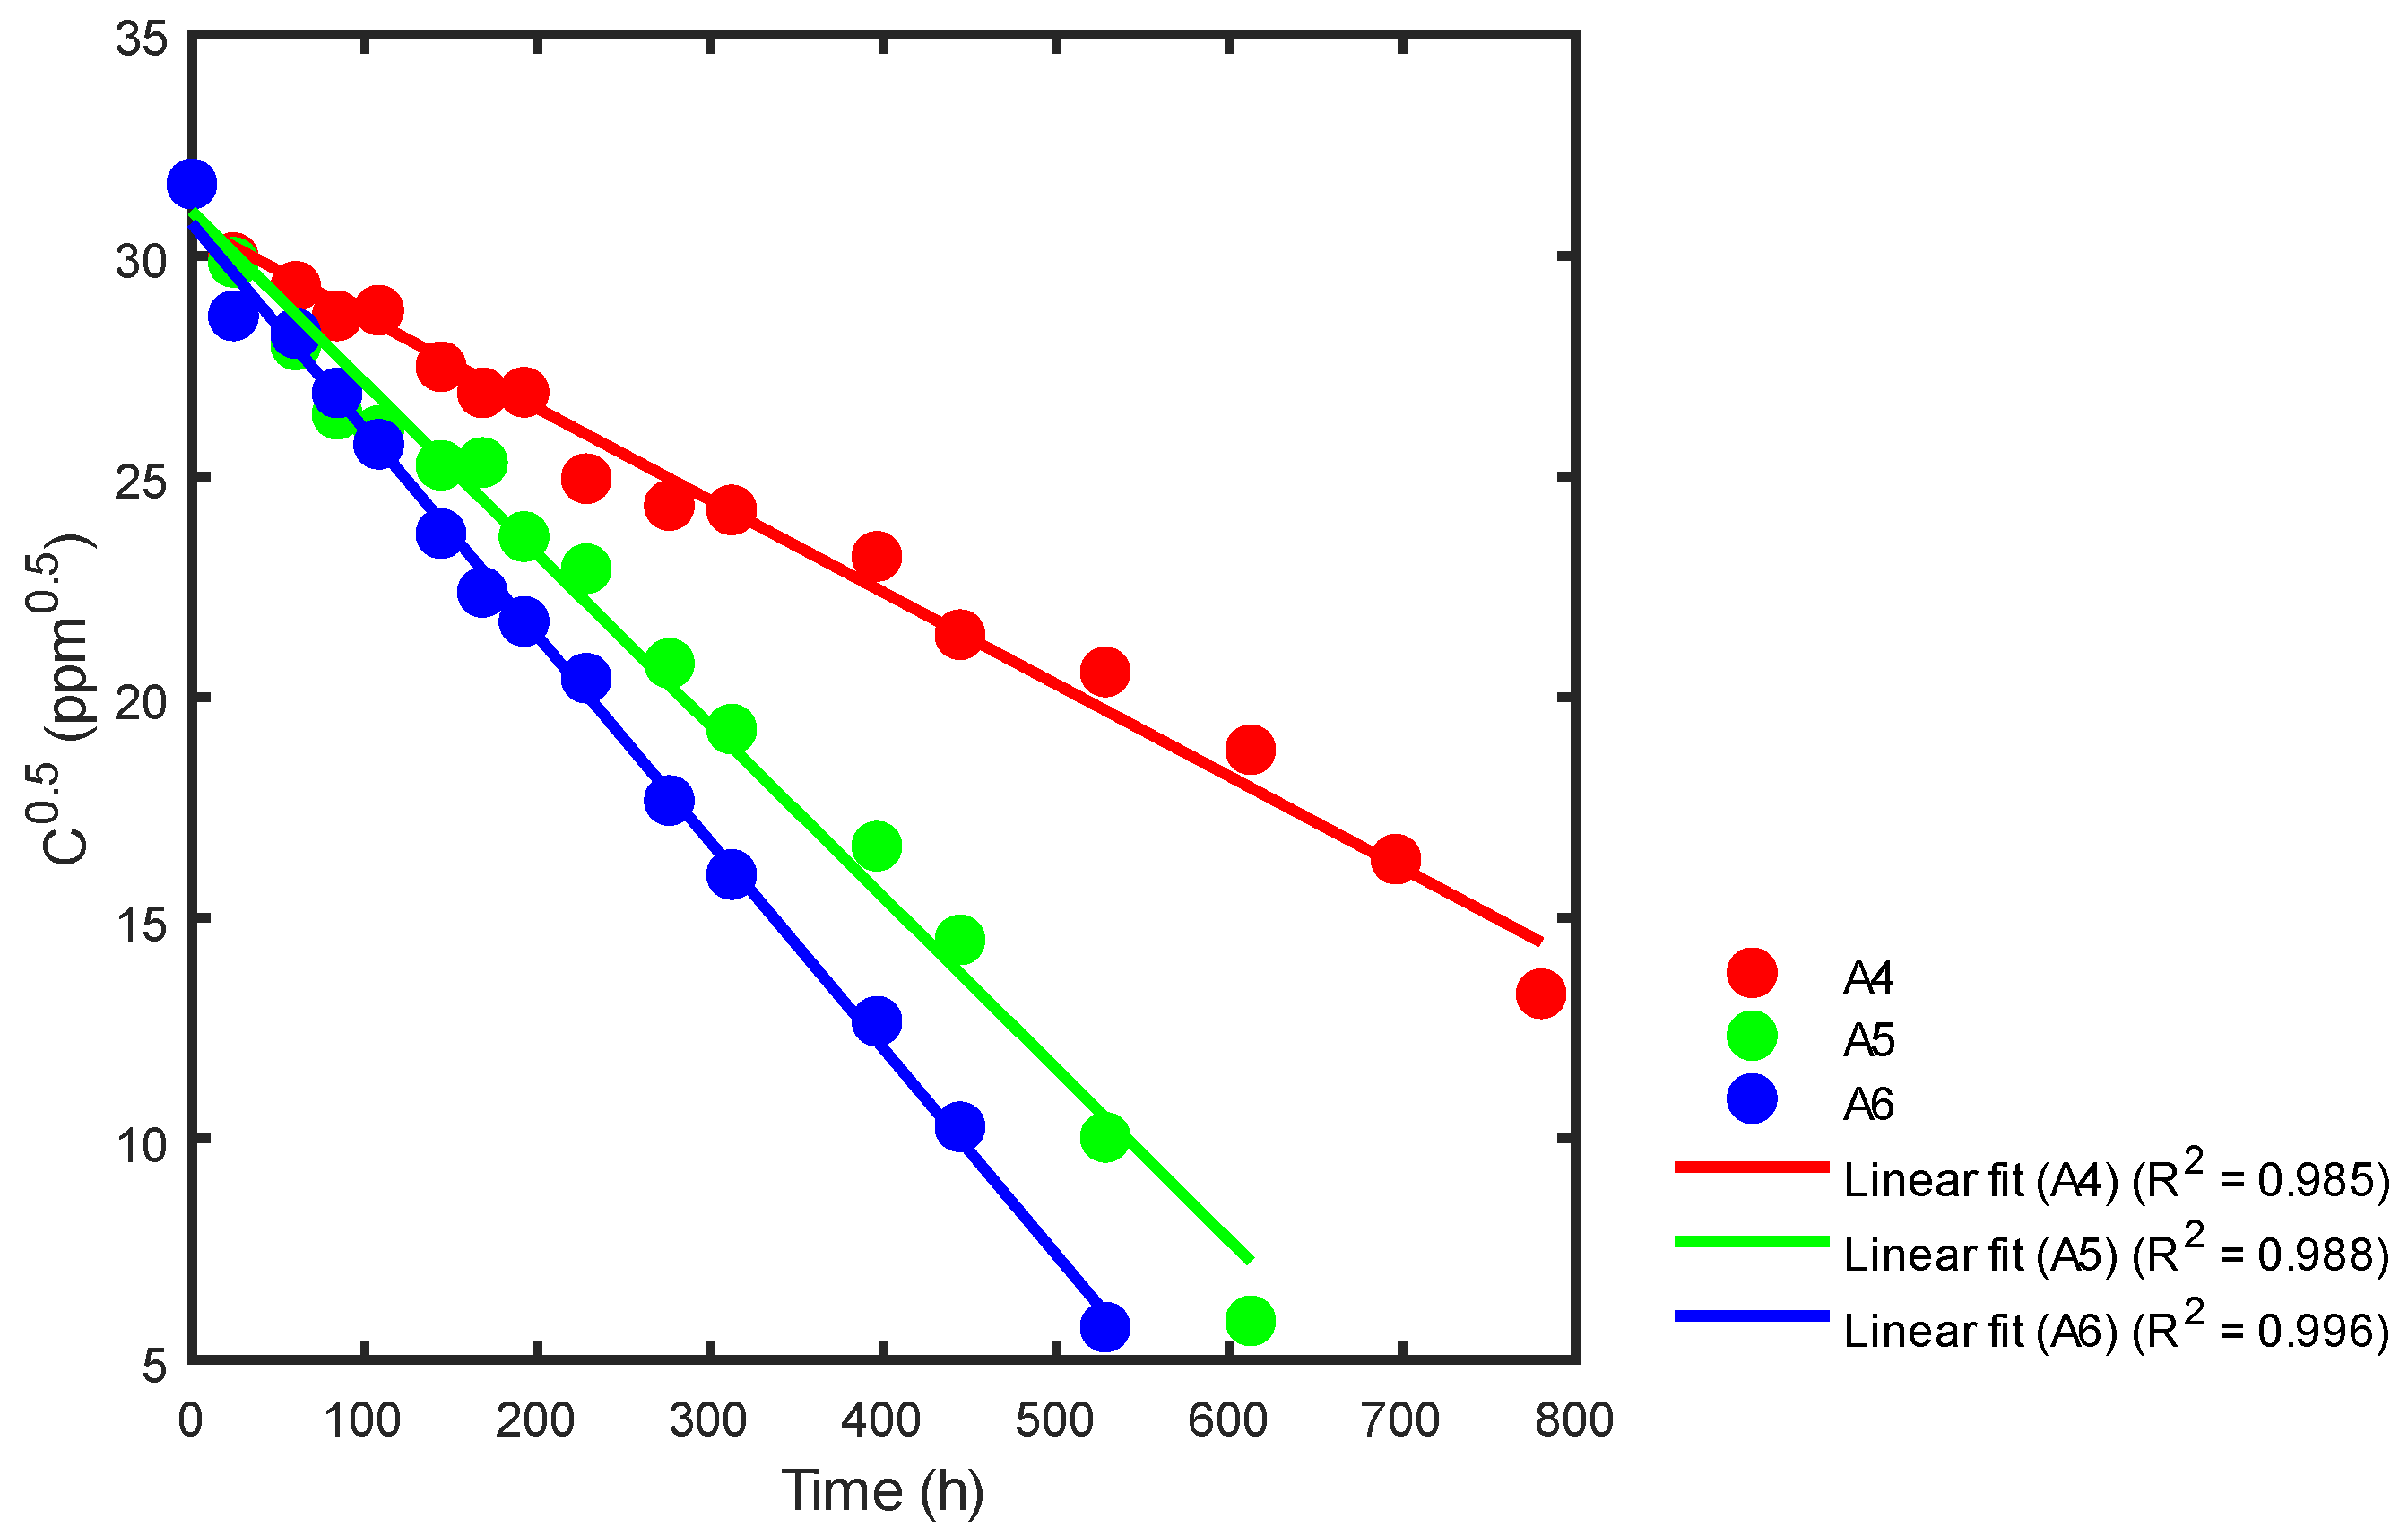
3.2.1. Order of Reaction
3.2.2. Reaction Rate Constant
- ✓
- Sumireact supra yellow s-hbu dye
- ✓
- Sumifix supra lemon-yellow e-xf dye
4. Discussion
5. Conclusions
Author Contributions
Funding
Data Availability Statement
Acknowledgments
Conflicts of Interest
References
- Arias, P.E.Z.; Nájera, J.B.P.; Hernández, I.C.; Ayala, H.I.S. Textile industrial dyes and optimal wastewater effluents treatments: A short review. Rev. La Fac. Cienc. Quìmicas 2018, 19, 38–47. [Google Scholar]
- Gogate, P.R.; Pandit, A.B. A review of imperative technologies for wastewater treatment I: Oxidation technologies at ambient conditions. Adv. Environ. Res. 2004, 8, 501–551. [Google Scholar] [CrossRef]
- Malato, S.; Fernández-Ibáñez, P.; Maldonado, M.I.; Blanco, J.; Gernjak, W. Decontamination and disinfection of water by solar photocatalysis: Recent overview and trends. Catal. Today 2009, 147, 1–59. [Google Scholar] [CrossRef]
- Spasiano, D.; Marotta, R.; Malato, S.; Fernandez-Ibañez, P.; Di Somma, I. Solar photocatalysis: Materials, reactors, some commercial, and pre-industrialized applications. A comprehensive approach. Appl. Catal. B Environ. 2015, 170–171, 90–123. [Google Scholar] [CrossRef]
- Augugliaro, V.; Litter, M.; Palmisano, L.; Soria, J. The combination of heterogeneous photocatalysis with chemical and physical operations: A tool for improving the photoprocess performance. J. Photochem. Photobiol. C Photochem. Rev. 2006, 7, 127–144. [Google Scholar] [CrossRef]
- Braslavsky, S.E. Glossary of terms used in photochemistry, 3rd edition (IUPAC Recommendations 2006). Pure Appl. Chem. 2007, 79, 293–465. [Google Scholar] [CrossRef]
- Santiado, A.C.B. Degradación Fotocatalítica de Fenol Mediante TiO2 Modificado Con Metales de Transición y Sulfato. Ph.D. Thesis, Universidad de Málaga, Malaga, Spain, 2001. [Google Scholar]
- Maira, A.J.; Yeung, K.L.; Lee, C.Y.; Yue, P.L.; Chan, C.K. Size Effects in Gas-Phase Photo-oxidation of Trichloroethylene Using Nanometer-Sized TiO2 Catalysts. J. Catal. 2000, 192, 185–196. [Google Scholar] [CrossRef]
- Lusvardi, G.; Barani, C.; Giubertoni, F.; Paganelli, G. Synthesis and Characterization of TiO2 Nanoparticles for the Reduction of Water Pollutants. Materials 2017, 10, 1208. [Google Scholar] [CrossRef]
- Chiva, S.; Berlanga, J.; Martínez, R.; Climent, J. Procesos de Oxidación Avanzada en el Ciclo Integral del Agua; Universitat Jaume I.: Valencia, Spain, 2017. [Google Scholar]
- Rodriguez, J.; Candal, R.J.; Solís, J.; Estrada, W.; Blesa, M.A. El fotocatalizador: Síntesis, propiedades y limitaciones. Sol. Safe Water 2005, 9, 135–152. [Google Scholar]
- Grätzel, M. Photoelectrochemical cells. Nature 2001, 414, 338–344. [Google Scholar] [CrossRef]
- Fujishima, A.; Zhang, X.; Tryk, D. TiO2 photocatalysis and related surface phenomena. Surf. Sci. Rep. 2008, 63, 515–582. [Google Scholar] [CrossRef]
- Garcés, L.F.; Mejía, E.A.; Santamaría, J.J. La fotocatálisis como alternativa para el tratamiento de aguas residuales. Rev. Lasallista 2004, 1, 83–92. [Google Scholar]
- Linsebigler, A.L.; Lu, G.; Yates, J.T. Photocatalysis on TiO2 Surfaces: Principles, Mechanisms, and Selected Results. Chem. Rev. 1995, 95, 735–758. [Google Scholar] [CrossRef]
- Pandiyaraj, K.N.; Vasu, D.; Ghobeira, R.; Tabaei, P.S.E.; De Geyter, N.; Morent, R.; Pichumani, M.; Padmanabhanan, P.V.A.; Deshmukh, R.R. Dye wastewater degradation by the synergetic effect of an atmospheric pressure plasma treatment and the photocatalytic activity of plasma-functionalized Cu-TiO2 nanoparticles. J. Hazard. Mater. 2021, 405, 124264. [Google Scholar] [CrossRef]
- Bakar, F.A.; Foad, N.S.I.M. Synthesis of TiO2 photocatalyst with tunable optical properties and exposed facet for textile wastewater treatment. Results Opt. 2023, 13, 100545. [Google Scholar] [CrossRef]
- Suhan, M.B.K.; Al-Mamun, M.R.; Farzana, N.; Aishee, S.M.; Islam, M.S.; Marwani, H.M.; Hasan, M.; Asiri, A.M.; Rahman, M.M.; Islam, A.; et al. Sustainable pollutant removal and wastewater remediation using TiO2-based nanocomposites: A critical review. Nano-Struct. Nano-Objects 2023, 36, 101050. [Google Scholar] [CrossRef]
- Al-Mamun, M.R.; Kader, S.; Islam, M.S.; Khan, M.Z.H. Photocatalytic activity improvement and application of UV-TiO2 photocatalysis in textile wastewater treatment: A review. J. Environ. Chem. Eng. 2019, 7, 103248. [Google Scholar] [CrossRef]
- Chen, D.; Cheng, Y.; Zhou, N.; Chen, P.; Wang, Y.; Li, K.; Li, K.; Huo, S.; Cheng, P.; Peng, P.; et al. Photocatalytic degradation of organic pollutants using TiO2-based photocatalysts: A review. J. Clean. Prod. 2020, 268, 121725. [Google Scholar] [CrossRef]
- Bagwasi, S.; Tian, B.; Zhang, J.; Nasir, M. Synthesis, characterization and application of bismuth and boron Co-doped TiO2: A visible light active photocatalyst. Chem. Eng. J. 2013, 217, 108–118. [Google Scholar] [CrossRef]
- Augugliaro, V.; Baiocchi, C.; Prevot, A.B.; García-López, E.; Loddo, V.; Malato, S.; Marci, G.; Palmisano, L.; Pazzi, M.; Pramauro, E. Azo-dyes photocatalytic degradation in aqueous suspension of TiO2 under solar irradiation. Chemosphere 2002, 49, 1223–1230. [Google Scholar] [CrossRef]
- Bandara, J.; Mielczarski, J.A.; Kiwi, J. 1. Molecular Mechanism of Surface Recognition. Azo Dyes Degradation on Fe, Ti, and Al Oxides through Metal Sulfonate Complexes. Langmuir 1999, 15, 7670–7679. [Google Scholar] [CrossRef]
- Daneshvar, N.; Salari, D.; Khataee, A.R. Photocatalytic degradation of azo dye acid red 14 in water: Investigation of the effect of operational parameters. J. Photochem. Photobiol. A Chem. 2003, 157, 111–116. [Google Scholar] [CrossRef]
- Epling, G.A.; Lin, C. Photoassisted bleaching of dyes utilizing TiO2 and visible light. Chemosphere 2002, 46, 561–570. [Google Scholar] [CrossRef] [PubMed]
- Li, J.; Wang, J.; Huang, L.; Lu, G. Photoelectrocatalytic degradation of methyl orange over mesoporous film electrodes. Photochem. Photobiol. Sci. 2010, 9, 39–46. [Google Scholar] [CrossRef]
- Mahmood, T.; Chen, C.; Liu, L.; Zhao, D.; Ma, W.; Lin, J.; Zhao, J. Effect of dye-metal complexation on photocatalytic decomposition of the dyes on TiO2 under visible irradiation. J. Environ. Sci. 2009, 21, 263–267. [Google Scholar] [CrossRef]
- Rao, N.N.; Dube, S. Photocatalytic degradation of reactive orange 84(RO 84) in dye-house effluent using single pass reactor. Stud. Surf. Sci. Catal. 1998, 113, 1045–1050. [Google Scholar]
- Vinodgopal, K.; Wynkoop, D.E.; Kamat, P.V. Environmental photochemistry on semiconductor surfaces: Photosensitized degradation of a textile Azo Dye, Acid Orange 7, on TiO2 particles using visible light. Environ. Sci. Technol. 1996, 30, 1660–1666. [Google Scholar] [CrossRef]
- Zhang, F.; Zhao, J.; Shen, T.; Hidaka, H.; Pelizzetti, E.; Serpone, N. TiO2-assisted photodegradation of dye pollutants II. Adsorption and degradation kinetics of eosin in TiO2 dispersions under visible light irradiation. Appl. Catal. B Environ. 1998, 15, 147–156. [Google Scholar] [CrossRef]
- Konstantinou, I.K.; Albanis, T.A. TiO2-assisted photocatalytic degradation of azo dyes in aqueous solution: Kinetic and mechanistic investigations. Appl. Catal. B Environ. 2004, 49, 1–14. [Google Scholar] [CrossRef]
- Kisch, H. Semiconductor Photocatalysis—Mechanistic and Synthetic Aspects. Angew. Chemie Int. Ed. 2013, 52, 812–847. [Google Scholar] [CrossRef]
- Kumar, K.; Chowdhury, A. Use of novel nanostructured photocatalysts for the environmental sustainability of wastewater treatments. In Encyclopedia of Renewable and Sustainable Materials; Elsevier: Amsterdam, The Netherlands, 2020; pp. 949–964. [Google Scholar]
- Michal, R.; Sfaelou, S.; Lianos, P. Photocatalysis for Renewable Energy Production Using PhotoFuelCells. Molecules 2014, 19, 19732–19750. [Google Scholar] [CrossRef] [PubMed]
- Olivarez, G.H. Degradación de Contaminantes Presentes en Agua Mediante Fotocatálisis Solar. Master’s Thesis, Instituto de Ingeniería de la UNAM, Ciudad de México, Mexico, 2014. [Google Scholar]
- Cantarella, M.; Mangano, M.; Zimbone, M.; Sfuncia, G.; Nicotra, G.; Scalisi, E.M.; Brundo, M.V.; Pellegrino, A.L.; Guifridda, F.; Privitera, V.; et al. Green synthesis of photocatalytic TiO2/Ag nanoparticles for an efficient water remediation. J. Photochem. Photobiol. A Chem. 2023, 443, 114838. [Google Scholar] [CrossRef]
- Yao, W.; Luo, C.; Wu, J.; Hou, G. Degradation of Acid Yellow 36 Azo Dye from Textile Wastewater using Vanadium-doped TiO2 Photonanocatalyst. Int. J. Electrochem. Sci. 2022, 17, 220916. [Google Scholar] [CrossRef]
- He, X.; Meng, X.; Sun, J.; Yuan, Z.; He, Y.; Chen, S. Synthesis of TiO2@Fe2O3 Nanocomposites as effective Photocatalyst for degradation of p-nitophenol in oilfield wastewater. Int. J. Electrochem. Sci. 2022, 17, 221179. [Google Scholar] [CrossRef]
- Wang, R.; Cao, J.; Liu, J.; Zhang, Y. Synthesis of CuO@TiO2 nanocomposite and its photocatalytic and electrochemical properties. Application for treatment of azo dyes in industrial wastewater. Int. J. Electrochem. Sci. 2023, 18, 100316. [Google Scholar] [CrossRef]
- Song, C. Enhancing photocatalytic degradation of hydrolyzed polyacrylamide in oilfield wastewater using BiVO4/TiO2 heterostructure nano-photocatalyst under visible light irradiation. Int. J. Electrochem. Sci. 2023, 18, 100363. [Google Scholar] [CrossRef]
- Sutisna; Wibowo, E.; Rokhmat, M.; Rahman, D.Y.; Murniati, R.; Abdullah, M. Batik wastewater treatment using TiO2 nanoparticles coated on the surface of plastic sheet. Procedia Eng. 2017, 170, 78–83. [Google Scholar] [CrossRef]
- Dzinun, H.; Khalid, N.H.A.; Hairom, N.H.H. Photocatalytic performance of TiO2/Eggshell composite for wastewater treatment. Mater. Today Proc. 2022, 65, 3000–3006. [Google Scholar] [CrossRef]
- Ohtani, B. Principle of Photocatalysis and Design of Active Photocatalysts. In New and Future Developments in Catalysis; Elsevier: Amsterdam, The Netherlands, 2013; pp. 121–144. [Google Scholar]
- Talaiekhozani, A.; Mosayebi, M.R.; Fulazzaky, M.A.; Eskandari, Z.; Sanayee, R. Combination of TiO2 microreactor and electroflotation for organic pollutant removal from textile dyeing industry wastewater. Alex. Eng. J. 2020, 59, 549–563. [Google Scholar] [CrossRef]
- García, S.N. Descontaminación de Agua Mediante Energía Solar Utilizando un Fotocatalizador. Bachelor’s Thesis, Universidad de la Laguna, Santa Cruz de Tenerife, Spain, 2015. [Google Scholar]
- Romero, M.; Blanco, J.; Sánchez, B.; Vidal, A.; Malato, S.; Cardona, A.I.; Garcia, E. Solar photocatalytic degradation of water and air pollutants: Challenges and perspectives. Sol. Energy 1999, 66, 169–182. [Google Scholar] [CrossRef]
- Dijkstra, M.F.; Michorius, A.; Buwalda, H.; Panneman, H.; Winkelman, J.G.; Beenackers, A.A.C. Comparison of the efficiency of immobilized and suspended systems in photocatalytic degradation. Catal. Today 2001, 66, 487–494. [Google Scholar] [CrossRef]
- Mills, A.; Le Hunte, S. An overview of semiconductor photocatalysis. J. Photochem. Photobiol. A Chem. 1997, 108, 1–35. [Google Scholar] [CrossRef]
- Gaya, U.I.; Abdullah, A.H. Heterogeneous photocatalytic degradation of organic contaminants over titanium dioxide: A review of fundamentals, progress and problems. J. Photochem. Photobiol. C Photochem. Rev. 2008, 9, 1–12. [Google Scholar] [CrossRef]
- Sun, L.; Bolton, J.R. Determination of the quantum yield for the photochemical generation of hydroxyl radicals in TiO2 suspensions. J. Phys. Chem. 1996, 100, 4127–4134. [Google Scholar] [CrossRef]
- Pichat, P. Photocatalytic degradation of pollutants in water and air: Basic concepts and applications. In Environmental Science and Pollution Control Series; Marcel-Dekker, Inc.: New York, NY, USA, 2003; pp. 77–120. [Google Scholar]
- Kormann, C.; Bahnemann, D.W.; Hoffmann, M.R. Photolysis of chloroform and other organic molecules in aqueous titanium dioxide suspensions. Environ. Sci. Technol. 1991, 25, 494–500. [Google Scholar] [CrossRef]
- Pekakis, P.A.; Xekoukoulotakis, N.P.; Mantzavinos, D. Treatment of textile dyehouse wastewater by TiO2 photocatalysis. Water Res. 2006, 40, 1276–1286. [Google Scholar] [CrossRef] [PubMed]


| Reactor Code | pH in Solution (und. pH) | Concentration of NP TiO2 (ppm) |
|---|---|---|
| R1 | 2.25 | 200 |
| R2 | 2.25 | 400 |
| R3 | 2.25 | 800 |
| R4 | 3.15 | 200 |
| R5 | 3.15 | 400 |
| R6 | 3.15 | 800 |
| R7 | 4.13 | 200 |
| R8 | 4.13 | 400 |
| R9 | 4.13 | 800 |
| R10 | 2.25 | 0 |
| R11 | 3.15 | 0 |
| R12 | 4.13 | 0 |
| R13 | 7.31 (1) | 0 |
| A1 | 2.25 | 200 |
| A2 | 2.25 | 400 |
| A3 | 2.25 | 800 |
| A4 | 3.15 | 200 |
| A5 | 3.15 | 400 |
| A6 | 3.15 | 800 |
| A7 | 4.13 | 200 |
| A8 | 4.13 | 400 |
| A9 | 4.13 | 800 |
| A10 | 2.25 | 0 |
| A11 | 3.15 | 0 |
| A12 | 4.13 | 0 |
| A13 | 7.75 (2) | 0 |
| t (h) | Concentration of the Sumireact Supra Yellow s-hbu (ppm) Solutions | ||||||||
|---|---|---|---|---|---|---|---|---|---|
| R1 | R2 | R3 | R4 | R5 | R6 | R7 | R8 | R9 | |
| 0 | 1000 | 1000 | 1000 | 1000 | 1000 | 1000 | 1000 | 1000 | 1000 |
| 24 | 782 | 762.5 | 729.1 | 899.1 | 846.1 | 783.4 | 886.5 | 872.6 | 809.9 |
| 60 | 759.8 | 720.8 | 637.7 | 875.4 | 832.2 | 720.8 | 872.6 | 865.6 | 808.5 |
| 84 | 761.2 | 734.7 | 623.2 | 842 | 797.4 | 695.7 | 899.1 | 821.1 | 744.4 |
| 108 | 733 | 761.2 | 620.5 | 848.9 | 823.8 | 676.2 | 890.7 | 807.1 | 705.4 |
| 144 | 737.5 | 699.9 | 648.3 | 835 | 786.2 | 665 | 879.6 | 766.7 | 691.5 |
| 168 | 762.5 | 753.8 | 605.7 | 808.8 | 756.6 | 589.8 | 867.4 | 752.8 | 673.4 |
| 192 | 715.2 | 683.1 | 610.7 | 847.5 | 776.5 | 578.7 | 883.7 | 737.5 | 609.5 |
| 228 | 652.3 | 680.4 | 590.6 | 776.5 | 708.2 | 475.2 | 847.5 | 653.1 | 554 |
| 276 | 663.6 | 614.1 | 570.3 | 792.7 | 716.6 | 449.1 | 830.2 | 635.8 | 474.2 |
| 312 | 628.8 | 587 | 567.5 | 779.6 | 621.8 | 386.4 | 821 | 588.4 | 410.1 |
| 396 | 659.5 | 609.3 | 535.5 | 782 | 649.7 | 353 | 842 | 538.3 | 362.7 |
| 444 | 667.8 | 619.1 | 517.4 | 791.8 | 637.2 | 255.5 | 887.9 | 528.5 | 283.3 |
| 528 | 660.8 | 606.5 | 509 | 800.2 | 619.1 | 163.1 | 875.4 | 497.9 | 252.7 |
| 612 | 659.5 | 614.9 | 522.8 | 815.5 | 609.5 | 117.5 | 864.2 | 511.8 | 138.4 |
| 696 | 637.2 | 623.6 | 552.2 | 805.7 | 594.8 | 14.9 | 901.9 | 485.3 | 37.2 |
| 780 | 658.1 | 623.2 | 542.4 | 811.3 | 541 | 3.9 | 855.9 | 393.4 | 6 |
| t (h) | Concentration of the Sumifix Supra Lemon-Yellow e-xf (ppm) Solutions | ||||||||
|---|---|---|---|---|---|---|---|---|---|
| A1 | A2 | A3 | A4 | A5 | A6 | A7 | A8 | A9 | |
| 0 | 1000 | 1000 | 1000 | 1000 | 1000 | 1000 | 1000 | 1000 | 1000 |
| 24 | 900.6 | 858.7 | 871.6 | 897.4 | 891 | 820 | 876.4 | 861.9 | 858.7 |
| 60 | 789.3 | 870 | 836.1 | 858.7 | 782.9 | 797.4 | 879.7 | 852.2 | 816.8 |
| 84 | 750.6 | 787.7 | 770 | 820 | 697.4 | 723.2 | 815.1 | 800.6 | 787.7 |
| 108 | 715.2 | 760.3 | 741 | 827.4 | 678.1 | 661.9 | 847.4 | 744.2 | 728.1 |
| 144 | 687.7 | 708.7 | 660.3 | 755.5 | 637.7 | 561.9 | 739.3 | 686.1 | 658.7 |
| 168 | 658.7 | 655.5 | 623.2 | 723.2 | 641 | 500.6 | 734.5 | 679.7 | 644.2 |
| 192 | 616.8 | 597.4 | 581.3 | 723.9 | 558.7 | 471.6 | 721.6 | 676.4 | 571.6 |
| 228 | 589.3 | 573.2 | 521.6 | 622.6 | 524.8 | 417.4 | 676.4 | 661.9 | 537.7 |
| 276 | 499 | 491 | 411.9 | 592.6 | 431.3 | 311.9 | 563.5 | 582.9 | 449 |
| 312 | 455.5 | 437.1 | 355.5 | 587.7 | 371.6 | 255.5 | 537.7 | 457.1 | 361.3 |
| 396 | 378.1 | 337.7 | 257.1 | 537.7 | 276.5 | 160.3 | 489.4 | 465.2 | 253.9 |
| 444 | 349 | 258.7 | 182.9 | 458.7 | 210.3 | 105.5 | 416.8 | 408.7 | 181.3 |
| 528 | 316.8 | 221.6 | 99 | 423.2 | 100.7 | 32.9 | 413.5 | 299 | 46.5 |
| 612 | 279.7 | 173.2 | 23.2 | 353.9 | 34.5 | 0 | 329.7 | 232.9 | 1.4 |
| 696 | 210.3 | 20 | 0 | 266.8 | 0 | 253.9 | 63.6 | 0 | |
| 780 | 144.2 | 0 | 176.5 | 147.4 | 0 | ||||
| Reactor | Order ½ | Order 1 | Order ³⁄₂ | Order 2 | Langmuir-Hinshelwood |
|---|---|---|---|---|---|
| R6 | 0.978 | 0.818 | 0.5568 | 0.4003 | 0.7365 |
| R9 | 0.977 | 0.818 | 0.5286 | 0.3631 | 0.5989 |
| Reactor | Order ½ | Order 1 | Order ³⁄₂ | Order 2 | Langmuir-Hinshelwood |
|---|---|---|---|---|---|
| A1 | 0.977 | 0.9862 | 0.9531 | 0.8809 | 0.8417 |
| A2 | 0.977 | 0.9862 | 0.9531 | 0.8809 | 0.6292 |
| A3 | 0.9939 | 0.8943 | 0.6796 | 0.4914 | 0.7486 |
| A4 | 0.9851 | 0.9613 | 0.9028 | 0.8177 | 0.932 |
| A5 | 0.9884 | 0.9061 | 0.7327 | 0.5602 | 0.8037 |
| A6 | 0.9962 | 0.9391 | 0.7692 | 0.5838 | 0.9579 |
| A7 | 0.9821 | 0.9546 | 0.8828 | 0.7778 | 0.9166 |
| A8 | 0.9527 | 0.8449 | 0.6717 | 0.5111 | 0.5797 |
| A9 | 0.9737 | 0.7248 | 0.414 | 0.3243 | 0.4768 |
| Reactor | pH | C (ppm) | k (ppm0.5h−1) |
|---|---|---|---|
| A1 | 2.25 | 200 | 0.0457 |
| A2 | 2.25 | 400 | 0.0673 |
| A3 | 2.25 | 800 | 0.0829 |
| A4 | 3.15 | 200 | 0.0417 |
| A5 | 3.15 | 400 | 0.0777 |
| A6 | 3.15 | 800 | 0.0935 |
| A7 | 4.13 | 200 | 0.0445 |
| A8 | 4.13 | 400 | 0.0559 |
| A9 | 4.13 | 800 | 0.0918 |
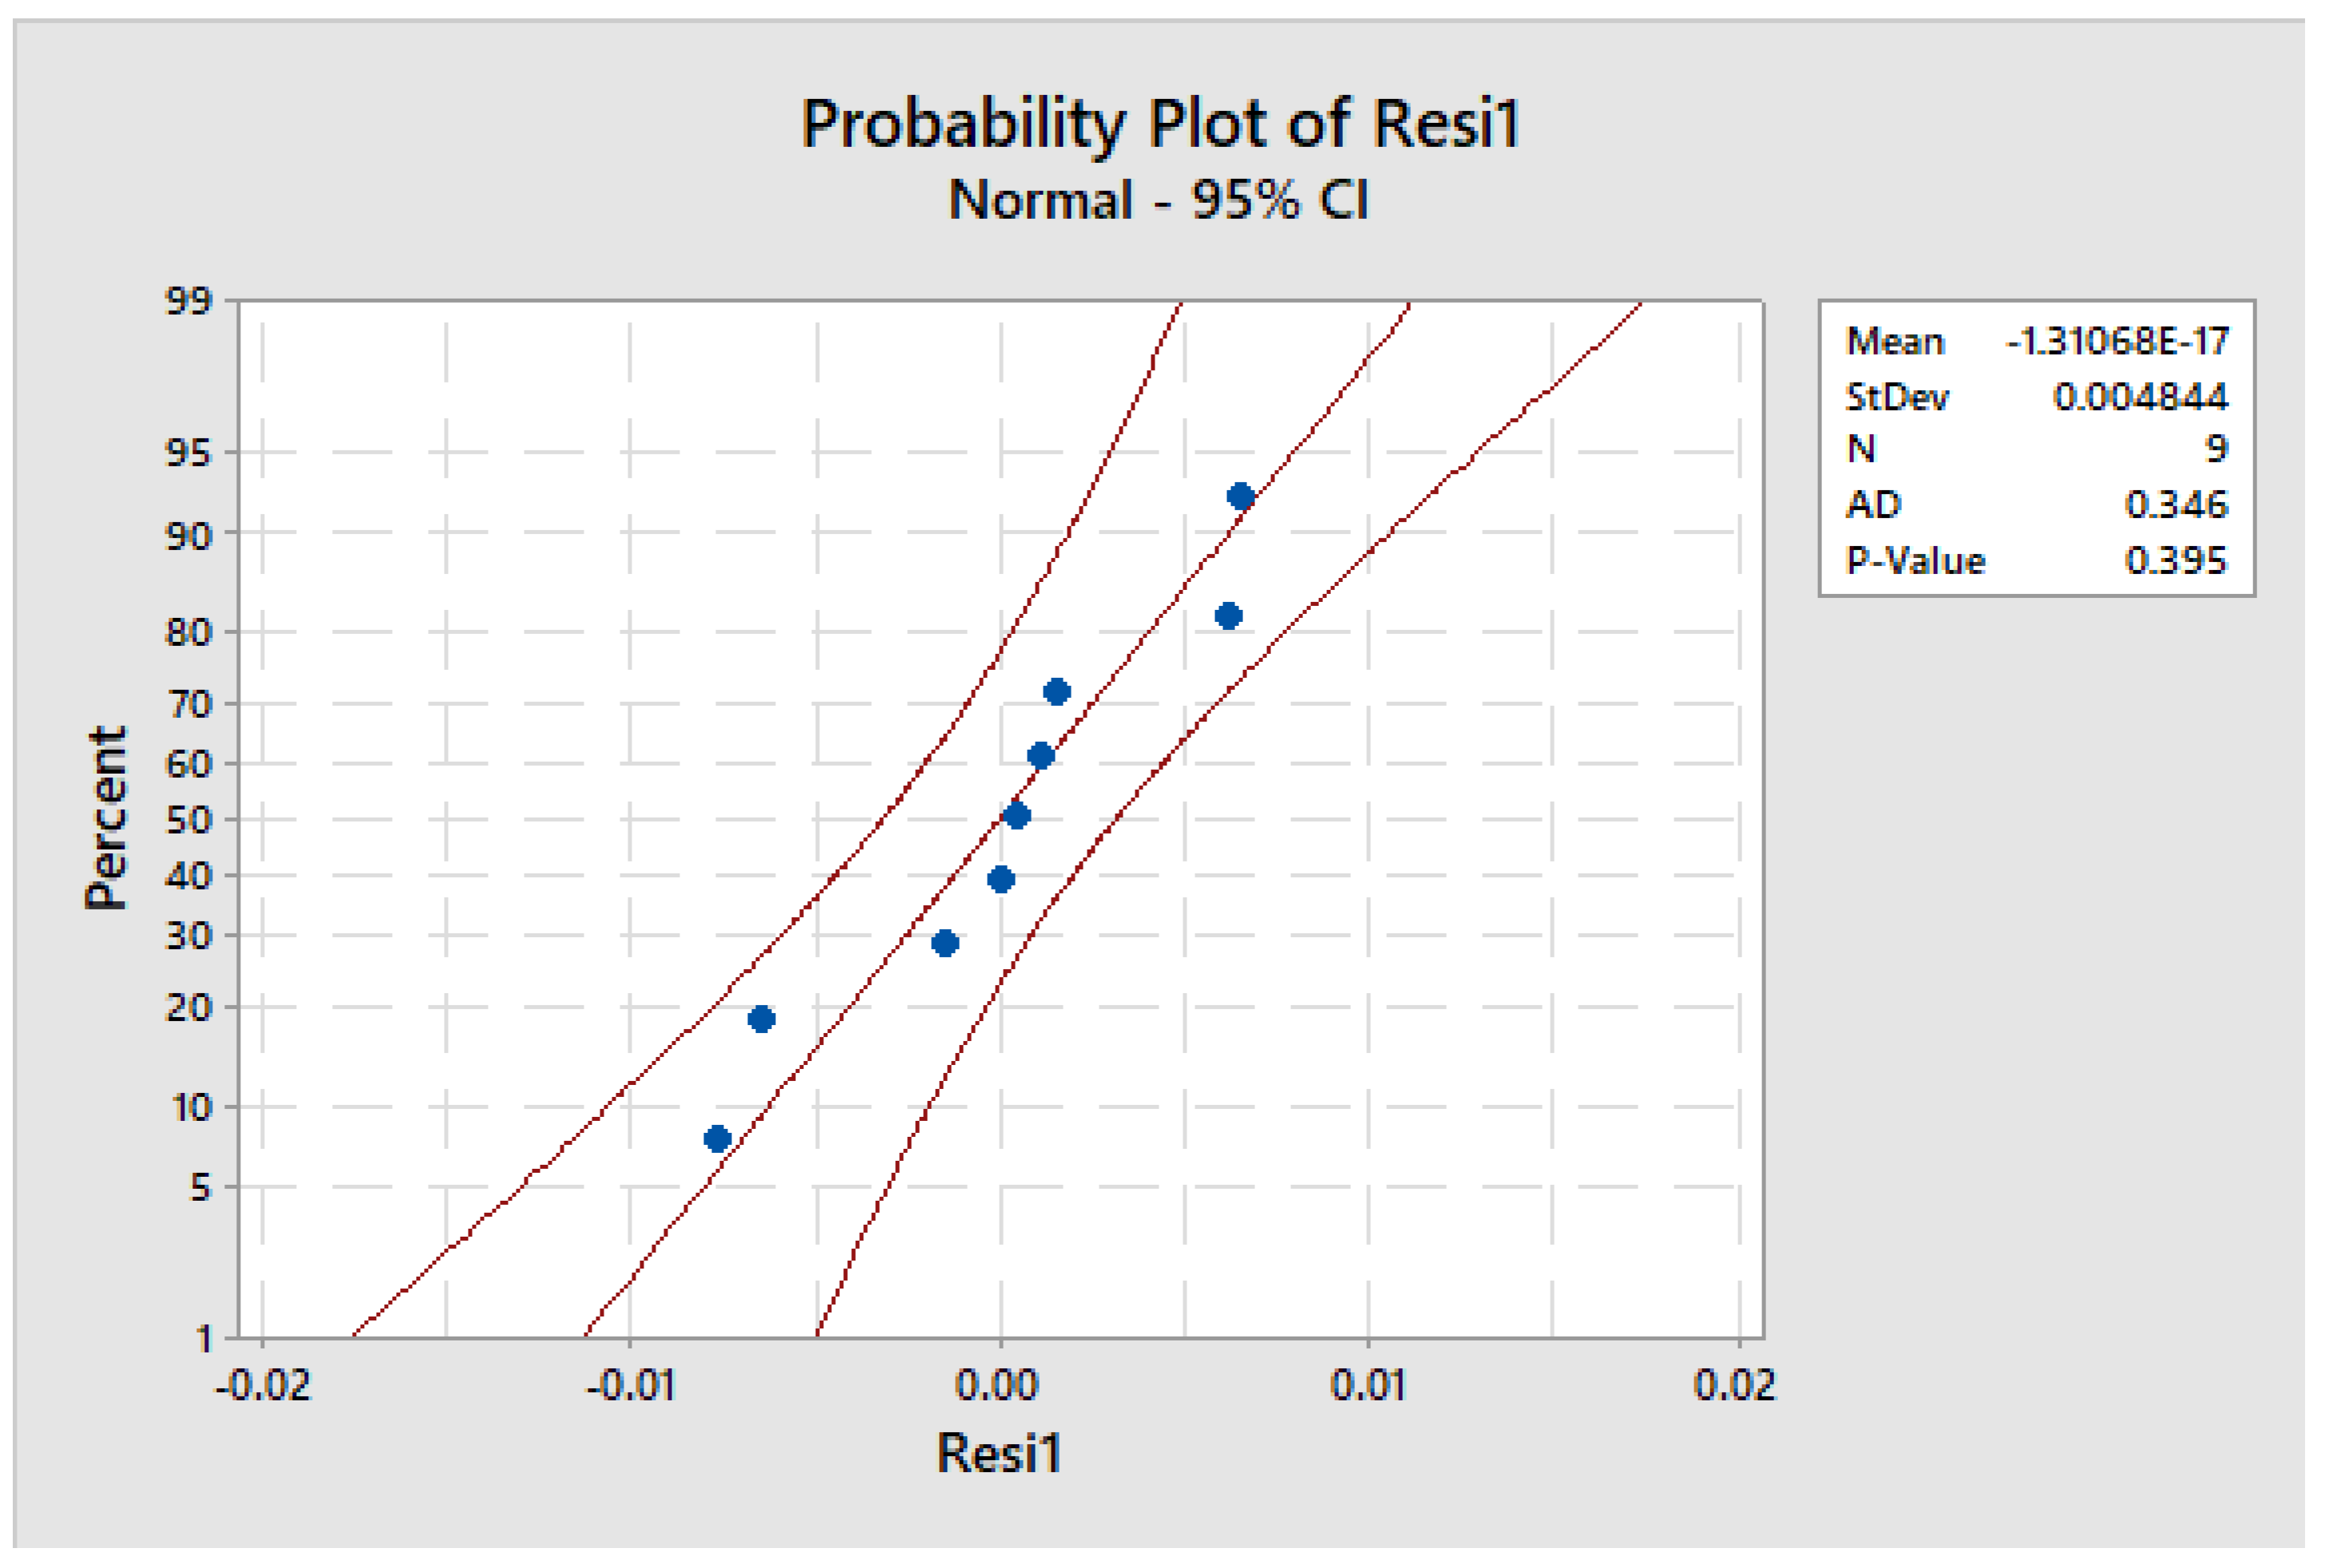
| Source | DF | Adj SS | Adj MS | F-Value | p-Value |
|---|---|---|---|---|---|
| Model | 5 | 0.003220 | 0.000644 | 10.29 | 0.042 |
| Linear | 2 | 0.003107 | 0.001554 | 24.84 | 0.014 |
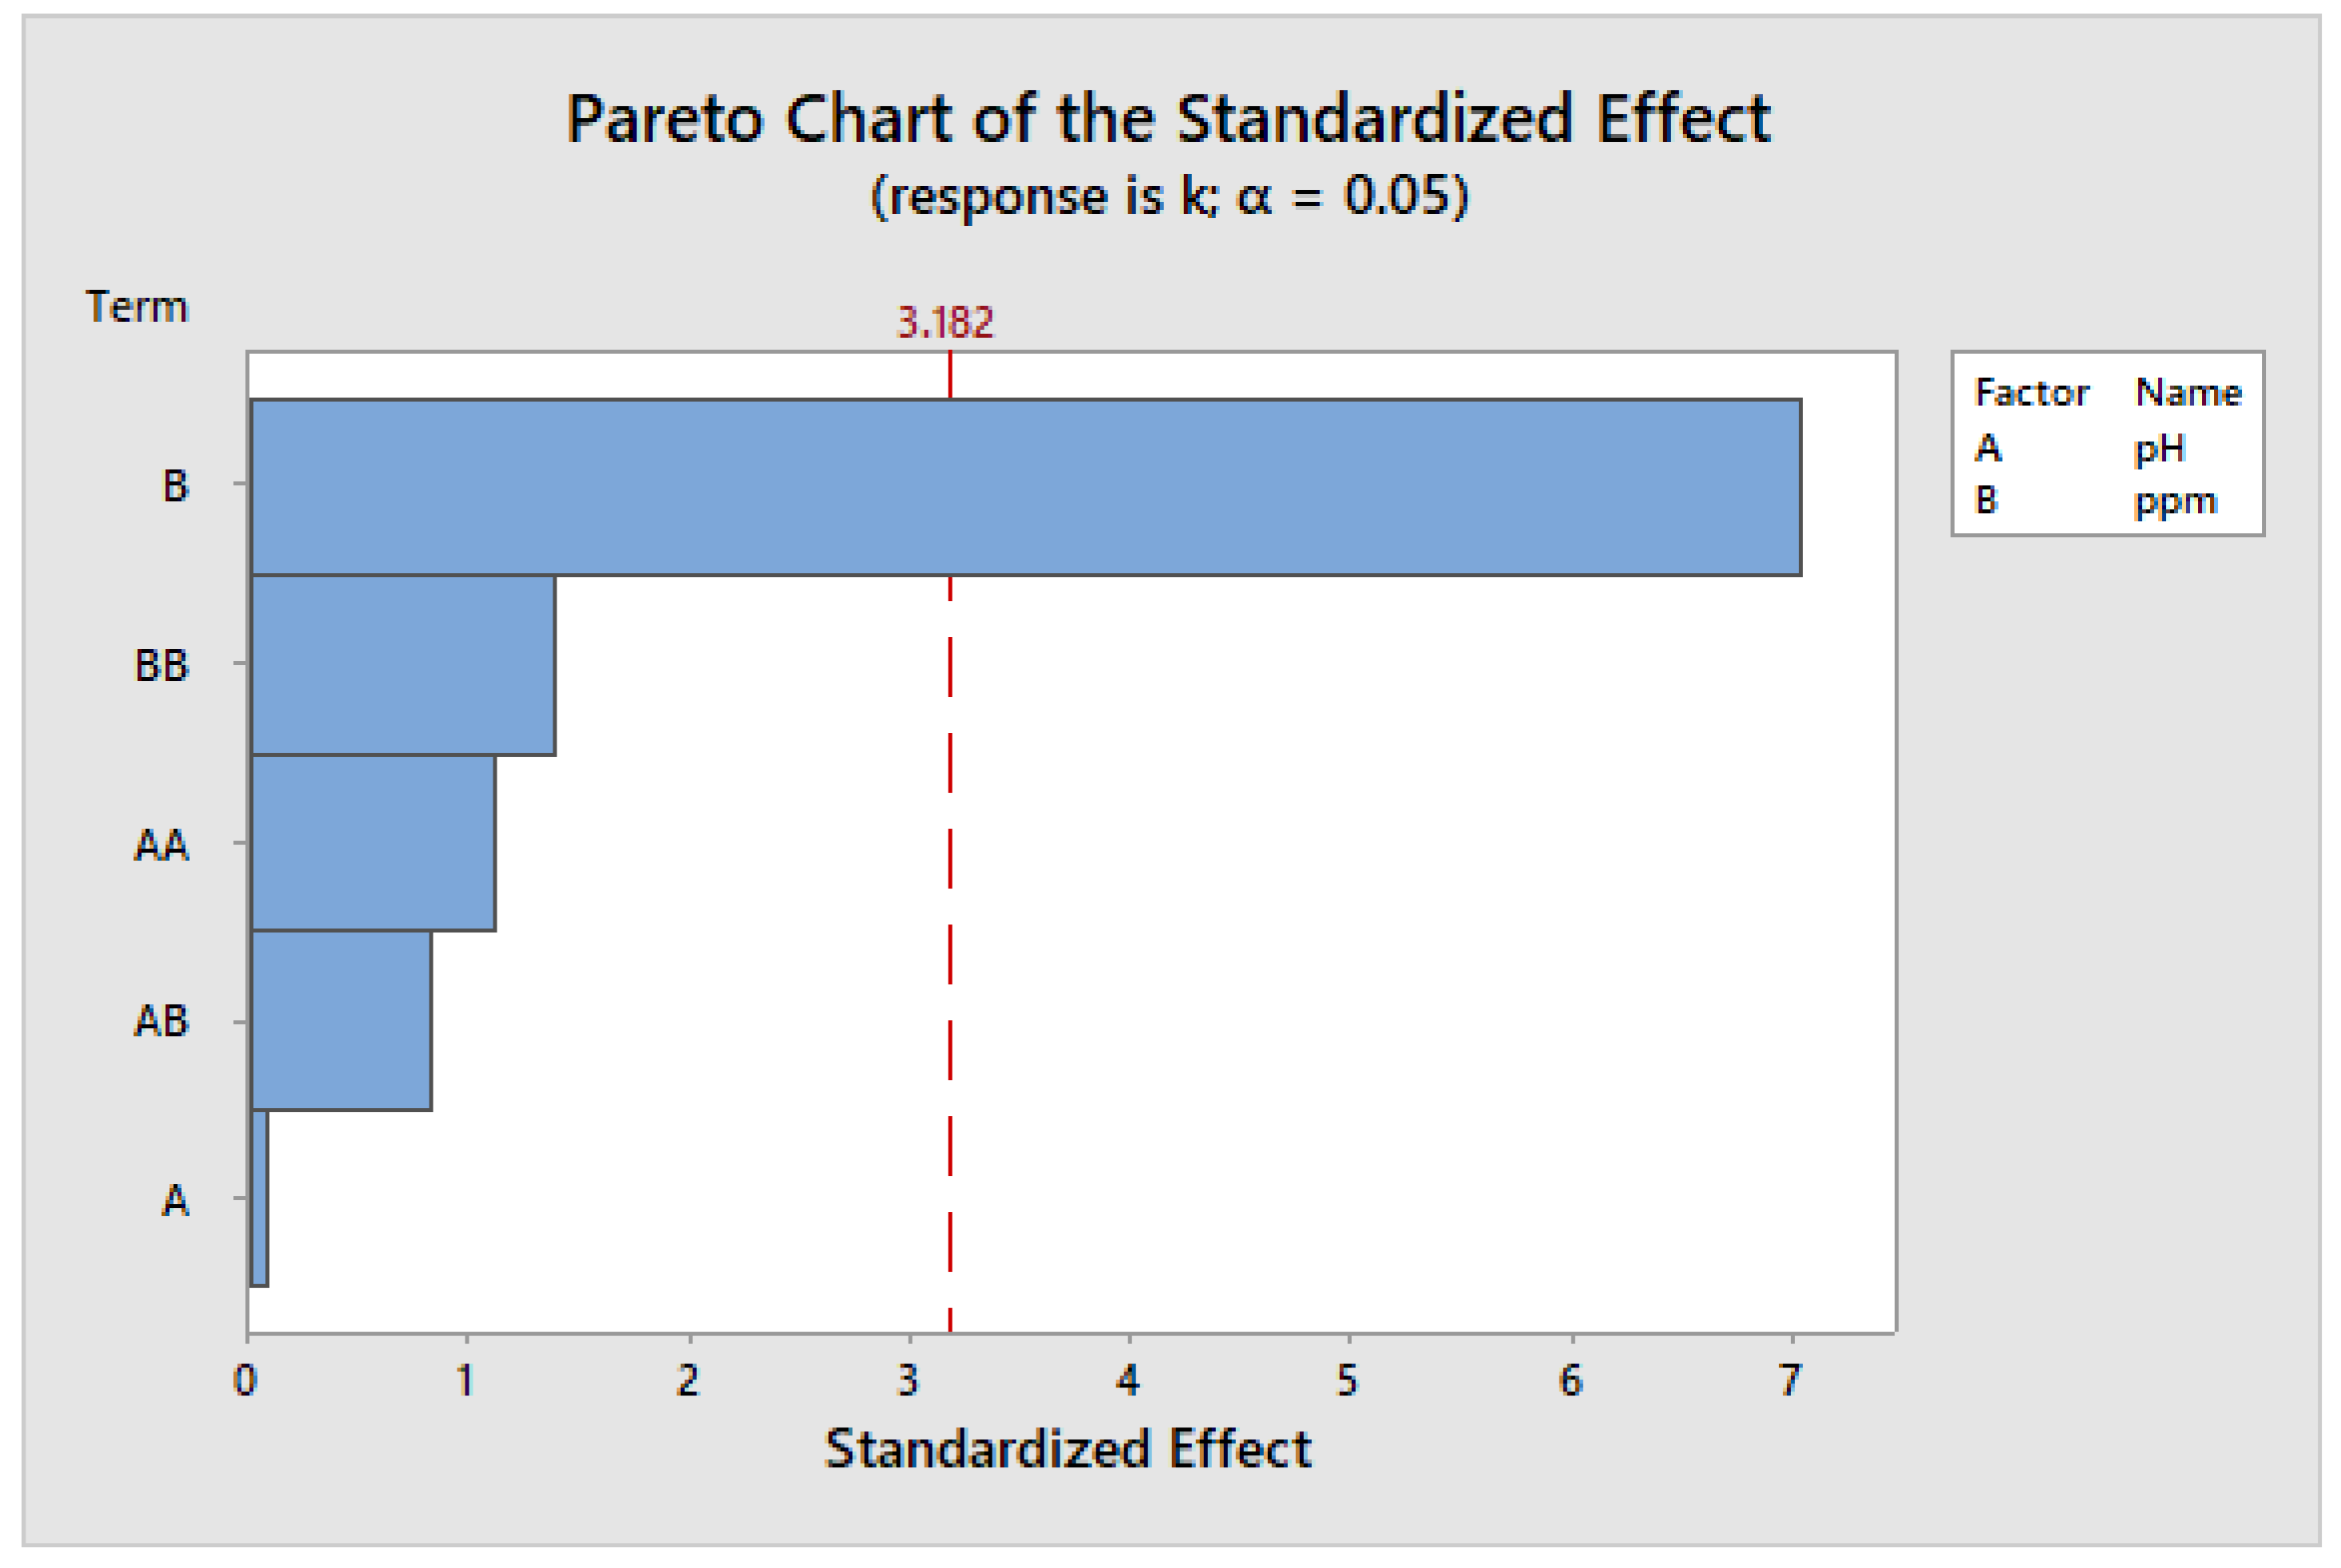
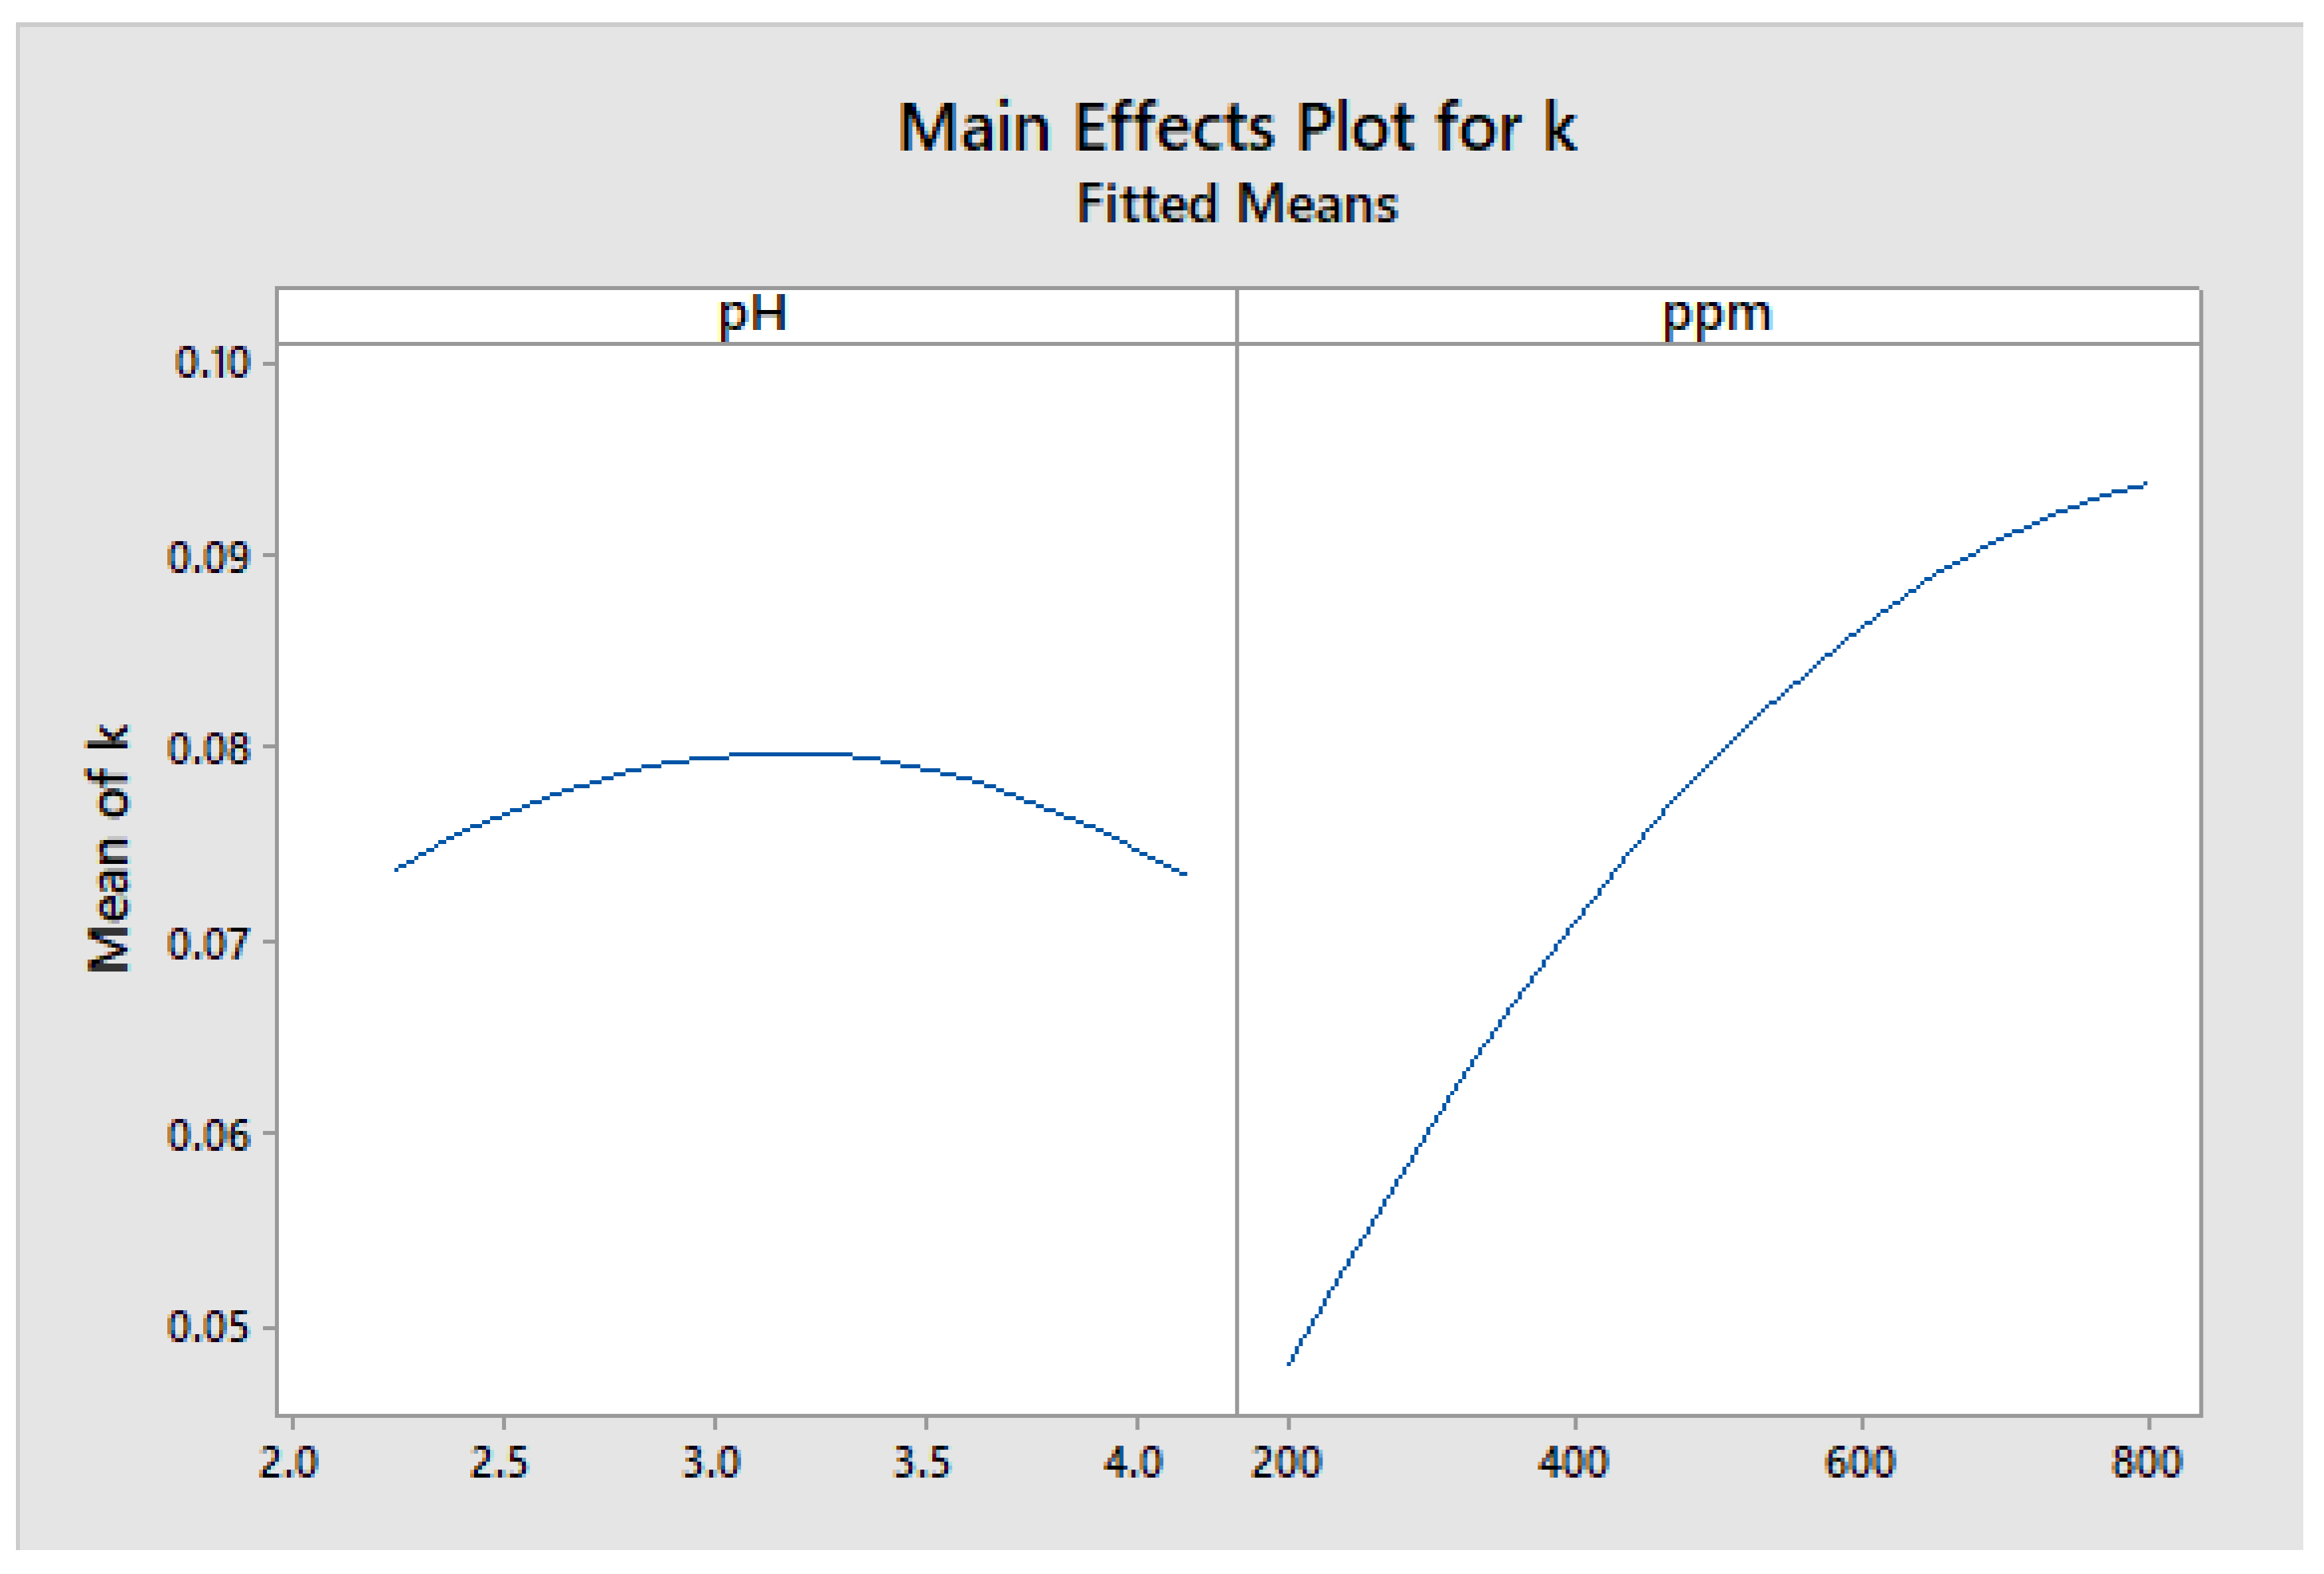
| pH | 1 | 0.000000 | 0.000000 | 0.01 | 0.942 |
| ppm | 1 | 0.003107 | 0.003107 | 49.66 | 0.006 |
| Square | 2 | 0.000198 | 0.000099 | 1.58 | 0.339 |
| pH × pH | 1 | 0.000078 | 0.000078 | 1.25 | 0.345 |
| ppm | 1 | 0.000120 | 0.000120 | 1.92 | 0.260 |
| Two-way interaction | 1 | 0.000043 | 0.000043 | 0.69 | 0.468 |
| pH × ppm | 1 | 0.000043 | 0.000043 | 0.69 | 0.468 |
| Error | 3 | 0.000188 | 0.000063 | ||
| Total | 8 | 0.003407 |
Disclaimer/Publisher’s Note: The statements, opinions and data contained in all publications are solely those of the individual author(s) and contributor(s) and not of MDPI and/or the editor(s). MDPI and/or the editor(s) disclaim responsibility for any injury to people or property resulting from any ideas, methods, instructions or products referred to in the content. |
© 2024 by the authors. Licensee MDPI, Basel, Switzerland. This article is an open access article distributed under the terms and conditions of the Creative Commons Attribution (CC BY) license (https://creativecommons.org/licenses/by/4.0/).
Share and Cite
Carrasco-Venegas, L.A.; Castañeda-Pérez, L.G.; Martínez-Hilario, D.G.; Medina-Collana, J.T.; Calderón-Cruz, J.C.; Gutiérrez-Cuba, C.; Cuba-Torre, H.R.; Núñez, A.P.; Herrera-Sánchez, S.E. Kinetics of Decolorization of Reactive Textile Dye via Heterogeneous Photocatalysis Using Titanium Dioxide. Water 2024, 16, 633. https://doi.org/10.3390/w16050633
Carrasco-Venegas LA, Castañeda-Pérez LG, Martínez-Hilario DG, Medina-Collana JT, Calderón-Cruz JC, Gutiérrez-Cuba C, Cuba-Torre HR, Núñez AP, Herrera-Sánchez SE. Kinetics of Decolorization of Reactive Textile Dye via Heterogeneous Photocatalysis Using Titanium Dioxide. Water. 2024; 16(5):633. https://doi.org/10.3390/w16050633
Chicago/Turabian StyleCarrasco-Venegas, Luis Américo, Luz Genara Castañeda-Pérez, Daril Giovani Martínez-Hilario, Juan Taumaturgo Medina-Collana, Julio Cesar Calderón-Cruz, César Gutiérrez-Cuba, Héctor Ricardo Cuba-Torre, Alex Pilco Núñez, and Sonia Elizabeth Herrera-Sánchez. 2024. "Kinetics of Decolorization of Reactive Textile Dye via Heterogeneous Photocatalysis Using Titanium Dioxide" Water 16, no. 5: 633. https://doi.org/10.3390/w16050633
APA StyleCarrasco-Venegas, L. A., Castañeda-Pérez, L. G., Martínez-Hilario, D. G., Medina-Collana, J. T., Calderón-Cruz, J. C., Gutiérrez-Cuba, C., Cuba-Torre, H. R., Núñez, A. P., & Herrera-Sánchez, S. E. (2024). Kinetics of Decolorization of Reactive Textile Dye via Heterogeneous Photocatalysis Using Titanium Dioxide. Water, 16(5), 633. https://doi.org/10.3390/w16050633