Abstract
The riparian zone has a proven ability to reduce agricultural nonpoint-source nitrogen pollution. However, prior studies have only assessed nitrification and denitrification and their influencing factors, such as hydrology, climate, vegetation, and soil physicochemical properties, and overlooked the role of pesticide accumulation, which is an important nonpoint-source anthropogenic pollutant. This study investigated the response of the soil microbial nitrogen cycle in riparian zones to 60 days of acetochlor (ACE) exposure at doses of 0.5, 2.5, and 5.0 mg/kg. The results showed that ACE inhibited the transformation of soil NH3-N, NO3−-N, and NO2−-N and also decreased potential nitrification and denitrification rates by affecting the respective enzyme activities and related microbial communities. Metagenomic sequencing revealed that the expression of functional genes associated with NO3−-N transformation processes, including denitrification, dissimilatory nitrate reduction to ammonium, and assimilatory nitrate reduction, declined the most. The recommended field dose (0.5 mg/kg) showed a slight effect on soil microbial nitrogen transformation and the related microbial communities, whereas doses 5 and 10 times the recommended dose were highly inhibitory. This is a novel study exploring the effects of ACE on the microbial nitrogen cycle in riparian soils, also suggesting that pesticide accumulation in riparian zones could affect the health of aquatic ecosystems.
1. Introduction
In recent decades, large quantities of industrial fertilizers have been widely used to boost agricultural production. However, overfertilization has already nearly doubled the nitrogen (N) levels in terrestrial and aquatic ecosystems [1]. Moreover, elevated N loads flowing into water bodies can lead to eutrophication and biodiversity degradation. Riparian zones are transitional zones between terrestrial and aquatic ecosystems [2,3] and can prevent and control agricultural nonpoint-source pollution rich in nitrogen (N) [4,5]. As the issue of agricultural nonpoint-source N pollution becomes more prominent, N removal from riparian zones has attracted extensive attention [6,7,8].
Agricultural runoff carrying a large amount of pesticide residue can be discharged into water bodies through the riparian zone [9,10,11]. Riparian soils and vegetation cover are recognized as effective ecological filters that can reduce the levels of pesticide contaminants in the runoff, but this can lead to long-term pesticide accumulation [12]. The types of pesticides that have been reported to accumulate in riparian soils include fungicides, insecticides, and herbicides, with concentrations ranging from 0.08 to 34.22 mg kg−1 [13,14]. Pesticides have been reported to deteriorate the health of riparian soils [15], threaten soil microbial reproduction [12], and impact vegetation growth [13,16]. Microorganisms, which are susceptible to these pesticides, play an important role in the natural N cycle; therefore, a comprehensive and clear understanding of the responses of the microbial N cycle to pesticide accumulation in riparian zones is required to protect aquatic ecosystems and improve living environments.
Acetochlor (ACE, C14H20ClNO2) is a widely used herbicide commonly applied to control weeds in crop farming due to its low cost and effective control [17,18]. Owing to its low adsorption, high water solubility, and long persistence, the inappropriate and excessive application of ACE has resulted in overexposure to the ecosystem through surface runoff and soil leaching [19]. For example, in Northeast China, the average concentration of ACE in surface water was 277.8 ng/L in the Songhua River basin and 120.6 ng/L in the Heilongjiang basin. These concentrations are excessive and pose a threat to water ecological health [20]. Previous studies have shown that ACE and its enantiomers inhibit cellular activity, cause DNA damage in HepG2 cells [21], inhibit nitrate reductase and glutamine synthetase activities [22], and reduce soil urease activity [18]. Moreover, Yu et al. (2022) found that an ACE dosage of 10 mg kg−1 obviously inhibited the denitrification potential in farm fields [23]. Although some studies have been conducted on the ecotoxic effects of ACE, the effects of ACE accumulation on microbial N cycle in riparian soils have been overlooked, and very few studies have addressed the inhibitory effect on N transformation rates and the related underlying microbial metabolism mechanisms, which are closely associated with N removal.
Based on these considerations, our study was carried out in the riparian zone of the North Canal in Hebei Province, China, to investigate the effects of ACE on the microbial N cycle. The study area is a typical agricultural production area in the North China Plain. A large number of agricultural nonpoint-source pollutants and rural domestic water are discharged into the North Canal through riparian zones, which leads to excessive eutrophication of water bodies [24]. The specific aims of this study were to (a) explore the effects of ACE on N transformation rates in riparian soils, (b) reveal the variation in the structure of microbial community participating in the N cycle, and (c) establish a response model between ACE, N transformation rates, and the microbial community. This study provides a possible mechanism for the impact of ACE on the microbial N cycle, which may be helpful in finding effective ways to mitigate the risk of ACE exposure to aquatic ecological health and biodiversity.
2. Materials and Methods
2.1. Soil Sample
Field sampling was carried out in the riparian zone of the lower reaches of the North Canal (39°41′25.55″ N, 116°57′9.36″ E), Langfang City, China. On 27 July 2021, surface soil cores (0–20 cm) were collected from three sites using a gravity corer. After collection, the soils from the sample sites were homogenized and then transported immediately to the laboratory in an insulated box with ice for analysis of physicochemical parameters, including pH, moisture content (MC), total nitrogen (TN), ammonia nitrogen (NH3-N), nitrate nitrogen (NO3−-N), nitrite nitrogen (NO2−-N), soil organic matter (SOM), total carbon (TC), and total phosphorus (TP). These parameters were analyzed according to the methods reported by Li et al. (2015) [25].
2.2. Experimental Setup
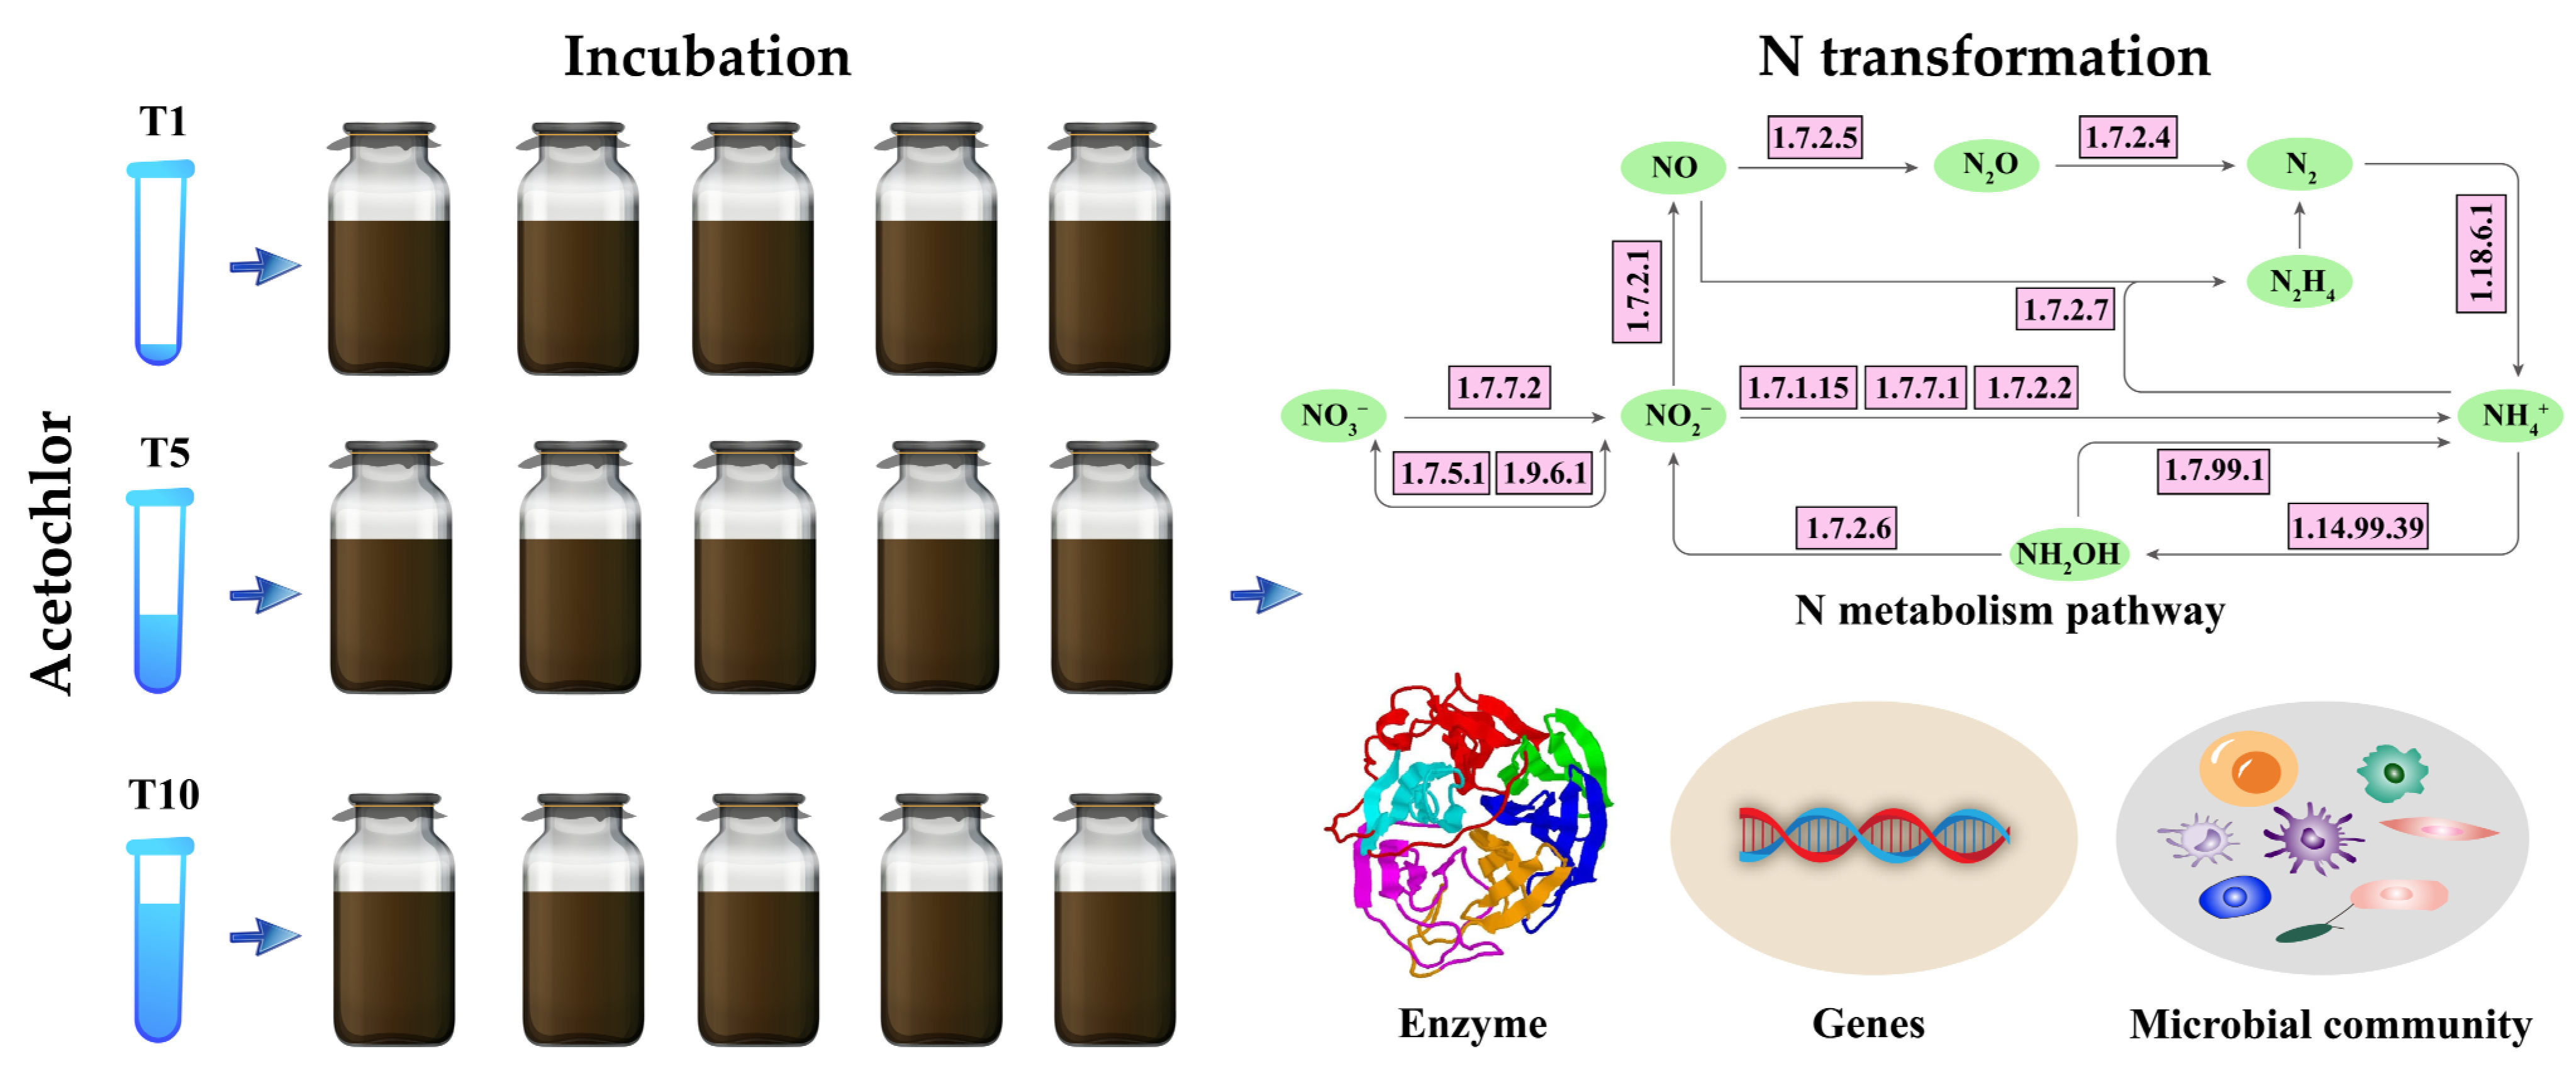
Before incubation, the riparian soil was stored in the dark at 4 °C for one day. The standard solution of ACE was purchased from Guangdong Wengjiang Chemical Reagent Co., Ltd., Guangzhou, China. Three concentrations (0.5, 2.5, and 5 mg kg−1) were applied to observe changes in the N-cycling microbial communities in riparian soils (Figure 1). Specifically, 0.5 mg kg−1 (T1) represents the recommended field dose of ACE, while 2.5 and 5 mg kg−1 (T5 and T10) represent the potential cumulative concentrations due to overapplication of ACE in some agricultural production activities. Riparian zones are hotspots suffering from agricultural nonpoint-source pollution [26], so they are often exposed to long-term added pesticides. Soil samples without ACE were used as controls.

Figure 1.
Flow chart outlining the mechanisms through which ACE affects riparian soils.
The riparian soil samples were first incubated in an incubator (MIR-253, Sanyo, Japan) at 25 °C and 60% humidity in the dark for seven days. Then, the three ACE treatments and a control group were prepared and incubated for 60 days in the dark. Five replicates were performed for each treatment. The details are as follows:
- A 50 g soil sample (dry weight) was placed into a 500 mL brown-amber glass jar.
- Three levels of ACE (T1, T5, and T10) were dissolved in 10 mL of sterilized water and then added to a 500 mL brown-amber glass jar containing 50 g of the soil sample. The blank control group only contained 10 mL of sterilized water.
- All soil solutions were mixed for 10 min on a vortex mixer (MX-S/MX-F, Dragon Laboratory Instruments Limited) until homogenized.
- A 200 g soil sample (dry weight) was added to each jar.
- Samples were mixed again for 30 min with periodic shaking to ensure sufficient mixing.
- The soil moisture was maintained at 60% of the maximum soil moisture capacity using sterilized water, and the jar mouth was covered with a breathable sealing film.
- The jars were incubated in the incubator at 25 °C and 60% humidity.
- Sterilized water was replenished every 10 days during the experiment to maintain soil moisture for all treatments.
At the end of the incubation period (60 days), riparian soil NH3-N, NO3−-N, and NO2−-N contents, soil potential nitrification rate (PNR), denitrification potential (DP), nitrifying and denitrifying enzyme activity, and the N-cycling microbial community composition were measured.
2.3. Potential Nitrification Rate and Denitrification Potential of Riparian Soils
The riparian soil PNR was determined by applying the approach reported by Fan et al. (2011) [27]. Specifically, 5 g of fresh soil was weighed into 150 mL sterile flasks, after which 100 mL of phosphate-buffered salt solution (1 mM, pH 7.4) and 0.5 mL of (NH4)2SO4 (0.25 M) were added. The sterile flasks were then placed in an orbital shaker and incubated at 25 °C for 24 h (180 rpm). During incubation, samples were collected every 6 h and centrifuged at 4 °C for 5 min. The contents of NH3-N and NO3−-N were measured by a continuous flow analyzer (FIAstar 5000 Analyzer, FOSS Tecator, Höganäs, Sweden). Soil PNR was estimated according to the rate of NO3−-N production.
The riparian soil DP was determined using the method reported by Xiong et al. (2015) [28]. Specifically, 25 g of fresh soil was added to 250 mL sterile flasks containing 20 mL of nutrient solution (including 0.1 g/L KNO3, 0.18 g/L glucose, and 1 g/L chloramphenicol). All flasks were sealed with rubber stoppers and then purged with high-purity (99.99%) N2 for 2 min to induce anaerobic conditions. Approximately 25 mL of C2H2 was added to block the conversion of N2O to N2 during denitrification. The flasks were then incubated in the dark in a constant-temperature incubator for 2 h at 25 °C. At the start and end of incubation, 10 mL of headspace gas samples were collected from each flask with a syringe. The content of N2O was measured by utilizing a gas chromatograph (Agilent GC6890N). Soil DP was determined as the difference between the initial and final N2O concentrations during incubation.
2.4. Enzyme Assays
2.4.1. Extraction of the Enzyme Solutions
First, 5 g of soil (dry weight) was added to a 50 mL centrifuge tube containing 20 mL of 0.1 M phosphate buffer (pH 7.4). The solution was rinsed three times, and the supernatant was discarded. Then, an additional 10 mL of phosphate buffer was added. The microbial cells were ultrasonically crushed for 1 min at 0 °C in a mixed ice-water bath using an ultrasonic cell crusher (JY-650E, Shanghai Chengzuo Instruments Co., Ltd., Shanghai, China), followed by centrifugation at 16,000 rpm for 10 min at 4 °C. Finally, the supernatant was collected for subsequent enzyme activity measurements [29].
2.4.2. Enzyme Activity Assays
The ammonia monooxygenase (amo) and nitrite oxidoreductase (nxr) activities were measured for nitrification, while the activities of nitrite reductase (nir) and nitric oxide reductase (nor) for denitrification were determined. All four enzymes were quantified using ELISA kits and enzyme markers (SAF-680T; Shanghai BaJiu Co., Ltd., Shanghai, China) according to the manufacturer’s protocols. The experiments were performed in triplicate. Specifically, the blank, standard, and sample wells were set in a 96-well ELISA plate. Then, the standards and the prepared enzyme solution samples were added correspondingly, and nothing was added to the blank well. After being reacted at 37 °C for 30 min, the plate was washed 5 times. Next, the enzyme reagents were added, followed by being reacted for another 30 min and washed 5 times. A color development solution was then added to develop the color at 37 °C for 10 min. Finally, the termination solution was added, and the absorbance value was read at 450 nm within 15 min. The enzyme activity was calculated based on the measured absorbance value.
2.5. Metagenomic Sequencing and Bioinformatic Analysis
Metagenomic sequencing was conducted on soil samples based on the protocols by MajorBio Co., Ltd., Shanghai, China. The DNA was extracted using the E.Z.N.A.® Soil DNA Kit (Omega Bio-tek, Norcross, GA, USA) and sequenced by the Illumina NovaSeq platform (Illumina Inc., San Diego, CA, USA). Raw reads were quality-trimmed using Fastp [30]. The clean data were then assembled using Megahit (https://github.com/voutcn/megahit, accessed on 3 August 2021). Contigs with a length over 300 bp were retained for further gene prediction and annotation. The open reading frames (ORFs) were predicted from contigs using MetaGene [31]. Subsequently, the predicted genes were clustered, and a nonredundant gene catalog was constructed using CD-HIT [32]. To determine the gene abundance, the sample reads were compared with those of the nonredundant gene catalog (95% identity) using SOAPaligner [33]. Taxonomic annotation was performed by comparing the nonredundant gene catalog with the NCBI NR database on BLASTP (e value < 10−5) [34]. Functional annotation was performed utilizing the Kyoto Encyclopedia of Genes and Genomes (KEGG) database [35].
2.6. Statistical Analysis
Statistical differences were determined using a one-way analysis of variance (ANOVA) and the Student’s t-test (SPSS 22.0), and the results were considered significant at p < 0.05. Heat maps were used to display the functional genes and microbial community abundance, and volcano plots were used to visualize the differences in the N-cycle microbial community (at the genus level) under the influence of ACE. Taxonomic information for each selected gene was extracted to explore the relative contribution of taxa to N-cycling genes, and their relationships were calculated using the method described by Ofek-Lalzar et al. (2014) [36]. The response model between ACE, enzyme activity, microbial community, and transformation rate was identified using structural equation modeling (SEM) using the AMOS 21.0 software.
3. Results and Discussion
3.1. N Transformation in Response to ACE
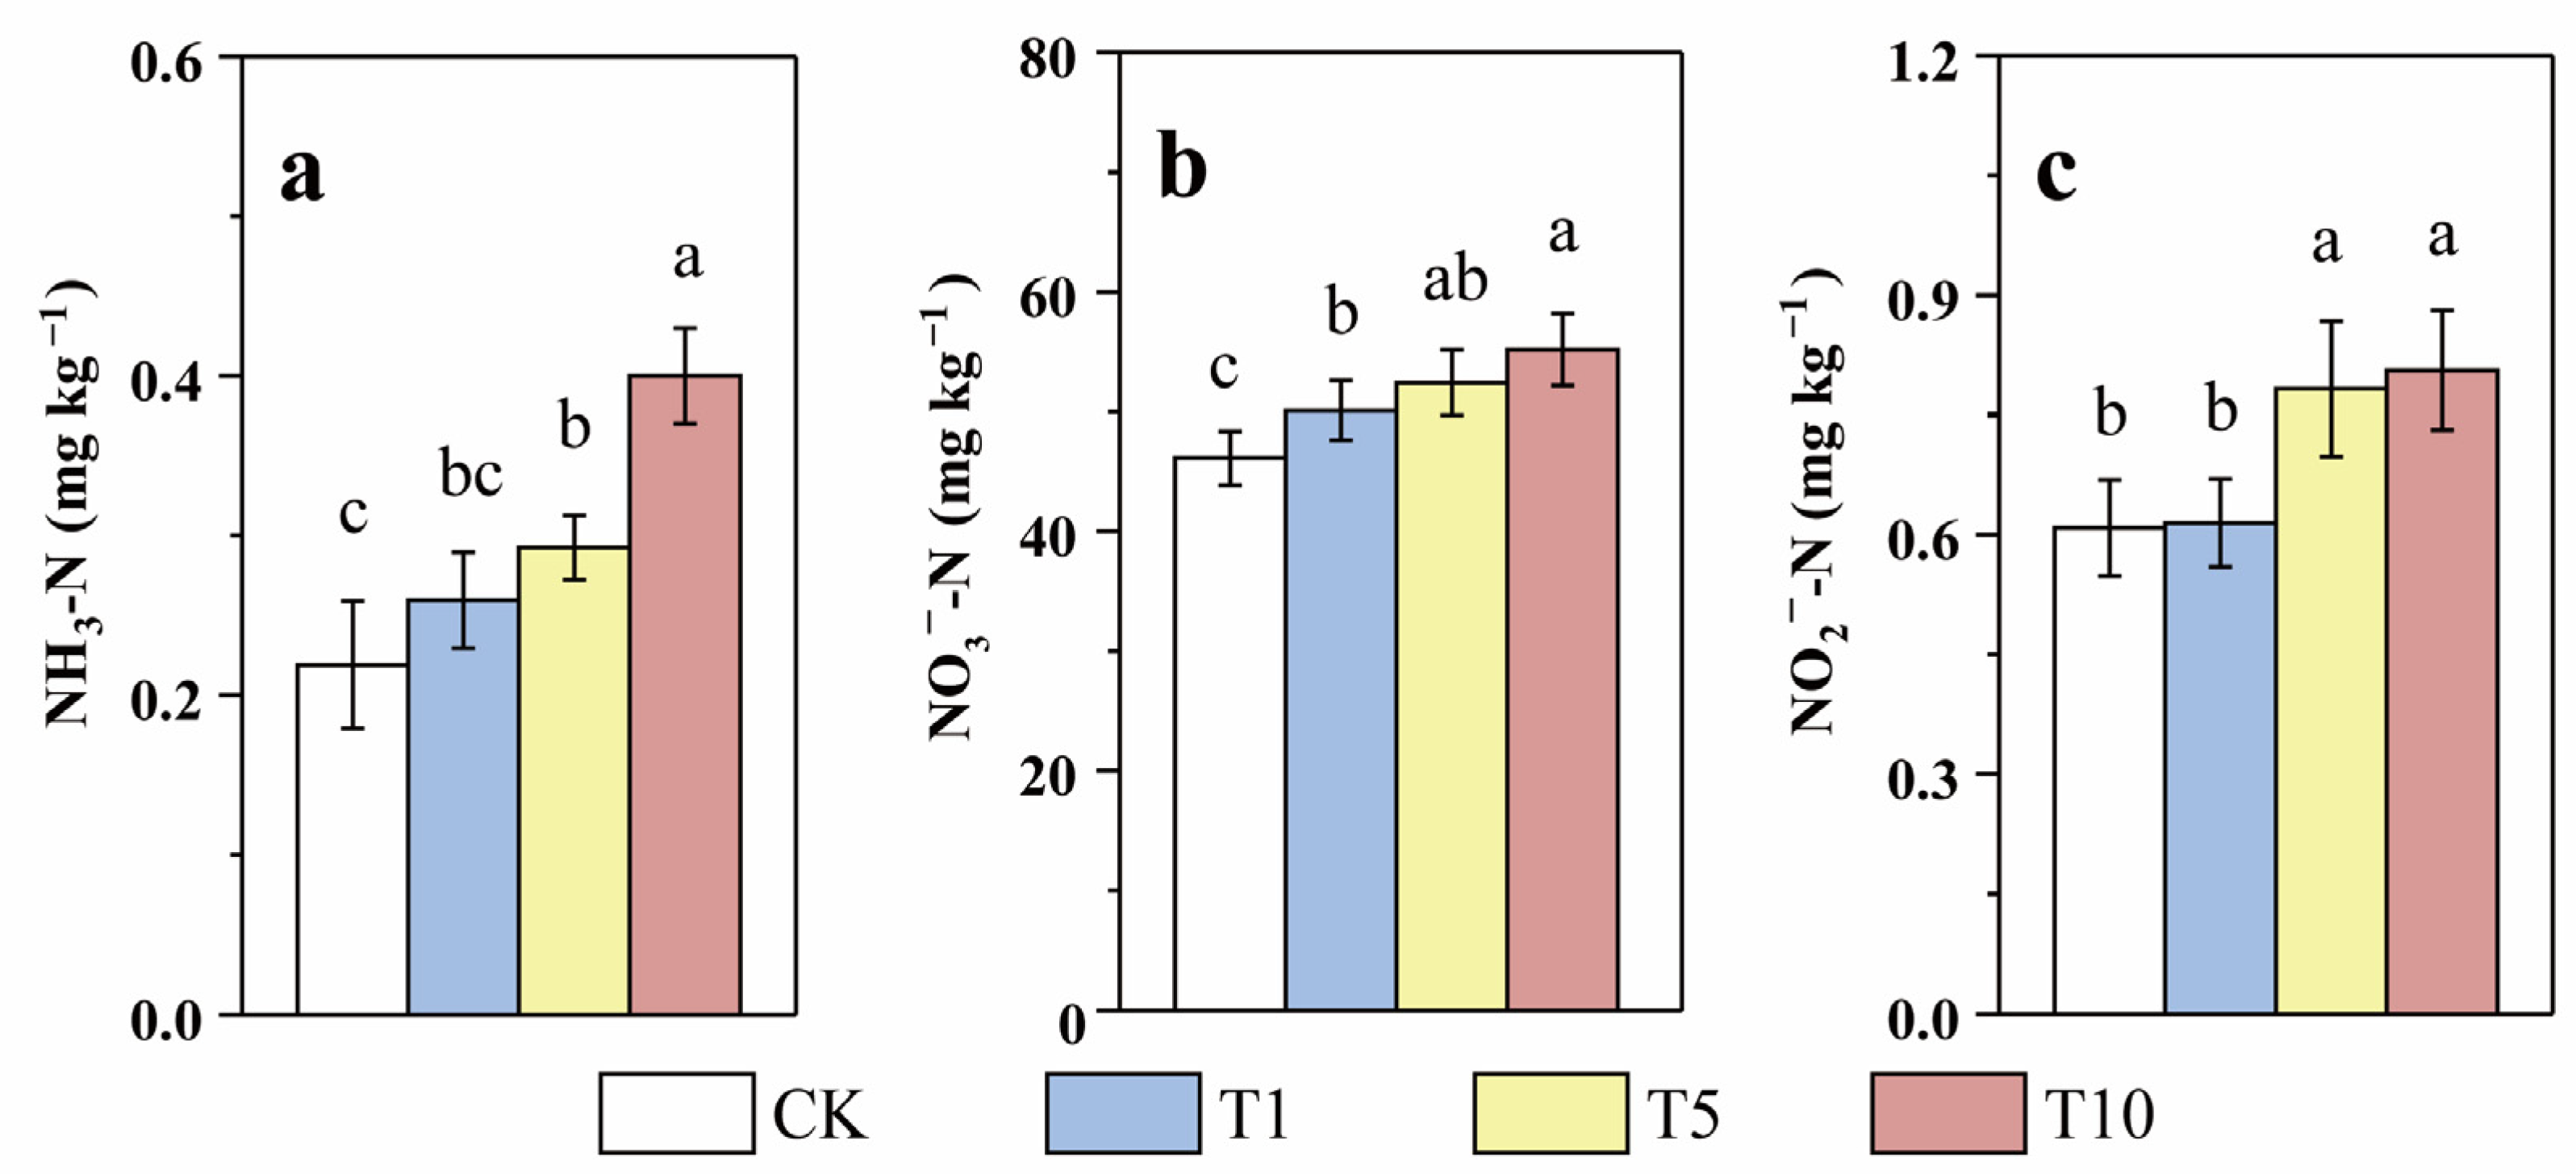
Currently, NO3−-N pollution of groundwater is an important concern in agricultural regions [37]. The physicochemical parameters of the riparian soil in our study are shown in Table 1, which shows that the NO3−-N content was relatively high and the NH3-N content was relatively low. This result is consistent with most of the studies in the North China Plain [38,39]. Following 60 days of incubation, the NH3-N, NO3−-N, and NO2−-N contents in the T1, T5, and T10 groups were obviously higher than those in CK (Figure 2), implying that the addition inhibited N transformation and removal. Moreover, the larger the ACE application, the more pronounced the inhibitory effect. For instance, the NH3-N, NO3−-N, and NO2−-N contents in T10 were 0.40, 55.18, and 0.81 mg kg−1, respectively, which were 1.82, 1.20, and 1.32 times those in CK, respectively. Compared to those of the soil background value, the NO3−-N and NO2−-N contents increased after incubation. This result is consistent with previous studies, which have also reported increased NO3−-N accumulation following chlorothalonil application [29].

Table 1.
Soil physicochemical parameters at the sampling site.

Figure 2.
Response of soil NH3-N (a), NO3−-N (b), and NO2−-N (c) contents to three levels of ACE treatment during incubation (Different lower case letters above columns indicate significant differences at p < 0.05).
3.2. PNR, DP, and Enzymatic Activity in Response to ACE
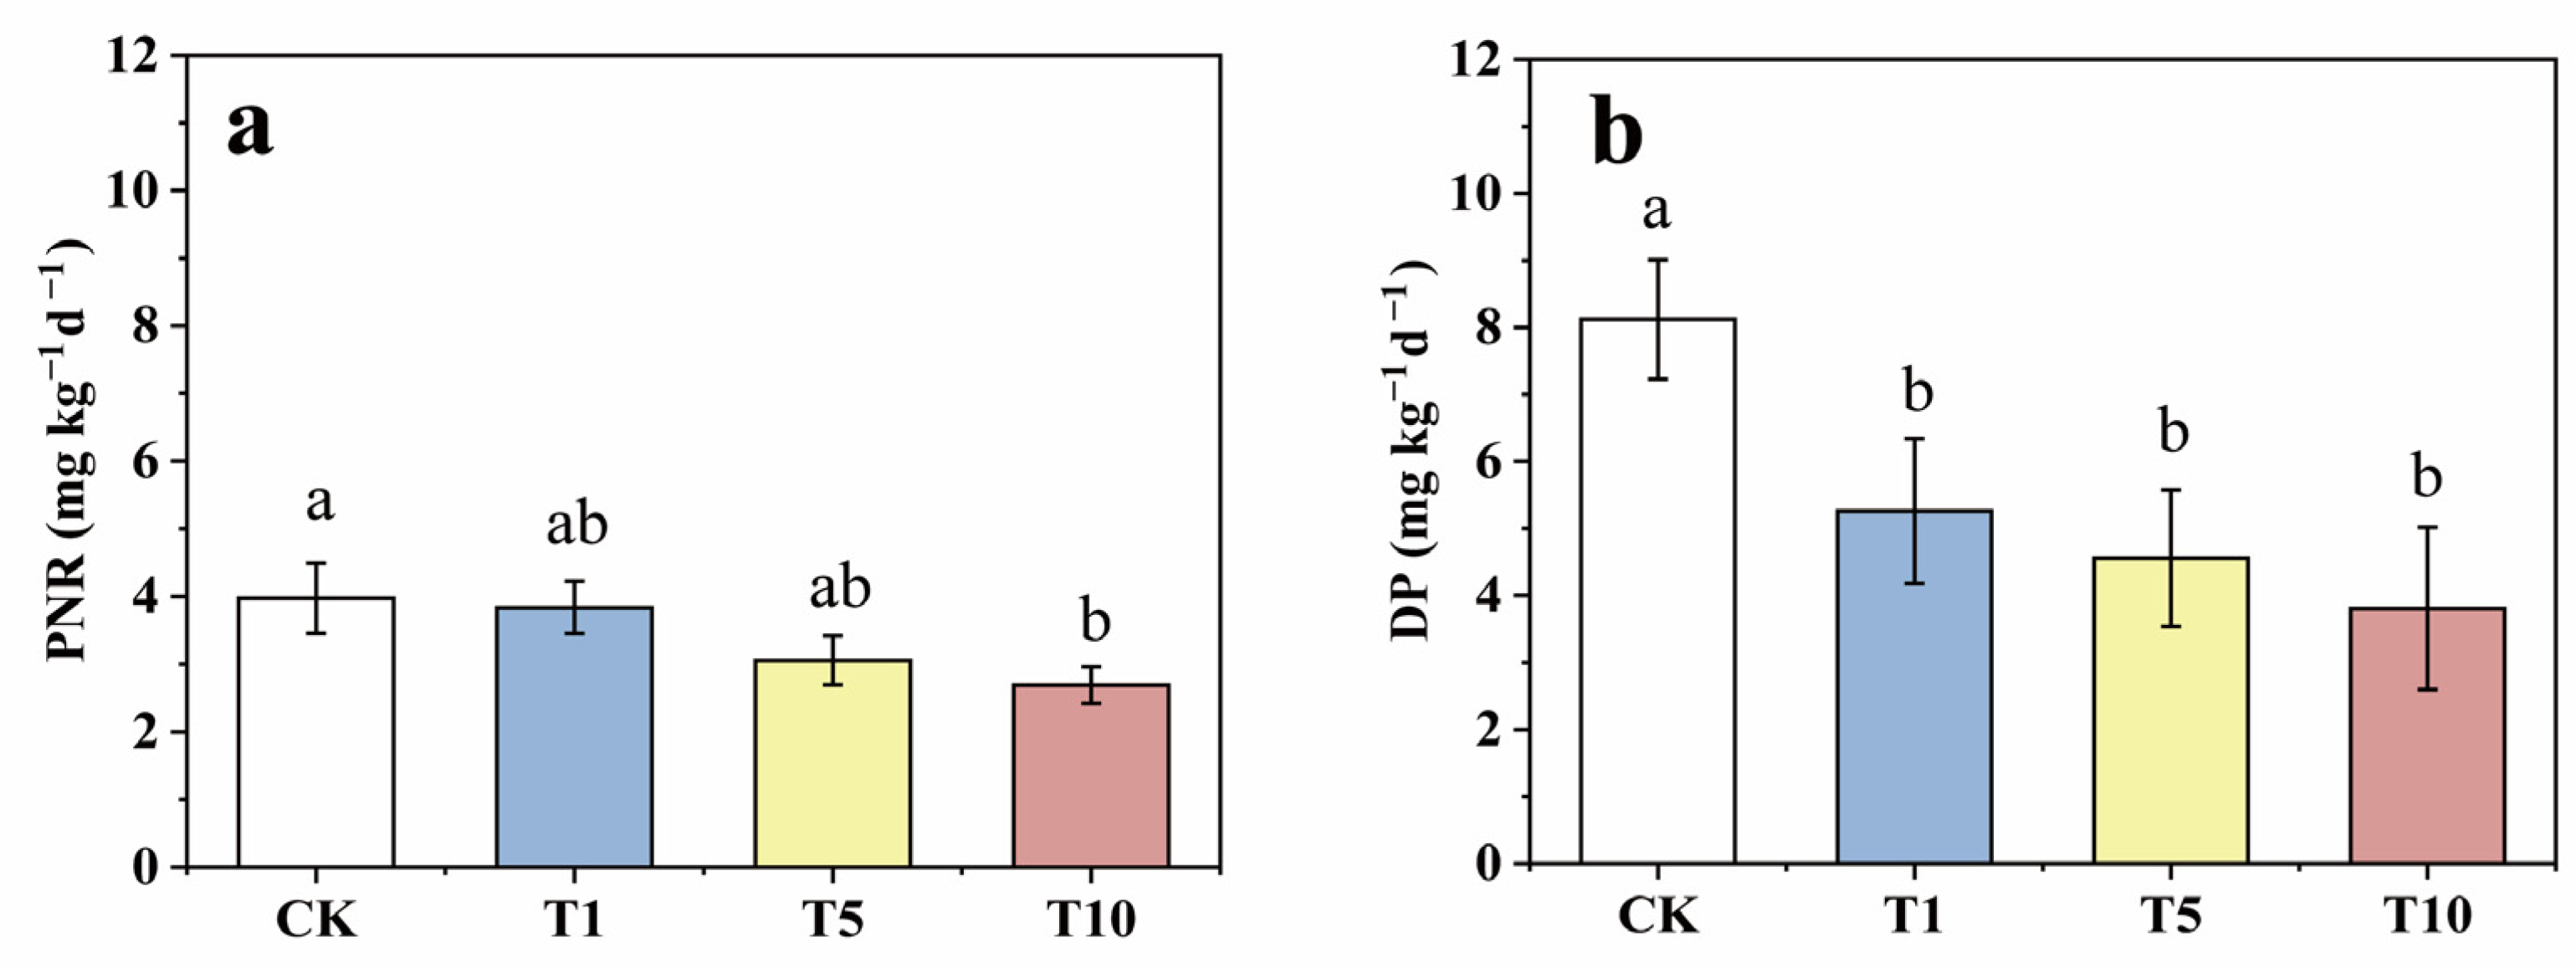
After incubation, compared to that of the CK, the soil PNR was reduced by 3.47, 23.13, and 32.39% in the T1, T5, and T10 groups, respectively (Figure 3a), which shows that ACE inhibition reduced the soil PNR. Similarly, DP decreased by 35.27, 43.89, and 53.13% in the T1, T5, and T10 groups, respectively, compared to those of the CK, which suggests that ACE addition also inhibited the soil DP (Figure 3b). Moreover, the inhibition of nitrification and denitrification was enhanced by increasing the concentration of ACE. Previous studies have reported similar inhibitions of different pesticides, such as mesotrione on the nitrification process and 2-chloro-4-phenylphenol on the denitrification process [40,41]. In addition, comparing the downward trends, the inhibitory effect of ACE on DP was stronger than that on PNR.
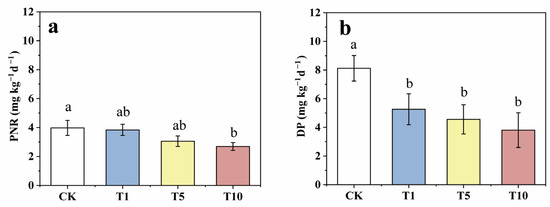
Figure 3.
The variations of soil PNR (a) and DP (b) in response to three levels of ACE treatment during incubation (Different lower case letters above columns indicate significant differences at p < 0.05).
Figure 4 shows the activities of the nitrifying enzymes (amo and nxr) and denitrifying enzymes (nor and nir) in response to the ACE treatments. Overall, the activities of these four enzymes decreased with increasing ACE addition and were positively correlated with variations in soil PNR and DP. Compared to those of the CK, the activities of amo, nxr, nor, and nir in T10 decreased by 57.84, 32.24, 21.28, and 70.99%, respectively, suggesting that ACE inhibited the activities of amo and nir to a greater extent than the activities of the other enzymes. Similar to our results, previous studies have shown that mesotrione exposure at 4.5 mg/kg decreased AOA-amoA and AOB-amoA gene abundance [42] and that chlorothalonil accumulation (>10 mg kg−1) remarkably inhibited the activities of denitrifying enzymes, such as nar, nir, and nos, but had no significant influence on the activity of nor [12].
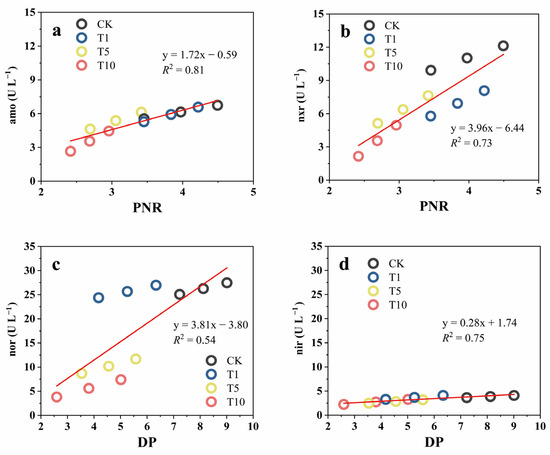
Figure 4.
The activities of nitrifying and denitrifying enzyme amo (a), nxr (b), nor (c) and nir (d) in response to three levels of ACE treatment.
3.3. N-Cycling Functional Genes and Microbial Communities in Response to ACE
Metagenomic sequencing was performed to determine the effect of ACE addition on the microbial community in riparian soil. The expression of the 28 KEGG genes related to the N-cycle in response to ACE is shown in Figure 5a. Compared to that of CK, the abundance of N-cycling functional genes increased by 3.64% in the T1 group but decreased by 14.50% and 15.88% in the T5 and T10 groups, respectively.
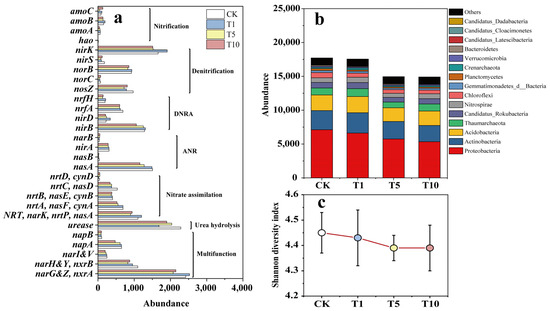
Figure 5.
The N-cycling functional genes (a), microbial community at the phylum level (b), and Shannon diversity index at the genus level (c) in response to ACE in the incubation.
The recommended dose (T1) did not significantly inhibit the abundance of N-cycle functional genes, but the projected higher ACE-level treatments (T5 and T10) showed a significant inhibitory effect. Many studies have investigated the effects of atrazine (another widely used herbicide) on soil microorganisms; however, the results have been inconsistent. The effects of atrazine on soil microbial biomass, diversity, and enzyme activities have been reported to be both positive [43,44] and negative [45,46]. One important reason for this phenomenon is related to the application dose, which is generally characterized by a significant inhibitory effect at high doses and less or even no inhibitory effect at low doses. Our study yielded the same results.
Compared to that of CK, the abundance of the nitrification module in T10 increased by 3.80%, mainly due to the increase in the abundance of the amoC gene, while the abundance of the other three functional genes decreased. The abundance of the denitrification module, dissimilatory nitrate reduction to ammonium (DNRA) module, assimilatory nitrate reduction (ANR) module, nitrate assimilation module, urea decomposition module, and multifunctional gene in T10 were reduced by 11.62, 16.05, 19.98, 19.65, 16.97, and 16.11%, respectively. The ANR showed the greatest decrease, followed by nitrate assimilation, which suggests that the process through which microorganisms absorb NO3−-N and convert it into their nitrogenous compounds was inhibited. Further, these findings revealed that ACE inhibited the growth and reproduction of microorganisms in the soil [47].
The results of the Student’s t-test showed a significant decrease in the abundance of 19 genes (p < 0.05) in the T10 group compared to that in the CK group (Table 2). While the abundance of seven functional genes did not change much, two functional genes increased significantly in abundance (p < 0.05). Meanwhile, the abundance of the functional genes nrtC&nasD, nasB, and nirS decreased by 37.83, 35.00, and 33.71%, respectively; these genes are mainly related to NO3−-N removal. Moreover, the abundance of the nitrification functional gene hao was significantly lower in the CK and was not detected in the T10 group.
Table 2.
Differences in N-cycling functional gene abundance between the CK and T10 groups.
As shown in Figure 5b, with increasing ACE, the abundance of microbial communities involved in the N cycle decreased. Further, 9 of the top 15 abundant phyla in T10 decreased significantly (p < 0.05), 5 phyla showed insignificant changes in abundance, but 1 phylum showed a significant increase in abundance (p < 0.05) (Table 3). Of these, the phylum Bacteroidetes experienced the greatest decrease in abundance, which was 50.65%, followed by Candidatus_Latescibacteria with a decrease of 48.28% and Candidatus_Dadabacteria with a decrease of 41.67%; however, Candidatus Cloacimonetes showed a significant increase in abundance (30.77%) (p < 0.05). The results of the relative contribution of phyla with respect to N-cycling genes showed that Bacteroidetes was mainly involved in the ANR, CandidatusLatescibacteria was mainly involved in the DNRA, and Candidatus Dadabacteria and Candidatus Cloacimonetes were mainly related to denitrification. Overall, most of the severely inhibited phyla were associated with NO3−-N removal.
Table 3.
Difference in N-cycling microbial community abundance at the phylum level between the CK and T10 groups (top 15 abundance).
Generally, pesticides are toxic substances that can have a direct killing effect on soil microbial species and populations, leading to the disruption of the balance of soil microbial communities; on the other hand, microorganisms have strong metabolic capabilities to utilize xenobiotics, which serve as their carbon and energy sources [48]. Numerous microbial species and strains from the soil, including Comamonadaceae, Ferribacterium, Klebsiella, and Rhodococcus, are reported to be capable of ACE metabolism [20]. ACE can supply available C and N as substrates for specific microorganisms, thereby allowing the growth of a fraction of the microbial population [19]. Hence, after the application of ACE, most species decreased in abundance, whereas a small proportion of species increased, and this small proportion might be able to use ACE to synthesize substances for their own growth.
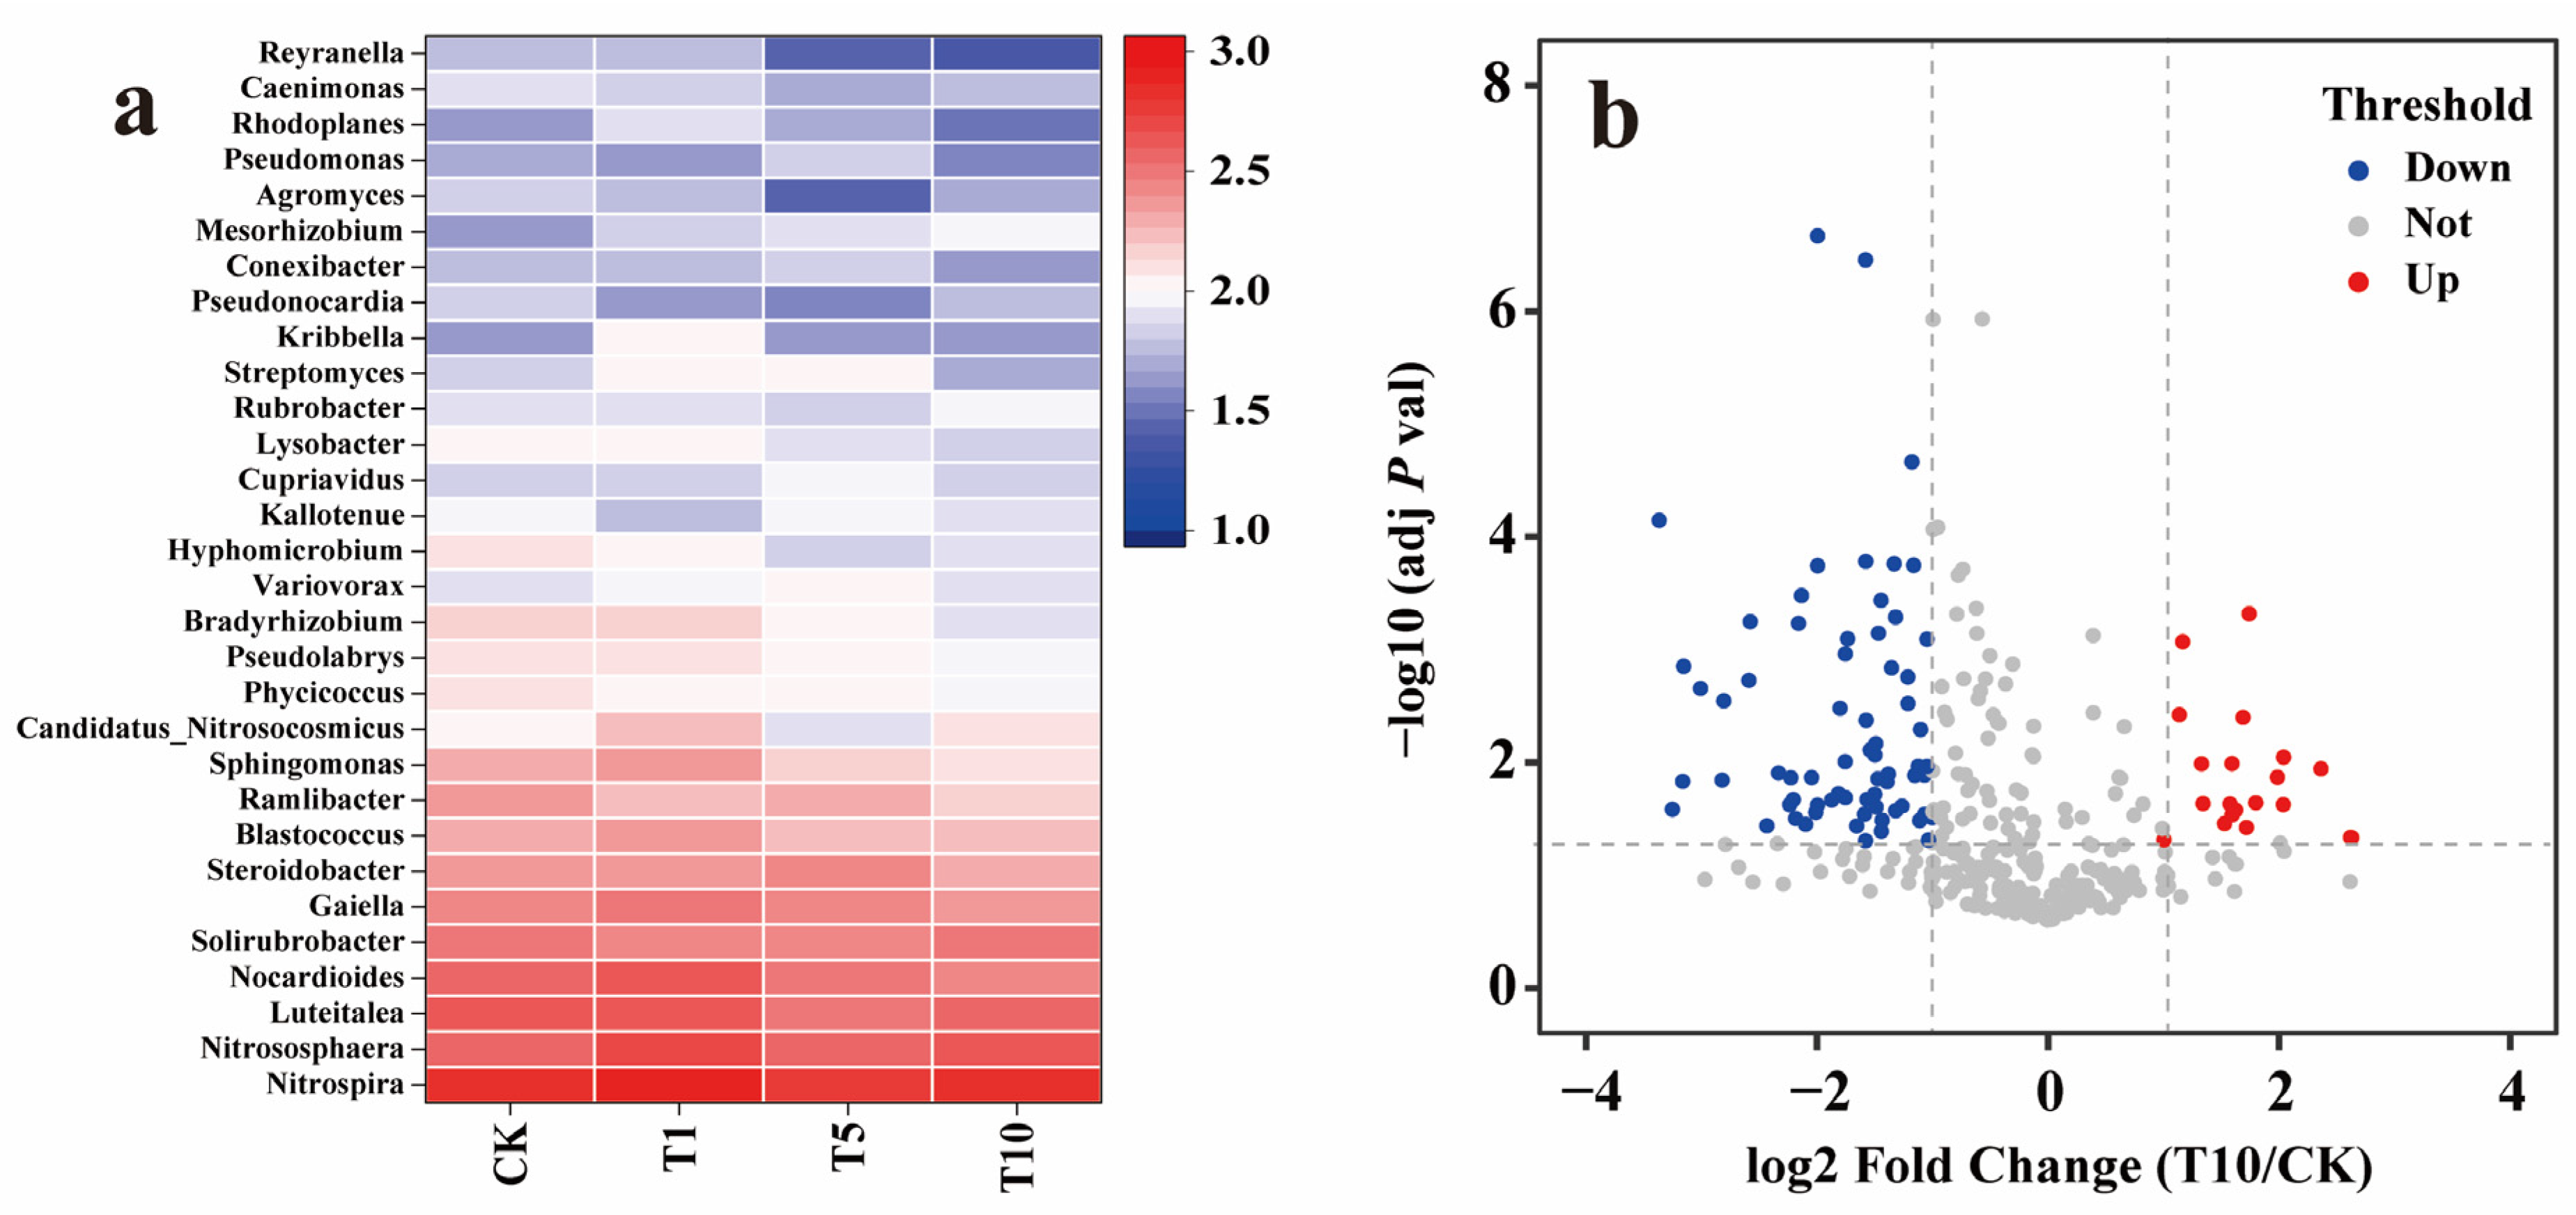
At the genus level, compared to that of CK, the Shannon diversity indices of the T1, T5, and T10 groups decreased by 0.02, 0.06, and 0.06, respectively, showing a slight downward trend (Figure 5c). Heatmap analysis showed that most of the top 30 abundant genera decreased in abundance as ACE concentration increased (Figure 6a). Specifically, compared to that in CK, 24 genera in T10 decreased in abundance. Of these, Reyranella showed the largest decrease (60.71%), followed by Bradyrhizobium with a decrease of 43.66% and Sphingomonas with a decrease of 40.57%. While six genera showed an increase in abundance, Mesorhizobium increased the most, by 104.76%, followed by Candidatus_Nitrosocosmicus, with an increase of 17.54%. The relative contributions of the genera to N-cycling genes showed that Reyranella, Bradyrhizobium, Sphingomonas, and Mesorhizobium mainly participated in denitrification, DNRA, nitrate assimilation, and ANR. Further, Candidatus_Nitrosocosmicus was mainly associated with urease activity. Similar to the analysis results at the phylum level, the heavily inhibited genera were also primarily associated with NO3−-N removal. An adjusted p-value (FDR) (p-value < 0.05) and fold change (FC) ratio (|log2FC| ≥ 1) were used to further determine the variation in all genera involved in the N cycle. The volcano plot shows that 82 genera, including Oleiharenicola, Ensifer, Skermanella, Hyalangium, and Cellulosimicrobium, showed a rapid and significant decrease. In contrast, 19 genera, including Pigmentiphaga, Klebsiella, Flavihumibacter, Bacillus, and Jannaschia, showed significant and rapid growth (Figure 6b). Overall, approximately 80% of genera were inhibited, and the highly variable genera usually had relatively low abundances.

Figure 6.
Analysis of the N-cycling microbial community at the genus level in response to ACE. (a) The top 30 abundant genera associated with the N cycle in response to ACE. (b) Volcano plot of the differentially expressed genera in comparing the T10 and CK groups. The blue point and the red point represent the significantly downregulated and the significantly upregulated genera (p-value < 0.05 and |log2 (fold-change| > 1), respectively.
3.4. Relationships between N Transformation Rate, Enzyme Activity, and the Microbial Community under the Influence of ACE
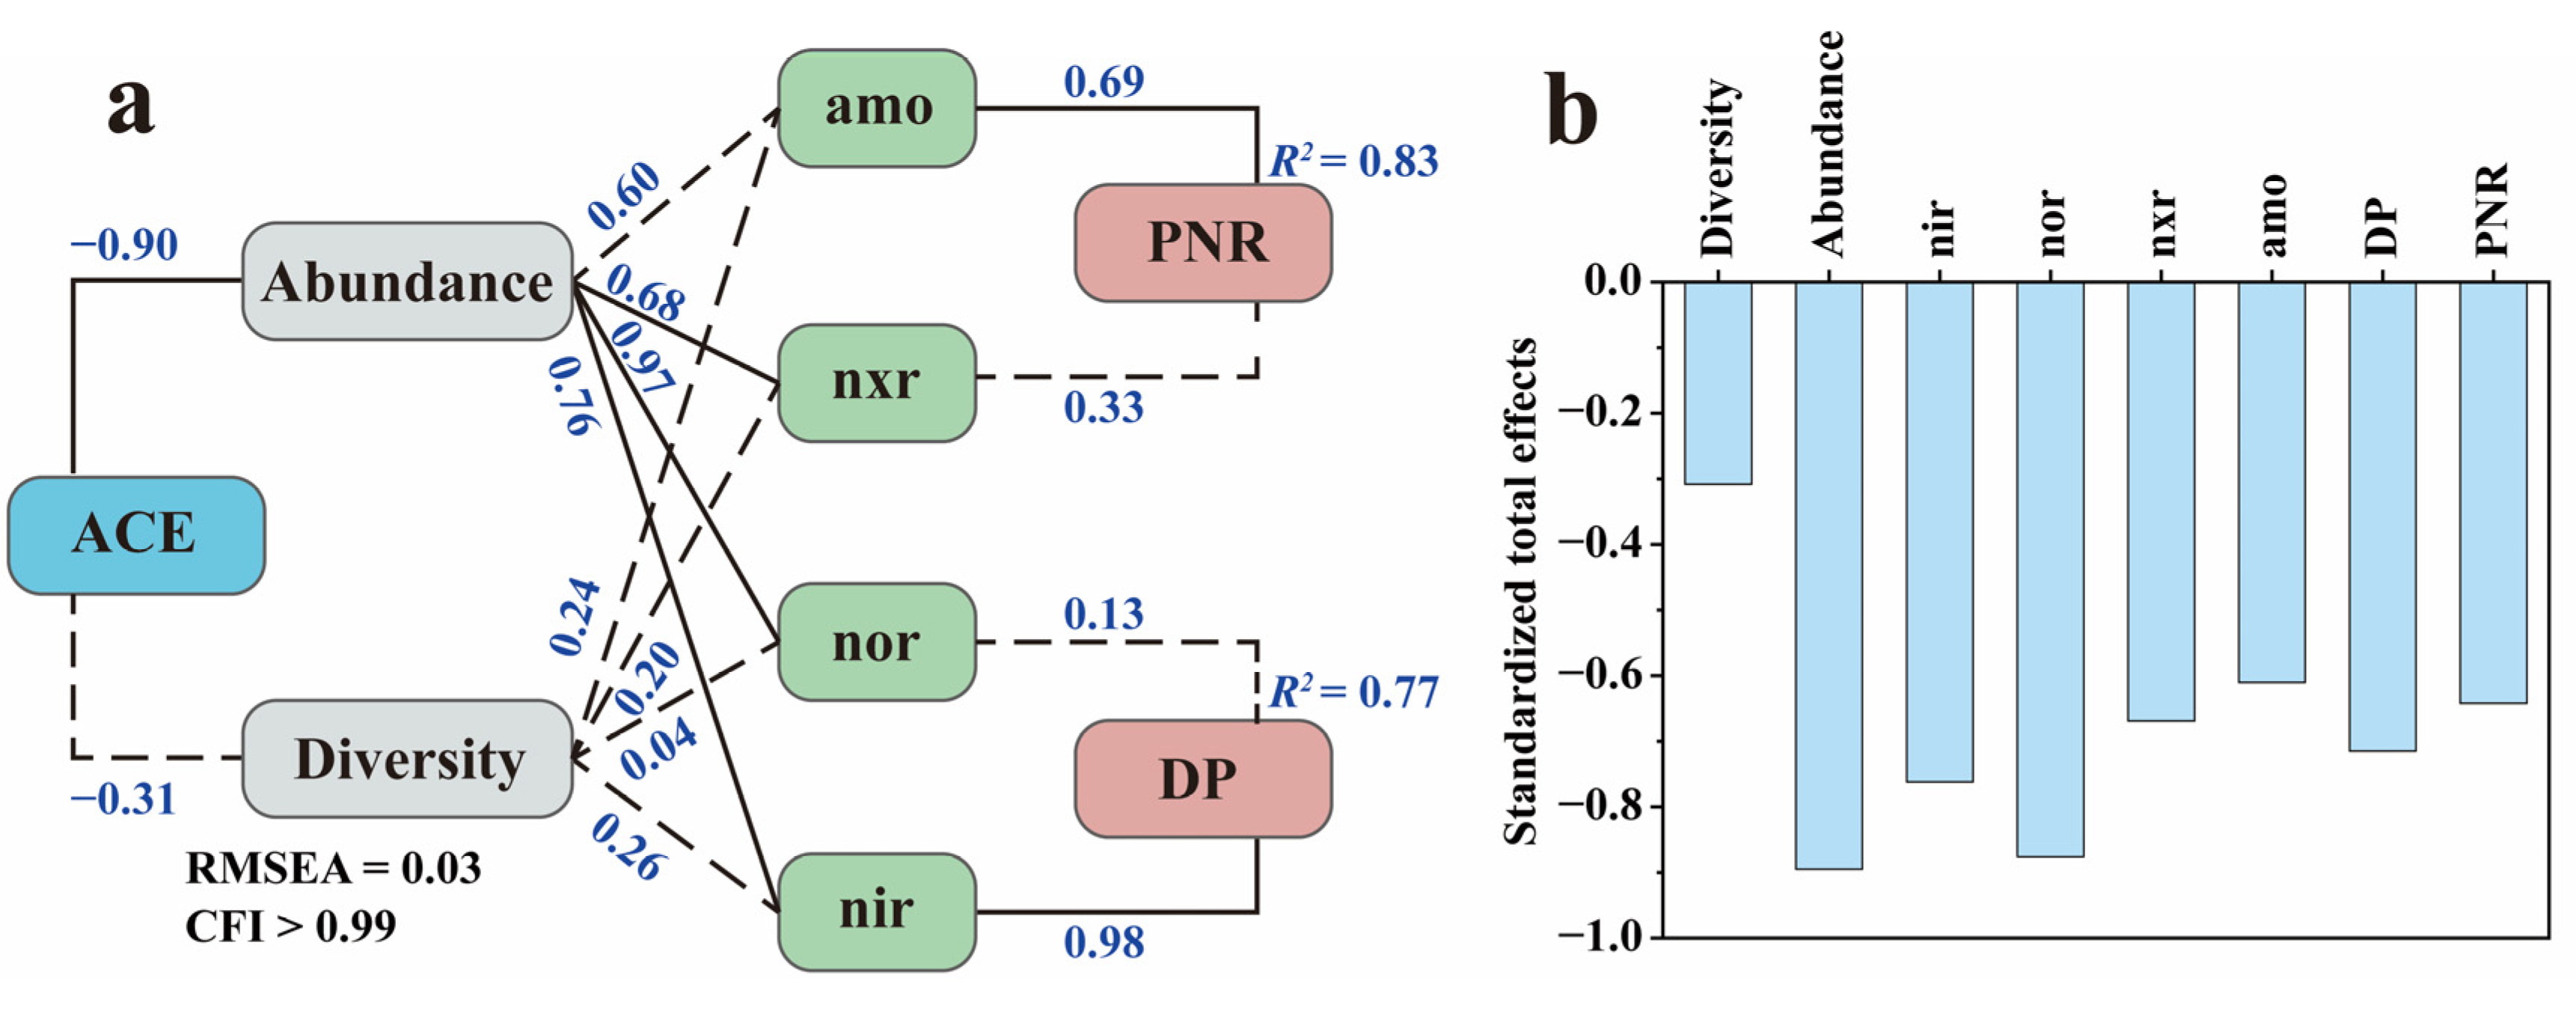
SEM is a statistical methodology that analyzes the relationships between variables based on their covariance matrix. The SEM framework for modeling the impact of ACE on the microbial N transformation process is presented in Figure 7a. The model’s validation findings, including RMSEA and CFI, suggested that the measurement model was valid and reliable. ACE exerted significant negative feedback effects (total effect = −0.90) on the N-cycling microbial community abundance while exerting no significant effect (total effect = −0.31) on the Shannon diversity index. These results were consistent with the above sequencing results, which showed that ACE inhibited the growth and reproduction of the N-cycling microbial community. Afterwards, the N-cycling microbial community abundance significantly positively affected nxr and nir activity, whereas the Shannon diversity index showed no significant effects on the activities of all four enzymes, which is indicative of a direct correlation between enzymatic activity and N microbial abundance but not with diversity. Finally, amo activity showed a significant effect (total effect = 0.69) on the PNR, and nir showed a significant effect (total effect = 0.98) on the DP, which indicates that, under ACE inhibition, the amo enzyme drove more changes in PNR than the nxr enzyme and the nir enzyme was more indicative of changes in DP than the nor enzyme.
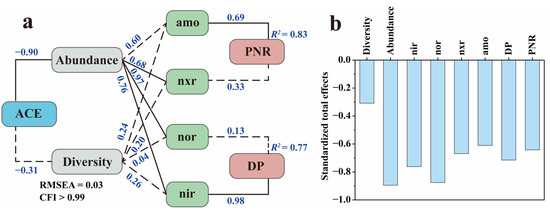
Figure 7.
Structural equation model of N transformation rate, enzyme activity, and the microbial community under the influence of ACE (a) and the standardized total impacts of ACE on N transformation rate, enzyme activity, and the microbial community (b). Solid lines represent significant effects (p < 0.01), and dashed lines represent insignificant ones. The numbers near the lines are the standardized path coefficients. R2 indicates the proportion of variance explained.
During nitrification, amo controls the step of NH3-N to NO2−-N, while nxr controls the step of NO2−-N to NO3−-N and also has the ability to reduce NO3−-N to NO2−-N [47]. The simultaneous oxidation and reduction properties may result in a poor indication of nxr. In denitrification, nir controls the step from NO2−-N to NO and nor controls the step from NO to N2O. A previous study reported that nir was more indicative of DP than nor under the inhibitory effect of chlorothalonil [12], which is similar to our results. The standardized total effect showed that ACE negatively affected all of the above microorganism indexes associated with N transformation (Figure 7b), and it could be found that the inhibitory effect on denitrification is greater than that on nitrification.
4. Conclusions
This study reports the effects of ACE on the soil microbial N cycle in riparian zones. We found that treatments T5 and T10, which represent 5 and 10 times the recommended dose of ACE, significantly deteriorated the soil N transformation and associated microbial community activity, whereas T1, which represented field-suggested doses, showed a weak inhibitory effect. Furthermore, we observed that among the 28 N cycle functional genes, the ANR functional gene abundance was the most significantly reduced, revealing an inhibitory effect on microbial growth and reproduction. These findings that we have presented suggest that excessive use of ACE can have an obvious impact on microbial nitrogen transformation in riparian soils.
Overall, this is a novel study to examine the responses of the soil N cycle to ACE in riparian zones at the microbial metabolism level, which provides a new insight for revealing the impacts of pesticides used in agricultural production on N removal in the transition region between farmland and surface water ecosystems. Our research at the current stage still focuses on short-term impacts under laboratory conditions; further long-term in situ field studies are necessary.
Author Contributions
C.L. and X.L. conceived, designed, and performed the algorithm and experiments; J.C. and F.J. conducted the field sampling; Y.X. provided advice for the revision of the paper. All authors have read and agreed to the published version of the manuscript.
Funding
This research was funded by the Central Public-Interest Scientific Institution Basal Research Fund (No. 2022YSKY-54).
Data Availability Statement
The data used to support the findings of this study are available from the corresponding author upon request.
Acknowledgments
The authors would like to thank the handling editor and anonymous reviewers for their valuable comments.
Conflicts of Interest
The authors declare no conflicts of interest.
References
- Galloway, J.N.; Townsend, A.R.; Erisman, J.W.; Bekunda, M.; Cai, Z.; Freney, J.R.; Martinelli, L.A.; Seitzinger, S.P.; Sttton, M.A. Transformation of the nitrogen cycle: Recent trends, questions, and potential solutions. Science 2008, 320, 889–892. [Google Scholar] [CrossRef]
- Hefting, M.M.; Bobbink, R.; Janssens, M.P. Spatial variation in denitrification and N2O emission in relation to nitrate removal efficiency in an-stressed riparian buffer zone. Ecosystems 2006, 9, 550–563. [Google Scholar] [CrossRef]
- Friedman, E.S.; McPhillips, L.E.; Werner, J.J.; Poole, A.C.; Ley, R.E.; Walter, M.T.; Angenent, L.T. Methane emission in a specific riparian-zone sediment decreased with bioelectrochemical manipulation and corresponded to the microbial community dynamics. Front. Microbiol. 2015, 6, 1523. [Google Scholar] [CrossRef]
- Groffman, P.M.; Boulware, N.J.; Zipperer, W.C.; Pouyat, R.V.; Band, L.E.; Colosimo, M.F. Soil nitrogen cycle processes in urban riparian zones. Environ. Sci. Technol. 2002, 36, 4547–4552. [Google Scholar] [CrossRef] [PubMed]
- Kim, H.; Bae, H.S.; Ramesh, K.R.; Ogram, A. Distributions, abundances and activities of microbes associated with the nitrogen cycle in riparian and stream sediments of a river tributary. Water Res. 2016, 106, 51–61. [Google Scholar] [CrossRef]
- Hayakawa, A.; Nakata, M.; Jiang, R.; Kuramochi, K.; Hatano, R. Spatial variation of denitrification potential of grassland, windbreak forest, and riparian forest soils in an agricultural catchment in eastern Hokkaido, Japan. Ecol. Eng. 2012, 47, 92–100. [Google Scholar] [CrossRef]
- Valkama, E.; Usva, K.; Saarinen, M.; Uusi-Kämppä, J. A meta-analysis on nitrogen retention by buffer zones. J. Environ. Qual. 2018, 48, 270–279. [Google Scholar] [CrossRef] [PubMed]
- Lyu, C.J.; Li, X.J.; Yuan, P.; Song, Y.H.; Gao, H.J.; Liu, R.X.; Yu, H.B. Nitrogen retention effect of riparian zones in agricultural areas: A meta-analysis. J. Clean. Prod. 2021, 315, 128143. [Google Scholar] [CrossRef]
- Otto, S.; Cardinali, A.; Marotta, E.; Paradisi, C.; Zanin, G. Effect of vegetative filter strips on herbicide runoff under various types of rainfall. Chemosphere 2012, 88, 113–119. [Google Scholar] [CrossRef]
- Janssen, M.; Frings, J.; Lennartz, B. Effect of grass buffer strips on nitrate export from a tile-drained field site. Agric. Water Manag. 2018, 208, 318–325. [Google Scholar] [CrossRef]
- Gene, S.M.; Hoekstra, P.F.; Hannam, C.; White, M.; Truman, C.; Hanson, M.L.; Prosser, R.S. The role of vegetated buffers in agriculture and their regulation across Canada and the United States. J. Environ. Manag. 2019, 243, 12–21. [Google Scholar] [CrossRef] [PubMed]
- Su, X.; Chen, Y.; Wang, Y.; Yang, X.; He, Q. Impacts of chlorothalonil on denitrification and N2O emission in riparian sediments: Microbial metabolism mechanism. Water Res. 2019, 148, 188–197. [Google Scholar] [CrossRef] [PubMed]
- Bicalho, S.T.T.; Langenbach, T.; Rodrigues, R.R.; Correia, F.V.; Hagler, A.N.; Matallo, M.B.; Luchini, L.C. Herbicide distribution in soils of a riparian forest and neighboring sugar cane field. Geoderma 2010, 158, 392–397. [Google Scholar] [CrossRef]
- Sun, X.Y.; Zhou, Q.X.; Wang, Y.Y.; Ren, W.J. Influence of hydro-geomorphology, land-use and riparian zone characteristics on herbicide occurrence and distribution in sediments in Songhua River Basin, northeastern China. Geoderma 2013, 194, 56–164. [Google Scholar] [CrossRef]
- Aguiar, T.; Bortolozo, F.R.; Hansel, F.A.; Rasera, K.; Ferreira, M.T. Riparian buffer zones as pesticide filters of no-till crops. Environ. Sci. Pollut. Res. 2015, 22, 10618–10626. [Google Scholar] [CrossRef]
- Vidon, P. Riparian zone management and environmental quality: A multicontaminant challenge. Hydrol. Process. 2010, 24, 1532–1535. [Google Scholar] [CrossRef]
- Li, Y.; Liu, X.; Wu, X.; Dong, F.; Xu, J.; Pan, X.; Zheng, Y. Effects of biochars on the fate of acetochlor in soil and on its uptake in maize seedling. Environ. Pollut. 2018, 241, 710–719. [Google Scholar] [CrossRef]
- Zhang, Y.; Hu, Y.; An, N.; Jiang, D.; Cao, B.; Jiang, Z.; Yan, Y.W.; Ming, C.S.; Meng, Q.J.; Han, W. Short-term response of soil enzyme activities and bacterial communities in black soil to a herbicide mixture: Atrazine and Acetochlor. Appl. Soil Ecol. 2023, 181, 104652. [Google Scholar] [CrossRef]
- Liu, J.W.; Zhang, X.; Xu, J.Y.; Qiu, J.G.; Zhu, J.C.; Cao, H.; He, J. Anaerobic biodegradation of acetochlor by acclimated sludge and its anaerobic catabolic pathway. Sci. Total Environ. 2020, 748, 141122. [Google Scholar] [CrossRef]
- Liu, H.P.; Wang, X.H.; Ou, Y.; Cheng, L.; Hou, X.; Yan, L.M. Characterization of acetochlor degradation and role of microbial communities in biofilters with varied substrate types. Chem. Eng. J. 2023, 467, 143417. [Google Scholar] [CrossRef]
- Wang, S.S.; Zhang, Y.; Gao, J.F.; Zhang, J.D.; Tao, L.M.; Xu, W.P. The enantioselective study of the toxicity effects of chiral acetochlor in HepG2 cells. Ecotoxicol. Environ. Saf. 2021, 218, 112261. [Google Scholar] [CrossRef] [PubMed]
- Huang, H.; Xiong, Z.T. Toxic effects of cadmium, acetochlor and bensulfuron-methyl on nitrogen metabolism and plant growth in rice seedlings. Pestic. Biochem. Phys. 2009, 94, 64–67. [Google Scholar] [CrossRef]
- Yu, J.H.; Zhang, J.; Zheng, X.Z.; Zhang, Y.S.; Chen, D.L.; Ding, H. Divergent modulation of land use-driven changes in soil properties and herbicide acetochlor application on soil nitrogen cycling. Soil Till. Res. 2022, 215, 105231. [Google Scholar] [CrossRef]
- Yuan, S.G.; Zhang, W.Q.; Li, W.Y.; Li, Z.H.; Wu, M.S.; Shan, B.Q. Shifts in the bacterial community caused by combined pollutant loads in the North Canal River, China. J. Environ. Sci. 2023, 127, 541–551. [Google Scholar] [CrossRef]
- Li, X.; Hou, L.; Liu, M.; Zheng, Y.; Yin, G.; Lin, X.; Cheng, L.; Li, Y.; Hu, X. Evidence of nitrogen loss from anaerobic ammonium oxidation coupled with ferric iron reduction in an intertidal wetland. Environ. Sci. Technol. 2015, 49, 11560–11568. [Google Scholar] [CrossRef]
- Phogat, V.; Cox, J.W.; Kookana, R.S.; Šimůnek, J.; Pitt, T.; Fleming, N. Optimizing the riparian zone width near a river for controlling lateral migration of irrigation water and solutes. J. Hydrol. 2019, 570, 637–646. [Google Scholar] [CrossRef]
- Fan, F.; Zhang, F.; Lu, Y. Linking plant identity and interspecific competition to soil nitrogen cycling through ammonia oxidizer communities. Soil Biol. Biochem. 2011, 43, 46–54. [Google Scholar] [CrossRef]
- Xiong, Z.; Li, S.; Yao, L.; Liu, G.; Zhang, Q.; Liu, W. Topography and land use effects on spatial variability of soil denitrification and related soil properties in riparian wetlands. Ecol. Eng. 2015, 83, 437–443. [Google Scholar] [CrossRef]
- Hu, X.; Wang, Y.; Su, X.; Chen, Y. Acute response of soil denitrification and N2O emissions to chlorothalonil: A comprehensive molecular mechanism. Sci. Total Environ. 2018, 636, 1408–1415. [Google Scholar] [CrossRef]
- Chen, S.; Zhou, Y.; Chen, Y.; Gu, J. Fastp: An ultra-fast all-in-one FASTQ preprocessor. Bioinformatics 2018, 34, i884–i890. [Google Scholar] [CrossRef] [PubMed]
- Noguchi, H.; Park, J.; Takagi, T. MetaGene: Prokaryotic gene finding from environmental genome shotgun sequences. Nucl. Acid. Res. 2006, 34, 5623–5630. [Google Scholar] [CrossRef]
- Li, W.Z.; Godzik, A. Cd-hit: A fast programfor clustering and comparing large sets of protein or nucleotide sequences. Bioinformatics 2006, 22, 1658–1659. [Google Scholar] [CrossRef]
- Peng, Y.; Leung, H.C.M.; Yiu, F.Y.L.; Chin, F.Y.L. IDBA-UD: A de novo assembler for single-cell and metagenomic sequencing data with highly uneven depth. Bioinformatics 2012, 28, 1420–1428. [Google Scholar] [CrossRef]
- Altschul, S.F.; Madden, T.L.; Schäffer, A.A.; Zhang, J.; Zhang, Z.; Miller, W.; Lipman, D.J. Gapped BLAST and PSI-BLAST: A new generation of protein database search programs. Nucl. Acid. Res. 1997, 25, 3389–3402. [Google Scholar] [CrossRef]
- Zheng, Y.L.; Hou, L.J.; Liu, M.; Newell, S.E.; Yin, G.Y.; Yu, C.D.; Zhang, H.L.; Li, X.F.; Gao, D.Z.; Gao, J.; et al. Effects of silver nanoparticles on nitrification and associated nitrous oxide production in aquatic environments. Sci. Adv. 2017, 3, e1603229. [Google Scholar] [CrossRef] [PubMed]
- Ofek-Lalzar, M.; Sela, N.; Goldman-Voronov, M.; Green, S.J.; Hadar, Y.; Minz, D. Niche and host-associated functional signatures of the root surface microbiome. Nat. Commun. 2014, 5, 4950. [Google Scholar] [CrossRef]
- Yu, C.; Huang, X.; Chen, H.; Godfray, H.C.J.; Wright, J.S.; Hall, J.W.; Gong, P.; Ni, S.; Qiao, S.; Huang, G.; et al. Managing nitrogen to restore water quality in China. Nature 2019, 567, 516–520. [Google Scholar] [CrossRef] [PubMed]
- Ju, X.T.; Kou, C.L.; Zhang, F.S.; Christie, P. Nitrogen balance and groundwater nitrate contamination: Comparison among three intensive cropping systems on the North China Plain. Environ. Pollut. 2006, 143, 117–125. [Google Scholar] [CrossRef]
- Gai, X.; Liu, H.; Liu, J.; Zhai, L.; Wang, H.; Yang, B.; Ren, T.; Wu, S.; Lei, Q. Contrasting impacts of long-term application of manure and crop straw on residual nitrate-N along the soil profile in the North China Plain. Sci. Total Environ. 2019, 650, 2251–2259. [Google Scholar] [CrossRef]
- Du, Z.K.; Zhu, Y.Y.; Zhu, L.S.; Zhang, J.; Li, B.; Wang, J.H.; Wang, J.; Zhang, C.; Cheng, C. Effects of the herbicide mesotrione on soil enzyme activity and microbial communities. Ecotox. Environ. Saf. 2018, 164, 571–578. [Google Scholar] [CrossRef] [PubMed]
- Holzem, R.M.; Stapleton, H.M.; Gunsch, C.K. Determining the ecological impacts of organic contaminants in biosolids using a high-throughput colorimetric denitrification assay: A case study with antimicrobial agents. Environ. Sci. Technol. 2014, 48, 1646–1655. [Google Scholar] [CrossRef] [PubMed]
- Crouzet, O.; Batisson, I.; Besse-Hoggan, P.; Bonnemoy, F.; Bardot, C.; Poly, F.; Bohatier, J.; Mallet, C. Response of soil microbial communities to the herbicide mesotrione: A dose-effect microcosm approach. Soil Biol. Biochem. 2015, 42, 193–202. [Google Scholar] [CrossRef]
- Bonfleur, E.J.; Tornisielo, V.L.; Regitano, J.B.; Lavorenti, A. The effects of glyphosate and atrazine mixture on soil microbial population and subsequent impacts on their fate in a tropical soil. Water Air Soil Pollut. 2015, 226, 21. [Google Scholar] [CrossRef]
- Chen, Q.; Yang, B.; Wang, H.; He, F.; Gao, Y.; Scheel, R.A. Soil microbial community toxic response to atrazine and its residues under atrazine and lead contamination. Environ. Sci. Pollut. Res. 2015, 22, 996–1007. [Google Scholar] [CrossRef]
- Gao, J.; Song, P.; Wang, G.; Wang, J.; Zhu, L.; Wang, J. Responses of atrazinedegradation and native bacterial community in soil to Arthrobacter sp. strain HB-5. Ecotoxicol. Environ. Saf. 2018, 159, 317–323. [Google Scholar] [CrossRef]
- Singh, R.P.; Ahsan, M.; Mishra, D.; Pandey, V.; Anupama; Yadav, A.; Khare, P. Ameliorative effects of biochar on persistency, dissipation, and toxicity of atrazine inthree contrasting soils. J. Environ. Manag. 2022, 303, 114146. [Google Scholar] [CrossRef]
- Kuypers, M.M.M.; Marchant, H.K.; Kartal, B. The microbial nitrogen-cycling network. Nat. Rev. Microbiol. 2018, 16, 263–276. [Google Scholar] [CrossRef]
- Singh, S.; Kumar, V.; Chauhan, A.; Datta, S.; Wani, A.B.; Singh, N.; Singh, J. Toxicity, degradation and analysis of the herbicide atrazine. Environ. Chem. Lett. 2017, 16, 211–237. [Google Scholar] [CrossRef]


Disclaimer/Publisher’s Note: The statements, opinions and data contained in all publications are solely those of the individual author(s) and contributor(s) and not of MDPI and/or the editor(s). MDPI and/or the editor(s) disclaim responsibility for any injury to people or property resulting from any ideas, methods, instructions or products referred to in the content. |
© 2024 by the authors. Licensee MDPI, Basel, Switzerland. This article is an open access article distributed under the terms and conditions of the Creative Commons Attribution (CC BY) license (https://creativecommons.org/licenses/by/4.0/).