Abstract
Satellite precipitation products (SPPs) are undeniably subject to uncertainty due to retrieval algorithms and sampling issues. Many research efforts have concentrated on merging SPPs to create high-quality merged precipitation datasets (MPDs) in order to reduce these uncertainties. This study investigates the efficacy of dynamically weighted MPDs in contrast to those using static weights. The analysis focuses on comparing MPDs generated using the “dynamic clustered Bayesian averaging (DCBA)” approach with those utilizing the “regional principal component analysis (RPCA)” under fixed-weight conditions. These MPDs were merged from SPPs and reanalysis precipitation data, including TRMM (Tropical Rainfall Measurement Mission) Multi-satellite Precipitation Analysis (TMPA) 3B42V7, PERSIANN-CDR, CMORPH, and the ERA-Interim reanalysis precipitation data. The performance of these datasets was evaluated in Pakistan’s diverse climatic zones—glacial, humid, arid, and hyper-arid—employing data from 102 rain gauge stations. The effectiveness of the DCBA model was quantified using Theil’s U statistic, demonstrating its superiority over the RPCA model and other individual merging methods in the study area The comparative performances of DCBA and RPCA in these regions, as measured by Theil’s U, are 0.49 to 0.53, 0.38 to 0.45, 0.37 to 0.42, and 0.36 to 0.43 in glacial, humid, arid, and hyper-arid zones, respectively. The evaluation of DCBA and RPCA compared with SPPs at different elevations showed poorer performance at high altitudes (>4000 m). The comparison of MPDs with the best performance of SPP (i.e., TMPA) showed significant improvement of DCBA even at altitudes above 4000 m. The improvements are reported as 49.83% for mean absolute error (MAE), 42.31% for root-mean-square error (RMSE), 27.94% for correlation coefficient (CC), 40.15% for standard deviation (SD), and 13.21% for Theil’s U. Relatively smaller improvements are observed for RPCA at 13.04%, 1.56%, 10.91%, 1.67%, and 5.66% in the above indices, respectively. Overall, this study demonstrated the superiority of DCBA over RPCA with static weight. Therefore, it is strongly recommended to use dynamic variation of weights in the development of MPDs.
1. Introduction
Precipitation is essential to the dynamics of the hydrological cycle, influences global climate change, and is a critical factor in environmental research [1,2,3]. In the realm of hydrological modeling and climate change studies, the accuracy and precision of precipitation estimation are paramount. Despite this, dealing with the significant variations in precipitation over time and space in countries with topographies as complicated as Pakistan is a challenging task [4]. Consequently, a comprehensive understanding of the spatial and temporal distribution of precipitation is crucial. Detailed precipitation data, capturing the variability across different scales, are indispensable for effective water resource planning and management. These data are instrumental in developing flood forecasting models, designing irrigation systems, and formulating adaptive strategies to cope with the impacts of climate variability and change. This understanding aids in the effective evaluation of water management strategies and facilitates the planning of various socio-economic endeavors [5].
The primary sources of precipitation estimation include rain gauges (RGs), weather radars, satellites, and atmospheric reanalysis products [6]. The precipitation records obtained at traditional RGs are the most accurate point-scale precipitation estimations. Nevertheless, the considerable variability in precipitation over space and time, coupled with the limited distribution of rain gauges (RGs), poses substantial challenges in precisely recording the spatial and temporal variations in precipitation [7,8]. Satellite precipitation products (SPPs) and reanalysis precipitation datasets, on the other hand, are the only sources of precipitation that provide homogenous regional- and global-scale estimates. In the past three decades, satellite precipitation products (SPPs) have emerged as a cost-effective and reliable means for measuring precipitation on both regional and global scales. The observed efficiency can be largely attributed to the swift progress in remote sensing methodologies, coupled with ongoing improvements in the algorithms employed for extracting precipitation data from satellite imagery [8,9,10]. In parallel to these developments, the field of satellite-based precipitation measurement has seen substantial advancements, particularly with the incorporation of new sensor technologies and improved data analysis methods. The integration of diverse passive and active remote sensing techniques, ranging from ground-based observations to advanced satellite systems, has markedly enhanced the accuracy and reliability of precipitation data. Significant progress has been made in refining the capabilities of satellites to monitor various precipitation patterns, including those in cold-season scenarios. The introduction of novel sensors and missions, such as the Advanced Microwave Scanning Radiometer (AMSR-3) on the Global Observing Satellite for Greenhouse Gases and Water Cycle (GOSAT-GW) and the Earth Cloud, Aerosol and Radiation Explorer (EarthCARE) W-band radar, promises further advancements in our ability to accurately monitor and analyze precipitation worldwide. These technological innovations are pivotal in enhancing our understanding of the hydrological cycle and are invaluable for regions with limited ground-based observations [11]. Significant progress has been made in techniques for estimating precipitation through satellites, resulting in improved precision and expanded range. Meteorological satellites in low Earth orbit (LEO), managed by organizations such as United States National Oceanic and Atmospheric Administration (NOAA) and National Aeronautics and Space Administration (NASA), have grown increasingly essential for analyzing precipitation on both global and regional scales, particularly in areas where ground-based measurements are limited. These satellites, equipped with advanced sensors and sophisticated algorithms, significantly enhance precipitation data retrieval. The combination of active and passive microwave sensing technologies, along with the creation of innovative tools, such as the Advanced Microwave Scanning Radiometer (AMSR-3) and the EarthCARE W-band radar, has demonstrated potential in monitoring various precipitation patterns, encompassing those prevalent in cold-season scenarios [11]. Additionally, the Time-Resolved Observations of Precipitation structure and storm Intensity with a Constellation of Smallsats (TROPICS) mission is set to improve global revisit times, which is critical for understanding phenomena like tropical cyclone intensification [12]. These technological advancements significantly enhance the reliability of precipitation data, which is crucial for accurate hydrological modeling and climate research. There are a number of SPPs available to the public that have been extensively used in many studies including water resource management [13,14], hydrological modeling [15,16,17,18,19], and extreme events analysis [16,20,21,22,23].
Despite this, it is impossible to completely eliminate the possibility of mistakes in any of the SPPs because of the retrieval algorithms and sampling problems. Moreover, the climate of the region, topography, altitude, seasonality, and many other factors are also responsible for the high uncertainties associated with individual SPPs [24,25,26,27]. Several researchers have concentrated their efforts on combining various SPP datasets in order to produce precipitation products of superior quality in an effort to reduce the impact of these uncertainties [28,29]. These MPDs are developed using two different approaches, i.e., fixed and dynamic varying SPP weights. The dynamic variation of weights means to vary the weights both in space and time to account for the varying performances of SPPs spatiotemporally. For instance, Rahman, Shang [4] and Muhammad et al. [29] developed MPDs using the fixed-weight approaches. Rahman, Shang [4] merged two of the best SPPs, namely Tropical Rainfall Measuring Mission (TRMM) Multi-satellite Precipitation Analysis (TMPA) and Global Precipitation Measurement (GPM)-based Integrated Multi-Satellite Retrievals for GPM (IMERG), using principal component analysis (PCA) and sample t-test comparison methods. Their findings showed an increase in estimated precipitation and reduced uncertainty in a variety of climate zones. Using the leave-one-out cross-validation (LOOCV) method, Muhammad et al. [29] constructed MPD by assigning weights to the IMERG research (IR), IMERG real-time (IT), and TRMM 3B42 (RT) models. Based on the findings, it was determined that MPD displayed a higher level of agreement with RGs than certain particular SPPs.
Researchers suggested the dynamic variation of weights with time, and the weights are varied both in space and time using the moving averaging technique by collecting estimations of the average precipitation over 40 days [6]. Recently, Rahman, Shang [26] and Rahman and Shang [30] merged four SPPs using DCBA and dynamic Bayesian model averaging (DBMA) across four climate (glacial, humid, arid, and hyper-arid) zones of Pakistan. Each of the studies documented a notable enhancement in performance along with a considerable decrease in uncertainties. The dynamic Weighted Average Least Square (WALS) and dynamic Regional Weighted Average Least Square (RWALS) MPDs developed by Rahman, Shang [10] and Rahman and Shang [30], respectively, depicted significant improvements in precipitation estimation compared to DBMA and DCBA MPDs.
Baez-Villanueva et al. [31] use the Random Forest-based Merging Procedure (RF-MEP) to merge the gridded precipitation products. The merged precipitation products demonstrated enhancements in the linear correlation, bias, and variability of precipitation at various temporal scales, in addition to improvements in the probability of detection, false alarm ratio, frequency bias, and critical success index for distinct precipitation intensities. Estimating precipitation with precision from satellite observations at elevated spatiotemporal resolutions across the Tibetan Plateau (TP) continues to present a formidable task. A dynamic Bayesian model averaging (BMA) algorithm was used to merge multiple satellite products [6]. The dynamic BMA approach exhibited superior performance when compared to the individuals at 15 validation sites. Furthermore, BMA has demonstrated its robustness in seasonality, topography, and other parameters, surpassing traditional ensemble methods, such as simple model averaging (SMA) and one outlier removal (OOR). The integration of convolutional neural networks (CNN) and long short-term memory (LSTM) networks in this model has demonstrated notable enhancements in the precision of precipitation estimates across China. It has effectively reduced errors and substantially increased correlation coefficients [32]. These developments not only improve the accuracy of quantitative precipitation estimates but also generate datasets with greater resolution and precision. This is advantageous for a range of applications, such as water research and management [32]. A novel double machine learning (DML) approach has been presented to combine several SPPs and gauge data, demonstrating its reliability and validity over the Chinese mainland, in addition to the CNN-LSTM model. This methodology, employing a fusion of random forest (RF) classification and diverse machine learning regression models, surpasses conventional single machine learning (SML) algorithms and linear merging techniques [33]. The DML algorithms have exhibited exceptional efficacy in identifying precipitation events and enhancing the precision of MPDs, signifying a noteworthy progression in the integration of satellite and gauge-based precipitation information.
It is crucial to explain why dynamic MPDs should be utilized instead of fixed-weight MPDs, especially in topographically complicated and climate-diverse areas; it is of great importance and has not been explicitly answered in the literature. Despite advancements in satellite-based precipitation estimation, challenges persist, particularly in regions with complex climates like West Africa. A recent study by Satgé et al. [34] highlighted the limitations of satellite precipitation products (SPPs) in regional climate monitoring. The study underscored the need for continuous updates and improvements in SPPs to enhance their accuracy and reliability. These improvements are critical for regional climate institutions like AGRHYMET RCC-WAS, which monitors rainfall across West and Central Africa, emphasizing the value of SPPs in providing early rainfall warnings. The research highlighted the importance of high spatial resolution satellite products for accurate and timely rainfall monitoring, thus contributing to effective climate risk management in diverse geographical regions.
This study addressed the above question by comparing a dynamic MPD (i.e., DCBA) to a fixed-weight MPD (i.e., RPCA) at the regional scale. The regional-scale assessment highlighted the role of topography and varying climates in the performance of SPPs and MPDs. The study used four SPPs to develop both MPDs. The MPDs are evaluated using daily data from 102 rain gauges (RGs) in Pakistan for a period of sixteen years (2000–2015).
2. Materials and Methods
2.1. Study Area
Situated in South Asia’s western part, Pakistan spans a geographical expanse between latitudes 23.5° N and 37.5° N and longitudes 62° E and 75° E, covering an area of approximately 803,940 km2 [35,36]. The country’s landscape is characterized by its remarkable diversity, ranging from the famous peaks of the Hindukush, Karakoram, and Himalayas (HKH) in the north to its southern deserts. The elevation in Pakistan varies significantly, reaching as high as 8600 m in the HKH mountains and descending to sea level at the Arabian Sea in the extreme south [10,35]. Geographically, Pakistan shares its northern boundary with China, its eastern border with India, and the southern frontier is along the Arabian Sea, while Afghanistan and Iran line its western edge (Figure 1). Elevated precipitation levels are observed in the summer, primarily influenced by monsoonal patterns, and in the winter, as a result of western disturbances [36]. From July to September, the summer rainfall in Pakistan predominantly originates from the Bay of Bengal, entering the nation from the eastern and northeastern directions. This period accounts for a significant portion of the annual precipitation, approximately 55% to 60%. In contrast, the winter precipitation, occurring from December to March, is attributed to weather systems originating from the west. These systems approach Pakistan from the northeast and southwest, contributing to around 30% of the yearly precipitation totals [35,37].
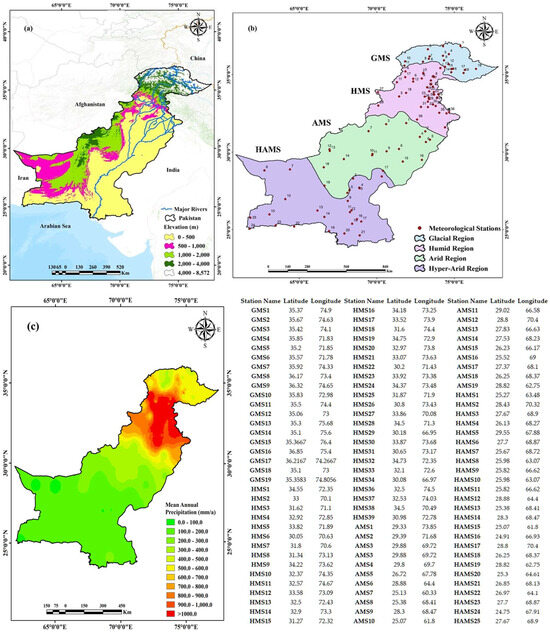
Figure 1.
(a) Topographical elevation in Pakistan based on the Shuttle Radar Topography Model (SRTM), (b) classification of Pakistan into four climatic zones showing meteorological stations and their serial numbers in each zone (GMS, HMS, AMS, and HAMS represent meteorological stations in glacial, humid, arid, and hyper-arid zones, respectively), and (c) mean annual precipitation variation across Pakistan.
This research delineates Pakistan into four separate climatic zones (Figure 1b), glacial, humid, arid, and hyper-arid zones. This classification is utilized to assess the efficacy of dynamic MPDs compared to fixed weight MPDs in diverse geomorphological and meteorological conditions. The glacial zone, located at Pakistan’s extreme northern end, has an average elevation of 4158 m, primarily consisting of glaciers and perennial snow cover. The glacial zone, pivotal for the nation’s water supply due to its extensive glaciers, is experiencing notable temperature rises. These changes are critical as they directly influence glacial melt rates, thereby affecting water availability for downstream regions and subsequently supporting agricultural, domestic, and industrial uses [38]. Such alterations in glacial dynamics are partly attributed to the significant rise in atmospheric CO2 levels, which contribute to the overall warming of the climate, affecting not only the glacial but also the adjoining humid zones [39,40]. In this region, snowmelt during the summer months serves as a principal water source for the country’s rivers. The humid zone encompasses the high mountain ranges of the Hindu Kush Himalayas (HKH), which are the source of the main rivers in the Indus Basin, including the Indus, Kabul, Swat, Chitral, Hunza, Gilgit, Jhelum, Kurram, and Panjkora rivers. With a mean altitude of 1286 m, the humid region receives an estimated 852 mm of precipitation per year. Large agricultural sections of the Punjab province are drained by the Indus River and its tributaries, yet they are located in an arid zone typified by low-elevation plains (east) and hilly areas (west) [34]. Conversely, the arid and hyper-arid zones present a scenario of escalating temperatures, which heighten the vulnerability to extreme weather events and pose significant risks to agricultural productivity, water resources, and human health. In these regions, adaptation to increasing temperatures and managing scarce water resources are paramount for sustaining livelihoods and mitigating the adverse effects of climate extremes [41,42]. The average elevation of the area is 633 m, and it receives an average of 322 mm of precipitation per year. The barren desert regions known as the hyper-arid zone can be found in the south of Pakistan, close to the Arabian Sea and Iran. Despite a relatively high average altitude of 444 m, the region receives only 133 mm of precipitation per year.
In addition to temperature changes, precipitation patterns across these climatic zones are also shifting, indicating a complex pattern of climatic variability. Such variability has profound implications for water resource management, agriculture, and overall ecosystem services. Studies have shown that while some regions are experiencing a decrease in precipitation, others may see an increase, further complicating the management strategies required to address these changes [43,44].
Moreover, the spatial distribution and trends of maximum and minimum temperatures across Pakistan’s climatic zones have been thoroughly assessed, revealing an intricate picture of warming trends that have varying impacts on regional climates. These temperature shifts are particularly pronounced in the northern glacial and mountainous regions, affecting snow and ice melt patterns, which in turn influence water availability for agricultural and domestic use. The observed warming trends necessitate robust climate adaptation and mitigation strategies to safeguard water resources and agricultural productivity, ensuring food security and livelihoods for the population [45,46].
2.2. Ground Observation Datasets
The current study collects daily precipitation data from 102 RGs, 23 from the Pakistan Meteorological Department (PMD) and 79 from the Water And Power Development Authority (WAPDA). Figure 1b depicts the regional distribution of the RGs employed in this study. Rain gauges (RGs) are categorized based on their climatic regions; for instance, RGs situated in glacial, humid, arid, and hyper-arid zones are labeled as GMS, HMS, AMS, and HAMS, respectively. Table 1 shows the main characteristics of each climate zone, such as area, mean elevation, mean annual precipitation, and number of RGs.

Table 1.
Main features of the considered climate regions.
Precipitation data recorded by rain gauges (RGs) are manually gathered by WAPDA and PMD, a process susceptible to both human and technical errors. Moreover, RGs at high altitudes are more likely to have splashing and wind mistakes, which impact the data’s quality and negatively degrade MPDs’ performance. As a result, PMD and WAPDA adjust precipitation data in accordance with the World Meteorological Organization code (WMO-N). To guarantee the superior quality of collected precipitation data, rigorous quality control measures, including analyses for skewness and kurtosis, are implemented. Additionally, any gaps in the data are addressed by employing the zero-order method for data imputation [4].
2.3. Satellite Precipitation Datasets
In order to perform a comprehensive evaluation of the potential and robustness of a dynamic MPD (DCBA) in comparison to a fixed-weight MPD (RPCA) at the local scale across four distinct climatic zones in Pakistan, three different satellite precipitation datasets, including TMPA 3B42-v7, PERSIANN-CDR, and CMORPH, as well as one reanalysis precipitation dataset (ERA-Interim), have been selected. Several researchers have conducted in-depth analyses of Pakistan using the specified datasets and published their findings in the past. A brief description of these datasets is listed below.
2.3.1. TMPA 3B42-v7
The joint efforts of the NASA and the Japan Aerospace Exploration Agency (JAXA) ended with the TRMM mission, involving the first space-borne precipitation radar. TRMM provided the legacy dataset for nearly 26 years, providing uninterrupted precipitation measurements over tropical and subtropical regions since 1997 [37,38]. Two types of TMPA products are available, namely real time (3B42-RT) and post-real time (3B42-v6/3B42-v7). The 3B42-RT, an experimental product, becomes accessible approximately 6 to 9 h after real-time observations. Nevertheless, the post-real-time product is accessible to users around 10 to 15 days following the conclusion of each month. A notable difference between the real-time and post-real-time products is the incorporation of monthly rain gauge (RG) data, employed in the 3B42 for bias correction purposes [47,48]. Additionally, for the purpose of refining the calibration methodology, 3B42-v7 utilizes worldwide real-time precipitation data from the Global Precipitation Climatology Centre (GPCC). In this research, TMPA 3B42-v7 (hereinafter referred to as TMPA) is employed, providing a spatial resolution of 0.25° and spanning the region from 50° S to 50° N.
2.3.2. PERSIANN-CDR
The PERSIANN-CDR, a dataset derived from satellite observations, provides estimates of global precipitation. The PERSIANN algorithm was developed by the Center for Hydrometeorology and Remote Sensing (CHRS) at the University of California, Irvine. The PERSIANN-CDR system forecasts daily precipitation by integrating artificial neural networks with data from geostationary satellites. It is a part of the PERSIANN series developed by CHRS, featuring a spatial resolution of 0.25° (28 km) and a temporal frequency of 1 day. PERSIANN fine-tunes its neural network parameters by utilizing passive microwave (PMW) data from sources such as TMI, AMSU-B, and SSM/I, thereby improving the precision of precipitation estimates. PERSIANN-CDR employs the same neural network as earlier PERSIANN models, with the notable difference of utilizing GridSat-B1 as the input infrared (IR) dataset, replacing CPC-IR. However, the core algorithm remains unchanged. Notably, PERSIANN-CDR does not incorporate PMW data [49]. PERSIANN-CDR has assisted several sectors, including weather forecasting, hydrological modeling, climate studies, and disaster management [50,51].
2.3.3. CMORPH
CMORPH, a product of the Climate Prediction Center (CPC), utilizes motion vectors based on infrared (IR) technology to enhance the accuracy of precipitation measurements, which are extracted from passive microwave (PMW) data [39]. The CMORPH algorithm combines data from various satellites including GOES 8, GOES 10, Meteosat 5, Meteosat 8, and GMS 5, integrating these with infrared (IR) data. This approach also incorporates precipitation estimates based on passive microwave (PMW) data from satellites like NOAA’s polar-orbiting operational meteorological satellites, the Defense Meteorological Satellite Program (DMSP), and the Tropical Rainfall Measuring Mission (TRMM). CMORPH is distinguished by its spatial resolution of 0.25° and a temporal frequency of every three hours.
2.3.4. Reanalysis Precipitation Product
ERA-Interim, a comprehensive atmospheric reanalysis system, has been developed by the European Centre for Medium-Range Weather Forecasts (ECMWF). Providing real-time global atmospheric information since 1979, it boasts a spatial resolution of 0.25°. The production of ERA-Interim data relies on a data assimilation framework based on the Integrated Forecasting System (IFS, Cy31r2) from 2006. This framework employs 4D-Var (four-dimensional variational analysis) techniques within a 12 h analytical timeframe. Moreover, ERA-Interim uses a weather forecasting model for precipitation prediction, accounting for variations in temperature and humidity [52].
2.4. Methodology
2.4.1. Dynamic Clustered Bayesian Averaging (DCBA)
Clustered Bayesian averaging (CBA) merges the selected SPPs using their adaptive weights by utilizing the principles of Bayesian theorem. CBA has an advantage over the conventional Bayesian model averaging (BMA) technique, as CBA accounts for the nonregionality of BMA. Put differently, the CBA method segments the covariate space into various subareas, ensuring that the performance of the merged elements (namely, the satellite precipitation products or SPPs) is consistent within each designated region. However, the performance of one region differs from the other region [53]. Readers are referred to [26,53] for the complete description of the methodology.
2.4.2. Regional Principal Component Analysis (RPCA)
Principal component analysis (PCA) effectively reduces a substantial set of potentially interrelated variables into a more manageable subset termed principal components. This technique is applied to assign weights to selected satellite precipitation products (SPPs) relative to rain gauges (RGs), based on their percentage correlation. These weights, denoted as ‘w’, are designed such that their cumulative total equals one. Prior to implementing PCA, both K-fold cross-validation and paired sample t-tests were conducted to evaluate the datasets of SPPs and RGs. The performances of SPPs are evaluated using K-fold cross-validation, where RG observations are divided into K-datasets (K = 5 in the following analysis) over the entirety of Pakistan and four selected regions (glacial, humid, arid, and hyper-Arid zones). The paired-sample t-test, alternatively known as the dependent-sample t-test, is employed to contrast the satellite precipitation products (SPPs) with rain gauges (RGs). For an in-depth explanation of the methodology, readers are directed to consult the work of Rahman et al. [4].
2.5. Performance Evaluation of MPDs
A range of statistical indicators are utilized to assess and benchmark the effectiveness of both DCBA and RPCA MPDs against rain gauges (RGs). The employed statistical metrics include mean absolute error (MAE), root-mean-square error (RMSE), correlation coefficient (CC), standard deviation (SD) [54,55], and Theil’s U coefficient [56]. A comprehensive description of these statistical indices is provided in Table 2.

Table 2.
Statistical measures to assess the performance of DCMA and RPCA multi-precipitation datasets (MPDs). ‘M’ and ‘O’ represent simulated precipitation from MPDs and observed precipitation from rain gauges (RGs), respectively. The number of samples is denoted by ‘n’, and ‘X’ refers to the data element (X = M for DCBA and RPCA, and X = O for RGs). The overbars on variables indicate their mean values.
The MAE quantifies the average absolute deviation between the simulated precipitation from DCBA/RPCA and the observed data from rain gauges (RGs). The RMSE is utilized to gauge the average magnitude of the errors in the estimates, comparing the simulated precipitation to actual observations. On the other hand, the correlation coefficient (CC) quantifies the degree of congruence between the merged precipitation data and the observed measurements. The SD computes the capability of MPDs to capture spatiotemporal variability in precipitation, where higher SD values indicate a higher deviation of simulated precipitation data from its mean. The accuracy of forecasts produced by MPDs is measured using Theil’s U in relation to the observations of RGs. In situations where the MPDs forecast error is equivalent to that of a basic no-change extrapolation, Theil’s U metric reaches a lower boundary value of one. Conversely, a value of zero in Theil’s U signifies an impeccable forecast [56].
3. Results and Discussion
3.1. Spatiotemporal Distributions of DCBA and RPCA Weights
The average weights assigned to the four integrated satellite products, i.e., TMPA, ERA-Interim, PERSIANN-CDR, and CMORPH, and their spatial distribution are key to understanding the DCBA and RPCA methodologies. Figure 2 and Figure 3 graphically illustrate these distributions over Pakistan for the period 2000–2015, providing a visual representation of the weighting variations.
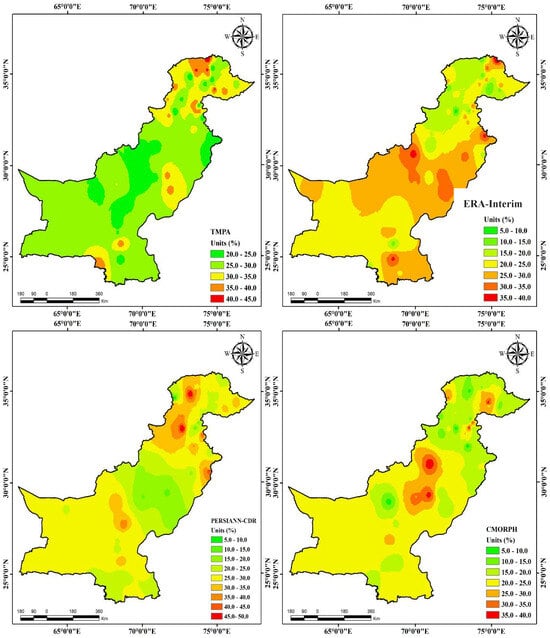
Figure 2.
Spatial distributions of temporally averaged DCBA weights for the four merging members during 2000–2015.
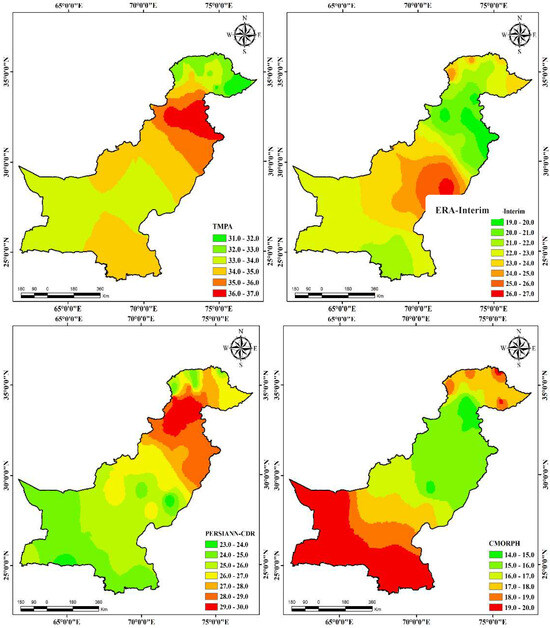
Figure 3.
Spatial distributions of RPCA weights for the four merging members during 2000–2015.
In the DCBA method, substantial variations in weights are observed across Pakistan (Figure 2). For instance, the weight assigned to TMPA fluctuates between 20.5% and 44.72%, indicating its variable influence in different regions. Similarly, ERA-Interim’s weight ranges from 8.14% to 39.65%, PERSIANN-CDR varies from 6.42% to 49.86%, and CMORPH from 7.53% to 38.47%. These variations reflect the different performance and suitability of each satellite product in capturing precipitation across diverse climatic and topographic regions of Pakistan. Notably, TMPA and PERSIANN-CDR emerge as the more dominant products in the DCBA methodology, with average member weights of 29% and 27%, respectively, followed by ERA-Interim and CMORPH, each averaging 22%. However, when dissecting the data on a regional scale, specifically across different climate zones in Pakistan, contrasting trends in weight emerge, underscoring the importance of regional specificity in precipitation estimation. In the glacial zone, TMPA (34%) outweighs PERSIANN-CDR (26%), reflecting its greater reliability in this zone. Conversely, in the humid zone, PERSIANN-CDR’s weight increases to 32%, surpassing TMPA’s 29%, indicating its superior performance in these environments. In the arid zone, ERA-Interim demonstrates higher skill and achieves an equal percentage weight to TMPA (28%), effectively replacing PERSIANN-CDR as the more reliable source. Furthermore, in the hyper-arid region, PERSIANN-CDR dominates, with a weight of 26%, and joins TMPA (28%) as the leading merging members, showcasing its enhanced capability in these conditions. These findings highlight the significance of considering regional climatic variations when applying merging techniques like DCBA and RPCA for satellite precipitation products. The distinct weighting patterns across different climate zones underscore the necessity of a tailored approach in precipitation data integration, ensuring that the merged dataset accurately reflects the diverse precipitation dynamics of each region.
Unlike the DCBA, the RPCA analysis demonstrates less significant variation in the weighting of satellite products across the entirety of Pakistan (Figure 3). This characteristic can be attributed to the fixed-weight approach inherent to the RPCA methodology. In this approach, the weights assigned to each satellite product exhibit relatively less fluctuation when compared to the adaptive weighting strategy of the DCBA. Specifically, the weight distribution for TMPA in the RPCA analysis ranges from 31.12% to 36.93%, demonstrating a narrower band of variation. Similarly, weights range from 19.20% to 26.98% for ERA-Interim, from 23.10% to 29.89% for PERSIANN-CDR, and from 15.13% to 19.96% for CMORPH. These values indicate a more consistent weighting across different regions of Pakistan. The average distribution of weights for RPCA stands at 34% for TMPA, 22% for ERA-Interim, 27% for PERSIANN-CDR, and 17% for CMORPH. This distribution highlights the predominant role of TMPA in the RPCA methodology, followed by PERSIANN-CDR, ERA-Interim, and CMORPH, in descending order of their average weight contributions. Further analysis on a local scale, examining various climate zones within Pakistan, reveals a similar ranking in skills across these zones. TMPA and PERSIANN-CDR consistently exhibit superior performance compared to ERA-Interim and CMORPH in all climate zones. This observation underscores their robustness and reliability across a range of climatic conditions within the country. The average weight distribution for TMPA shows diverse percentages across different climatic zones, demonstrating its adaptability to varying meteorological conditions: 32.42% in glacial areas, 35.53% in humid regions, 34.18% in arid zones, and 33.85% in hyper-arid localities. PERSIANN-CDR, exhibiting a slightly lower but still significant weight allocation, stands at 26.10% in glacial zones, 29.29% in humid regions, 25.93% in arid zones, and 25.00% in hyper-arid areas. These findings from the RPCA analysis emphasize the importance of a consistent and balanced weighting approach across different climatic zones. They highlight the need for a carefully calibrated weighting strategy in the RPCA methodology, ensuring that the merged precipitation dataset accurately reflects the precipitation dynamics of each region within Pakistan.
3.2. Statistical Evaluation of DCBA and RPCA
In assessing the performance of DCBA and RPCA, a local-scale evaluation is conducted, offering sophisticated and detailed insights into their accuracy and robustness. This localized approach allows for a nuanced assessment of the dynamic variation of merging weights and a meticulous analysis of the spatial distribution of errors across different climate zones. Such detailed evaluation is critical in understanding the spatial heterogeneity and local variability in precipitation estimates.
3.2.1. Glacial Zone
Figure 4 and Figure 5 offer a detailed visualization of the spatial distribution of a suite of statistical measures on a daily timescale within the glacial zone. These figures are instrumental in elucidating the performance nuances of DCBA and RPCA in a region characterized by complex meteorological dynamics.
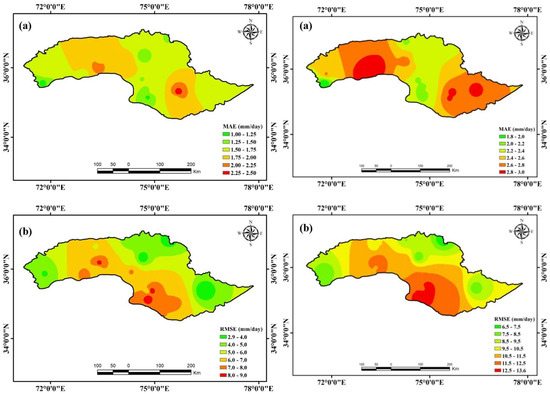
Figure 4.
Spatial distribution maps in the glacial zone: (a) MAE, (b) RMSE for the DCBA (left side); (a) MAE, (b) RMSE for the RCPA (right side).
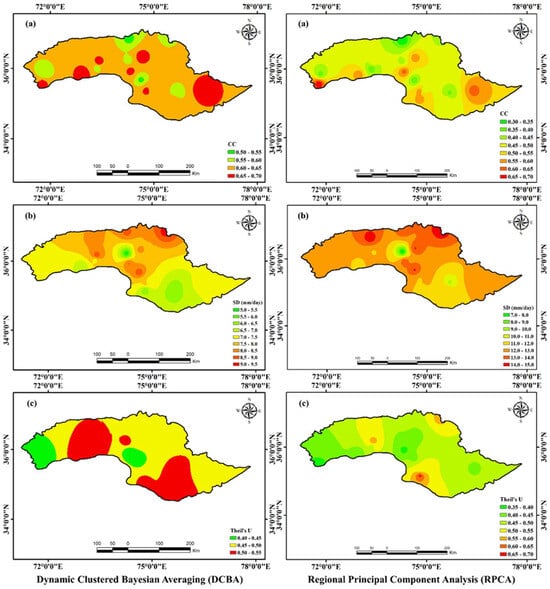
Figure 5.
Spatial distribution maps in the glacial zone: (a) CC, (b) SD, and (c) Theil’s U for the DCBA (left side); (a) CC, (b) SD, and (c) Theil’s U for the RPCA (right side).
Figure 4a does not exhibit a clear spatial pattern for MAE within the glacial region, suggesting a more random distribution of errors. The range of the MAE for DCBA is between 2.38 mm/day at GMS17 and 1.19 mm/day at GMS16, averaging 1.70 mm/day across the zone. For RPCA, the MAE is generally higher, averaging 2.51 mm/day with a peak at 2.99 mm/day at GMS9 and a minimum of 1.82 mm/day at GMS11. These values highlight the variability in error magnitude across different locations, reflecting the heterogeneity in precipitation patterns within the glacial zone. Furthermore, Figure 4b demonstrates a distinct spatial trend for RMSE, particularly in the southern and southeastern parts of the glacial region. This spatial variation in the RMSE suggests a geographical dependency of the error magnitude, possibly influenced by local topographic and climatic factors.
For DCBA, the RMSE values range from 2.97 mm/day at GMS19 to 8.71 mm/day at GMS15. In comparison, RPCA exhibits a broader range of RMSE, spanning from 6.72 mm/day at GMS1 to 13.64 mm/day at GMS15. The higher RMSE values, especially for RPCA, indicate larger magnitudes of errors in these specific areas, pointing to potential limitations of the model in capturing the complex precipitation dynamics of the glacial zone.
DCBA demonstrated a significantly higher correlation with RGs as compared to RPCA in the glacial zone (Figure 5a). The CC values for RPCA range between 0.31 (GMS2) and 0.68 (GMS11). On the other hand, the CCs have significantly increased for DCBA, ranging between 0.53 (GMS12 and GMS2) and 0.69 (GMS4 and GMS19). DCBA and RPCA have average CCs of 0.63 and 0.50, respectively. The maximum value for the standard deviation of DCBA is 9.21 mm/day (GMS1), and the minimum value is 3.28 mm/day (GMS5).
Similarly, the observed SD values for RPCA exhibit a wider range, with the maximum and minimum recorded at the same rain gauges (RGs), being 14.71 mm/day and 7.26 mm/day, respectively. In terms of Theil’s U, as depicted in Figure 5c, DCBA demonstrates greater efficiency compared to RPCA. For DCBA, Theil’s U values vary from 0.41 at GMS19 to 0.56 at GMS12. Conversely, RPCA’s Theil’s U values span from a low of 0.38 at GMS11 to a high of 0.66 at GMS15. The average values of Theil’s U for DCBA and RPCA are calculated to be 0.49 and 0.53, respectively.
These spatial analyses provided by Figure 4 and Figure 5 are critical for understanding the performance characteristics of DCBA and RPCA in a challenging glacial environment. They offer valuable insights into the spatial heterogeneity of model performance, informing future enhancements in model algorithms and the need for region-specific calibration strategies.
3.2.2. Humid Region
The spatial distributions of MAE and RMSE in the humid zone are shown in Figure 6. The MAE (Figure 6b) and RMSE (Figure 6c) gradually decrease from north (northwest and northeast) towards the south (southwest and southeast) with few exceptions. For DCBA, the average values of MAE and RMSE are 1.59 and 7.16 mm/day, respectively. Relatively higher average values are observed in the case of RPCA with magnitudes of 2.51 and 10.74 mm/day for MAE and RMSE, respectively. The maximum MAE and RMSE values for DCBA are 2.48 mm/day and 9.68 mm/day, respectively, at RGs HMS4 and HMS11. Moreover, the minimum MAE and RMSE values are 1.13 mm/day (HMS40) and 3.87 (HMS28). Relatively high values of MAE and RMSE are observed for RPCA with maximum/minimum values of 3.11/1.93 mm/day (HMS1/HMS40) and 14.18/7.04 mm/day (HMS11/HMS28), respectively.
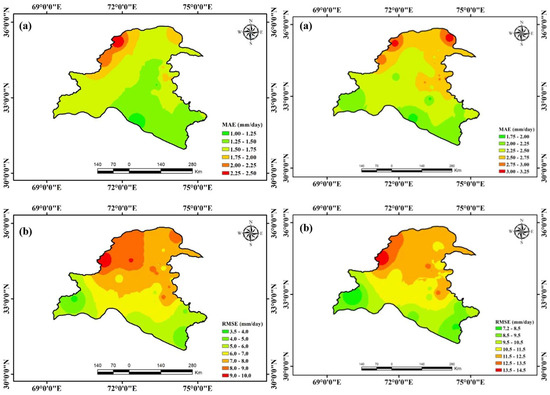
Figure 6.
Spatial distribution maps in the humid zone: (a) MAE, (b) RMSE for the DCBA (left side); (a) MAE, (b) RMSE for the RCPA (right side).
The spatial variation of the CC, SD, and Theil’s U are depicted in Figure 7. A more elevated correlation coefficient (CC) is noted from the central to the eastern parts of the humid zone (Figure 7a). DCBA significantly improves in correlation with RGs. DCBA exhibits a highest correlation coefficient (CC) of 0.84 (HMS13), a lowest CC of 0.67 (HMS21), and an average CC of 0.77. In comparison, RPCA shows a somewhat lower correlation, with maximum, minimum, and average CC values of 0.77 (HMS16), 0.47 (HMS28), and 0.63, respectively. The SD for DCBA shows a declining trend from northwest to northeast with values ranging from 4.81 (HMS30) to 9.27 (HMS4) mm/day (Figure 7b). In the case of RPCA, comparatively higher SD values ranging from 8.5 (HMS30) to 13.3 (HMS4) mm/day are observed, having a similar spatial distribution trend to that of DCBA. The average SD values for DCBA and RPCA are 7.34 mm/day and 10.80 mm/day, respectively. When compared to the glacial zone, Theil’s U shows a significant improvement in the humid zone for predicting precipitation (Figure 7c). In terms of DCBA, HMS1 and HMS4 exhibit lower forecasting accuracy (Theil’s U greater than 0.5), whereas HMS25 exhibits a higher accuracy (Theil’s U of 0.31). The average value of Theil’s U for DCBA is 0.38. Moreover, the Theil’s U values for RPCA are comparatively higher than the DCBA. The highest and lowest levels of forecasting accuracy are seen at HMS38 (with a Theil’s U value of 0.32) and HMS4 (with a Theil’s U value of 0.68), respectively. Theil’s U for RPCA has an average value of 0.45.
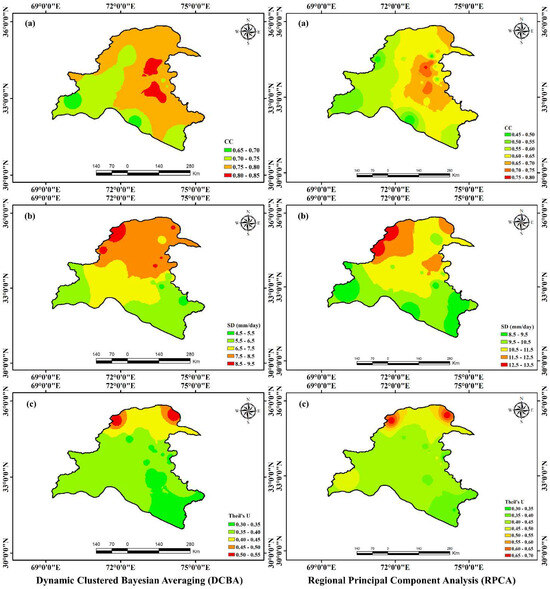
Figure 7.
Spatial distribution maps in the humid zone: (a) CC, (b) SD, and (c) Theil’s U for the DCBA (left side); (a) CC, (b) SD, and (c) Theil’s U for the RPCA (right side).
3.2.3. Arid Region
In the arid zone, the performance of RPCA and DCBA in estimating precipitation exhibits distinct spatial patterns, as detailed in Figure 8 and Figure 9. The MAE from west to east is observed for both methodologies, as demonstrated in Figure 8a. DCBA records an average MAE of 1.23 mm/day, with its highest and lowest MAE values observed at AMS8 (1.74 mm/day) and AMS12 (0.72 mm/day), respectively. RPCA, on the other hand, shows a generally higher MAE, averaging 2.88 mm/day, peaking at 7.49 mm/day at AMS15, and dropping to 1.57 mm/day at AMS12. This spatial variation in MAE underscores the complexities of accurately estimating precipitation across diverse subregions within the arid zone. The spatial distribution of the RMSE presents another contrasting trend, as shown in Figure 8b. The RMSE values increase towards the northeast of the arid zone, with a notable peak in the central region. For DCBA, the RMSE values range from a maximum of 5.93 mm/day at AMS2 to a minimum of 1.75 mm/day at AMS19, averaging 3.45 mm/day. RPCA exhibits significantly higher RMSE values, more than double those of DCBA, with maximum, minimum, and average values of 8.95 mm/day (AMS10), 4.73 mm/day (AMS19), and 7.02 mm/day, respectively. This indicates that RPCA, with its fixed-weight approach, tends to amplify errors, particularly in regions with complex climatic interactions.
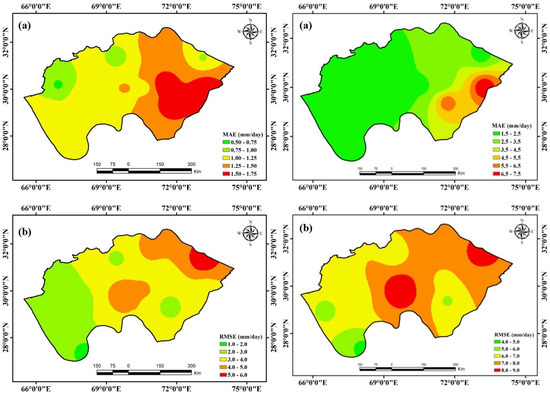
Figure 8.
Spatial distribution maps in the arid zone: (a) MAE, (b) RMSE for the DCBA (left side); (a) MAE, (b) RMSE for the RCPA (right side).
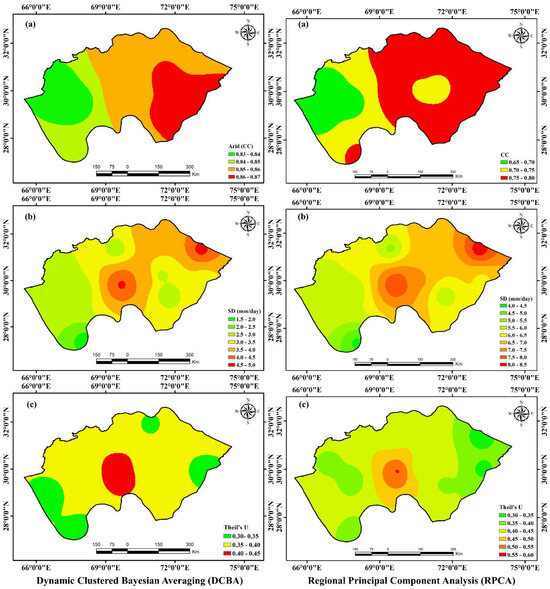
Figure 9.
Spatial distribution maps in the arid zone: (a) CC, (b) SD, and (c) Theil’s U for the DCBA (left side); (a) CC, (b) SD, and (c) Theil’s U for the RPCA (right side).
Figure 9a illustrates the spatial correlation of DCBA and RPCA with RGs in the arid zone. DCBA shows a higher correlation in the southeast, whereas RPCA exhibits a higher correlation in the extreme north and east. The average correlation coefficients (CC) for DCBA and RPCA are 0.85 and 0.73, respectively, with DCBA displaying a maximum CC value of 0.87 at AMS15 and AMS8 and a minimum CC value of 0.83 at AMS12 and AMS14. This variation in correlation reflects the differing abilities of the two methodologies to capture the spatial patterns of precipitation in the arid zone. Additionally, the standard deviation (SD) values, as depicted in Figure 9b, show a gradual increase from west to east in the arid zone, with the highest values centrally located. The mean SD values for DCBA and RPCA are 3.28 mm/day and 6.42 mm/day, respectively. DCBA’s maximum SD is observed at 4.63 mm/day at AMS2 and the minimum at 1.77 mm/day at AMS19. For RPCA, the SD ranges even more significantly, from a maximum of 8.23 mm/day at AMS2 to a minimum of 4.40 mm/day at AMS19, indicating greater variability in RPCA’s estimates. Lastly, Theil’s U statistic, as shown in Figure 9c, reveals the accuracy of forecasts in different parts of the arid zone. Most RGs for DCBA have Theil’s U values below 0.4 except for AMS10 and AMS11, with an average of 0.37. In contrast, RPCA typically exceeds DCBA’s Theil’s U values, indicating less accurate forecasts with the highest, lowest, and mean values recorded at 0.56 (AMS10), 0.38 (AMS2), and 0.42, respectively. This suggests that DCBA provides more accurate forecasts than RPCA, particularly in the extremities of the arid zone.
3.2.4. Hyper-Arid Region
Figure 10 and Figure 11 show the spatial variations of six performance measures in the hyper-arid zone. Both DCBA and RPCA underestimated precipitation in hyper-arid zones. The performance of DCBA is significantly improved with respect to RPCA and compared to other climate zones.
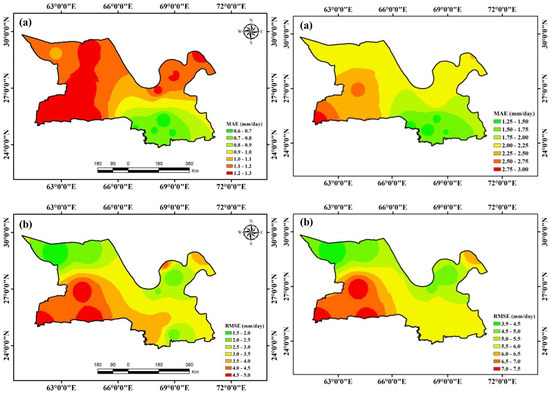
Figure 10.
Spatial distribution maps in the hyper-arid zone: (a) MAE, (b) RMSE for the DCBA (left side); (a) MAE, (b) RMSE for the RCPA (right side).
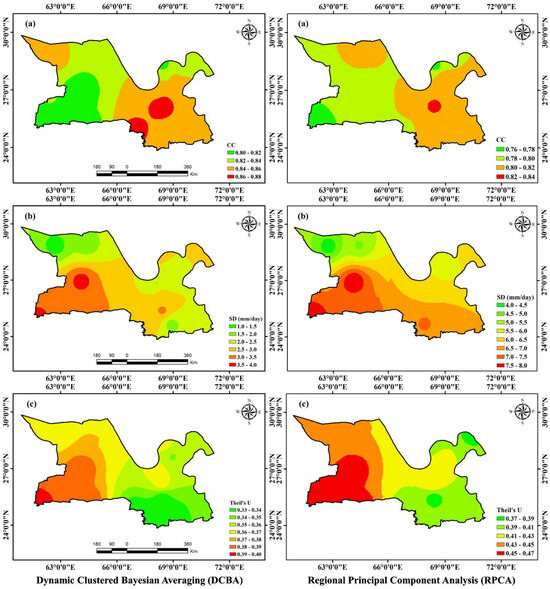
Figure 11.
Spatial distribution maps in the hyper-arid zone: (a) CC, (b) SD, and (c) Theil’s U for the DCBA (left side); (a) CC, (b) SD, and (c) Theil’s U for the RPCA (right side).
The MAEs for DCBA range between 0.61 mm/day (HAMS18) and 1.29 mm/day (HAMS24). Similarly, the MAEs for RPCA range between 1.43 mm/day (HAMS18) and 2.91 mm/day (HAMS24) (Figure 10a). In the southwestern part of the hyper-arid zone, higher MAE values are observed, showing a gradual decrease towards the east. A comparable pattern is noted for the RMSE within this climatic zone. A higher RMSE (4.94 mm/day for DCBA at HAMS22 and 7.47 mm/day for RPCA at HAMS10) is observed in the southwest, while the minimum RMSE (1.49 mm/day for DCBA at HAMS8 and 3.93 mm/day for RPCA at HAMS8) is in the northwest of the hyper-arid zone (Figure 10b). The average values of RMSE for DCBA and RPCA are 3.15 mm/day and 5.66 mm/day, respectively. When compared to other climate zones, the CC values in the hyper-arid zone are significantly higher (Figure 11a). The figure depicts higher DCBA and RPCA performance in the southeast of the hyper-arid zone. The maximum CCs for DCBA and RPCA are 0.88 and 0.83 at HAMS11. A lower correlation with RGs is observed in the southwest of the climate zone. The minimum CCs for DCBA and RPCA are 0.80 (HAMS10) and 0.76 (HAMS24), respectively. A contrasting trend is observed for the SD and Theil’s U compared to CC (Figure 11b,c). The maximum SD is observed in the southwest and declines towards the northwest of the climate zone.
The maximum SD for RPCA (7.96 mm/day at HAMS10) reduces to 3.72 mm/day (HAMS10) for DCBA. The average SD for DCBA and RPCA is 2.59 mm/day and 6.40 mm/day. Theil’s U represents higher forecasting accuracies of DCBA and RPCA in the southeast of the hyper-arid zone. DCBA and RPCA show lower forecasting accuracies with a magnitude of 0.40 and 0.47 at HAMS24, while maximum accuracies (0.30 for DCBA and 0.37 for RPCA) are observed at HAMS19 and HAMS18. The average Theil’s U in the hyper-arid zone for DCBA and RPCA are 0.36 and 0.43, respectively.
The findings from this evaluation reveal that DCBA significantly reduces uncertainties compared to RPCA and the individual satellite precipitation products (SPPs). This outcome underscores the enhanced efficacy of DCBA in regional-scale hydrological evaluations, where the need for precise precipitation data is paramount. The dynamic weighting approach of DCBA, which adjusts weights based on regional climatic conditions, proves to be instrumental in achieving greater accuracy and reliability in precipitation estimates.
3.3. Evaluation of DCBA/RPCA against the Merging Members Using Calibrated RGs Data
Table 3 provides a comprehensive comparative analysis of the mean daily precipitation metrics, as determined by DCBA, RPCA, and the four individual SPPs. This comparison is grounded in an evaluation against data from 102 RGs, encompassing the diverse climatic zones of the study region. The data compiled in the table illustrate the relative performance of each method and product, offering critical insights into their efficacy in different hydrological contexts. The analysis in Table 3 reveals that both DCBA and RPCA exhibit superior performance in comparison to the individual SPPs across all climatic zones. This superiority is marked by higher forecasting accuracy, better correlation with RG observations, and reduced errors in precipitation estimates. The enhanced performance of these MPDs underscores their robustness in integrating and refining precipitation data from multiple satellite sources. Among the SPPs, TMPA stands out for its superior performance, characterized by high forecasting accuracy and a strong correlation with RGs. TMPA’s consistency across all climate zones, coupled with its relatively small uncertainty, positions it as the most reliable individual satellite product in the study. This indicates TMPA’s advanced capabilities in capturing diverse precipitation dynamics, making it a valuable tool in hydrological modeling and analysis. Conversely, CMORPH is noted to have the least favorable performance among all the merging members. This finding highlights potential limitations in CMORPH’s algorithm or spatial–temporal coverage that might affect its effectiveness in certain climatic conditions. Overall, the results from Table 3 indicate that MPDs, particularly DCBA, significantly reduce the uncertainties inherent in individual SPPs. By effectively merging and harmonizing data from different satellite sources, MPDs demonstrate enhanced capabilities for application in hydrological contexts. Notably, DCBA shows a markedly improved performance compared to RPCA. This improvement can be attributed to the dynamic merging approach of DCBA, which tailors the weighting of satellite products based on regional climatic characteristics. In contrast, the fixed-weight merging approach of RPCA, while still outperforming individual SPPs, does not match the adaptability and precision of DCBA. This comparison underscores the efficacy of dynamic weighting strategies in satellite precipitation data integration, offering a more accurate and reliable tool for hydrological evaluations and water resource management.

Table 3.
Daily average statistical metrics of MPDs (DCBA and RPCA) and four SPPs (TMPA, ERA-Interim, PERSIANN-CDR, and CMORPH) at 102 RGs from 2000 to 2015.
3.4. Evaluation of DCBA/RPCA and Merging Members at Different Elevations
Precipitation is dependent on elevation and varies significantly as elevation increases (Ma et al., 2018). In order to comprehend the effect of elevation and associated uncertainty on estimated precipitation, DCBA and RPCA are compared to four merging members. The elevation of Pakistan is divided into six groups: 0–500 m, 500–1000 m, 1000–2000 m, 2000–3000 m, 3000–4000 m, and more than 4000 m (shown in Table 4). The error indices are calculated in each group of elevation.

Table 4.
Daily average statistical metrics of two MPDs and four SPPs at 102 RGs over different elevations.
Analysis shows that DCBA outperformed RPCA and the other four merging members in all elevation groups. In the case of SPPs, CMORPH presented the worst performance in all elevation groups. Moreover, uncertainties are elevation-dependent, so they are reducing with a decrease in elevation. For DCBA, the MAE and RMSE decrease from 1.50 mm/day and 5.92 mm/day at elevations above 4000 m to 1.30 mm/day and 4.50 mm/day at elevations between 500 and 0 m, respectively. Similarly, the MAE and RMSE for CMORPH reduce from 3.84 mm/day and 11.24 mm/day at elevation >4000 m to 3.51 mm/day and 8.75 mm/day at elevation between 500 and 0 m, respectively. The correlation coefficient and forecasting accuracy (Theil’s U) of MPDs and merging members are also significantly increased from the high elevation (>4000 m) to the lower elevation (500–0 m).
DCBA shows significantly improved performance at each elevation group. For instance, when DCBA is compared with the highly skilled SPP, i.e., TMPA at an elevation greater than 4000m, all the statistical indices, i.e., MAE, RMSE, CC, SD, and Theil’s U, are improved by 49.83%, 42.31%, 27.94%, 40.15%, and 13.21%, respectively. However, relatively less improvement is observed for RPCA compared with TMPA, i.e., 16.35%, 13.04%, 1.56%, 10.91%, 1.67%, and 5.66%, respectively. DCBA dominancy continues until the lower elevation (500–0 m), where the comparison between DCBA and TMPA revealed 53.06%, 43.11%, 17.28%, 48.57%, and 30.77% improvements in the MAE, RMSE, CC, SD, and Theil’s U, respectively. Similarly, 20.58%, 3.28%, 10.67%, 3.48%, and 21.15% improvements are observed for RPCA against TMPA.
Previous research has shown that precipitation and SPPs are topographically dependent. Rahman et al. (2018) demonstrated the poor performance of different SPPs and MPDs at high elevations (greater than 4000 m). The performance of MPDs and SPPs significantly improved at low elevated climate zones. Similarly, Shen, Xiong [57] revealed the topographic dependency of precipitation in the Tibetan Plateau. Their findings showed that as elevation increased above 4000 m, the uncertainty in precipitation estimates increased significantly. To evaluate the quality of MPDs, specifically DCBA and RPCA, the performance of the constituent SPPs is analyzed. These SPPs are instrumental in determining the weights for DCBA/RPCA to ensure optimal alignment with observations from rain gauges (RGs) [58]. Aside from the topographic dependence of SPPs, the dominance of snow above 4000 m may affect the quality of RG data, which influences DCBA and RPCA results.
Although DCBA has made significant progress in addressing uncertainties in Pakistan’s complex topography, there are still areas in the glacial and humid zones at higher elevations that require further attention. DCBA faces challenges in elevated terrain due to inadequate SPP data. The effectiveness of SPP is reduced in high-altitude areas due to topography and snow [9]. The uncertainties at elevated locations are increased due to various factors, such as wind impact, evaporation, human errors, splash effects, and seasonal variations affecting the global precipitation gauges (GPGs) [26].
4. Conclusions
This study assessed the importance of the dynamic variation (both in space and time) of weights compared with the fixed-weight approach in merging SPPs. Highlighting the significance of dynamically varying weights, this study conducts a thorough evaluation of two MPDs, namely dynamic clustered Bayesian averaging (DCBA) and regional principal component analysis (RPCA), across four distinct climatic zones and various elevation groups in Pakistan. Additionally, the performance of these MPDs is assessed in comparison to their constituent merging members across different climate zones and elevation levels. The key findings of the current research are given below:
- (1)
- DCBA with dynamic weights outperformed RPCA with a fixed weight in all climate zones and different elevation regions of Pakistan.
- (2)
- DCBA and RPCA dominated all the merging members (TMPA, PERSIANN-CDR, CMORPH, and ERA-Interim) across all four climate zones and different elevations in terms of the MAE, RMSE, CC, SD, and Theil’s U.
- (3)
- The accuracies of MPDs and SPPs are all highly dependent on the elevation, and the performances of MPDs and SPPs significantly increased as the elevation decreased. The improvements in DCBA and RPCA are relatively greater with respect to the best SPP (TMPA) at low elevations.
Overall, this study demonstrated the superior performance of DCBA, which is developed using the dynamic approach, i.e., weights are varied using the moving averaging scheme both in space and time. Therefore, it is recommended that MPDs should be developed by dynamically varying the weights, especially in complex topographic regions like Pakistan.
Author Contributions
Conceptualization, N.E., K.U.R. and S.S.; methodology, N.E., M.S., K.M.A., K.U.R. and S.S.; software, N.E., A.H.K. and K.Z.; validation, N.E., M.S., K.M.A. and K.S.B.; formal analysis, M.S. and K.Z.; investigation, N.E. and A.H.K.; resources, N.E. and K.Z.; data curation, N.E., M.S. and A.H.K.; writing—original draft preparation, N.E. and M.S.; writing—review and editing, S.S., K.U.R. and K.S.B.; visualization, A.H.K., K.M.A. and K.Z.; supervision, S.S.; project administration, S.S.; funding acquisition, K.U.R. and S.S. All authors have read and agreed to the published version of the manuscript.
Funding
This study received support from the National Natural Science Foundation of China (grant numbers 51839006 and 52250410336).
Data Availability Statement
The data utilized in this study were acquired through purchase from the Pakistan Meteorology Department (PMD) and the Water and Power Development Authority. Information about the data is available at https://www.pmd.gov.pk/en/ (accessed on 1 January 2023) and http://www.wapda.gov.pk/ (accessed on 1 January 2023), respectively.
Acknowledgments
The authors express their gratitude to the Pakistan Meteorological Department (PMD) and the Water And Power Development Authority (WAPDA) for supplying observed precipitation data and extend their appreciation to the developers of the satellite precipitation products (SPPs).
Conflicts of Interest
The authors declare no conflicts of interest.
References
- Chen, F.; Li, X. Evaluation of IMERG and TRMM 3B43 monthly precipitation products over mainland China. Remote Sens. 2016, 8, 472. [Google Scholar] [CrossRef]
- Yu, C.; Hu, D.; Liu, M.; Wang, S.; Di, Y. Spatio-temporal accuracy evaluation of three high-resolution satellite precipitation products in China area. Atmos. Res. 2020, 241, 104952. [Google Scholar] [CrossRef]
- Prakash, S.; Mitra, A.K.; AghaKouchak, A.; Liu, Z.; Norouzi, H.; Pai, D.S. A preliminary assessment of GPM-based multi-satellite precipitation estimates over a monsoon dominated region. J. Hydrol. 2018, 556, 865–876. [Google Scholar] [CrossRef]
- Rahman, K.U.; Shang, S.; Shahid, M.; Li, J. Developing an ensemble precipitation algorithm from satellite products and its topographical and seasonal evaluations over Pakistan. Remote Sens. 2018, 10, 1835. [Google Scholar] [CrossRef]
- Lakew, H.B.; Moges, S.A.; Asfaw, D.H. Hydrological performance evaluation of multiple satellite precipitation products in the upper Blue Nile basin, Ethiopia. J. Hydrol. Reg. Stud. 2020, 27, 100664. [Google Scholar] [CrossRef]
- Ma, Y.; Hong, Y.; Chen, Y.; Yang, Y.; Tang, G.; Yao, Y.; Long, D.; Li, C.; Han, Z.; Liu, R. Performance of optimally merged multisatellite precipitation products using the dynamic bayesian model averaging scheme over the Tibetan Plateau. J. Geophys. Res. Atmos. 2018, 123, 814–834. [Google Scholar] [CrossRef]
- Zhu, Q.; Xuan, W.; Liu, L.; Xu, Y.P. Evaluation and hydrological application of precipitation estimates derived from PERSIANN-CDR, TRMM 3B42V7, and NCEP-CFSR over humid regions in China. Hydrol. Process. 2016, 30, 3061–3083. [Google Scholar] [CrossRef]
- Lu, X.; Tang, G.; Liu, X.; Wang, X.; Liu, Y.; Wei, M. The potential and uncertainty of triple collocation in assessing satellite precipitation products in Central Asia. Atmos. Res. 2021, 252, 105452. [Google Scholar] [CrossRef]
- Tapiador, F.J.; Turk, F.J.; Petersen, W.; Hou, A.Y.; García-Ortega, E.; Machado, L.A.; Angelis, C.F.; Salio, P.; Kidd, C.; Huffman, G.J. Global precipitation measurement: Methods, datasets and applications. Atmos. Res. 2012, 104, 70–97. [Google Scholar] [CrossRef]
- Rahman, K.U.; Shang, S.; Shahid, M.; Wen, Y.; Khan, A.J. Development of a novel weighted average least squares-based ensemble multi-satellite precipitation dataset and its comprehensive evaluation over Pakistan. Atmos. Res. 2020, 246, 105133. [Google Scholar] [CrossRef]
- Gorooh, V.A.; Hsu, K.; Ferraro, R.; Turk, J.; Meng, H.; Nguyen, P.; Arellano, C.J.; Kalluri, S.; Sorooshian, S. Advances in Precipitation Retrieval and Applications from Low-Earth-Orbiting Satellite Information. Bull. Am. Meteorol. Soc. 2023, 104, E1764–E1771. [Google Scholar] [CrossRef]
- Berndt, E.; Dunion, J.; Duran, E.; Duran, P.; Blackwell, W.; Braun, S.; Green, D. Second Time-Resolved Observations of Precipitation Structure and Storm Intensity with a Constellation of Smallsats (TROPICS) Mission Applications Workshop; NASA: Washington, DC, USA, 2021.
- Foster, T.; Mieno, T.; Brozović, N. Satellite-based monitoring of irrigation water use: Assessing measurement errors and their implications for agricultural water management policy. Water Resour. Res. 2020, 56, e2020WR028378. [Google Scholar] [CrossRef]
- Yang, N.; Zhang, K.; Hong, Y.; Zhao, Q.; Huang, Q.; Xu, Y.; Xue, X.; Chen, S. Evaluation of the TRMM multisatellite precipitation analysis and its applicability in supporting reservoir operation and water resources management in Hanjiang basin, China. J. Hydrol. 2017, 549, 313–325. [Google Scholar] [CrossRef]
- Rahman, K.U.; Shang, S.; Shahid, M.; Wen, Y. Hydrological evaluation of merged satellite precipitation datasets for streamflow simulation using SWAT: A case study of Potohar Plateau, Pakistan. J. Hydrol. 2020, 587, 125040. [Google Scholar] [CrossRef]
- Hinge, G.; Hamouda, M.A.; Long, D.; Mohamed, M.M. Hydrologic utility of satellite precipitation products in flood prediction: A meta-data analysis and lessons learnt. J. Hydrol. 2022, 612, 128103. [Google Scholar] [CrossRef]
- Setti, S.; Maheswaran, R.; Sridhar, V.; Barik, K.K.; Merz, B.; Agarwal, A. Inter-comparison of gauge-based gridded data, reanalysis and satellite precipitation product with an emphasis on hydrological modeling. Atmosphere 2020, 11, 1252. [Google Scholar] [CrossRef]
- Liu, X.; Yang, T.; Hsu, K.; Liu, C.; Sorooshian, S. Evaluating the streamflow simulation capability of PERSIANN-CDR daily rainfall products in two river basins on the Tibetan Plateau. Hydrol. Earth Syst. Sci. 2017, 21, 169–181. [Google Scholar] [CrossRef]
- Wang, Z.; Zhong, R.; Lai, C.; Chen, J. Evaluation of the GPM IMERG satellite-based precipitation products and the hydrological utility. Atmos. Res. 2017, 196, 151–163. [Google Scholar] [CrossRef]
- Hinge, G.; Mohamed, M.M.; Long, D.; Hamouda, M.A. Meta-Analysis in Using Satellite Precipitation Products for Drought Monitoring: Lessons Learnt and Way Forward. Remote Sens. 2021, 13, 4353. [Google Scholar] [CrossRef]
- Rahman, K.U.; Shang, S.; Zohaib, M. Assessment of Merged satellite precipitation datasets in monitoring meteorological drought over pakistan. Remote Sens. 2021, 13, 1662. [Google Scholar] [CrossRef]
- Gao, Z.; Long, D.; Tang, G.; Zeng, C.; Huang, J.; Hong, Y. Assessing the potential of satellite-based precipitation estimates for flood frequency analysis in ungauged or poorly gauged tributaries of China’s Yangtze River basin. J. Hydrol. 2017, 550, 478–496. [Google Scholar] [CrossRef]
- Bayissa, Y.; Tadesse, T.; Demisse, G.; Shiferaw, A. Evaluation of satellite-based rainfall estimates and application to monitor meteorological drought for the Upper Blue Nile Basin, Ethiopia. Remote Sens. 2017, 9, 669. [Google Scholar] [CrossRef]
- Maggioni, V.; Meyers, P.C.; Robinson, M.D. A review of merged high-resolution satellite precipitation product accuracy during the Tropical Rainfall Measuring Mission (TRMM) Era. J. Hydrometeorol. 2016, 17, 1101–1117. [Google Scholar] [CrossRef]
- Zhao, H.; Yang, S.; You, S.; Huang, Y.; Wang, Q.; Zhou, Q. Comprehensive evaluation of two successive V3 and V4 IMERG final run precipitation products over Mainland China. Remote Sens. 2017, 10, 34. [Google Scholar] [CrossRef]
- Rahman, K.U.; Shang, S.; Shahid, M.; Wen, Y.; Khan, Z. Application of a dynamic clustered bayesian model averaging (DCBA) algorithm for merging multisatellite precipitation products over Pakistan. J. Hydrometeorol. 2020, 21, 17–37. [Google Scholar] [CrossRef]
- Shahid, M.; Rahman, K.U.; Haider, S.; Gabriel, H.F.; Khan, A.J.; Pham, Q.B.; Mohammadi, B.; Linh, N.T.T.; Anh, D.T. Assessing the potential and hydrological usefulness of the CHIRPS precipitation dataset over a complex topography in Pakistan. Hydrol. Sci. J. 2021, 66, 1664–1684. [Google Scholar] [CrossRef]
- Yumnam, K.; Guntu, R.K.; Rathinasamy, M.; Agarwal, A. Quantile-based Bayesian Model Averaging approach towards merging of precipitation products. J. Hydrol. 2022, 604, 127206. [Google Scholar] [CrossRef]
- Muhammad, W.; Yang, H.; Lei, H.; Muhammad, A.; Yang, D. Improving the regional applicability of satellite precipitation products by ensemble algorithm. Remote Sens. 2018, 10, 577. [Google Scholar] [CrossRef]
- Rahman, K.U.; Shang, S. A regional blended precipitation dataset over pakistan based on regional selection of blending satellite precipitation datasets and the dynamic weighted average least squares algorithm. Remote Sens. 2020, 12, 4009. [Google Scholar] [CrossRef]
- Baez-Villanueva, O.M.; Zambrano-Bigiarini, M.; Beck, H.E.; McNamara, I.; Ribbe, L.; Nauditt, A.; Birkel, C.; Verbist, K.; Giraldo-Osorio, J.D.; Thinh, N.X. RF-MEP: A novel Random Forest method for merging gridded precipitation products and ground-based measurements. Remote Sens. Environ. 2020, 239, 111606. [Google Scholar] [CrossRef]
- Wu, H.; Yang, Q.; Liu, J.; Wang, G. A spatiotemporal deep fusion model for merging satellite and gauge precipitation in China. J. Hydrol. 2020, 584, 124664. [Google Scholar] [CrossRef]
- Zhang, L.; Li, X.; Zheng, D.; Zhang, K.; Ma, Q.; Zhao, Y.; Ge, Y. Merging multiple satellite-based precipitation products and gauge observations using a novel double machine learning approach. J. Hydrol. 2021, 594, 125969. [Google Scholar] [CrossRef]
- Satgé, F.; Defrance, D.; Sultan, B.; Bonnet, M.-P.; Seyler, F.; Rouché, N.; Pierron, F.; Paturel, J.-E. Evaluation of 23 gridded precipitation datasets across West Africa. J. Hydrol. 2020, 581, 124412. [Google Scholar] [CrossRef]
- Hussain, A.; Jadoon, K.Z.; Rahman, K.U.; Shang, S.; Shahid, M.; Ejaz, N.; Khan, H. Analyzing the impact of drought on agriculture: Evidence from Pakistan using standardized precipitation evapotranspiration index. Nat. Hazards 2023, 115, 389–408. [Google Scholar] [CrossRef]
- Hanif, M.; Khan, A.H.; Adnan, S. Latitudinal precipitation characteristics and trends in Pakistan. J. Hydrol. 2013, 492, 266–272. [Google Scholar] [CrossRef]
- Hirose, M.; Takayabu, Y.N.; Hamada, A.; Shige, S.; Yamamoto, M.K. Impact of long-term observation on the sampling characteristics of TRMM PR precipitation. J. Appl. Meteorol. Clim. 2017, 56, 713–723. [Google Scholar] [CrossRef]
- Houze, R.A., Jr.; Rasmussen, K.L.; Zuluaga, M.D.; Brodzik, S.R. The variable nature of convection in the tropics and subtropics: A legacy of 16 years of the Tropical Rainfall Measuring Mission satellite. Rev. Geophys. 2015, 53, 994–1021. [Google Scholar] [CrossRef]
- Haider, K.; Khokhar, M.F.; Chishtie, F.; RazzaqKhan, W.; Hakeem, K.R. Identification and future description of warming signatures over Pakistan with special emphasis on evolution of CO2 levels and temperature during the first decade of the twenty-first century. Environ. Sci. Pollut. Res. 2017, 24, 7617–7629. [Google Scholar] [CrossRef] [PubMed]
- Khan, N.; Shahid, S.; Ismail, T.B.; Wang, X.-J. Spatial distribution of unidirectional trends in temperature and temperature extremes in Pakistan. Theor. Appl. Climatol. 2019, 136, 899–913. [Google Scholar] [CrossRef]
- Saleem, F.; Zeng, X.; Hina, S.; Omer, A. Regional changes in extreme temperature records over Pakistan and their relation to Pacific variability. Atmos. Res. 2021, 250, 105407. [Google Scholar] [CrossRef]
- Adnan, S.; Ullah, K.; Ahmed, R. Variability in meteorological parameters and their impact on evapotranspiration in a humid zone of Pakistan. Meteorol. Appl. 2020, 27, e1859. [Google Scholar] [CrossRef]
- Malik, S.M.; Awan, H.; Khan, N. Mapping vulnerability to climate change and its repercussions on human health in Pakistan. Glob. Health 2012, 8, 31. [Google Scholar] [CrossRef]
- Dilawar, A.; Chen, B.; Arshad, A.; Guo, L.; Ehsan, M.I.; Hussain, Y.; Kayiranga, A.; Measho, S.; Zhang, H.; Wang, F.; et al. Towards understanding variability in droughts in response to extreme climate conditions over the different agro-ecological zones of Pakistan. Sustainability 2021, 13, 6910. [Google Scholar] [CrossRef]
- Nawaz, Z.; Li, X.; Chen, Y.; Guo, Y.; Wang, X.; Nawaz, N. Temporal and spatial characteristics of precipitation and temperature in Punjab, Pakistan. Water 2019, 11, 1916. [Google Scholar] [CrossRef]
- Sultana, H.; Ali, N.; Iqbal, M.M.; Khan, A.M. Vulnerability and adaptability of wheat production in different climatic zones of Pakistan under climate change scenarios. Clim. Chang. 2009, 94, 123–142. [Google Scholar] [CrossRef]
- Huffman, G.J.; Bolvin, D.T.; Nelkin, E.J.; Wolff, D.B.; Adler, R.F.; Gu, G.; Hong, Y.; Bowman, K.P.; Stocker, E.F. The TRMM multisatellite precipitation analysis (TMPA): Quasi-global, multiyear, combined-sensor precipitation estimates at fine scales. J. Hydrometeorol. 2007, 8, 38–55. [Google Scholar] [CrossRef]
- Huffman, G.J.; Adler, R.F.; Bolvin, D.T.; Nelkin, E.J. The TRMM multi-satellite precipitation analysis (TMPA). In Satellite Rainfall Applications for Surface Hydrology; Springer: Berlin/Heidelberg, Germany, 2010; pp. 3–22. [Google Scholar]
- Ashouri, H.; Hsu, K.-L.; Sorooshian, S.; Braithwaite, D.K.; Knapp, K.R.; Cecil, L.D.; Nelson, B.R.; Prat, O.P. PERSIANN-CDR: Daily precipitation climate data record from multisatellite observations for hydrological and climate studies. Bull. Am. Meteorol. Soc. 2015, 96, 69–83. [Google Scholar] [CrossRef]
- Fernando, N.S.; Shrestha, S.; Kc, S.; Mohanasundaram, S. Investigating major causes of extreme floods using global datasets: A case of Nepal, USA & Thailand. Prog. Disaster Sci. 2022, 13, 100212. [Google Scholar]
- Santos, C.A.G.; Neto, R.M.B.; Nascimento, T.V.M.D.; da Silva, R.M.; Mishra, M.; Frade, T.G. Geospatial drought severity analysis based on PERSIANN-CDR-estimated rainfall data for Odisha state in India (1983–2018). Sci. Total. Environ. 2021, 750, 141258. [Google Scholar] [CrossRef]
- Dee, D.P.; Uppala, S.M.; Simmons, A.J.; Berrisford, P.; Poli, P.; Kobayashi, S.; Andrae, U.; Balmaseda, M.A.; Balsamo, G.; Bauer, P.; et al. The ERA-Interim reanalysis: Configuration and performance of the data assimilation system. Q. J. R. Meteorol. Soc. 2011, 137, 553–597. [Google Scholar] [CrossRef]
- Yu, Q.; MacEachern, S.N.; Peruggia, M. Clustered Bayesian Model Averaging. Bayesian Anal. 2013, 8, 883–908. [Google Scholar] [CrossRef]
- Ebert, E.E. Methods for Verifying Satellite Precipitation Estimates. In Measuring Precipitation From Space; Springer Science and Business Media LLC: Berlin/Heidelberg, Germany, 2007; pp. 345–356. [Google Scholar]
- Anjum, M.N.; Ding, Y.; Shangguan, D.; Ijaz, M.W.; Zhang, S. Evaluation of high-resolution satellite-based real-time and post-real-time precipitation estimates during 2010 extreme flood event in Swat River Basin, Hindukush Region. Adv. Meteorol. 2016, 2016, 2604980. [Google Scholar] [CrossRef]
- Bliemel, F. Theil’s Forecast Accuracy Coefficient: A Clarification; SAGE Publications Sage CA: Los Angeles, CA, USA, 1973. [Google Scholar]
- Shen, Y.; Xiong, A.; Hong, Y.; Yu, J.; Pan, Y.; Chen, Z.; Saharia, M. Uncertainty analysis of five satellite-based precipitation products and evaluation of three optimally merged multi-algorithm products over the Tibetan Plateau. Int. J. Remote Sens. 2014, 35, 6843–6858. [Google Scholar] [CrossRef]
- Sloughter, J.M.L.; Raftery, A.E.; Gneiting, T.; Fraley, C. Probabilistic Quantitative precipitation forecasting using bayesian model averaging. Mon. Weather. Rev. 2007, 135, 3209–3220. [Google Scholar] [CrossRef]
Disclaimer/Publisher’s Note: The statements, opinions and data contained in all publications are solely those of the individual author(s) and contributor(s) and not of MDPI and/or the editor(s). MDPI and/or the editor(s) disclaim responsibility for any injury to people or property resulting from any ideas, methods, instructions or products referred to in the content. |
© 2024 by the authors. Licensee MDPI, Basel, Switzerland. This article is an open access article distributed under the terms and conditions of the Creative Commons Attribution (CC BY) license (https://creativecommons.org/licenses/by/4.0/).