Abstract
The potential environmental impact and increased operational costs associated with the upgrading and renovation of sewage treatment plants are acknowledged. This study employs the upgrading and expansion project of a municipal sewage plant in Dongguan City, Guangdong Province, as a case study. Utilizing the principles and methods of the Life Cycle Assessment (LCA), a comprehensive assessment of the environmental benefits during the upgrading and renovation process of the sewage treatment plant, is conducted and targeted solutions are proposed. The research findings indicate that upgrading and renovating sewage treatment plants can significantly augment the adverse environmental effects of such facilities. Therefore, this study strategically proposes measures such as the utilization of clean energy, sludge resource utilization, and recycled water use as carbon emission reduction pathways. Through calculations, it is demonstrated that the utilization of clean energy and sludge resource can respectively reduce electricity consumption by 12.41% and 59.06%. Concurrently, recycled water use can lead to a reduction of 68.65% in carbon emissions, thereby markedly enhancing positive environmental outcomes.
1. Introduction
Accelerating the closure of the urban sewage treatment capacity gap and steadily advancing the construction of sewage treatment facilities are crucial tasks for enhancing the level of environmental infrastructure development. With the advancement of the national “urbanization strategy”, regional economies are experiencing rapid development, accompanied by an increase in the mobility of urban populations. As the quality of sewage water undergoes significant changes, the upgrading and renovation of sewage treatment plants becomes a necessary and crucial step in enhancing the level of environmental infrastructure development [1]. However, the current upgrading and renovation of sewage treatment plants are primarily focused on extending the treatment process, increasing the dosage of chemicals, and raising energy consumption. This has led to a series of negative environmental impacts [2]. Especially, in the process of process selection, design, and operation, some sewage treatment plants only consider major pollutant emission indicators as the sole criteria, lacking a comprehensive consideration for the overall environmental benefits. This not only results in increased operational costs and resource consumption for sewage treatment plants due to the need to bear the overall pollutant reduction effects in the watershed [3] but it also hinders these essential environmental infrastructure facilities from effectively addressing systemic environmental issues by generally lacking the capacity and role of systematic adjustment [4]. Currently, there is limited research on the environmental benefits of upgrading and renovating wastewater treatment plants, and practical engineering construction lacks effective guidance.
Life Cycle assessment (LCA) is a critical tool for evaluating the economic and environmental benefits of a project. LCA has been widely applied to quantitatively assess the environmental impacts of various factors, products, or services throughout the construction, operation, and decommissioning processes of sewage treatment plants [5]. Following the fundamental principles of ISO 14040 [6], the assessment is divided into four stages: goal and scope definition, inventory analysis, impact assessment methods, and interpretation of results [7].
This study takes the upgrading and renovation project of a wastewater treatment plant in Dongguan City, Guangdong Province, China, as a case study. Utilizing statistical data from the construction and operational phases of the wastewater treatment plant, the principles and methodologies of LCA are employed to quantitatively evaluate the comprehensive environmental benefits of the upgrade and renovation throughout the plant’s entire lifecycle. In response to the environmental issues triggered by the plant’s upgrade, this research conducts an in-depth analysis of the underlying driving factors. Through comparative analysis, this study emphasizes the identification and optimization of key processes, proposing targeted management strategies and technological solutions to achieve environmental sustainability and efficient resource utilization across the wastewater treatment plant’s lifecycle. This study aims to offer recommendations and guidance for the upgrade and renovation of wastewater treatment plants, thereby supporting the establishment of a model for upgraded wastewater treatment plants with high comprehensive benefits and low carbon emissions.
2. Materials and Methods
This study employs the LCA method to analyze the economic and environmental benefits of upgrading and renovating wastewater treatment plants. The Life Cycle Impact Assessment (LCIA) is a core component of the LCA system. Currently, the commonly used LCIA methods include the CML2001 method, EDIP method, EPS method, and the Eco-indicator 99 ecological indicator method, among others [8,9]. The main steps of LCIA can be further divided into classification, characterization, and weighting for quantification [10].
2.1. Classification
As shown in Figure 1, within the LCIA system, environmental impacts are typically categorized into three major groups: resource consumption, ecological impacts, and health risks. Each major category of environmental impact further includes several subcategories [11].
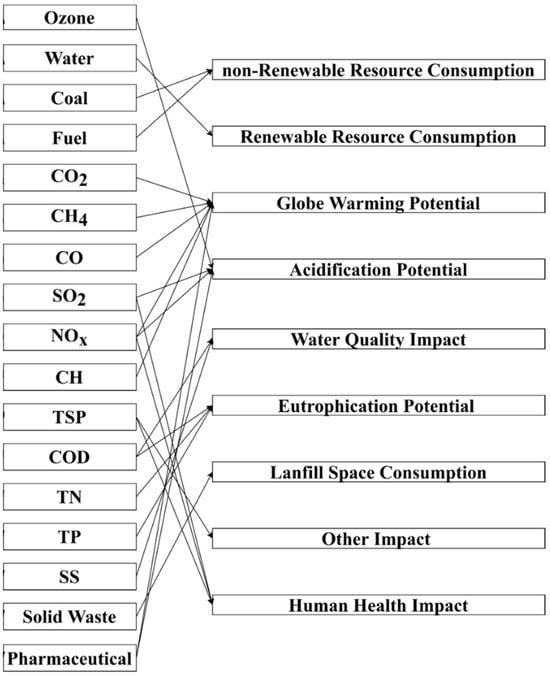
Figure 1.
Environmental impact classification of wastewater treatment.
2.2. Characterization
Following the categorization in Figure 1, the inventory data for the case plant undergoes characterization processing to calculate the Environmental Burden (EB) values [12,13]. The coefficients related to environmental impact are primarily sourced from the EPA and the relevant literature reports [14,15] during the characterization process. An additional indicator, Black Odor Potential (BOP), has been incorporated into the LCIA evaluation content based on relevant model studies [16] in line with the requirements of pollution prevention and control in China.
2.3. Quantitative Weighting
The results of characterization undergo quantification and weighting processes to obtain normalized environmental burden (NEB) [17]. This study employs an analytic hierarchy process (AHP) to construct the A-P judgment matrix and calculate the weights [18]. The A-P judgment matrix and corresponding weights are calculated using the nine-point scale method [16,18,19]. The results are illustrated in Figure 2.
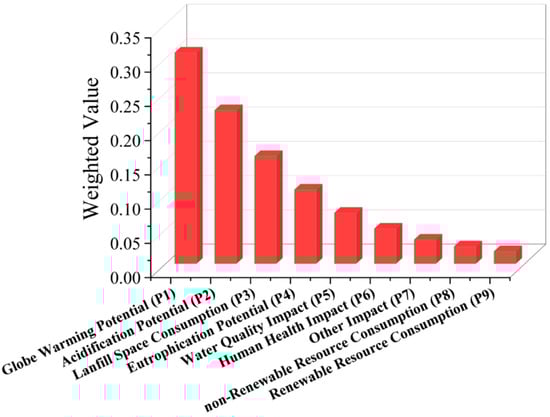
Figure 2.
Weight distribution for different environmental impacts.
According to the weights obtained from Figure 2, the Life Cycle Impact Assessment (LCIA) results are calculated using Equation (1).
3. Results and Discussion
This study takes the upgrading project of a wastewater treatment plant in Dongguan City, Guangdong Province as an example to analyze the environmental benefits of the upgraded treatment plant using the LCA method and to propose solutions.
The sewage treatment plant is located in Dongguan City, Guangdong Province, China. The ultimate planned construction scale is 400,000 cubic meters per day (m3·d−1), and the current completed three phases have a total construction scale of 300,000 m3·d−1. The first, second, and third phases of the project were completed and put into operation in 2019, 2021, and 2023, respectively, with a designed sewage treatment capacity of 100,000 cubic meters per day for each phase. In the initial stage of the first phase of the sewage treatment plant, it adhered to the Grade B standard. The first phase was simultaneously upgraded with the expansion of the second phase. The treated effluent water quality adhered to the Grade A standard of the “Emission Standards of Pollutants for Urban Wastewater Treatment Plants” (GB18918-2002) [20] in coordination with the second and third phases. Furthermore, it complied with the more stringent values in the Grade 1 standard of the second period of the local standard of Guangdong Province, “Discharge Limits of Water Pollutants” (DB44/26-2001) [21]. In this case, phase one is operated and managed by Water Company A, responsible for the operational upgrade, while phases two and three are operated and managed by Water Company B. The process flow is illustrated in Figure 3 below.
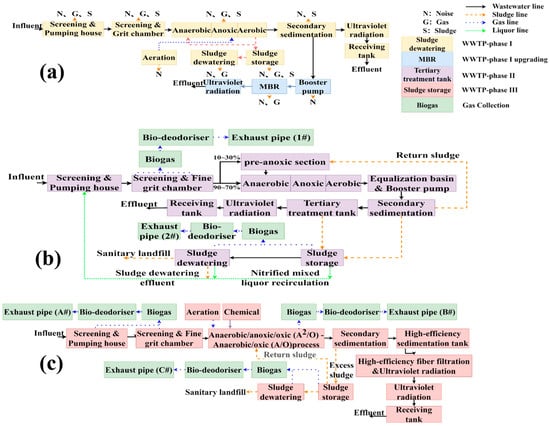
Figure 3.
Process flow chart of the assessed plant: (a) Phase I and Phase I-upgrading, (b) Phase II, (c) Phase III.
The first phase of the wastewater treatment process adopts the A/O process, with a relatively simple process flow. The first stage of the upgrading project enhances the effluent by introducing a secondary treatment, employing an additional A/O + MBR process on top of the first-phase treatment. Similarly, the second-phase project also utilizes the A/O process, but after physical pretreatment, the wastewater is divided. Most of the wastewater goes directly into the anaerobic tank, while a small portion undergoes anoxic pretreatment before being introduced into the anaerobic tank. The third-phase project employs a more sophisticated modified A2O-A-O process. Additionally, the first-phase project lacks an odor treatment system, whereas both the second and third phases incorporate odor treatment systems. The odor treatment system in the third-phase project is the most complex, addressing the odors produced during the biological treatment process as well.
The sewage treatment plant primarily receives domestic wastewater from the main collection areas. Additionally, a small amount of industrial wastewater meeting the necessary standards after pretreatment is directed to the sewage plant through the municipal pipeline network, approximately 0.08 million cubic meters per day (m3·d−1). The serviced area of the sewage treatment plant has a relatively high level of economic development, a significant number of migrant workers, and a demographic structure predominantly composed of young people. The per capita domestic water consumption is relatively high in this area. Due to the significant proportion of transient individuals, there is a notable difference in the amount of domestic wastewater discharged during the day, with lower volumes during the day. Additionally, a significant peak in the discharge of domestic wastewater occurs after working hours. Due to a lack of strong water conservation awareness among the relevant communities, the wastewater treatment plant experiences a paradox where, during peak inflow periods, the influent concentration is relatively low.
3.1. Basic Data Index of Sewage Plant
In this study, the boundary scope of the LCA for the case plant is presented in Figure 1. The inventory used in this study consists of three parts: inputs, outputs, and recycling, as shown in Table 1.

Table 1.
The inventory for LCA to evaluate the overall environmental impact.
The case includes an inventory of relevant substances and energy consumption in the wastewater treatment plant. Additionally, it encompasses the water quality indicators for influent and effluent, as shown in Table S1 and Figure 4. In this context, the functional unit for LCIA is defined as 1 FU = 36.5 million m3. This quantity is equivalent to the annual designed sewage treatment capacity of the wastewater treatment plant for each period.
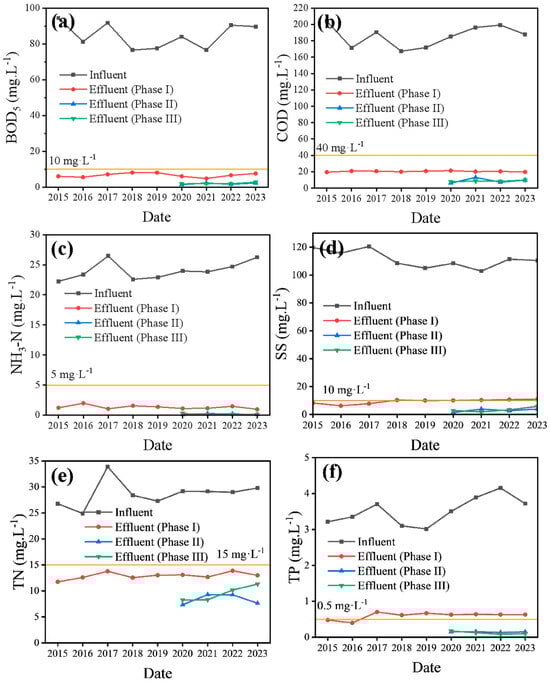
Figure 4.
Annual evaluation monitoring results for water quality indicators (2018–2022): (a) BOD5, (b) COD, (c) NH3-N, (d) SS, (e) TN, (f) TP.
3.2. Characterization Results
In the above-mentioned charts, the coefficients and characterization factors related to the environmental impacts of input resources and energy consumption [12,16,22,23,24,25] are obtained through data accounting from the literature. Additionally, the carbon emission coefficients associated with the sewage and sludge treatment and disposal processes [26,27,28] are also acquired through data accounting from the literature. The total energy consumption of the demolition process is 95 kWh·m−2 [29] During the dismantling process, the steel recovery coefficient is set at 0.8 [30], and the remaining solid waste is considered construction waste. When calculating the deducted amount for steel recycling, the environmental impact generated during the recycling process is still included in the environmental impact assessment of construction waste disposal. In the calculation of inflow and outflow indicators, the chosen indicator for the case factory is TN (Total Nitrogen) to prevent redundant calculations. Consequently, the contribution of NH4+ is no longer considered, and the characterization results are presented in Table S2 and Figure 5.
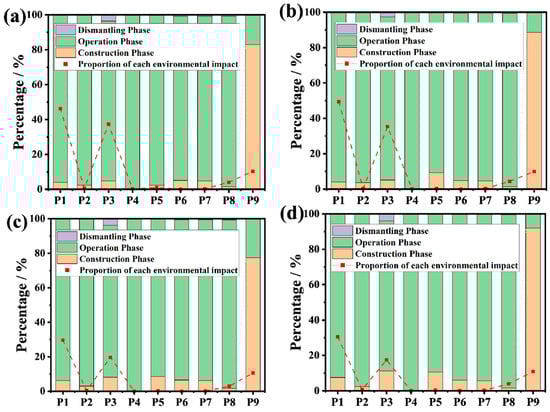
Figure 5.
Proportion of the environmental impacts in different phases: (a) Phase I, (b) Phase I-upgrading, (c) Phase II, (d) Phase III. P1: Globe Warming Potential, P2: Acidification Potential, P3: Landfill Space Consumption, P4: Eutrophication Potential, P5: Water Quality Impact, P6: Human Health Impact, P7: Other Impact, P8: non-Renewable Resource Consumption, P9: Renewable Resource Consumption.
The most significant impacts are associated with global warming and the potential impact on landfills in the environmental impact potential of the case factory, which is generally consistent with relevant research findings [12,18]. Apart from a significant proportion of renewable resource consumption during the construction phase, the remaining environmental impacts mainly stem from the operational phase. Compared to other environmental impacts, the construction, operation, and dismantling phases significantly affect landfill space. This is primarily due to land scarcity in the Pearl River Delta region, where the case factory disposes of construction waste and sludge through landfill methods.
Combining the results from Table S2 and Figure 5, it is evident that the overall environmental impact of the first phase of the case factory’s project increases significantly through the upgrade. Moreover, there are noticeable changes in the impacts among different environmental categories and in the influence of each phase on the environment. This suggests that the upgraded renovation have led to an increase in negative environmental effects, and these augmented negative effects have multifaceted impacts on the environment. This finding aligns with similar results in related research [16].
3.3. Quantization Weight Result
As indicated in Table S3 and Figure 6, through quantification and weighting based on characterization, the global warming impact and landfills’ space consumption still remain the dominant factors in the comprehensive environmental impact. After comprehensively considering the natural geography of the location and socioeconomic development, and subsequently normalizing the data, the proportion of the impact of global warming has exhibited a notable increase. This is attributed to its global scale impact, long-lasting effects, and higher assigned weight. The most noticeable decrease is observed in the consumption of renewable resources. This is attributed to the abundant water resources in the region where the case factory is located, with a relatively lower assigned weight on one hand. After the upgrade and expansion, the effluent water quality from the case factory is improved, and processes such as the mixing of chemicals and flushing used recycled water on the other hand. As a result, the primary source of water consumption becomes the daily domestic water use by sewage plant management and technical personnel.
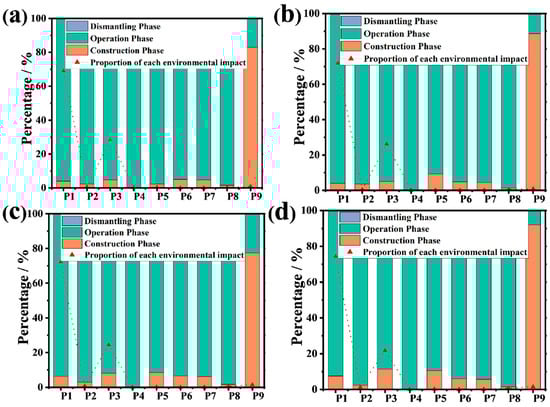
Figure 6.
The normalized results of the environmental impacts in different phases: (a) Phase I, (b) Phase I-upgrading, (c) Phase II, (d) Phase III. P1: Globe warming potential, P2: acidification potential, P3: landfill space consumption, P4: eutrophication potential, P5: water quality impact, P6: human health impact, P7: other impact, P8: non-renewable resource consumption, P9: renewable resource consumption.
Meanwhile, as illustrated in Figure 7, after quantification and weighting based on the characterization results, the overall negative environmental impact increases. This increase is observed in the upgraded phase compared to the initial phase. Furthermore, the contribution of global warmings impact further rises. This result indicates that despite the reduction in river pollutants achieved through the upgraded renovation, when considering the overall life cycle perspective. The environmental benefits of the upgraded phase of the case factory do not achieve a net reduction in impact. This finding aligns with similar conclusions in the relevant literature [16].
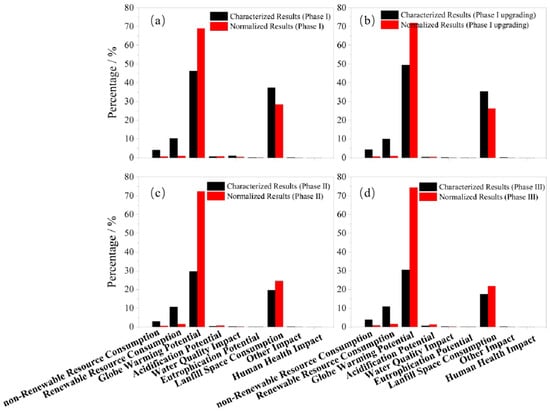
Figure 7.
Comparison of the environmental impacts between the characterization and normalization results: (a) Phase I, (b) Phase I-upgrading, (c) Phase II, (d) Phase III.
3.4. The Whole Life Cycle Affects the Results Comprehensively
By using Equation (1), the LCIA for each period is calculated, respectively:
LCIA1 = 6.333 × 10⁻⁴, LCIA1−t = 1.008 × 10⁻³, LCIA2 = 6.002 × 10⁻⁴, LCIA3 = 6.015 × 10⁻⁴, where, LCIA1 represents the first phase of the project, LCIA1−t denotes the upgraded first phase project, LCIA2 corresponds to the second phase of the project, and LCIA3 pertains to the third phase of the project. LCIA1−t represent the upgrade in the first phase, for the purpose of facilitating a comparison with the first phase as well as the second and third phases, and the values calculated for the upgrade in the first phase include the environmental impact of the first phase. Analyzing the results of the LCIA calculations reveals that the environmental impact of the upgrade in the first phase is higher than the initial phase, as mentioned earlier. Additionally, it is significantly higher than that of the second and third phases. The main reasons for this can be attributed to four factors:
In the upgrade of the first phase, there is a need to dismantle the already constructed components, leading to an increase in solid waste generation and energy consumption during the construction and dismantling stages.
The AO-MBR process is employed in the upgrade of the first phase. However, the influent to the MBR membrane tank is introduced by utilizing the effluent from the first phase after secondary lifting. This results in a significant increase in energy consumption compared to a one-time construction process, consequently leading to a notable rise in the negative environmental impact.
As shown in Table S1, the measured total energy consumption for the upgraded first phase in the case factory is 0.57 kWh·m−3, falling within the typical range of unit energy consumption for the common MBR processes [31,32]. The MBR process inherently exhibits a higher energy consumption, as indicated in [31]. Consequently, this leads to an overall higher energy consumption for the upgraded first phase compared to the other phases.
As shown in Figure 8, the comparison of the quantified environmental impact results in four stages for each period, combined with the results of LCIA, reveals that:
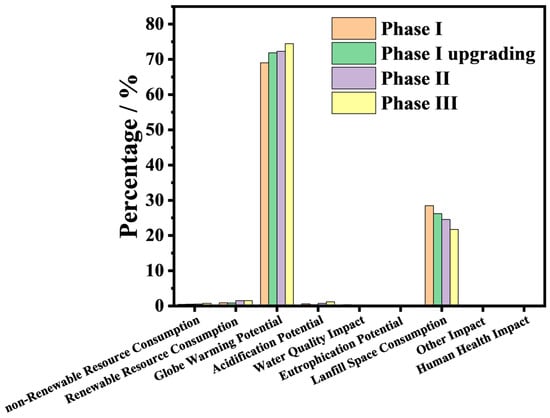
Figure 8.
Comparison of quantitative environmental impact results at different stages.
The composition differences are significant due to varying environmental influences across different periods. The case factory is managed by two water companies. The first phase and the second and third phases, being new constructions, adopt similar sludge treatment processes. The sludge treatment standards for the first phase and the second phase are consistent, maintaining a moisture content of 80%. However, the third phase adopts a new process, with a sludge treatment moisture content of 60%. This results in the third phase having a smaller impact on landfills caused by sludge compared to the other phases.
In the third phase, due to limited land availability, there is a reduction in solid waste generation resulting from construction and demolition. However, this reduction necessitates compensatory measures, such as increased aeration and mixing, to address the reduced processing efficiency caused by space constraints. Consequently, the energy consumption in the third phase is significantly higher than in other phases. Therefore, the selection of sewage treatment processes should comprehensively consider factors such as site conditions, processes, and the inflow and outflow of water.
The region where the case factory is located relies mainly on thermal power generation. Although the improvement in the effluent water quality is accompanied by a reduction in the potential for water body eutrophication and the occurrence of foul odors, it also leads to an overall increase in process energy consumption and chemical usage. Consequently, this results in an increase in environmental impact indicators such as greenhouse gas emissions and atmospheric acidification throughout the entire lifecycle. This aligns with the findings from the related research [6,16,33].
3.5. Study on Emission Reduction Path of Sewage Plant
It can be observed that the main environmental impact factors for the case factory are the consumption of electricity and the utilization of sludge landfill space from an analysis of the results of the life cycle impact. Hence, in order to optimize the upgrading and renovation of wastewater treatment plants and minimize environmental impact across their life cycle, it becomes imperative to implement targeted optimization measures. These measures should specifically focus on reducing both land use and energy consumption.
3.5.1. Clean Energy Utilization
According to the classification of the LCA, the sources of energy consumption can be subdivided into:
Indirect energy consumption: The primary accounting components include the construction and demolition processes of the case factory, focusing on the materials used during building, along with the material and energy consumption generated during transportation and production.
Direct energy consumption: The main accounting components include the direct electricity consumption during the construction and demolition processes of the wastewater treatment plant, as well as the direct electricity consumption, fuel usage, and chemical consumption during the wastewater treatment process.
Direct energy consumption is the largest expenditure in the daily operation of wastewater treatment plants, with electricity consumption typically accounting for 60-90% of the overall direct energy consumption [34]. The wastewater treatment industry is an energy-intensive sector, and reducing the direct energy consumption of wastewater treatment plants requires scientific and technological approaches. At present, the average energy consumption of urban wastewater treatment plants in China is 0.29 kWh·m−3 [35]. From the energy consumption data shown in Table S1, it can be observed that the average energy consumption of the case factory is slightly higher than the national average. Therefore, reducing the direct electricity consumption of the case factory is an effective measure to mitigate its environmental impact. In this study, the optimization strategy combines methods for reducing electricity consumption in wastewater treatment plants globally and domestically. The specific focus lies in minimizing electricity consumption through the implementation of distributed photovoltaic construction for wastewater treatment plants.
The current total constructed area of the case factory is approximately 103,606 m2 after inventory accounting. It is proposed to use 285 Wp polycrystalline silicon photovoltaic modules. Therefore, the number of photovoltaic panels is 29,087, with a total capacity of 8290 kWp. In accordance with the regional distribution of solar radiation in China [35], the installation angle for the distributed photovoltaic system in the case factory is set at 17°. This decision aligns with the stipulations outlined in the ‘Photovoltaic Power Generation Solar Resource Assessment Specification (GB/T 42766-2023)’ [36] and the ‘Design Specification for Photovoltaic Power Stations (GB 50797-2012)’ [37]. The annual effective utilization hours are 1014.99 h with peak sunshine hours of 3.52 h·d−1. The system calculates electricity generation with an annual degradation of 0.6% over 25 years. The total electricity generation of the case factory’s photovoltaic system over 25 years is estimated to be approximately 167,358,552.6 kWh, with an average daily electricity generation of 18,340.7 kWh·d−1. The photovoltaic panels are mounted on hot-dip galvanized carbon steel fixed brackets, which are secured to a cement foundation.
The typical design service life of domestic photovoltaic systems is 25 years, with a component failure rate of ≤0.002%. Additionally, it is crucial to note that there are no emissions of pollutants during the operational phase. Consequently, the carbon emissions related to equipment replacement, constituting less than 1% of the overall inputs and outputs, are excluded from the total accounting [36]. Given the climatic characteristics and economic development in the Dongguan region, it is necessary to clean the solar panels weekly. This measure aims to prevent the impact of dust accumulation on photovoltaic power generation. The water consumption for module cleaning is calculated at 0.5 kg·m−2. This translates to an annual water consumption of 1865 tons for the photovoltaic modules in the case factory, with the adoption of wastewater reuse. At present, the large-scale use of polycrystalline silicon solar panels in China has only been for a little over 10 years. Consequently, there is a lack of comprehensive data for the dismantling phase. In this study, based on the existing literature [38,39], inputs and outputs were accounted for, as shown in Table 2 and Table 3.
Table 2.
Full life cycle carbon emissions during the construction phase of PV power generation in the case study plant.
Table 3.
Inputs and outputs of the dismantling and disposal process of photovoltaic systems.
By characterizing and quantifying the data in Table 2 and Table 3 through weighted calculations, the life cycle impact results for the photovoltaic retrofit of the case factory can be obtained, as shown in Table 4 and Table S4.
Table 4.
Environmental emission reductions from photovoltaic power generation. Unit: t·a−1.
Using Equation (1), the calculated indicator value for the photovoltaic system is: LCIAlight = 2.36 × 10⁻⁴.
Based on the overall energy consumption calculation for the wastewater treatment plant, the case factory can achieve a 12.41% reduction in electricity consumption through the implementation of distributed photovoltaic construction. The LCIA can be reduced from the original 2.21 × 10⁻³ to 1.97 × 10⁻³, representing a 10.69% reduction when considering the overall life cycle environmental impact. The significant emission reduction benefits align with the findings from related studies [16].
3.5.2. Sludge Resource Utilization
It is evident that the sludge generated during the operational phase has a significant environmental impact according to the life cycle analysis. The continuous external transportation of sludge not only consumes a considerable amount of land but also results in significant waste of energy and resources. The first phase, the upgraded first phase and the second phase of the case factory all utilize integrated centrifugal thickening and dewatering units for sludge treatment (moisture content up to 80%). The treated sludge is then transported by qualified entities to a centralized sludge disposal center for further processing. In the third phase, the sludge is treated using a high-efficiency sedimentation tank followed by fiber plate and frame press dewatering (moisture content reduced to 60%). It is planned to be sent to the sludge disposal center along with the sludge from the first and second phases.
The majority of the wastewater collected by the case factory is domestic sewage from the serviced area, providing significant potential for the convenient and resourceful utilization of sludge in terms of harmlessness and resource recovery. At present, Dongguan City does not have a completed sludge incineration center. There is an under-construction alternative energy project to the west of the case factory site, which includes three waste heat boilers and six generators. The case factory plans to adopt a resource recovery approach for sludge treatment to fully utilize the regional resources and is considering factors such as transportation distance and disposal costs, involving pyrolysis and anaerobic digestion. This decision is based on references to the sludge treatment and disposal practices in related domestic wastewater treatment plants [40,41,42]. The average recovery potential for anaerobic digestion is assumed to be 1482 kWh·t−1, as reported in the literature [39]. By converting the dry sludge quantity based on Table S1, the recoverable energy for each stage of the case factory is calculated.
Overall, one phase yield 22,793.16 kWh·d−1, the upgraded first phase produces 16,302.00 kWh·d−1, the second phase generates 18,721.92 kWh·d−1, and the third phase results in 29,802.41 kWh·d−1 of recoverable energy. The total recoverable energy is 87,619.5 kWh·d−1, corresponding to the pollutant emission reductions as shown in Table S5. Using Equation (1), the calculated indicator value for sludge resource recovery is: LCIA = 3.88 × 10⁻⁴.
Based on the calculation of the overall energy consumption in the wastewater treatment plant, the case factory achieves a 59.06% reduction in electricity consumption. This reduction is attained through the resource recovery of sludge using pyrolysis and anaerobic digestion. If considering the overall life cycle environmental impact, the LCIA can be reduced from the original 2.21 × 10⁻³ to 1.82 × 10⁻³, representing a 17.57% reduction. The significant emission reduction benefits are evident, and the method is approaching the advanced levels of energy and heat utilization from sludge resources found in both domestic and international practices [40,42].
It can be observed that there is a certain difference between the two phases from the reduction in electricity consumption and the decline in LCIA. This is mainly because LCIA calculations also consider the sludge external transportation and the associated fuel, material consumption, emissions. Additionally, LCIA takes into account the environmental impacts generated during the production and manufacturing of these fuels and materials. Due to the tight land resources in the region where the case factory is located and the centralized disposal area being at a certain distance from the case factory, reducing the distance of the sludges external transportation and disposal could decrease the associated environmental impact. This, in turn, would further enhance the overall positive benefits of sludge resource recovery.
3.5.3. Reclaimed Water Utilization
According to the relevant environmental management regulations in Dongguan City, the reclaimed water utilization in the case factory complies with the requirements of the new era ecological civilization construction. It can effectively support Dongguan City in implementing water conservation management. The case factory is located in the southwest of Dongguan, adjacent to Shenzhen. The predominant industries include electronics, light manufacturing, clothing, and textiles, and are often organized in small industrial parks. The parks have stable greenery and municipal water supply, with some enterprises having a demand for cooling cycle water. It is observed that the effluent water quality from the case factory is relatively good through inventory analysis. Currently, the discharged water is directly released into the river as a supplement to the ecological base flow. Therefore, the case factory can serve as a source of reclaimed water for the local area. The focus can be on easily implementable areas such as landscaping and municipal water use in the initial stage. Through communication with relevant enterprises, it can further be utilized as a supplement for industrial water use in the later stages.
- Water availability
According to the ‘Water Use Quotas in Guangdong Province (DB44/T 1461-2021)’ [43] for the category of landscaping management, the water consumption for urban landscaping is in the range of 0.7 (advanced value) to 2.0 (general value) L·(m2·d)−1. In this study, the effluent water volume from the case factory is 30 × 104 m3·d−1, according to the water use quota of 2.0 L·(m2·d)−1. Following the national regulatory requirement for a reuse rate of over 25% for reclaimed water, the case factory could provide a recycled water volume of 7.5 × 10⁴ m3·d−1. This would meet the irrigation water demand for 37.5 million square meters of urban greenery. According to the national economic and social development statistics bulletin for the town or street where the case factory is located as of the end of 2021, the built-up area of the town or street is 89.96 km2, with a green coverage rate of 52.4%. Based on the national requirements for reclaimed water utilization, it can be inferred that the case factory can meet 79.55% of the water demand for green spaces, indicating good practical feasibility.
- 2.
- Water quality feasibility
Table S6 presents the actual multi-month monitoring average results of the combined effluent from each phase, along with a comparison to relevant standards.
- 3.
- Carbon emission reduction benefit
The urban water supply system mainly includes water abstraction, water treatment, and water distribution systems, all of which contribute to indirect carbon emissions. Using the carbon emission accounting methods reported in the relevant literature [44,45], and referring to data from the National Statistical Yearbook for the year 2021, the carbon emission accounting results for the reclaimed water utilization process in the case factory are compared. The comparison is presented in Table 5.
Table 5.
Carbon Emissions Comparison.
The results of the LCA indicate that the LCIA for the first phase of upgrading is significantly higher than that of the second and third phases. This results in a notable increase in environmental negative impacts. The related emission reduction benefits are lower than the results reported in the literature [44]. This is mainly due to the differences in emission factors and energy consumption intensity selected for the calculation of total carbon emissions during the process of preparing tap water. Although the reuse of reclaimed water is not included in the scope of the LCA of the wastewater treatment plant in this study, from the perspective of overall regional environmental benefits, the carbon emission reduction from reclaimed water utilization has a significant ‘positive’ impact on the regional environment.
- 4.
- Environmental pollution reduction benefits
The reuse of reclaimed water can prevent the total amount of pollutants brought into the receiving water body by direct discharge of wastewater. It also helps avoid the waste of potable water resources and reduces the generation of negative environmental externalities [46,47]. Based on the effluent water quality from the wastewater treatment plant as shown in Table S6, the environmental emission reduction benefits of the reclaimed water utilization in the case factory are calculated and presented in Table 6.
Table 6.
Environmental Pollution Reduction Benefits.
4. Conclusions
Through the quantitative weighted analysis of the case factory’s data using the Life Cycle Assessment (LCA) method, the results indicate that the LCIA for the first phase of upgrading is significantly higher than that of the second and third phases. This leads to a notable increase in environmental negative impacts. This is attributed to the necessity for the sewage treatment plant to dismantle old equipment and construct new facilities, resulting in a significant increase in energy consumption. Additionally, the newly constructed MBR membrane pool has also contributed to the increase in energy consumption. Therefore, to enhance the post-upgrading positive environmental outcomes of the sewage treatment plant, this study proposes targeted measures, including the utilization of clean energy, sludge resource utilization, and recycled water use as carbon emission reduction pathways. The adoption of clean energy, specifically through photovoltaic power generation, can result in a 12.41% reduction in system electricity consumption and a corresponding 10.69% decrease in LCIA. The resource utilization of sludge can recover 87,619.5 kWh·d−1 of energy, translating to a 59.06% reduction in energy consumption and a corresponding 17.57% decrease in LCIA. Applying means of regeneration, such as irrigating urban green spaces with treated wastewater from the sewage treatment plant, can achieve a 68.65% carbon emission reduction, significantly enhancing environmental benefits.
Supplementary Materials
The following supporting information can be downloaded at: https://www.mdpi.com/article/10.3390/w16040596/s1, Table S1: List of main resources used, and pollutants emitted; Table S2: The characterized results of the environmental impacts. Unit: t·FU−1; Table S3: The normalized results of environmental impacts. Unit: t·FU−1; Table S4: Environmental emission reduction of photovoltaic power generation in its whole life cycle. Unit: t·FU−1; Table S5: Environmental emission reductions from sludge resource utilization. Unit: t·a−1; Table S6: Sewage plant effluent quality and related standards.
Author Contributions
Conceptualization, Y.L. and H.A.; investigation, H.A. and C.L. (Changmin Liu); formal analysis, Y.L. and C.L. (Chao Li); writing—original draft preparation, Y.L. and H.A.; data curation, C.L. (Chao Li) and C.L. (Changmin Liu); writing—review and editing, Y.L., H.A. and C.L. (Chao Li); funding acquisition, H.A.; resources, H.A.; writing—review and editing, C.L. (Changmin Liu); visualization, Y.L. and C.L. (Changmin Liu); supervision, H.A. and C.L. (Changmin Liu) All authors have read and agreed to the published version of the manuscript.
Funding
This research received no external funding.
Data Availability Statement
Data can be provided upon request, for collaboration purposes.
Conflicts of Interest
Author Hao An was employed by the company China MCC5 Group Corp. Ltd. The remaining authors declare that the research was conducted in the absence of any commercial or financial relationships that could be construed as a potential conflict of interest.
References
- Liu, L.C.; Zhang, X.H.; Lyu, Y.F. Performance comparison of sewage treatment plants before and after their upgradation using emergy evaluation combined with economic analysis: A case from Southwest China. Ecol. Model. 2022, 472, 110077. [Google Scholar] [CrossRef]
- Su, H.; Yi, H.; Gu, W. Cost of raising discharge standards: A plant-by-plant assessment from wastewater sector in China. J. Environ. Manag. 2022, 308, 114642. [Google Scholar] [CrossRef]
- Fang, L.; Valverde-Pérez, B.; Damgaard, A. Life Cycle Assessment as Development and Decision Support Tool for Wastewater Resource Recovery Technology. Water Res. 2016, 88, 538–549. [Google Scholar] [CrossRef]
- Meng, F.; Fu, G.; Butler, D. Cost-Effective River Water Quality Management using Integrated Real-Time Control Technology. Environ. Sci. Technol. 2017, 51, 9876–9886. [Google Scholar] [CrossRef] [PubMed]
- Loubet, P.; Roux, P.; Loiseau, E.; Bellon-Maurel, V. Life cycle assessments of urban water systems: A comparative analysis of selected peer-reviewed literature. Water Res. 2014, 67, 187–202. [Google Scholar] [CrossRef] [PubMed]
- GB/T 24040-2008/ISO 14040:2006; Environmental Management-Life Cycle Assessment-Principles and Frameworks. Standards Press of China: Beijing, China, 2006. (In Chinese)
- Pasqualino, J.C.; Meneses, M.; Castells, F. Life cycle assessment of urban wastewater reclamation and reuse alternatives. J. Ind. Ecol. 2010, 15, 49–63. [Google Scholar] [CrossRef]
- Alyaseri, I.; Zhou, J.P. Handling uncertainties inherited in life cycle inventory and life cycle impact assessment method for improved life cycle assessment of wastewater sludge treatment. Heliyon 2018, 5, 2405–8440. [Google Scholar] [CrossRef] [PubMed]
- Magnus, A.; Magnus, R.; Felipe, O.; Ulf, J. Multi-objective performance assessment of wastewater treatment plants combining plant-wide process models and life cycle assessment. J. Water Clim. Chang. 2017, 8, 715–729. [Google Scholar]
- Corominas, L.L.; Foley, J.; Guest, J.S.; Hospido, A.; Larsen, H.F.; Morera, S.; Shaw, A. Life cycle assessment applied to wastewater treatment: State of the art. Water Res. 2013, 47, 5480–5492. [Google Scholar] [CrossRef] [PubMed]
- Kim, J.; Lee, D.; Nam, S. Potential for environmental impact reduction through building LCA (Life Cycle Assessment) of school facilities in material production stage. Build. Environ. 2023, 238, 110329. [Google Scholar]
- Gallego-Schmid, A.G.; Tarpani, R.R.Z. Life cycle assessment of wastewater treatment in developing countries: A review. Water Res. 2019, 153, 63–79. [Google Scholar] [CrossRef] [PubMed]
- Owusu, C.; Flanagan, B.; Lavery, A.M.; Mertzlufft, C.E.; McKenzie, B.A. Developing a granular scale environmental burden index (EBI) for diverse land cover types across the contiguous United States. Sci. Total Environ. 2022, 838, 0048–9697. [Google Scholar] [CrossRef] [PubMed]
- Zang, Y.; Li, Y.; Wang, C.; Zhang, W.; Xiong, W. Towards more accurate life cycle assessment of biological wastewater treatment plants: A review. J. Clean. Prod. 2015, 107, 676–692. [Google Scholar] [CrossRef]
- Peters, G.P.; Andrew, R.M.; Canadell, J.G. Carbon dioxide emissions continue to grow amidst slowly emerging climate policies. Nat. Clim. Chang. 2020, 10, 3–6. [Google Scholar] [CrossRef]
- Hao, X.; Wang, X.; Liu, R.; Li, S.; Loosdrecht, M.; Jiang, H. Environmental impacts of resource recovery from wastewater treatment plants. Water. Res. 2019, 160, 268–277. [Google Scholar] [CrossRef] [PubMed]
- European Commission—Joint Research Centre—Institute for Environment and Sustainability (EC-JRC). International Reference Life Cycle Data System (ILCD) Handbook—General Guide for Life Cycle Assessment—Detailed Guidance. March 2010. EUR 24708 EN, 1st ed.; Publications Office of the European Union: Luxembourg, 2010. [Google Scholar] [CrossRef]
- Singh, R.; Majumder, C.B.; Vidyarthi, A.K. Assessing the impacts of industrial wastewater on the inland surface water quality: An application of analytic hierarchy process (AHP) model-based water quality index and GIS techniques. Phys. Chem. Earth 2023, 129, 1474–7065. [Google Scholar] [CrossRef]
- Zhao, X.; Yang, J.; Ma, F. Set organic pollution as an impact category to achieve more comprehensive evaluation of life cycle assessment in wastewater-related issues. Environ. Sci. Pollut. Res. 2018, 25, 5960–5968. [Google Scholar] [CrossRef] [PubMed]
- GB 18918-2002; Discharge Standard of Pollutants for Municipal Wastewater Treatment Plant. Standards Press of China: Beijing, China, 2002. (In Chinese)
- DB44 26-2001; Discharge Limits of Water Pollutants. Standards Press of China: Guangzhou, China, 2001. (In Chinese)
- IKE. Chinese Life Cycle Database e CLCD. 2010. Available online: http://www.ike-global.com/products-2/chinese-lca-database-clcd (accessed on 5 November 2023).
- IPCC. IPCC Guidelines for National Greenhouse Gas Inventories. IGES, Japan. 2006. Available online: https://www.ipcc-nggip.iges.or.jp/public/2006gl/index.html (accessed on 7 November 2023).
- Alyaseri, I.; Zhou, J. Towards better environmental performance of wastewater sludge treatment using endpoint approach in LCA methodology. Heliyon 2017, 3, e00268. [Google Scholar] [CrossRef]
- Egle, L.; Rechberger, H.; Zessner, M. Overview and description of technologies for recovering phosphorus from municipal wastewater. Resour. Conserv. Recycl. 2015, 105, 325–346. [Google Scholar] [CrossRef]
- Lu, H.; Wang, H.Z.; Wu, Q.L.; Luo, H.C.; Zhao, Q.; Liu, B.H. Automatic control and optimal operation for greenhouse gas mitigation in sustainable wastewater treatment plants: A review. Sci. Total Environ. 2023, 855, 0048–9697. [Google Scholar] [CrossRef]
- Amann, A.; Zoboli, O.; Krampe, J.; Rechberger, H.; Zessner, M.; Egle, L. Environmental impacts of phosphorus recovery from municipal wastewater. Resour. Conserv. Recycl. 2018, 130, 127–139. [Google Scholar] [CrossRef]
- Zhou, X.; Bai, S.W.; Zhao, X.Y.; Yang, J.X. From full life cycle assessment to simplified life cycle assessment: A generic methodology applied to sludge treatment. Sci. Total Environ. 2023, 904, 167149. [Google Scholar] [CrossRef]
- Liu, Z. Life cycle analysis in environmental impact assessment. China Resour. Compr. Util. 2010, 28, 54–57. (In Chinese) [Google Scholar]
- Gao, C.; Chen, S.; Chen, S. Life cycle assessment of integrated iron and steel works in China. J. Harbin Inst. Technol. 2016, 48, 177–181. (In Chinese) [Google Scholar]
- Venkatesh, G.; Brattebø, H. Environmental impact analysis of chemicals and energy consumption in wastewater treatment plants: Case study of Oslo, Norway. Water Sci. Technol. 2011, 63, 1018–1031. [Google Scholar] [CrossRef]
- Electric Power Research Institute. Water and Sustainability: US Electricity Consumption for Water Supply and Treatment—The Next Half Century; Electric Power Research Institute: Palo Alto, CA, USA, 2002. [Google Scholar]
- Zhu, L.; Liu, B.; Wang, F. Raising Discharge Standards Leads to Environmental Problem Shifting in China. Water Sci. Technol. 2013, 68, 2605–2612. [Google Scholar] [CrossRef]
- Zhang, Q.; Wang, X.; Xiong, J.; Chen, R.; Cao, B. Application of life cycle assessment for an evaluation of wastewater treatment and reuse project—Case study of Xi’an, China. Bioresour. Technol. 2010, 101, 1421–1425. [Google Scholar] [CrossRef] [PubMed]
- Stefano, L.; Benedetto, M.A.; Michael, B.; Antonio, C.; Andreas, C.; Francesco, F.; Juan, M.L.; Miguel, M.-I.; Ana, S.; Almudena, H. Monitoring and diagnosis of energy consumption in wastewater treatment plants. A state of the art and proposals for improvement. Appl. Energy 2016, 179, 1251–1268. [Google Scholar]
- GB/T 42766-2023; Specifications for Solar Energy Resource Assessment of Photovoltaic Power Generation. Standards Press of China: Beijing, China, 2023. (In Chinese)
- GB 50797-2012; Code for Design of Photovoltaic Power Station. Standards Press of China: Beijing, China, 2012. (In Chinese)
- Yang, D.; Liu, J.; Yang, J.; Ding, N. Life-cycle assessment of China’s multi-crystalline silicon photovoltaic modules considering international trade. J. Clean. Prod. 2015, 94, 35–45. [Google Scholar] [CrossRef]
- Peng, J.; Lu, L.; Yang, H. Review on life cycle assessment of energy payback and greenhouse gas emission of solar photovoltaic systems. Renew. Sustain. Energy Rev. 2013, 19, 255–274. [Google Scholar] [CrossRef]
- Khaled, O.; Nabila, S.; Enas, T.S.; Mohammad, A.A.; Mohamed, S.; Mahmoud, A.G.O. The role of wastewater treatment in achieving sustainable development goals (SDGs) and sustainability guideline. Energy Nexus 2022, 7, 100112. [Google Scholar]
- Oladejo, J.; Shi, K.; Luo, X.; Yang, G.; Wu, T. A Review of Sludge-to-Energy Recovery Methods. Energies 2019, 12, 60. [Google Scholar] [CrossRef]
- Yi, S.; Jang, Y.-C.; An, A. Potential for energy recovery and greenhouse gas reduction through waste-to-energy technologies. J. Clean. Prod. 2018, 176, 503–511. [Google Scholar] [CrossRef]
- DB44/T 1461-2021; Norm of Water Intake. Standards Press of China: Guangzhou, China, 2021. (In Chinese)
- GB/T 2589-2020; General Rules for Calculation of the Comprehensive Energy Consumption. Standards Press of China: Beijing, China, 2020. (In Chinese)
- Meng, F.; Liu, G.; Liang, S.; Su, M.; Yang, Z. Critical review of the energy-water-carbon nexus in cities. Energy 2019, 171, 1017–1032. [Google Scholar] [CrossRef]
- Timo, K.; Mika, K.; Timo, S.; Laurens, C. Firm and industry level profit efficiency analysis using absolute and uniform shadow prices. European. J. Oper. Res. 2010, 202, 584–594. [Google Scholar]
- Moslehi, M.H.; Zadeh, M.S.; Nateq, K.; Shahamat, Y.D.; Khan, N.A.; Nasseh, N. Statistical computational optimization approach for photocatalytic-ozonation decontamination of metronidazole in aqueous media using CuFe2O4/SiO2/ZnO nanocomposite. Environ. Res. 2024, 242, 117747. [Google Scholar] [CrossRef] [PubMed]
Disclaimer/Publisher’s Note: The statements, opinions and data contained in all publications are solely those of the individual author(s) and contributor(s) and not of MDPI and/or the editor(s). MDPI and/or the editor(s) disclaim responsibility for any injury to people or property resulting from any ideas, methods, instructions or products referred to in the content. |
© 2024 by the authors. Licensee MDPI, Basel, Switzerland. This article is an open access article distributed under the terms and conditions of the Creative Commons Attribution (CC BY) license (https://creativecommons.org/licenses/by/4.0/).