Article

Characteristics and Impact Evaluation of Hydrological and Water Quality Changes in the Northern Plain of Cixi, Eastern China, from 2010 to 2022

1
School of Water Resources, Zhejiang Tongji Vocational College of Science and Technology, Hangzhou 311231, China
2
School of Marxism, Zhejiang Tongji Vocational College of Science and Technology, Hangzhou 311231, China
3
School of Computer Science and Technology, Hangzhou Dianzi University, Hangzhou 310018, China
*
Author to whom correspondence should be addressed.
Water 2024, 16(3), 489; https://doi.org/10.3390/w16030489
Submission received: 5 December 2023 / Revised: 22 January 2024 / Accepted: 29 January 2024 / Published: 2 February 2024
(This article belongs to the Special Issue Groundwater Quality and Human Health Risk)

Abstract

:
This paper analyzes the spatiotemporal changes and patterns of a regional water environment based on the hydrological and water quality monitoring times and the geographical locations of the monitoring sections in the research area, the plain of Cixi, eastern China. Based on the calculation of runoff generation and concentration in the coastal plain river network and based on the characteristics and impact evaluation of the regional water pollution, the migration and diffusion mechanisms of surface water pollutants were studied for different sources and characteristics of pollutants entering the river in different river sections. The analytic results show that the water environment and water resource security of the coastal plain mainly cause the problem of eutrophication in the water bodies, and the input of nitrogen and phosphorus from land sources is the main cause of eutrophication in the water bodies, mainly including the production and discharge of domestic sewage, nutrient loss in aquaculture water bodies, affecting agricultural activities, etc. The evaluation also demonstrates that with the development of coastal zones and the rapid development of coastal towns, as the population in coastal plain areas continues to increase, industrial development and population growth are the main driving factors for water quality changes.

1. Introduction

In the past 13 years, the study area experienced rapid economic development, a rapid increase in population, and a sharp rise in water consumption for industrial and urban life. Reservoirs that used to be used for irrigation have become the sources of water for urban and industrial life. Coupled with the economic development, wastewater has not been treated adequately, which has directly led to the serious pollution of river water bodies. Water pollution reduces the uses of water and makes the gap between the supply and demand of water resources more prominent, and the shortage of available water has become a bottleneck restricting the sustainable development of regional industry and agriculture [1,2]. In order to ensure the sustainable development of society and economy, in recent years, reservoir water diversion projects and inter-basin water diversion projects have been implemented in all parts of China’s coastal plain, which have effectively alleviated the gap between the supply and demand of water resources but have not completely solved the problems of water shortage and water quality deterioration [3,4].
Currently, the research on water environment conditions in plains focuses on the following aspects: water quality, aquatic biodiversity, water environment capacity, and water environment risk assessment [5,6,7]. In terms of research methods, a combination of field surveys, laboratory analyses, and model simulations are commonly used. By collecting water samples and analyzing their physical and chemical indicators, nutrients, heavy metals and other pollutant content, the water quality can be understood [8,9,10,11,12,13]. At the same time, using biological monitoring methods to evaluate the species, quantity, and health status of aquatic organisms can reflect the environmental water quality. Additionally, through the establishment of water environmental capacity models and risk assessment models, the water environmental capacity and potential risks in plains can be quantitatively analyzed [14,15,16,17,18].
Studies have shown that the water quality in the plains of China has been generally poor in the past 30 years, mainly due to industrial wastewater, agricultural sewage, and domestic sewage. In particular, heavy metals, pesticides and other toxic substances in industrial wastewater have a significant impact on water quality [19,20,21]. Due to the decline in water quality, the biodiversity of aquatic organisms in the plains is threatened. Many aquatic organisms have decreased in number and are even endangered. The water environment capacity in the plains is relatively small, with a limited carrying capacity for pollutants. In the context of rapid industrialization and agricultural development, the self-purification capacity of the water environment has been exceeded. Studies have found that the water environment risk in plains is relatively high, mainly from various pollutants generated by industrial and agricultural productions and urbanization processes [22,23].
The plain water environment is facing severe challenges, and in order to improve the situation, it is necessary to take a multi-faceted approach, including strengthening pollution control and supervision, ecological restoration and protection, and water resource planning and management. In coastal plain river networks, both the total amount of pollution discharge and the quality of the environment are in a state of high pollution. In order to avoid the unreasonable dilution of wastewater caused by pollutant concentration control and effectively reduce regional pollution control costs, it is necessary to control and manage the total amount of pollutant discharge of various pollution sources in the region according to the quality objectives of the water environment.
Based on the principles of hydrology and hydrodynamics, and on the basis of a comprehensive analysis of the characteristics of the river network in the coastal plain of Cixi City and a large amount of basic data, the data of river lakes, river channel connections and various control sections in the basin plain were collected, and the data of various environmental aspects, including water supply, water use, water consumption, drainage, water level changes, river discharge, river velocity and water quality indicators in the basin, were integrated and analyzed. Based on a time series method, the spatial and temporal distribution characteristics of typical pollutants in the surface water of coastal plains under a multi-source input environment were studied, and a driving force analysis was then carried out.

2. Study Area and Data Description

2.1. Study Area

The study area was in the north of Ningbo City, Zhejiang Province, China, on the south bank of the Qiantang River estuary, with geographical coordinates between a latitude of 30°2′~30°21′ N and longitude of 121°2′~121°38′ E. The total area was 874 km2, and the plain terrain is high in the west and low in the east. As it is located in the monsoon climate zone of the southern edge of a subtropical zone, the climate is warm and humid with abundant rainfall, four distinct seasons, and an annual average temperature of 17.1 °C. The annual average evaporation of surface water is 820 mm, the annual average precipitation is 1361 mm, the daily maximum precipitation is 196 mm, and the monthly maximum precipitation is 619 mm. The per capita water resource possession is 578 m3, only 1/5 of China’s per capita water resources, which belongs to a region with a serious shortage of per capita water resources. The economy of this region is developed, the population is large, and the land is small. The plain area lacks big rivers, and the capacity of regulation and storage is poor. At present, the shortage of freshwater resources and the deterioration of the water environment have become bottlenecks restricting regional development.

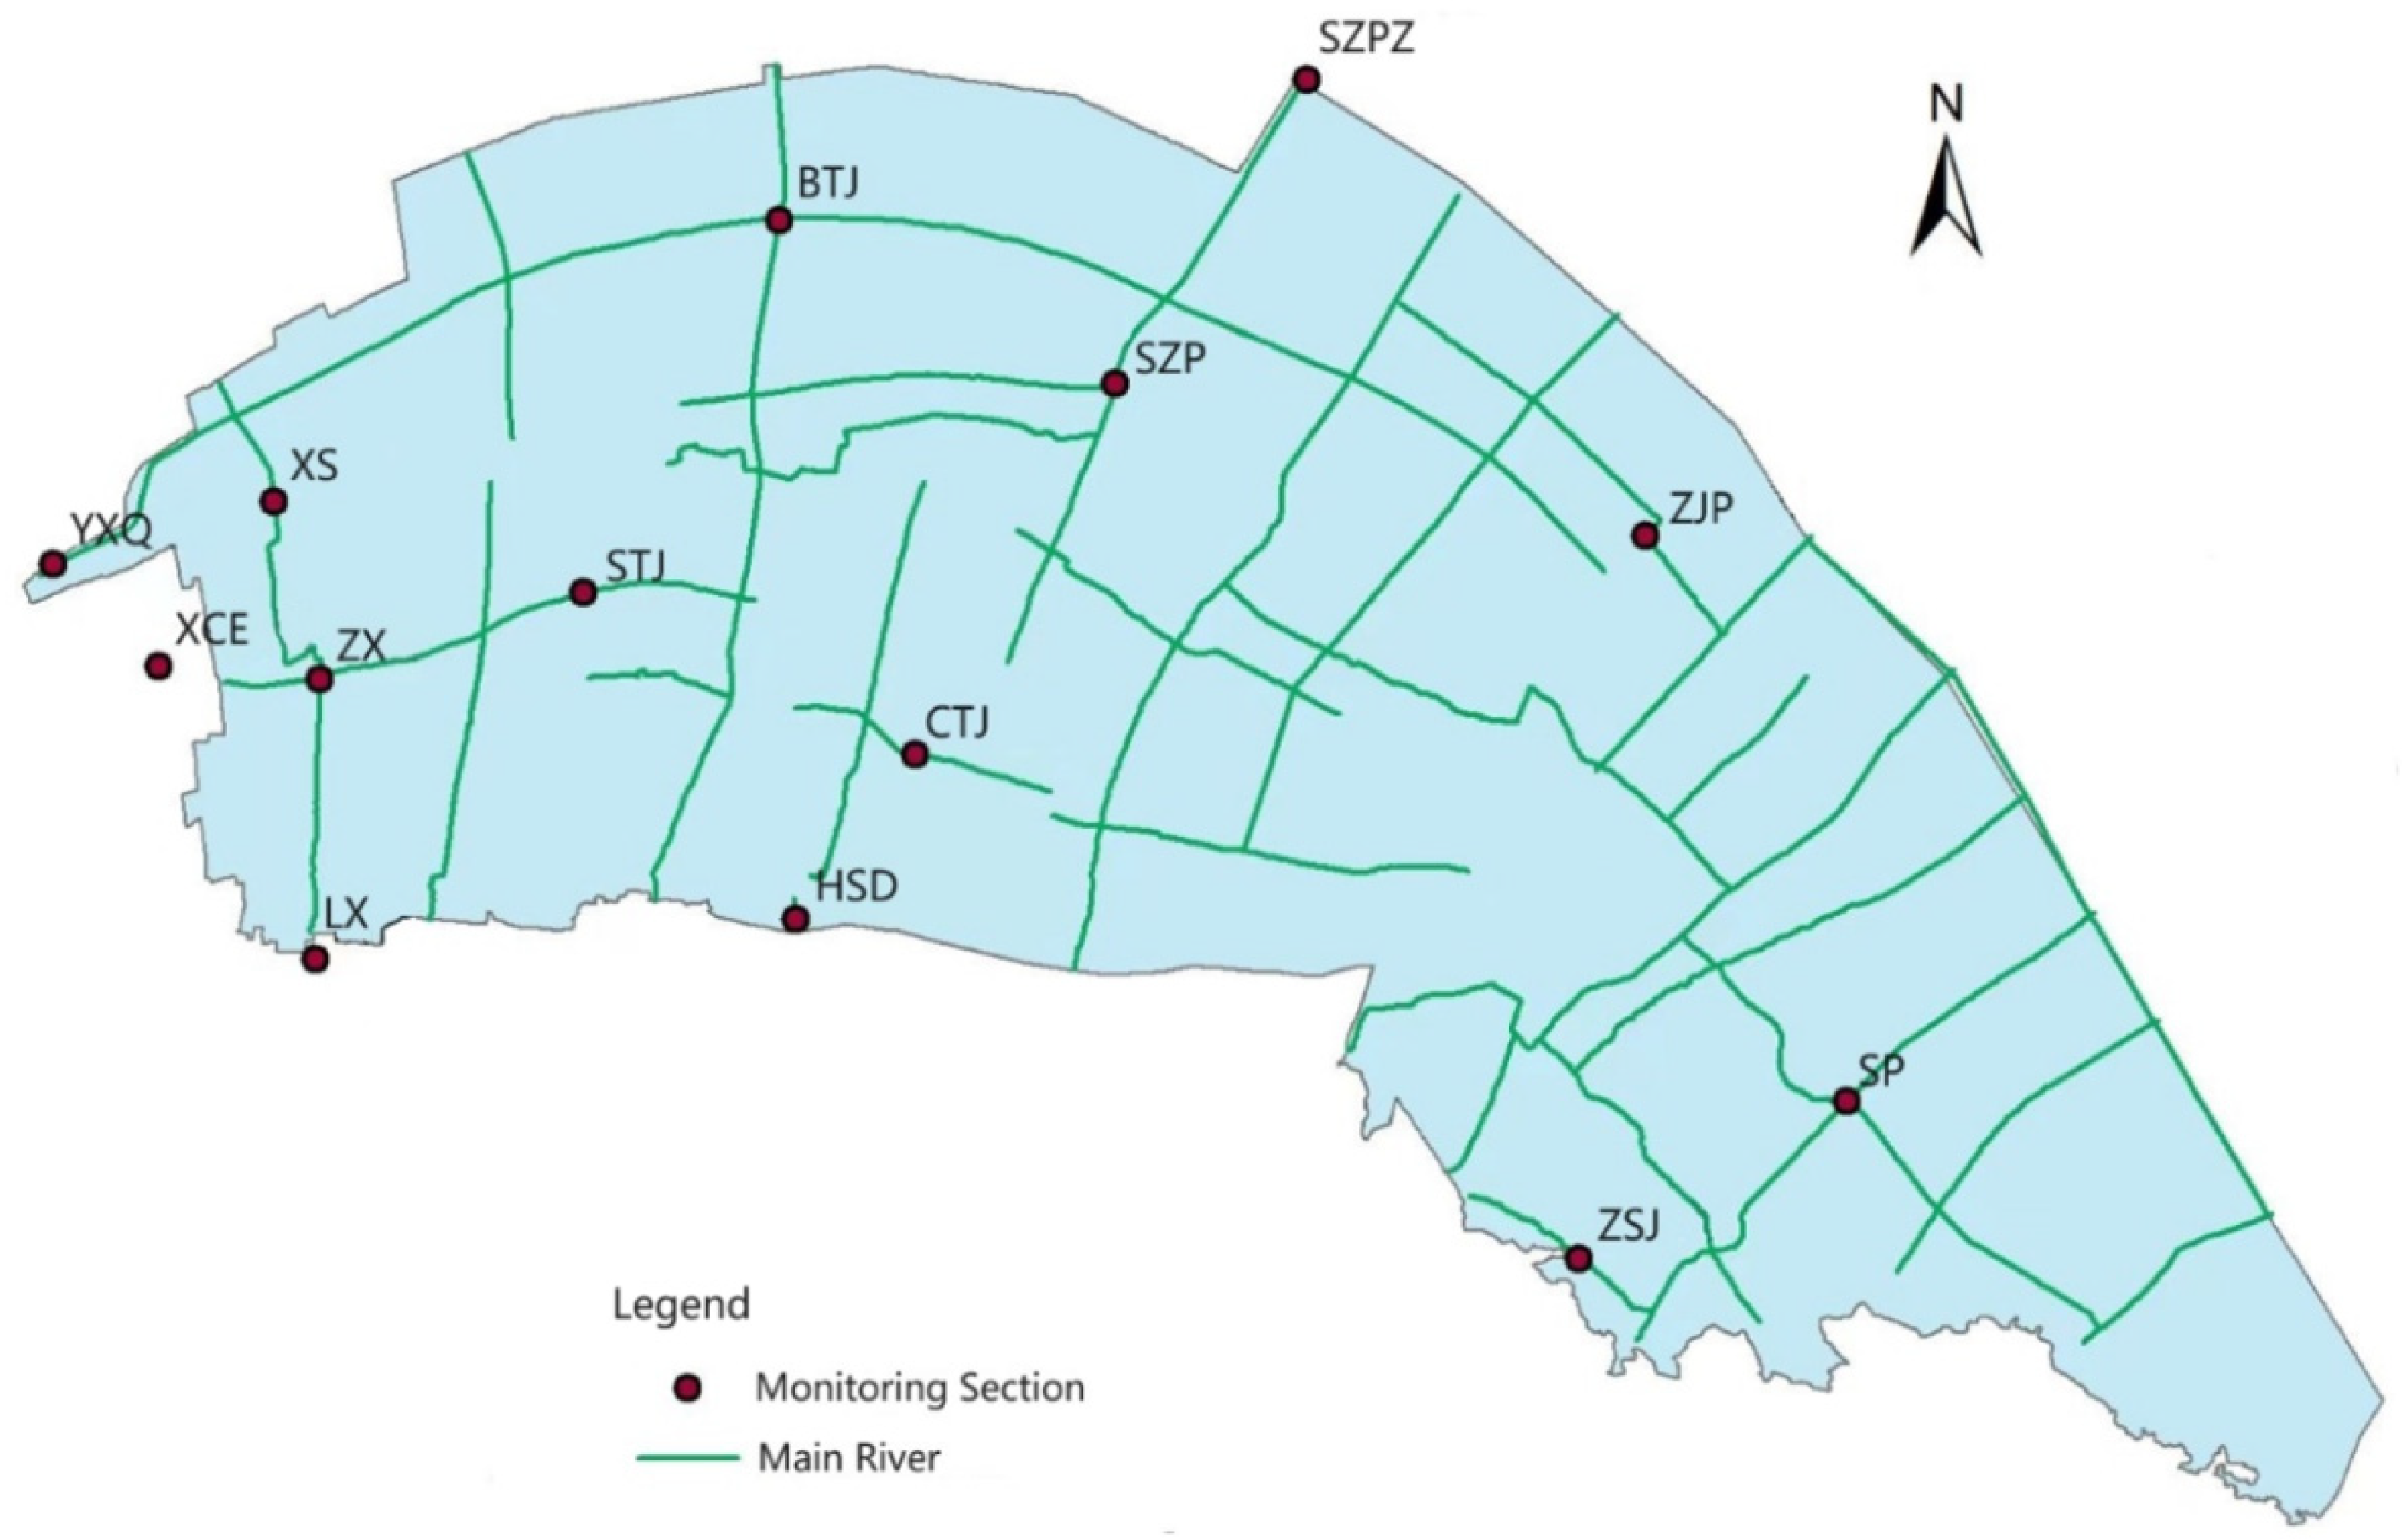
2.2. River Network and Water System

As the terrain of Cixi is high in the west and low in the east, the territory has four major drainages from east to west, the East River, Middle River, West River and Northwest River, which drain north into Hangzhou Bay. The characteristic water levels of each water system are shown in Table 1, and the river division of the northern plain of Cixi, where the study area is located, is shown in Figure 1.
Inland waters account for about one-tenth of the region’s total area. There are 73 long river channels, 770 km long; the slope of the riverbed is gentle, and the average water depth is 1.2~1.4 m. Most of the north–south rivers flow into the sea, and the normal water storage capacity is 3776 million m3. Due to the lack of stable inflow water sources in the study area, the water storage in the river channel is mainly replenished by rainfall, as well as by the sewage discharged by surrounding factories and residential areas, and some of the river channels receive secondary wastewater discharged by sewage treatment plants.

2.3. Water Environment Monitoring Points and Monitoring Indicators

The water flow of the river network is poor, the self-purification ability is weak, the ecological flow of the river is small, the shoreline is hard, the carrying capacity of the water environment is beyond the limit, and the water ecosystem is very fragile. The main pollution factors are dissolved oxygen, permanganate index, ammonia nitrogen, total phosphorus and so on. There are 14 environmental surface water quality monitoring sections in the study area (monitoring once every two months), and the monitoring data can reflect the characteristics of the environmental surface water quality in the study area. The location of the monitoring section is shown in Figure 2, and Table 2 shows the basic information about the sections.
From January 2010 to December 2020, the water quality of the monitoring sites was continuously monitored, and the monitoring indicators included 24 basic items: water temperature, pH value, dissolved oxygen, permanganate index, chemical oxygen demand (COD), five-day biochemical oxygen demand (BOD5), ammonia nitrogen (NH3-N), total phosphorus, total nitrogen, copper, zinc, fluoride, selenium, arsenic, mercury, cadmium, chromium (hexavalent), lead, cyanide, volatile phenols, petroleum, anionic surfactants, sulfides and fecal coliforms. The water quality monitoring experiment required the water sample to settle naturally for 30 min after collection, and the non-settling part of the upper layer was taken for analysis. The test was carried out according to the method specified in the “Surface Water Environmental Quality Standard” (National Standard GB3838-2002 [24] of the People’s Republic of China).
In order to reflect the seasonal differences in surface water quality, the whole monitoring period was divided into a wet period and dry period according to the amount of precipitation. The period from April to October is wet, and the period from November to March is dry. The relationship between water quality data at each monitoring point is not intuitive, and the relationships between the regional concentration distribution, concentration distribution between different pollutants, concentration distribution and distance, and concentration distribution between different seasons cannot be directly obtained. Therefore, it is necessary to analyze the quality characteristics of river water bodies.

3. Simulation of River Network Runoff and Confluence

The rainfall in flood season is the main way to replenish the water quantity of the plain river network; the flood season in the study area lasted for 6 months (from 15 April to 15 October). The rainfall data of the study area from 1956 to 2022 were obtained through an interpolation extension of the participating rain measuring stations. When calculating the frequency of heavy rain, a Tyson polygon was first made according to the distribution locations of the rain measuring stations according to the engineering hydrology calculation method, and the daily area rainfall of the study area was calculated using the weighted average area. Then, the annual maximum area rainfall series of 1, 3 and 7 days was obtained by taking 1 and 3 days as the statistical period, and a suitable line was adopted using a Pearson type III curve. The 1-day, 3-day and 7-day area rainfalls of each river area under various design frequencies were obtained. The calculation results are shown in Table 3.
The flood calculation included flood zoning, a flow production calculation and a confluence calculation. The runoff production zones were divided according to the rainfall characteristics and underlying surface characteristics of the basin, and then the runoff production was calculated according to the conditions of each runoff production zone using the design rainstorm process [25].

3.1. Calculation of Runoff Yield

According to the different conditions of the underlying surface, flood control division and administrative division, the basin was divided into 7 flood calculation units. According to the actual situation of the underlying surface, the basin can be divided into four types of underlying surface: water surface, town, paddy field and dry land and non-cultivated land. According to the water balance equation, the water yield of the water surface was derived from the rainfall minus evaporation. The irrigation and drainage amount of the paddy fields were calculated by considering the water demand depth, water consumption coefficient and irrigation and drainage methods of different growing stages of crops. The net rain of dry land and non-cultivated land was calculated using the Xin’an River model. The urban area was divided into impervious area and pervious area. The impervious area was deducted from the water storage and evaporation in the depression by rainfall, and the remaining part was all surface runoff. The pervious area was calculated according to the Xin’an River model. The calculation results of current production under different design frequencies are shown in Table 4.

3.2. Flow Concentration in River Network

The study area was plain, and the confluence calculation was for river network confluence. However, the southern part of the Middle River area and the southern part of the East River area receive water from the upper mountain area, so it was necessary to calculate the slope confluence as the boundary condition. Since the catchment area in mountainous areas is less than 50 km2, the calculation of catchment in mountainous areas adopts the inference formula method of Zhejiang Province. There are reservoirs in some areas; the process of confluence was calculated through the reservoir flood adjustment calculation; the process of reservoir discharge was calculated, and then using the Muskingun method of river confluence calculation, the flood flow into the plain area was obtained. The calculation results of confluence in the southern mountainous area are shown in Table 5.
The inference formula is as follows:
Q m = 0.278 F h τ τ τ = 0.278 L m J 1 / 3 Q 1 / 4 .
where the variables are denoted as follows:
F—water collection area, unit: km2;
L—main stream length, unit: km;
J—main stream slope;
τ—concentration duration, unit: h;
m—confluence coefficient;
hτ—net rain depth, unit: mm;
Qm—peak flood flow, unit: m3/s.
Rainfall is the most important way to replenish the river water quantity and improve water quality in the plain river network area. Heavy rainfall has great influence on the nitrogen and phosphorus pollution content. Generally, after the occurrence of heavy rainfall, due to the effect of surface erosion, the concentrations of nitrogen and phosphorus in the water body of the plain river network will increase. The smaller the basin area, the shorter the flow, and the faster the response speed. However, due to the heavy rainfall at the same time introducing a large amount of water into the river, the concentrations of some pollutants will be reduced from an overall point of view; the concentration fluctuation is not obvious. The response characteristics of surface water to flood are also affected by the type and distribution of land use on both sides of the river. Therefore, the results of the flood calculation and the constant water level of the plain river network should be taken as the boundary conditions for the input of river water.

4. Characteristics of Environmental River Water Quality

The statistical analysis of the environmental water quality data of each monitoring section shows that the PH value and heavy metals are rarely the factors affecting water quality. Throughout the monitoring period, the PH value of the site was mostly distributed between 6 and 9; the minimum value was 6.5, and the frequency of the PH value above 7 was 97.4%. The excesses of total phosphorus and five-day BOD are the most important factors affecting water quality in every region. From an overall point of view on the distribution, the factors affecting water quality mainly concern the dissolved oxygen, permanganate index, chemical oxygen demand, five-day biochemical oxygen demand, ammonia nitrogen, total phosphorus, petroleum and fecal Escherichia coli, which need to be focused on during treatment.
In accordance with the “Environmental quality standards for surface water” (National standard GB3838-2002 of the People’s Republic of China [24]), according to the environmental functions and protection objectives of surface waters, the water quality was divided into Classes I, II, III, IV and V from good to bad according to the functional level, and the classification standard limits are defined in the national standard.

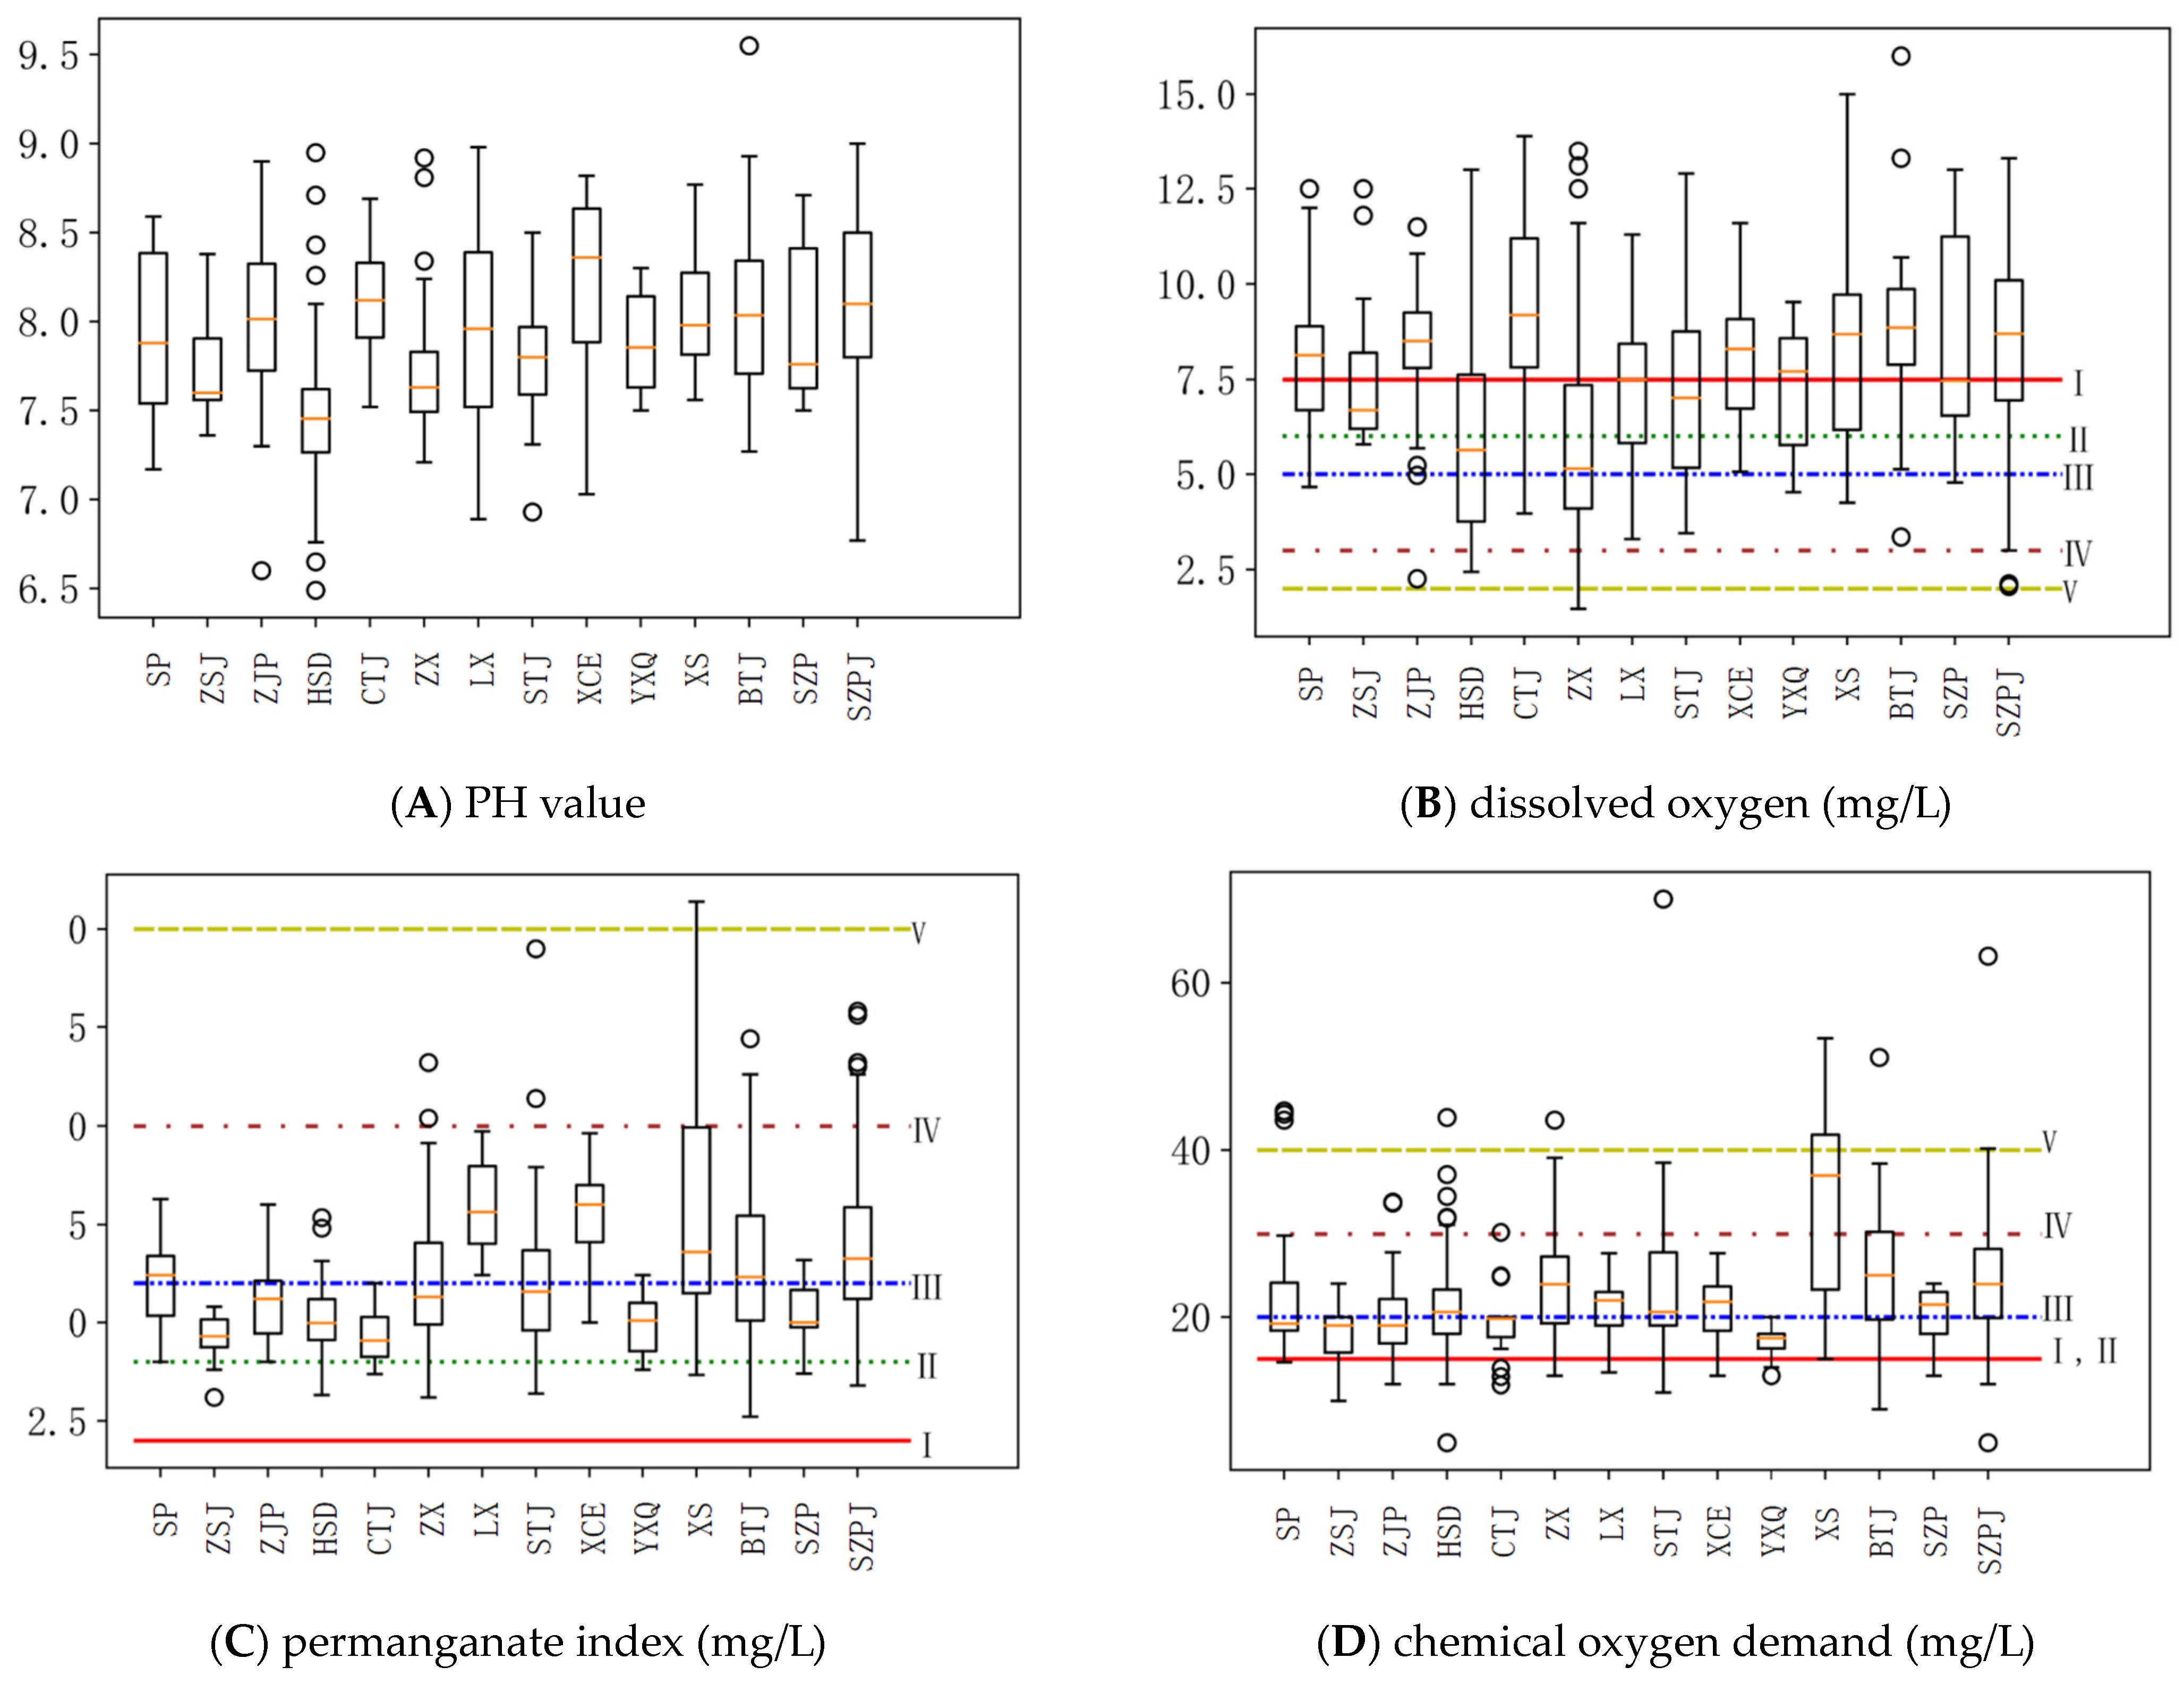
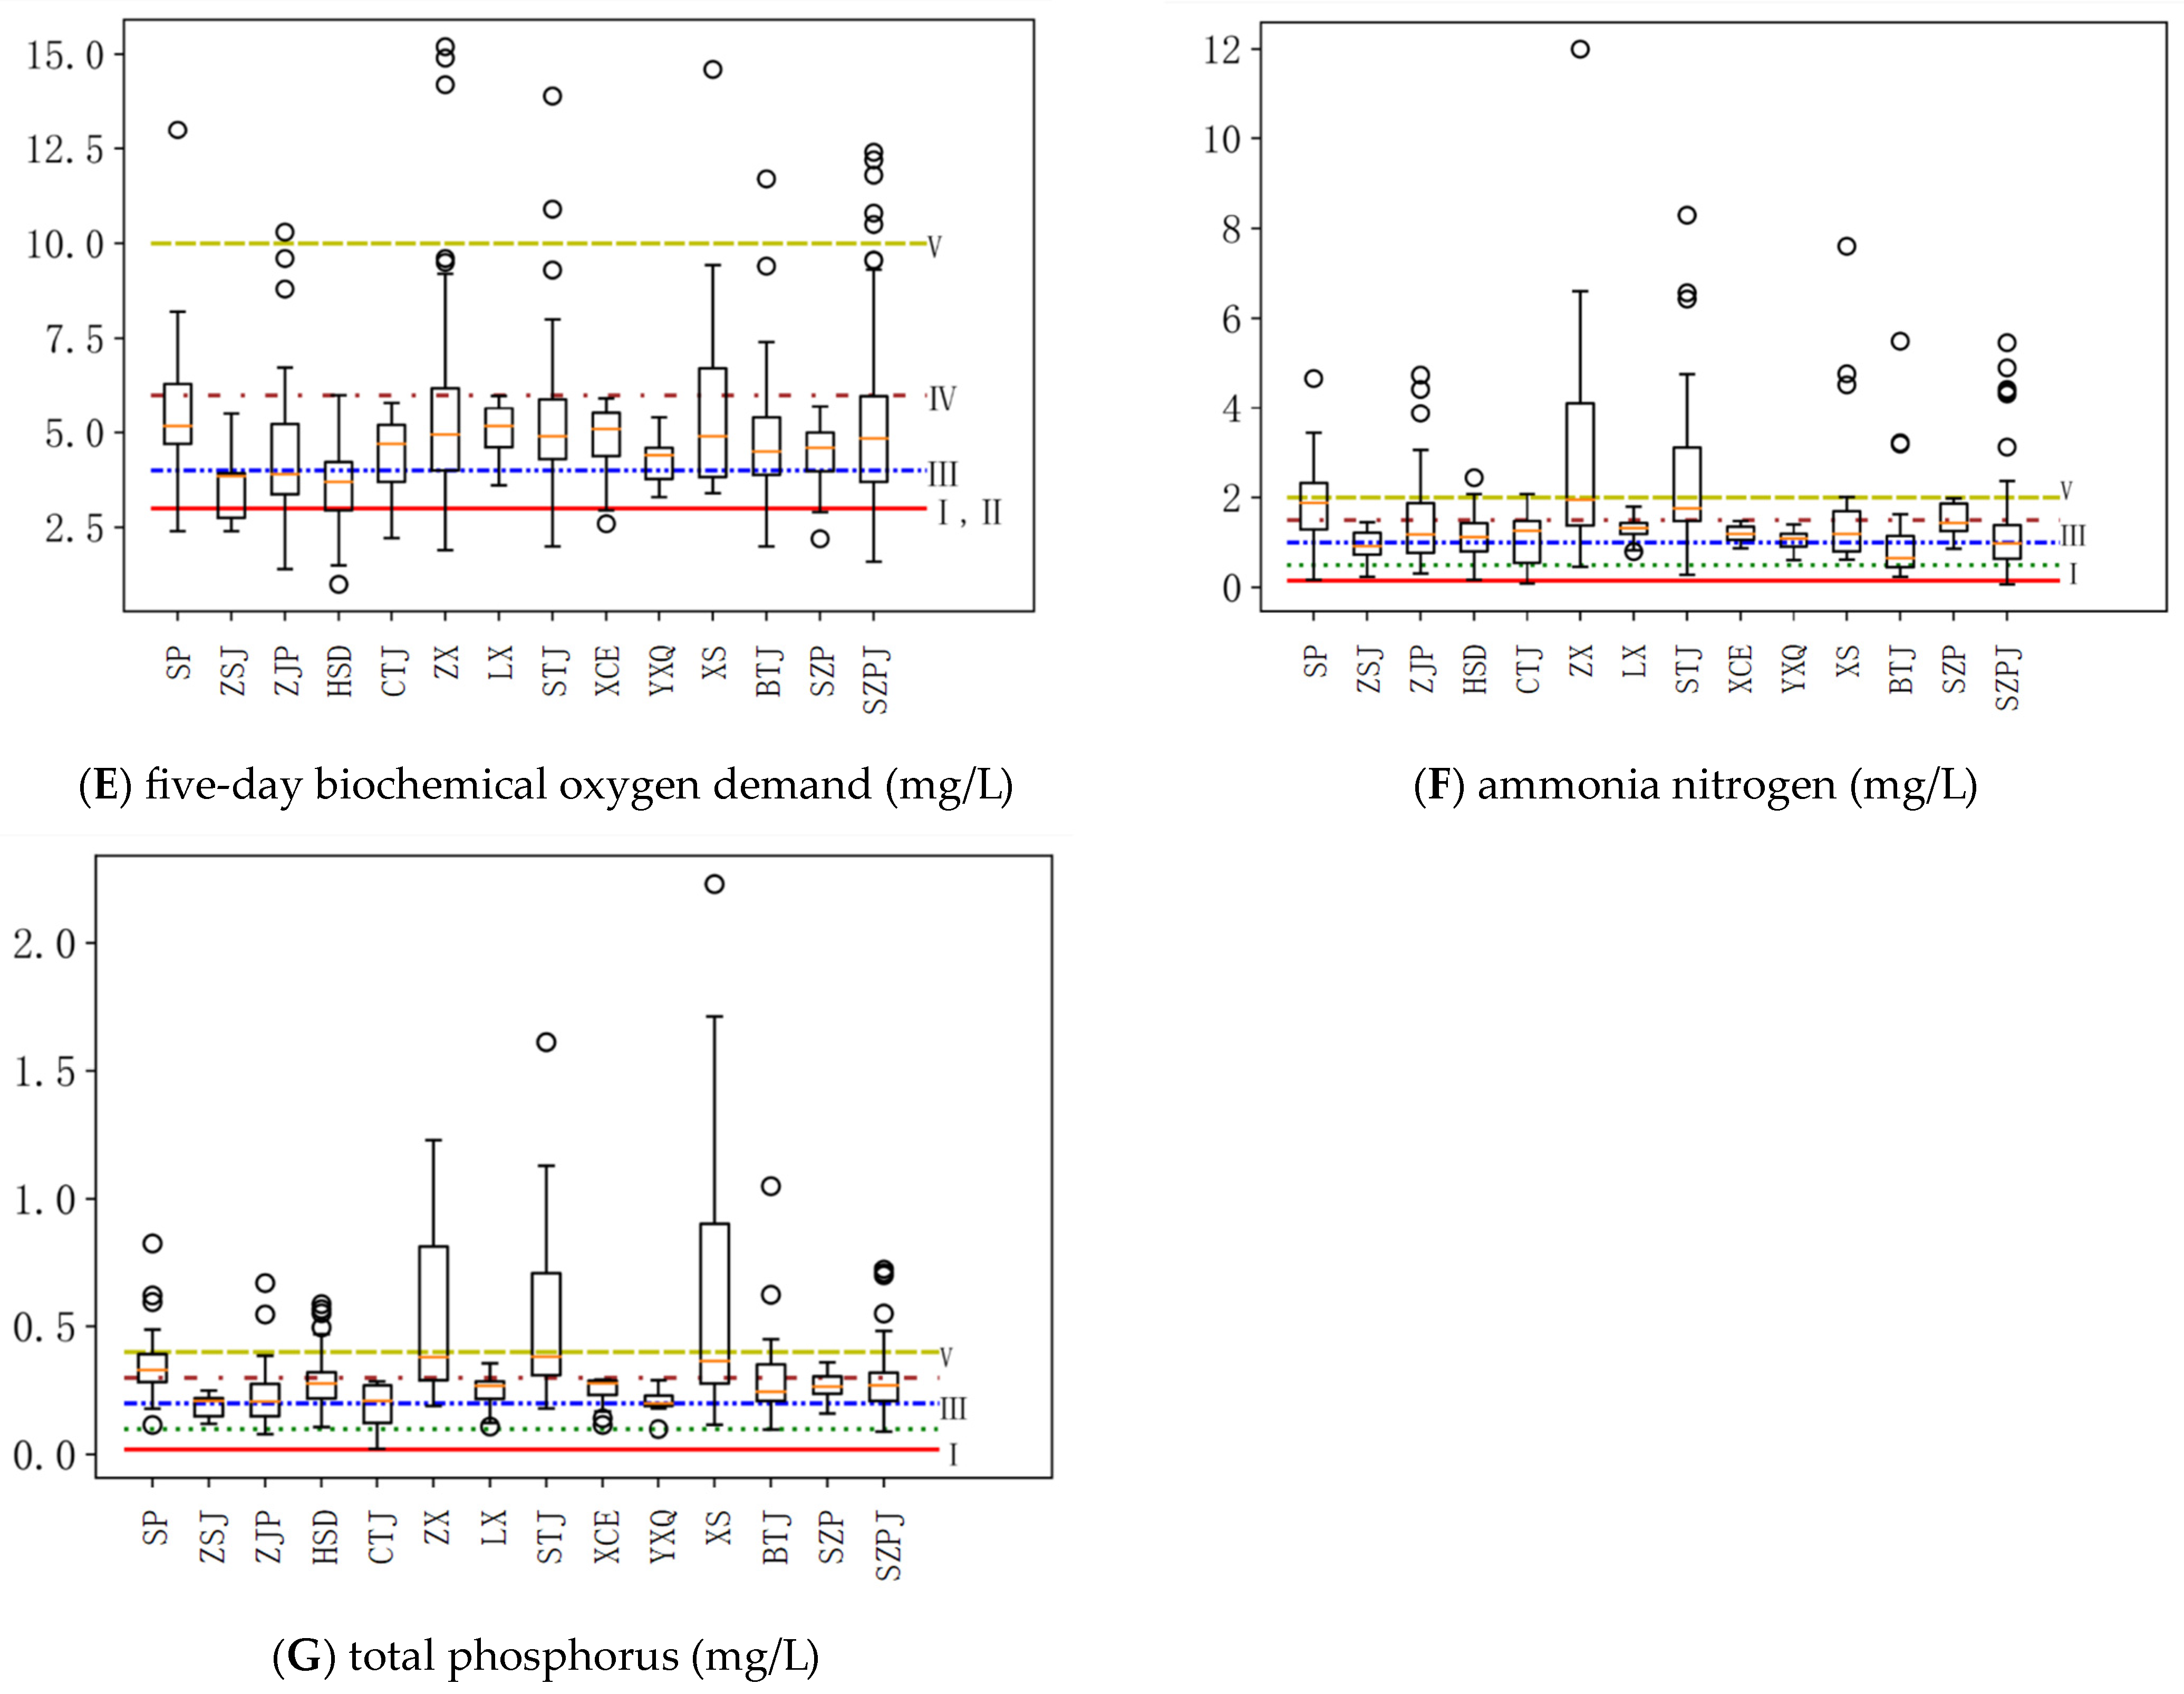
4.1. The Spatial Difference of River Water Quality

The seven indexes of pH value, dissolved oxygen, permanganate index, chemical oxygen demand, five-day biochemical oxygen demand, ammonia nitrogen and total phosphorus of each station in different months were statistically analyzed, and the mass concentration distributions of the seven water quality parameters of 14 water quality stations were studied. The results are shown in Figure 3A–G.
Because they are located in the reclamation area of the south bank of Hangzhou Bay, the PH values of the 14 sites were all within the standard range of 7–9, and the median value was greater than 7.5, showing weak alkalinity in general. In terms of dissolved oxygen index, three sites, ZJP, CTJ and BTJ, performed well; their first quartiles (Q1s) were all greater than 7.5 mg/L, and the probability of these three sections belonging to Class I water was greater than 75%. The median values of the ZX and HSD sites were close to 5 mg/L, and their probability of belonging to Class IV was close to 50%. There were also cases of Class V water or even inferior Class V water in the ZX section. The dissolved oxygen index of the other sites basically belonged to Classes I, II and III. The distribution of the dissolved oxygen index in the river area was not obvious.
Under the permanganate index, the water quality of the XS section in the Northwest River Region was the worst, and the probability of the occurrence of Class V and poor V indexes is about 25%. Most of the other sections belonged to Class III and IV water, and there were no Class I sites. In terms of the chemical oxygen demand index, the water quality of the XS section was still the worst, and the probability of Class V and poor V was greater than 60%. The three sections of ZSJ, CTJ and YXQ were better than Class III water, among which, the probability of ZSJ belonging to Class I water was close to 25%, and most of the other sites belonged to Class III and IV.
Overall, the more serious indicators of pollution were the five-day biochemical oxygen demand, ammonia nitrogen and total phosphorus. Under the five-day BOD index, the water qualities of the ZSJ and HSD sections were more than 70% better than that of Class III, and the probability of exceeding Class I standards was more than 25%, while the water qualities of the remaining sites were more than 70% and belonged to Class IV, of which the probability of Class V appearing in the XS section was about 30%. Under the index of ammonia nitrogen, there were no sites of Class I, among which, the four sections of ZSJ, XCE, YXQ and BTJ with good water quality belonged to Class III and Class IV, while the other sites all belonged to Class V or poor V, and the probability of belonging to Class V for the three sections of SP, ZX and STJ with the worst water quality was about 70%. Under the total phosphorus index, there were almost no sites of Class I or II. Except for the four sections of ZSJ, CTJ, XCE and YXQ, the other sites all belonged to Class V or inferior V, among which, the worst ones were SP, ZX, STJ and XS, for which their probability of belonging to Class V was more than 75%.
Overall, among the 14 stations, XS in the Northwest River Drainage, SP in the East River Drainage, and ZX and STJ in the south of the West River Drainage had the worst water quality. ZSJ in East River Drainage had the best water quality, followed by CTJ in the Middle River Drainage and YXQ in the Northwest River Drainage. Based on each index, different river areas had better performances and worse performances, and the above figure does not observe the advantages and disadvantages.

4.2. The Time Difference of River Water Quality

The average annual situation of pollutants in five river drainages was studied, and the results show that most of the water quality indexes fluctuated year by year, but the range of change was small, and the water quality showed a good trend on the whole, but the total phosphorus index remained basically unchanged.
In addition to the inter-annual change, the water quality index is also affected by temperature and water intake during the year, resulting in the increase or dilution of pollutants and the change in the degradation coefficient. According to the hydrological conditions, the water quality index of the study area was divided into dry season (November to March next year) and wet season (April to October). Comparisons of the dissolved oxygen, permanganate index, chemical oxygen demand, five-day biochemical oxygen demand, ammonia nitrogen and total phosphorus indexes in the five drainage areas during the dry and wet seasons are shown in Figure 4.
The overall analysis showed that the 5-day BOD and total phosphorus decreased in the dry season, and the ammonia nitrogen increased in the dry season. The dissolved oxygen increased in the dry season in the East River area, the Middle River area and the Northwest River area, while the dissolved oxygen decreased in the south and north of the West River area. The permanganate index of the South of West Rived district increased in the dry season, while that of the other four drainage decreased in the dry season. The chemical oxygen demand in the East River area and the South of West River area increased in the dry season, while the dissolved oxygen in other river areas decreased in the dry season.

5. Investigation and Driving Force Analysis of Regional Water Pollution Load

5.1. Survey of Pollution Sources

The coastal plain river network is in a state of high pollution, both in terms of the total amount of pollution discharged and the quality of the environment. As the current calculation standards for the total amount of pollutants and basin capacity are not clear, the calculation methods and total-amount index allocation should fully consider the differences in environment and resources among regions and be used to conduct adequate investigations and analyses, as well as carry out total-amount control according to regional conditions. At the same time, in order to avoid unreasonable wastewater dilution caused by pollutant concentration control and effectively reduce regional pollution control costs, it is necessary to control and manage the total pollutant discharge of various pollution sources in the region according to the quality objectives of the water environment. Because ammonia nitrogen is the most serious factor in the pollution ratio of the river network in the study area, this paper takes ammonia nitrogen as an example to analyze the pollution load.
According to the data provided by “Ningbo Water Resources Bulletin”, “Ningbo National Economic and Social Development Statistical Bulletin”, “Cixi surface water quality monitoring report” and “Cixi water environment monitoring report”, relevant technical standards and research results were used to calculate pollution sources. The main sources of pollution into the river include industrial pollution, agricultural pollution, livestock pollution, domestic pollution, surface runoff and internal source pollution. The statistics of river sewage discharge in the study area in 2021 are shown in Table 6.
(a)
Domestic pollutant
According to the “Notification on the work of Rural Domestic sewage treatment in the first quarter of 2021”, the coverage rate of rural domestic sewage treatment in the city is only 30.41%. The basic conditions of some areas are poor, the coverage of the sewage branch pipe network is low, and the sewage generated by farmers’ markets and construction sites cannot be managed. There are still problems such as the high breakage rate of old underground pipe networks in cities and towns, slow elimination process of sewage interception canals in river channels, inadequate transformation of wastewater from balconies in old residential areas, rain and pollution diversion, sewage interception and incomplete management. Shops along the street are not in place, and the sewage generated in areas not covered by urban drainage facilities is difficult to collect and treat, and a large amount of sewage seeps into the ground or flows into the surrounding river. Some farmers’ markets have not yet been treated; rain and pollution diversion and pollution interception and management are not complete, and some have not even carried out rain and pollution diversion transformations, once all rain pollutants enter the river.
The domestic pollutants in this calculation include urban and rural domestic sewage and pollutants in sewage produced by service industries and urban public industries. The amount of domestic pollutant ammonia nitrogen in the river was calculated according to the following formula:
W D = ( W D P θ 1 ) × α 1 × β 1
where the variables are denoted as follows:
W D —the amount of domestic pollutants in the river;
W D P —total amount of domestic pollutants discharged into the environment, information provided by the Environmental Protection Agency;
θ 1 —the amount of pollutants discharged into the river network by the sewage treatment plant, according to the actual treatment volume of the sewage treatment plant, proportion of domestic sewage, effluent quality and receiving sewage area, determined after statistical analysis;
α 1 —proportion of domestic pollutants discharged into inland rivers;
β 1 —the coefficient of pollutants entering the river is based on the difference between town and country, the type of drainage pipe and the distance from the river.
The annual discharge of domestic sewage into the river was 89.26 million tons, and the calculated ammonia nitrogen pollution in the river was 4075 tons.
(b)
Industrial pollution
By 2021, there will be a large number of small enterprises in the region (152,000 registered enterprises, 31,100 enterprises involved in environmental pollution industries). The distribution of industrial enterprises is scattered, the unified management rate of industrial parks is only 20%, and there are problems of wide drainage area and difficult supervision.
The amount of ammonia nitrogen in the river from industrial pollutants is calculated as follows:
W I = ( W I P θ 2 ) × α 2 × β 2
where the variables are denoted as follows:
W I —the amount of industrial pollutants entering the river;
W I P —total amount of industrial pollutants discharged into the environment, information provided by the Environmental Protection Agency;
θ 2 —the amount of pollutants entering the river network after treatment by the sewage treatment plant, determined by the statistical analysis of the actual treated water volume of the existing sewage treatment plant, the proportion of industrial sewage, the effluent quality and the area where the sewage is collected;
α 2 —the proportion of industrial pollutants discharged into inland rivers;
β 2 —the coefficient of pollutant entering the river is determined by the type of drainage pipe and the distance from the river.
The discharge of industrial wastewater into the river was 22.71 million tons, and the ammonia nitrogen pollution into the river was 279 tons by calculation.
(c)
Livestock and poultry breeding sewage
The amount of livestock and poultry breeding pollutants entering the river is calculated using the following formula:
W B = W B p × β 3
where the variables are denoted as follows:
W B —the amount of pollutants from livestock and poultry breeding in the river;
W B p —the total amount of pollutants discharged from livestock and poultry breeding;
β 3 —coefficient of pollutant entering the river is calculated according to the types, quantity and pollution production coefficient of livestock and poultry in each zone, between 0.6~0.9.
The discharge of livestock and poultry breeding sewage in the river was 1.57 million tons, and the calculated amount of ammonia nitrogen pollution in the river is 658 tons.
(d)
Agricultural non-point source pollution
Agricultural non-point source pollution mainly comes from agricultural fertilizers and pesticides. At present, due to the lack of scientific and technical guidance, agricultural planting causes losses of fertilizers and pesticides, which are washed into rivers with surface runoff and rainwater, and become one of the most important sources of water pollution. The formula for calculating the losses of pesticide and fertilizer pollutants is as follows:
W A = M × γ 1 × α 4 × β 4
where the variables are denoted as follows:
W A —amount of farmland pollutants entering the river;
M —standard farmland area;
γ 1 —non-standard field correction factor;
α 4 —standard farmland pollutant discharge coefficient;
β 4 —coefficient of farmland pollutants entering the river.
Standard farmland refers to the plain and wheat crops; the soil type is loam, and the fertilizer application amount is 25–35 kg/mu·year, with precipitation in the range of 400–800 mm farmland. The source intensity coefficient of standard farmland is 2 kg/mu·year of ammonia nitrogen. For other fields, the corresponding source intensity coefficient needs to be corrected according to the slope, crop type, soil type, fertilizer application amount and precipitation.
The data of agricultural land areas and fertilizer application amounts were obtained from a statistical yearbook, the land use planning of each district, etc. According to the actual situation of farmland in each block, the amount of ammonia nitrogen pollution from agricultural non-point source into the river was calculated to be 1800 tons.
(e)
Surface runoff pollutant
All kinds of surface pollutants enter the river system with rainfall runoff, resulting in surface runoff pollution. At present, urban surface runoff pollution control is not strong. A large number of pollutants such as living sources, industrial sources, agricultural sources and traffic sources adhere to road surfaces, roofs, vegetation, squares and other sites on sunny days. In rainy days, especially during heavy rains, they flow into the surrounding river with surface runoff, seriously affecting the water quality of the river. The formula for calculating the amount of pollutant entering the river is as follows:
W S = A S × P × r × C
where the variables are denoted as follows:
W S —pollutant quantity of surface runoff in the river;
A s —the area of the underlying surface;
P—net annual rainfall;
r—runoff coefficient;
C—average pollutant concentration of rainwater on different underlying surfaces.
The sources of urban surface runoff pollutants are divided into three parts: the first is surface sediment, the second is combined drainage pipe sediment, and the third is natural rainwater pollutants. The sediment of the drainage pipe is mainly from the urban sewage, mainly organic particles, but also contains the large particle size residue and organic solid matter in the kitchen and domestic waste. Sewage is inevitably deposited in the pipeline system. During rainfall, rain washes contaminant-containing sediment that normally sits at the bottom of pipes into natural bodies of water.
Relevant research shows that 60% of the drainage pipes in relevant areas have sediment, 15% of the pipes have a large amount of sediment, and the proportion of sediment accounts for more than 15% of the drainage pipe volume. During a rainstorm, 30~80% of the water pollution load is from a discharge pipeline overflow. According to the relevant research results, the pollutant concentration of urban surface runoff in this calculation ranges from 1.02 to 2.15 mg/L [26,27,28]. The total amount of pollutants in urban surface runoff was calculated according to the coverage rate of the pipe network.
The underlying surface area of urban runoff includes not only the area of urban built-up area, but also the area of rural roofing and hardened ground in the suburbs. The total area of hardened ground such as roofing and pavement in the region was calculated. The runoff coefficient of hard land was 0.9, and the runoff coefficient of other areas was 0.35 [29]. It was calculated that the amount of ammonia nitrogen pollution from surface runoff into the river is 2195 tons.
(f)
Release of internal pollutants
Under the conditions of human disturbance, water erosion and changes in water temperature and quality, some organic pollutants can be re-released into the water body, causing the river water body to be polluted to different degrees. The formula for calculating its release is as follows:
W I = A × β 5
where the variables are denoted as follows:
W I —release pollutants from sediment;
A—water area;
β 5 —sediment pollutant release rate (mg/m2·d), ranging from 0.016 to 0.047 mg/m2·d.
It was calculated that the annual ammonia nitrogen pollution from endogenous pollutants released into the river was 448 tons.
The statistical results of ammonia nitrogen pollution in rivers in 2021 are shown in Table 7.

5.2. Analysis of the Driving Force of Water Pollution

In the past decade, the sustained and rapid growth of the regional economy has brought tremendous pressure to water bodies. In the case of a saturated water environment capacity, with the continuous increase of population and GDP, the total amount of industrial wastewater and domestic sewage discharge also shows an increasing trend year by year, and the massive discharge of pollutants further increases the difficulty of water quality improvement.
Domestic sewage and agricultural pollution are large and extensive, and it is difficult to control them. The main rivers of the city’s plain river network are affected by domestic sewage, surface runoff and agricultural non-point source pollution; urban and rural domestic sewage treatment facilities are still lagging behind, the sewage treatment capacity and urban and rural expansion scale is disproportionate, and the depth of the sewage treatment capacity is insufficient.
The study area is located in the plain river network, and the industry is developed, and the population is dense. Although the environmental protection construction and water quality supervision have been strengthened in the past ten years, the phenomena of an insufficient domestic sewage treatment capacity, industrial enterprise leakage and excessive discharge are still difficult to completely eliminate, which is also an important reason for the long-term lack of significant improvement in the regional water quality. The difficulties of pollution sources and treatment are summarized as follows:
(a)
Natural factors
Restricted by location conditions, generally the river slope in the coastal plain river network area is relatively small, and the water body in the river channel flows slowly, so the water exchange capacity is insufficient, and the water environment capacity is relatively small. The water quality of the river network is easily deteriorated due to the lack of a self-purification ability, and it is difficult to recover. In the study area, the river channel is obstructed and the shoreline is hardened, so it is difficult to restore the water ecology. In addition, because of the large number of river channels and small cross sections, the river network’s weak hydraulic power is more prominent due to the weakening of the water system ring function caused by river filling.
In order to save urban land use space, the riverbanks are mostly paved with stone slope protection, and the concrete and stone slope protection enables the urban surface nutrients (nitrogen and phosphorus) to flow directly into the river without shelter, aggravating the eutrophication of the water body. The hard bank protection and slope protection structure take a closed form on the river slope; the slope is basically perpendicular to the river surface, and the material exchange between the water body and the bank slope soil is isolated, thus losing the purification effect of the soil. At the same time, the organisms and microorganisms in the river have lost their living environment and struggle to survive. Moreover, various aquatic plants are also difficult to grow on the hard structural slope, and various aquatic animals cannot survive because of the loss of living environment. The hardened bank slope blocks the river infiltration, affects the flood control function, greatly weakens the water ecological function, and completely loses the basic self-purification ability of the river, resulting in further deteriorations in water quality.
(b)
Domestic sewage
According to the new coverage standard, in the first quarter of 2021, the coverage rate of the Cixi domestic sewage treatment administrative village was only 30.41%, and the community was relatively good, followed by urban villages and old communities, and the rural coverage rate of non-built-up areas in townships was the lowest; some villages had not yet laid sewage reception lines, and there was a large blind area in the construction of the sewage feeder pipe network. The performance of the household connection rate of some villages was less than 10%, the sewage pipe network in the built-up area had design defects and problems of long-term damage, and when the sewage pipe network overflowed in the rainy season, a large amount of domestic sewage was discharged directly into the river or via soil infiltration, resulting in excessive pollution factors such as ammonia nitrogen and total phosphorus. The sewage absorption capacity of the water functional area was beyond the limit, seriously affecting the water quality of the river.
Many small businesses such as small restaurants, bath houses, beauty salons, car washes, small hotels and laundromats have not yet handled drainage permits or management, resulting in some wastewater being directly discharged into the surrounding river or rainwater wells. Due to the large quantity and wide area, management and law enforcement are more difficult, and the pollution control ability is relatively weak.
(c)
Industrial pollution
Due to the large number of industrial enterprises, small enterprises account for a large proportion. The regional industry is massive in terms of development; although electroplating, paper, agricultural and sideline food processing, printing and dyeing and other heavy pollution industries have been effectively controlled, bearing, metal rolling, electronic product, furniture manufacturing, metal surface treatment, printing, waste plastic and other industry enterprises are still in the form of small workshops scattered in the village. Due to the construction of sewage treatment facilities and the high price of self-take-over management, some enterprise sewage treatment, sewage interception and drainage and rain and pollution diversion facilities are not in place, resulting in the production of domestic sewage that is directly or indirectly discharged into the surrounding water bodies, which is also the root cause of the difficulty in improving the water quality in local areas.
(d)
Agricultural pollution
Agricultural non-point source pollution is widespread; the pollution situation is complicated, the types are diverse, and the difficulty and proportion of effective control are low. First, the pollution volume of pesticides and fertilizers is large, and the effect of organic fertilizers is relatively poor. Despite warnings every year, fertilizers are still used in large quantities, and the annual average fertilizer consumption per unit of cultivated land area exceeds 300 kg/hm2, which is greater than the safety upper limit of 225 kg/hm2 set by developed countries to prevent chemical fertilizers from polluting water bodies. Although pesticides show a decreasing trend year by year after reduction, because of the large base, the use is still very considerable. On rainy days, the pollution interception ability is weak, resulting in a large amount of nitrogen and phosphorus loss in agricultural fertilizers and pesticides entering and polluting nearby water bodies. The second is that the farmland solid waste collection and transportation system is not perfect; ultra-thin plastic film is still used in large quantities, the recovery rate needs to be improved, some pesticide and fertilizer packaging is abandoned in fields and ditches, straw is still burned, and the construction of a collection and storage system needs to be refortified.
(e)
Livestock and aquaculture
The control of this type of pollution is relatively difficult, and large-scale farming is relatively good, but the number of small farms is large, scattered in rural areas, old communities, urban villages, farmland and other areas, and the management is difficult, resulting in a large number of livestock and poultry feces directly or indirectly discharged into the river, affecting the water quality. Aquaculture wastewater discharge supervision is difficult, because aquaculture is generally in relatively remote non-residential areas. In order to facilitate water collection, most of them are built around river channels. Due to the high cost of aquaculture wastewater treatment, residents rarely complain or report; some farmers often discharge tail water directly into river channels. Due to the large number of aquaculture sites, wide distribution and few supervisory personnel, the inspection frequency is low, and supervision is difficult. The pollutants flow directly into the water body, affect the regional water quality, and lead to the worsening trend of eutrophication in some river basins.
(f)
Drainage permits and supervision are inadequate
Urban drainage facilities within the coverage of six small industries along street shops, construction sites, medical institutions, schools, farmers’ markets, industrial enterprises and other drainage households should obtain drainage permits, but because the drainage permit application process is unfamiliar, the need to take over the cost is large, after handling will be included in the supervision object and pay sewage treatment fees. As a result, some management objects know that they need to handle drainage permits and do not handle them. In addition, due to the wide range of management objects that have not handled drainage permits, competent business departments are few and far between, resulting in inadequate supervision and a willingness to be powerless.
(g)
Urban runoff pollution
Early rainwater collection is difficult. Solid waste such as municipal solid waste, agricultural waste and industrial waste residue, industrial dust, diesel oil drips from motor vehicles during driving, oil pollution wastewater from restaurants along the street and residents’ kitchens is attached to various sites on sunny days. Once it rains, especially when there is a heavy rainstorm, these pollutants will be washed directly or indirectly into the river along with the rain because they are not effectively collected, causing water pollution. The road surface and the surrounding greenery are mostly isolated by hard protection surfaces, and most of the road rainwater is discharged directly into the surrounding river through the rainwater wells without being purified by the green space.

6. Conclusions

There are many rivers in the coastal plain that belong to a network water system, but the terrain is flat, the water body flows little, and the self-purification ability is poor. Heavy rainfall is the main method of water renewal in the plain river network, which has great influence on the content of nitrogen and phosphorus pollution. The flood calculation includes flood zoning, a flow production calculation and a confluence calculation. The runoff production zones were divided according to the rainfall characteristics and the underlying surface characteristics of the basin, and then the runoff production was calculated according to the conditions of each runoff production zone based on the rainstorm process.
The main pollution items in the study area were ammonia nitrogen, total phosphorus and the chemical oxygen demand, and the overall water quality gradually improved during the study period. In addition to the inter-annual change, the water quality index is also affected by temperature and water intake throughout the year, resulting in the increase or dilution of pollutants and a change in the degradation coefficient. The overall analysis showed that the pH value, five-day biochemical oxygen demand and total phosphorus in five drainages decreased in the dry season, and the ammonia nitrogen in the five drainages increased in the dry season. The dissolved oxygen increased in the dry season in the East River area, the Middle River area and the Northwest River area, while the dissolved oxygen decreased in the south and north of the West River area. The permanganate index in the southern West River District increased in the dry season, while that of the other four river districts decreased in the dry season. The chemical oxygen demand in the East River area and the south of the West River area increased in the dry season, while the dissolved oxygen in the other river areas decreased in the dry season.
According to the data provided by the environmental protection department, a full investigation and analysis were carried out, and the discharge of regional wastewater and major pollutants was statistically obtained. According to the total amount control method, the pollution load of the river network in the study area was analyzed by taking ammonia nitrogen as an example. The main sources of pollution in the river include the industrial pollution, agricultural pollution, livestock and poultry pollution, domestic pollution, surface runoff and internal source pollution of river channels, and the ammonia nitrogen pollution in the river in 2021 was 9456 tons. Through the investigation of ammonia nitrogen pollution sources and pollution-driven analysis conducted in the study area, it was found that the main causes of regional water pollution were as follow: riverbank hardening, river obstruction, low domestic sewage treatment rate, inadequate sewage treatment by small industrial enterprises, excessive amounts of agricultural fertilizers, arbitrary discharge of aquaculture sewage, urban surface runoff pollution, especially during early rainfall, and rain and sewage mixing and flowing straight into the river network.
This study found the change law of the surface water pollution distribution in time and analyzed its driving factors but did not find the spatial distribution law or cause of pollutant change, which may be related to the land use mode or population size. Further analyses of related factors are needed. In addition, at present, the investigation of other types of pollution sources except ammonia nitrogen have not been carried out, so it is difficult to calculate and verify the total amounts of pollutants, and the pollution indexes of other single pollutants need to be calculated and verified one by one in the future.

Author Contributions

Y.Z., M.J. and J.C. conceived the study and designed the algorithms. C.J. implemented the software modules and validated the modeling. All authors have read and agreed to the published version of the manuscript.

Funding

This research was funded by the Science and Technology Project of the Zhejiang Water Resources Department (RB2113) and the basic scientific research business project of Zhejiang Tongji Vocational College of Science and Technology (FRF21PY002).

Data Availability Statement

Data are contained within the article.

Conflicts of Interest

The authors declare no conflicts of interest.

References

  1. Wang, F.; Dong, W.; Zhao, Z.; Wang, H.; Li, W.; Chen, G.; Wang, F.; Zhao, Y.; Huang, J.; Zhou, T. Heavy metal pollution in urban river sediment of different urban functional areas and its influence on microbial community structure. Sci. Total Environ. 2021, 778, 146383. [Google Scholar] [CrossRef]
  2. Zou, L.; Liu, Y.; Wang, Y.; Hu, X. Assessment and analysis of agricultural non-point source pollution loads in China: 1978–2017. J. Environ. Manag. 2020, 263, 110400. [Google Scholar] [CrossRef]
  3. de Lucena Barbosa, J.E.; Severiano, J.D.S.; Cavalcante, H.; de Lucena-Silva, D.; Mendes, C.F.; Barbosa, V.V.; Silva, R.D.D.S.; de Oliveira, D.A.; Molozzi, J. Impacts of inter-basin water transfer on the water quality of receiving reservoirs in a tropical semi-arid region. Hydrobiologia 2021, 848, 651–673. [Google Scholar] [CrossRef]
  4. Wu, L.; Bai, T.; Huang, Q. Tradeoff analysis between economic and ecological benefits of the inter basin water transfer project under changing environment and its operation rules. J. Clean. Prod. 2020, 248, 119294. [Google Scholar] [CrossRef]
  5. Zaryab, A.; Nassery, H.R.; Knoeller, K.; Alijani, F.; Minet, E. Determining nitrate pollution sources in the Kabul Plain aquifer (Afghanistan) using stable isotopes and Bayesian stable isotope mixing model. Sci. Total Environ. 2022, 823, 153749. [Google Scholar] [CrossRef]
  6. Ahamed, S.; Sengupta, M.K.; Mukherjee, A.; Hossain, M.A.; Das, B.; Nayak, B.; Pal, A.; Mukherjee, S.C.; Pati, S.; Dutta, R.N.; et al. Arsenic groundwater contamination and its health effects in middle ganga plain. Sci. Total Environ. 2006, 338, 189–200. [Google Scholar]
  7. Shi, H.; Lv, R.; Liu, Y.; Xiao, D.; Wang, Z.; Yuan, X.; Liu, L.; Yu, C. Spatial Variability Characteristics and Influencing Factors of Soil Fluoride in the Western Nansihu Lake Basin. Water 2023, 15, 3855. [Google Scholar] [CrossRef]
  8. Mester, T.; Balla, D.; Szabó, G. Assessment of Groundwater Quality Changes in the Rural Environment of the Hungarian Great Plain Based on Selected Water Quality Indicators. Water Air Soil Pollut. 2020, 231, 536. [Google Scholar] [CrossRef]
  9. Salah, Z.; Abderrahmane, B.; Lahcen, B. Impacts of natural conditions and anthropogenic activities on groundwater quality in Tebessa plain, Algeria. Sustain. Environ. Res. 2018, 28, 340–349. [Google Scholar]
  10. Nicolli, H.B.; Bundschuh, J.; Del, C. Blanco, M.; Tujchneider, O.C.; Panarello, H.O.; Dapeña, C.; Rusansky, J.E. Arsenic and associated trace-elements in groundwater from the Chaco-Pampean plain, Argentina: Results from 100 years of research. Sci. Total Environ. 2012, 429, 36–56. [Google Scholar] [CrossRef]
  11. Sun, L.; Liang, X.; Jin, M.; Zhang, X. Sources and fate of excessive ammonium in the Quaternary sediments on the Dongting Plain, China. Sci. Total Environ. 2022, 806, 150479. [Google Scholar] [CrossRef]
  12. He, S.; Li, P.; Su, F.; Wang, D.; Ren, X. Identification and apportionment of shallow groundwater nitrate pollution in Weining Plain, northwest China, using hydrochemical indices, nitrate stable isotopes, and the new Bayesian stable isotope mixing model (MixSIAR). Environ. Pollut. 2022, 298, 118852. [Google Scholar] [CrossRef]
  13. Pang, Y.; He, J.; Niu, X.; Song, T.; Fu, L.; Liu, K.; Bi, E. Selenium distribution in cultivated Argosols and Gleyosols of dry and paddy lands: A case study in Sanjiang Plain, Northeast China. Sci. Total Environ. 2022, 836, 155528. [Google Scholar] [CrossRef]
  14. Donmez, C.; Sari, O.; Berberoglu, S.; Cilek, A.; Satir, O.; Volk, M. Improving the Applicability of the SWAT Model to Simulate Flow and Nitrate Dynamics in a Flat Data-Scarce Agricultural Region in the Mediterranean. Water 2020, 12, 3479. [Google Scholar] [CrossRef]
  15. Zhang, L.; Wang, C.; Liang, G.; Cui, Y.; Zhang, Q. Influence of Land Use Change on Hydrological Cycle: Application of SWAT to Su-Mi-Huai Area in Beijing, China. Water 2020, 12, 3164. [Google Scholar] [CrossRef]
  16. Schilling, J.; Tränckner, J. Generate_SWMM_inp: An Open-Source QGIS Plugin to Import and Export Model Input Files for SWMM. Water 2022, 14, 2262. [Google Scholar] [CrossRef]
  17. Kim, H.; Amatya, D.M.; Broome, S.W.; Hesterberg, D.L.; Choi, M. Sensitivity analysis of the DRAINWAT model applied to an agricultural watershed in the lower coastal plain, North Carolina, USA. Water Environ. J. 2012, 26, 130–145. [Google Scholar] [CrossRef]
  18. Jiang, X.; Ma, R.; Ma, T.; Sun, Z. Modeling the effects of water diversion projects on surface water and groundwater interactions in the central Yangtze River basin. Sci. Total Environ. 2022, 830, 154606. [Google Scholar] [CrossRef]
  19. Zhao, T.; Li, Q.; Lu, L.; Yan, G.; Li, D.; Zhang, W. Analysis of water environmental pollution in plain river network region in small watershed of Caoqiao River. Trans. Chin. Soc. Agric. Eng. 2011, 27, 170–175. [Google Scholar]
  20. Liu, M.; Min, L.; Wu, L.; Pei, H.; Shen, Y. Evaluating nitrate transport and accumulation in the deep vadose zone of the intensive agricultural region, North China Plain. Sci. Total Environ. 2022, 825, 153894. [Google Scholar] [CrossRef]
  21. Yao, D.; Tang, G.; Wang, Y.; Yang, Y.; Wang, Y.; Liu, Y.; Yu, M.; Liu, Y.; Yu, H.; Liu, J.; et al. Oscillation cumulative volatile organic compounds on the northern edge of the North China Plain: Impact of mountain-plain breeze. Sci. Total Environ. 2022, 821, 153541. [Google Scholar] [CrossRef]
  22. Xi, W.; Chang, L.; Yuan, Z. Study of the basic environmental water requirement of the rivers in Huang-Huai-Hai plain. Geogr. Res. 2003, 22, 169–176. [Google Scholar]
  23. Hong, Y.; Cao, F.; Fan, M.-Y.; Lin, Y.-C.; Bao, M.; Xue, Y.; Wu, J.; Yu, M.; Wu, X.; Zhang, Y.-L. Using machine learning to quantify sources of light-absorbing water-soluble humic-like substances (HULIS_(WS)) in Northeast China. Atmos. Environ. 2022, 291, 119371. [Google Scholar] [CrossRef]
  24. GB3838-2002; Environmental Quality Standards for Surface Water. National Standard of the People’s Republic of China: Beijing, China, 2002. Available online: https://www.mee.gov.cn/ywgz/fgbz/bz/bzwb/shjbh/shjzlbz/200206/W020061027509896672057.pdf (accessed on 28 January 2024).
  25. Aredo, M.R.; Hatiye, S.D.; Pingale, S.M. Modeling the rainfall-runoff using MIKE 11 NAM model in Shaya catchment, Ethiopia. Model. Earth Syst. Environ. 2021, 7, 2545–2551. [Google Scholar] [CrossRef]
  26. Lemaire, G.G.; Rasmussen, J.J.; Höss, S.; Kramer, S.F.; Schittich, A.-R.; Zhou, Y.; Köppl, C.J.; Traunspurger, W.; Bjerg, P.L.; McKnight, U.S. Land use contribution to spatiotemporal stream water and ecological quality: Implications for water resources management in peri-urban catchments. Ecol. Indic. 2022, 143, 109360. [Google Scholar] [CrossRef]
  27. Hu, L.; Zhao, H. Influence of particle size on diffuse particulate pollutants in combined sewer systems. Sci. Total Environ. 2022, 846, 157476. [Google Scholar] [CrossRef]
  28. Chen, S.; Sun, B.; Fang, H.; Li, Z.; Tong, A. Analysis of the Roughness Coefficient of Overflow in a Drainage Pipeline with Sedimentation. J. Pipeline Syst. Eng. Pract. 2022, 13. [Google Scholar] [CrossRef]
  29. Zhou, K. Urban water dissipation calculation based on the improved water balance models. J. Water Clim. Change 2022, 13, 372–382. [Google Scholar] [CrossRef]
Figure 1. River system and location of research area.
Water 16 00489 g001
Figure 2. The locations of the monitoring sections.
Water 16 00489 g002
Figure 3. Distributions of the mass concentration of seven water quality indicators from 14 water quality monitoring stations during the study.
Water 16 00489 g003aWater 16 00489 g003b
Figure 4. Comparison diagrams of the six main pollutant indexes in five river regions during the dry and wet seasons.
Water 16 00489 g004
Table 1. Characteristic values of water level in each river area.
Water LevelHighest Water Level (m)Warning Water Level (m)Normal Water Level (m)Low Water Level (m)
Drainage
East River3.131.901.45–1.650.60
Middle River3.362.101.75–1.950.90
North of West River4.242.802.25–2.451.20
South of West River4.242.802.25–2.451.20
Northwest River4.243.102.25–2.801.90
Table 2. Basic information of monitoring sections.
DrainageRiverSectionLongitude (E)Latitude (N)Monitoring Frequency
East RiverYBHWSP121.48972 30.13194 bimonthly
East RiverZSJZSJ121.42472 30.10056 bimonthly
Middle RiverJMPZJP121.44272 30.24835 bimonthly
Middle RiverHSJHSD121.23667 30.17194 bimonthly
Middle RiverYBHWCTJ121.26583 30.20528 bimonthly
Northwest RiverQTHJYXQ121.05833 30.24639 bimonthly
Northwest RiverLZWBTJ121.23444 30.31528 bimonthly before January 2018 and monthly after that
Northwest RiverYBHWXCE121.08361 30.22500 bimonthly
Northwest RiverYBHWXS121.11167 30.25861 bimonthly
South of West RiveYBHWLX121.12083 30.16472 bimonthly
South of West RiveSTHJSTJ121.18639 30.23944 bimonthly
South of West RiveZJLJZX121.12222 30.22222 bimonthly
North of West RiverSZPJSZP121.31505 30.28084 bimonthly
North of West RiverSZPJSZPZ121.36232 30.34269 bimonthly before January 2011 and monthly after that
Note: The monitoring frequency “bimonthly” means once every two months, which means January, March, May, July, September and November each year.
Table 3. Calculation results of rainstorms in each river region.
DrainageTime FrameCalculation Results of Each Rainstorm Frequency (mm)
1%2%5%10%20%
East RiverH1d269.8 235.7 190.3 155.8 122.0
H3d372.0 324.3 261.8 215.0 168.2
H7d454.5 401.2 331.3 277.8 223.9
Middle RiverH1d241.7 210.9 170.3 139.7 109.3
H3d387.4 338.0 272.9 223.9 175.2
H7d457.2 404.3 333.9 280.0 225.7
West River and Northwest RiverH1d217.1 189.6 153.0 125.4 98.1
H3d385.4 336.0 271.3 222.7 174.4
H7d438.3 386.9 319.5 268.0 215.9
Table 4. Calculation results of runoff yield in each river.
DrainagePartition NameDrainage Area (km2)Water Production at Different Frequencies (7 Days) (104 m3)
1%2%5%10%
East RiverNorth Part193 8097.8 7077.6 5728.6 4698.3
South Part124 5230.1 4570.2 3698.0 3033.0
Subtotal317 13,327.911,647.89426.67731.3
Middle RiverNorth Part183 7664.6 6706.5 5426.5 4438.0
South Part148 6227.2 5453.4 4422.7 3616.6
Subtotal331 13,891.812,159.99849.28054.6
West River and Northwest RiverNorth Part107 4286.7 3738.6 3016.0 2469.0
South Part92.9 3768.4 3294.9 2656.9 2182.4
Northwest Part173 6897.7 6000.6 4824.3 3939.8
Subtotal373 14,952.813,034.110,497.28591.2
Table 5. Calculation results of mountain confluence (m3/s).
DrainageP = 1%P = 2%P = 5%P = 10%
Middle River
(Mountainous area)
867.3765.3613.1496.6
East River
(Mountainous area)
858757.3605.1505.1
Table 6. Statistics of sewage discharge into the river (104 t/a).
YearDomestic SewageIndustrial WastewaterLivestock and Poultry Breeding SewageTotal
20218926227115711,354
Table 7. Statistics of ammonia nitrogen pollution in the river (tons).
YearDomestic SewageIndustrial WastewaterLivestock and Poultry Breeding SewageAgricultural Non-Point Source PollutionSurface Runoff PollutantRelease of Internal PollutantsTotal
2021407527965821951800 4489456
Disclaimer/Publisher’s Note: The statements, opinions and data contained in all publications are solely those of the individual author(s) and contributor(s) and not of MDPI and/or the editor(s). MDPI and/or the editor(s) disclaim responsibility for any injury to people or property resulting from any ideas, methods, instructions or products referred to in the content.

