Abstract
To clarify the risk posed to groundwater in oil shale in situ mining areas, we examine five leached pollutants: Fe, Mn, Cr, sulfate, and ammonia nitrogen. Potential groundwater contents of these five pollutants were evaluated using an improved Nemero comprehensive index method and a health risk assessment method. The results show that, compared with the Class III groundwater quality standard (GB/T 14848-2017) used in the People’s Republic of China, average values of Fe, Mn, and sulfate in leaching solution from Fuyu oil shale exceed the standard, while Cr and ammonia nitrogen do not exceed the standard, and the leaching solution is within Class V groundwater quality. The average values of Fe and Mn in the leaching solution from Fushun oil shale exceed the Class III standard, while Cr, sulfate, and ammonia nitrogen values from this oil shale do not exceed the standard, and the leaching solution is Class IV in terms of groundwater quality. The weighting value used in the Nemero assessment method for the heavy metal Cr is the largest as its potential to cause harm to groundwater quality is the largest. The weight value for sulfate is the smallest as the harm degree is the smallest. The chemical carcinogen Cr has the greatest potential impact on human health. The health risk caused by the chemical non-carcinogen Mn is greater than that caused by Fe and ammonia nitrogen. When high pyrolysis temperatures are used, Mn will be released into groundwater in large quantities. Therefore, supervision and control should be strengthened. The results presented here can provide a reference for the comprehensive evaluation of groundwater risks caused by in situ oil shale mining.
1. Introduction
As an alternative oil resource, oil shale has received widespread attention [1] and has good prospects for development and utilization. There are two principal methods for oil shale mining at present: retorting (pyrolysis) of crushed extracted rock vs. in situ retorting of a fracked formation. Ground retorting refers to the process of extracting oil shale underground or in an open pit, crushing and screening it to the required particle size, heating it in an indoor retort, and then producing shale oil or directly using it for combustion and power generation. The development technology of this method is relatively mature, but it produces a large number of polluting gases, sewage, and solid waste. These pollutants will seep into groundwater under the leaching effect of rainwater, resulting in groundwater pollution. In situ mining does not require mining, transportation, or ore processing. Firstly, drilling projects such as exploration wells, temperature monitoring wells, and production wells are completed. Then, hydraulic fracturing of the oil shale rock layer using in situ vertical wells is used to generate cracks. The heating device provides a heat source to directly crack the underground oil shale rock layer, which undergoes a pyrolysis reaction underground, causing the decomposition of kerogen to produce shale oil and shale gas. A large number of microscale pores and fissures are formed along the bedding direction, forming oil and gas communication channels [2,3] and achieving in situ pyrolysis of oil shale and extracting shale oil and gas to the surface with production well dry distillation drive. It can develop deep and thick oil shale deposits and has advantages such as a high recovery rate, good product quality, less land occupation, and environmental protection. After in situ pyrolysis of oil shale, micro-nano scale oil and gas permeation channels will be formed inside the rock, improving the permeability of the rock layer. At the same time, it will change the initial stress of the surrounding rock mass. When the stress exceeds the strength of the rock mass itself, the top and bottom rock layers will be destroyed, forming cracks and changing the initial flow field of groundwater [2,4]. Under the action of pore pressure, groundwater can invade the pyrolysis oil shale layers, and toxic and harmful substances such as inorganic minerals, various organic compounds, and heavy metal elements in the residual oil shale can migrate and release under the action of water and rock, ultimately affecting the groundwater environment [5,6] and causing potential harm to human health.
At present, there is no large-scale application of oil shale in situ mining in China. Additionally, there are few studies on the impact of groundwater pollution caused by in situ mining. Assessment methods mainly include the single-factor pollution index method, the average comprehensive pollution index method, the Nemero pollution index method, the water quality index method, the geological accumulation index method, and the potential ecological risk index method [7,8,9]. The improved Nemero index method synthesizes the impact of various pollution factors, avoiding the deviation of results caused by the traditional Nemero index method due to over-highlighting maximum values and neglecting weights. Su et al. [10] compared the single-factor pollution index method with the Nemero pollution index method and noted that the Nemero index method considers indicators of more serious pollution, makes up for the shortcomings of the single-factor index method, and is more comprehensive for water quality evaluation. Zhang et al. [11] used the improved Nemero index method combined to evaluate water environment quality. The results showed that the improved Nemero index method based on entropy weight is objective. Si et al. [12] analyzed the characteristics of groundwater pollution downstream of a tailings pond using the Nemero index method and found that the pollutants leaked from the tailings pond had threatened the water quality of the Yellow River. Therefore, the improved Nemero index method is selected for this study to evaluate the environmental risk of groundwater in an oil shale in situ mining area.
Health risk assessments consider the health status and the risk of future illness or death of humans, as in our case, who are exposed to or consume groundwater. Raimi et al. [13] conducted a health risk assessment of heavy metal ingestion using a groundwater drinking pathway for residents in an oil and gas-producing area of Rivers State, Nigeria. Their study clearly indicates that some health-deteriorating chemicals in drinking water were at dangerous levels. Zhang et al. [14] carried out a health risk assessment of heavy metals such as Cu, Cd, Mn, Cr, and Fe in the groundwater of the Dingji Coal Mine in Huainan Coalfield. They noted that importance should be attached to the harm caused by Cr in groundwater. Su et al. [15] investigated the groundwater of the Dingbian oil and gas field and carried out a health risk assessment of direct consumption and skin contact. They found that the risk of non-carcinogens and carcinogens caused by the direct intake of the water was higher than that caused by skin absorption. Çelebi et al. [16] studied the impact of heavy metals As, B, Ba, Cr, Cu, Mn, and Mo in the groundwater of the Mellon River Basin in Türkiye on human health. The results show that even the unpolluted river basin posed a risk to human health. Yahaya et al. [17] analyzed and discussed the water safety of Pb, Ni, Cd, Cu, Cr, Zn, and microorganisms in borehole and well water from three locations in Lagos, Nigeria, and concluded that the selected heavy metals did not pose a major health threat to the residents of the region. From these studies, it is clear that human health assessments should be carried out on the groundwater in in situ mining areas.
To fully understand the quality of groundwater in a typical oil shale in situ mining area, this evaluation uses Fuyu City (Jilin Province, China) and Fushun City (Liaoning Province, China) as study areas and investigates the content characteristics of the residue after pyrolysis at different temperatures within oil shale. Water samples are tested for Fe, Mn, Cr, sulfate, and ammonia nitrogen leached from the original rock after soaking for a set number of days. The improved Nemero comprehensive index method and health risk assessment method are used to conduct environmental risk assessment and health risk assessment on groundwater quality in the oil shale mining areas. It is hoped that this study can provide a reference for the comprehensive assessment of groundwater risk in other in situ oil shale mining areas.
2. Materials and Methods
2.1. Overview of the Study Area
Sample 1 was taken from Fuyu City, Jilin Province, China. Fuyu City is located on the Nenjiang River and Songhua River Plain between 125°0′ E–126°10′ E and 44°44′ N–44°30′ N. The total area of the region is 4658 square kilometers, with an average altitude of 191 m. The area has a temperate monsoon climate; hence, is windy and rainy in the spring, warm and rainy in the summer, has an uneven distribution of rainfall, is clear and cool in the autumn, and is cold and dry in the winter. There are long periods of frozen river water and soil, with the depth of frozen soil reaching 1.3 to 2.0 m. The average temperature is 4.5 °C. The Fuyu geological structure is characteristic of the Songliao subsidence area. Under geological action, the landform is characterized by high areas in the east and low areas in the west and is dominated by an inter-river platform. The Fuyu region has oil, natural gas, oil shale, and other mineral resources. As of 2013, it was estimated that the regional oil reserves were 100 million tons, the oil shale reserves were 46 billion tons, and the recoverable amount was of the order of 18 billion tons.
Sample 2 was taken from Fushun City, Liaoning Province, China, which is located in the middle temperate climatic zone and has a temperate monsoon climate. The study site is located between 123°39′ E and 125°28′ E and 41°14′ N and 42°28′ N. The total area of the region is 11,271 km2, with an average altitude of 80 m. It is rich in mineral resources, including 34 kinds of metal and non-metal resources. There are approximately 5.5 billion tons of coal resources, with large reserves of oil shale.
2.2. Sample Collection and Processing
The depth of oil shale in situ mining in the study area was 300–600 m, and hence, it was difficult to directly collect underground water. The oil shale samples collected in our laboratory are limited, and the amount of oil shale used for making core columns for seepage experiments is more than 10 times that used for leaching experiments. The experiment showed that there is a significant positive correlation between the results of the seepage experiment and the leaching experiment, and the conclusions of leaching experiments can reflect the conclusions of seepage experiments. Therefore, the sample was crushed and used for leaching experiments instead of percolation experiments (refer to the attached document S1 Collection and Processing of Seepage Experiment Samples; S2 Comparative Analysis of Leaching and Percolation Experiments; and S3 Correlation Analysis Between Leaching Experiment and Seepage Experiment). Therefore, this study simulated the impact of pyrolysis on groundwater quality during the mining process with an oil shale leaching experiment using pyrolysis at 100 °C to 500 °C [18].
Oil shale samples were separated into five groups and reduced to sub-samples of less than 2 mm in particle size. A sub-sample was placed into a 250 mL quartz beaker, which was put into a muffle furnace and heated to a set temperature. The pyrolysis temperatures used were 100 °C, 200 °C, 300 °C, 400 °C, and 500 °C under air atmosphere and 0.1 MPa pressure. Pyrolysis then proceeded for 5 h. The residue after pyrolysis was then mixed and placed into a bag, sealed, and stored in a dryer. A sixth group of sub-samples of the original rock was not heat-treated and was used as a control.
The dried pyrolysis residue and control rock was placed in brown polyethylene terephthalic acid (PET) bottles, and ultra-pure water (pH 6.68) was added for sealing and ensuring a solid–water ratio of 1:10 according to the “Solid Waste Leaching Toxicity Leaching Method Horizontal Oscillation Method” (HJ557-2010) [19]. The concentrations of five pollutants (Fe, Mn, Cr, sulfate, and ammonia nitrogen) leached under conditions of 25 °C for 2, 6, 14, 22, 38, 54, and 70 days were then determined. Each group of experiments was repeated 3 times, and the average of three repetitions was used as the final measurement results. The remaining samples were analyzed with X-ray diffraction (XRD).
2.3. Determination of Sample Concentrations
In this study, 12 heavy metal elements (Cu, Zn, As, Cd, Pb, Sb, Ni, Co, Mo, Fe, Mn, and Cr) as well as sulfate and ammonia nitrogen were originally selected for detection based on the elemental composition of the oil shale itself (C, H, O, N, S) and in combination with groundwater quality standards. According to the method in “Determination of 65 Elements in Water Quality—Inductively Coupled Plasma Mass Spectrometry” (HJ700-2014) [20], an Agilent 7700e Inductively Coupled Plasma Mass Spectrometer (Agilent Corporation of the United States) was used to determine the contents of the heavy metal elements Cu, Zn, As, Cd, Pb, Sb, Ni, Co, Mo, Fe, Mn, and Cr in each water sample obtained from soaking the oil shale after pyrolysis. Initial experiments showed that the released amounts of eight of the twelve heavy metals (Cu, Zn, As, Cd, Pb, Sb, Ni, Co, and Mo) in the leaching solution exhibited no significant change compared to the leaching solution from the original unheated rock, and each was in the Class I water quality standard in the Quality Standard for Groundwater (GB/T 14848-2017) [21], so only three heavy metal elements, including Fe, Mn, and Cr, were analyzed.
According to the method in Determination of Inorganic Anions (F−, Cl−, NO2−, Br−, NO3−, PO43−, SO32−, SO42−) in Water Quality by Ion Chromatography (HJ84-2016) [22], the content of sulfate was determined using a Diane ICS-1500 ion chromatograph (Diane Corporation of the United States). Following the method in Water Quality—Determination of Ammonia Nitrogen—Salicylic Acid Spectrophotometry (HJ536-2009) [23], the content of ammonia nitrogen was determined using the salicylic acid method under visible light with a wavelength of 655 nm using a Hash DR6000 ultraviolet-visible spectrophotometer (Hash Company in the United States).
2.4. Assessment of Pollution Factors
2.4.1. Improved Nemero Composite Index Method
In the evaluation process of groundwater quality, the Nemero index method has been widely used. The traditional Nemero index method overemphasizes the impact of maximum values on evaluation results, which can skew results [10,24]. Hence, the improved Nemero index method comprehensively considers the impact of various evaluation factors. The introduction of weightings defines the relative importance of each evaluation factor in the overall assessment, highlighting the contribution of the toxicological index of Cr to groundwater quality compared with the contributions from other indicators such as Fe, Mn, sulfate, and ammonia nitrogen. The use of weightings more clearly reflects the true water pollution situation [25].
This paper uses Class III water quality in the Quality Standard for Groundwater (GB/T 14848-2017) as a benchmark. The calculation formula is as follows [26,27]:
- (1)
- Determine a single pollution index
Fij = Cij/Sij,
Cij—the actual detection value of the ith index in the jth water sample;
Sij—standard concentration value of index i in the jth water sample.
- (2)
- Determine the evaluation factor weight value Wi
Ri = Smax/Si,
Wi = Ri/∑Ri,
Smax—the maximum of the standard values of various evaluation factors;
Wi—weight value of the ith evaluation factor;
- (3)
- Calculation of improved Nemero composite index method.
Fjmax—maximum value of the single pollution index in the jth water sample;
Fw—the ratio of Cij to Sij for the evaluation factor with the largest weight value Wi.
2.4.2. Health Risk Assessment Method
This paper uses a health risk assessment model recommended by the U.S. Environmental Protection Agency (USEPA) to evaluate the groundwater quality in the oil shale mining areas [28,29,30,31]. There are many ways for pollutants in water to enter the human body [32,33], and many studies have confirmed that direct consumption is the most harmful to human health [34,35,36,37]. Therefore, this study only considers direct consumption and ignores the other pathways. The calculation formula is as follows [38,39]:
where —the average personal carcinogenic risk of chemical carcinogen i and chemical non-carcinogen j in drinking water, a−1A—per capita weight, taking 60 kg;
Ci/j—mass concentration of chemical carcinogen i in drinking water, mg/L;
Di/j—daily average exposure dose per unit weight of chemical carcinogen i/chemical non-carcinogen j, mg/(kg·d);
w—weight value of the ith evaluation factor;
L—the average life span of a human, taken as 70a; W is the daily average drinking water, taking 2.2 L/d;
qi—carcinogenic intensity coefficient of chemical carcinogen i, mg/(kg·d);
RfDj—reference dose of chemical non-carcinogen j in drinking water, mg/(kg·d).
where Rtotal—total health risk generated by drinking water, a−1;
Rc—the total carcinogenic risk of chemical carcinogens in drinking water, a−1;
Rn—the total non-carcinogenic risk of non-chemical carcinogens in drinking water, a−1.
According to the list of chemical carcinogens listed by the World Health Organization (WHO), the International Agency for Research on Cancer (IARC), and the relevant literature [40,41,42], Cr is a chemical carcinogen, and Fe, Mn, and ammonia nitrogen are chemical non-carcinogens. The relevant intensity coefficients and reference doses are presented in Table 1 [15].

Table 1.
Values of qi and RfDj-related parameters.
The purpose of a health risk assessment is to evaluate the impact on human health. This paper uses the maximum acceptable risk value recommended by the International Commission on Radiation Protection (ICRP) and the United States Environmental Protection Agency (USEPA) and the maximum negligible risk value recommended by the Netherlands Construction and Environmental Protection Agency as the evaluation criteria [11,12].
3. Results and Discussion
3.1. Oil Shale Mineral Composition
The mineral compositions of Sample 1 and Sample 2 protoliths are presented in Table 2. Using the XRD analysis of two batches of untreated rock samples, it was found that the minerals in Sample 1 mainly included quartz, analcime, feldspar, mica, chlorite, gypsum, pyrite, and apatite, and the minerals in Sample 2 mainly included quartz, kaolinite, feldspar, mica, siderite, and pyrite. Sample 1 contained analcime, chlorite, gypsum, and apatite, while Sample 2 contained kaolinite and siderite, and the content of quartz, feldspar, mica, and pyrite in Sample 1 was higher than that in Sample 2. It can be seen that there was a large difference in the mineral composition of the two batches of samples. It can be inferred from this that there should be large differences in the leaching concentrations from the two batches of samples.
Table 2.
Mineral composition of original rock.
3.2. Analysis of the Leaching Experiment
The detected concentrations of each pollution factor in the leaching solution from Sample 1 and Sample 2 are presented in Figure 1, and the associated statistics are presented in Table S1. For Sample 1, the concentration of Fe increased with increasing pyrolysis temperature between 200 °C and 400 °C, and it also increased with increased soaking time at each pyrolysis temperature. For Sample 2, the change in Fe with soaking time and pyrolysis temperature was not obvious.
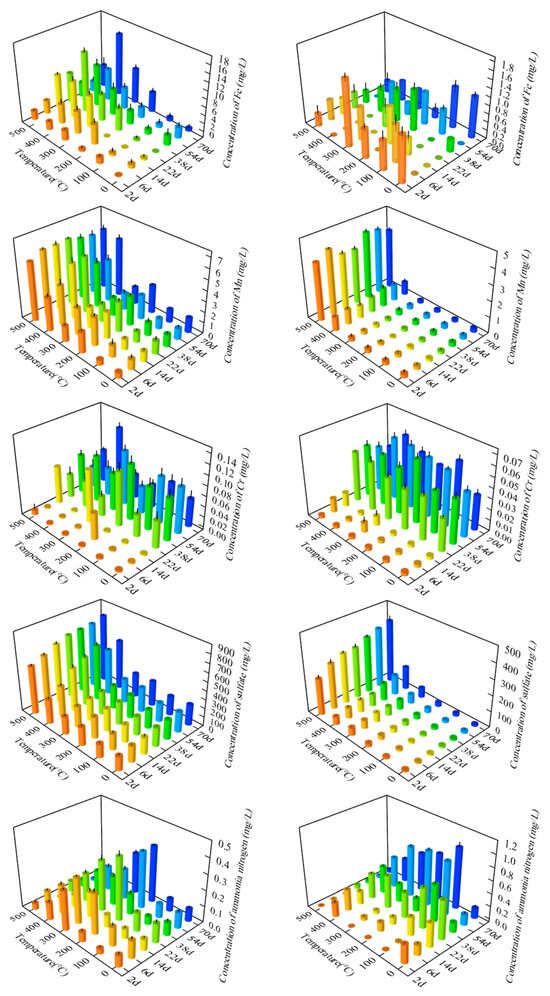
Figure 1.
Concentration of Sample 1 (left) and Sample 2 (right) pollution factors.
The concentration of Mn tended to be stable with the prolongation of soaking time at each pyrolysis temperature and increased with increasing pyrolysis temperature. The concentration of Mn reached a maximum at 500 °C, indicating that pyrolysis temperature was the main factor affecting the concentration of Mn compared with soaking time.
The concentration of Cr increased significantly over the first 22 days of soaking. This may be because the solubility of Cr in water is smaller than that of Fe and Mn, and the dissolution rate is very slow. Hence, it took a certain time to reach the maximum value of dissolution, and as the leaching experiment was carried out on a static test bench without stirring, this was not conducive to dissolution. The polarization phenomenon of ion concentration occurs at the solid–liquid interface, which reduces the dissolution rate. Therefore, the concentration of Cr was relatively low when the immersion time was short.
The concentration of sulfate increased with increasing pyrolysis temperature, especially in Sample 2, when the pyrolysis temperature rose from 400 °C to 500 °C, the increase in sulfate concentration was the largest. The concentration of ammonia nitrogen increased at first and then decreased with the increase in pyrolysis temperature. It is speculated that the reason for this observation is that the water-soluble nitrogen in minerals, some of which exist in the form of ammonia nitrogen, is attached to the surface or interlayer of clay minerals in the form of physical adsorption. With the increase in pyrolysis temperature, the dissolution rate of water is faster, resulting in the increasing concentration of ammonia nitrogen in the water, but as the pyrolysis continues, the dissolved ammonia nitrogen is oxidized to nitrate nitrogen or other nitrogenous compounds and the concentration gradually decreases.
The average concentrations of Fe, Mn, Cr, sulfate, and ammonia nitrogen in Sample 1 were 4.08 mg/L, 2.81 mg/L, 0.05 mg/L, 347.02 mg/L, and 0.14 mg/L, respectively. The average concentration of Fe exceeded the standard of Class III water quality by 13.6 times, and 38 of the total water samples had Fe concentrations that exceeded the standard. All Mn concentrations exceeded the standard of Class III water quality, with a maximum value of 6.26 mg/L, 62.6 times the standard, and an average value of 28.1 times the standard. The average value of Cr concentration did not exceed the standard for Class III water quality, although 21 water samples out of all the water samples exceeded the standard. The samples that exceeded the standard were mainly with soaking times of more than 22 days. When the pyrolysis temperature was 400 °C and the soaking time was 70 days, the maximum concentration reached 0.13 mg/L, which exceeded the standard by 2.5 times. The average concentration of sulfate exceeded the Class III water quality standard by 1.4 times, and 24 individual water samples exceeded the standard. The ammonia nitrogen concentrations of all water samples did not exceed the standard of Class III water quality.
The average values of the detected concentrations of Fe, Mn, Cr, sulfate, and ammonia nitrogen in Sample 2 were 0.45 mg/L, 0.94 mg/L, 0.03 mg/L, 89.04 mg/L, and 0.30 mg/L, respectively. The average value of Fe concentration exceeded the Class III water quality standard by 1.5 times, and 27 water samples exceeded the standard. The average concentration of Mn exceeded the Class III water quality standard by 9.4 times, and 41 water samples exceeded the standard. The maximum concentration reached 4.29 mg/L when the pyrolysis temperature was 500 °C and the soaking time was 38 days, and the maximum concentration exceeded the standard by 42.9 times. The average concentration of Cr did not exceed the Class III water quality standard, and 35 water samples out of all water samples exceeded the standard, reaching the maximum concentration of 0.06 mg/L when the pyrolysis temperature was 200 °C and the soaking time was 38 days, and the maximum concentration exceeded the standard by 1.2 times. The average value of sulfate concentration did not exceed the Class III water quality standard, although 36 of all water samples exceeded the standard. The average value of ammonia nitrogen concentration did not exceed the standard of Class III water quality, although 32 of all the water samples exceeded the standard.
The mineral composition of oil shale is relatively complex, and it is relatively difficult to carry out a quantitative analysis. Using XRD analysis, it was found that Sample 1 had more pyrite than Sample 2, as shown in Table 2. The main component of pyrite is FeS2, which is the most important source of sulfide in oil shale. The leachates after the oxidation reaction after heating are Fe2+, Fe3+, and SO42− plasma [43], which caused the concentration of sulfate in the leaching experiment to exceed the standard and the average sulfate value of Sample 1 to be higher than that of Sample 2. At the same time, this is also the main reason why the concentration of Fe in Sample 1 was higher than that in Sample 2. It should be noted that the mineral composition of chlorite and siderite in the two batches of samples contained iron components, but the chlorite and siderite did not generate soluble Fe2+ and Fe3+ during the pyrolysis process, so it had no effect on the concentration of Fe in the leaching solution.
Sample 1 and Sample 2 were the most serious samples with Mn concentrations that exceeded the standard, which is similar to existing reports [42]. The excessive content of Fe and Mn in groundwater is generally considered to be caused by human industrial and agricultural activities, and the oxidation–reduction environment is also the main reason for the enrichment of Fe and Mn in groundwater. With the increase in pyrolysis temperature, kerogen pyrolysis produces a large number of organic acids, which reduces the pH, and the increase in sulfate content also reduces the pH. When the pH is low, the groundwater is weakly acidic and is in a relatively closed reducing environment. The oxides of Fe and Mn are more easily dissolved and released under acidic conditions and a reducing environment, resulting in excessive content of Fe and Mn in the groundwater.
A Pearson correlation analysis was applied to the Fe, Mn, Cr, sulfate, and ammonia nitrogen results, and the analysis results are presented in Table 3. In Sample 1, there was a very significant positive correlation between Mn and sulfate (p < 0.01), with correlation coefficients of 0.945. There was a significant positive correlation between Fe and Mn, between Fe and Cr, and between Fe and sulfate (p < 0.01), with correlation coefficients of 0.578, 0.408, and 0.542, respectively. This suggests that the two evaluation factors in these significant correlations had the same source or the same migration and transformation process applied to them. This is especially true for the correlation between Mn and sulfate, which had the highest correlation coefficient. The content of sulfate increased, the pH decreased, the oxidation–reduction potential decreased, and the groundwater was in a reducing environment, with the dissolution and release of Mn oxide and an increase in Mn content. There was a marginal positive correlation between Fe and ammonia nitrogen (p < 0.05), and the correlation coefficient was 0.307. The correlations among the other evaluation factors were not significant, indicating that their sources were different.
Table 3.
Correlation analysis of the evaluation factors.
In Sample 2, there was a very significant positive correlation between Mn and sulfate and between Cr and ammonia nitrogen (p < 0.01), with correlation coefficients of 0.967 and 0.581, respectively. This suggests that they had the same source or the same migration and transformation process. There was a significant negative correlation between Mn and ammonia nitrogen and between sulfate and ammonia nitrogen (p < 0.01), with correlation coefficients of −0.433 and −0.403, respectively, indicating that they had different sources. The correlations among the other evaluation factors were not significant, indicating that the sources of pollutants or controlling processes were diverse.
3.3. Environmental Risk Assessment
The weight values of the evaluation factors calculated according to Equations (2) and (3) are shown in Table 4.
Table 4.
Weights of te evaluation factors.
The hazards indicated by pollution factors are inversely proportional to the standard value of Class III water quality in the Quality Standard for Groundwater (GB/T 14848-2017). The smaller the standard value of Class III water quality, the greater the hazard. The size of the weighting value applied to each factor is in direct proportion to the degree of harm caused by the pollution factor to groundwater quality. The greater the weight value, the greater the degree of harm caused by the pollution factor. The improved Nemero index method introduces weighting values, highlighting the relative importance of the toxicological index Cr in groundwater environmental impact assessments compared with other conventional indicators such as Fe, Mn, sulfate, and ammonia nitrogen.
The order of the weight values in Table 4 is Cr > Mn > Fe > ammonia nitrogen > sulfate. According to the analysis results of the leaching experiment, although the standard value of the toxicological index Cr is the smallest (i.e., 0.05 mg/L) and the leaching concentrations in Sample 1 and Sample 2 are also the smallest, the weight value is the largest (i.e., 0.566), as this metal causes the greatest harm to groundwater quality and human health. The standard value of sulfate is the largest (i.e., 250 mg/L), and the leaching concentration is also the largest, but the weight value is the smallest (i.e., 0.0001), and the degree of harm to groundwater is also the smallest.
See Table 5 for the evaluation grading of the improved Nemero composite index method concerning relevant documents:
Table 5.
Improved Nemero index evaluation grading.
The improved Nemero composite index evaluation results obtained from Samples 1 and 2 are shown in Figure 2.
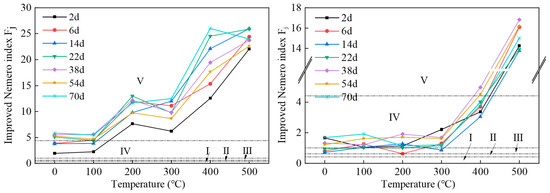
Figure 2.
Improved Nemero comprehensive index evaluation results for Sample 1 (left) and Sample 2 (right). The groundwater quality standard divides groundwater into five types of water quality, with Class I groundwater having good quality and Class V groundwater having poor quality.
The improved Nemero index for Sample 1 shows an overall upward trend with the increase in pyrolysis temperature. It reached a maximum value when the pyrolysis temperature was 400 °C and the soaking time was 70 days. The maximum value was 26.01, which is 26 times higher than the limit value of Class III water quality. The average value was 12.24, which is 12.2 times higher than the Class III water quality limit. The temperature at which the Nemero index reached its maximum value was 500 °C for all other soaking times as well. Of all the water samples, five were of Class IV water quality, accounting for 11.9% of all samples, and 37 water samples were of Class V water quality, which is extremely poor, accounting for 88.1% of all samples, and all exceeded the Class III water quality standard. The overall water quality of the leachate was of Class V groundwater quality, and hence, the water quality environment was extremely poor.
The improved Nemero index for Sample 2 also showed an overall trend of increase with increasing pyrolysis temperature. When the pyrolysis temperature exceeded 300 °C, the range of increase increased significantly, reaching a maximum value when the pyrolysis temperature was 500 °C and the soaking time was 38 days. The maximum value was 16.84, which is 16.8 times higher than the Class III water quality limit. The average value was 4.04, which is more than 4 times the Class III water quality limit. For each soaking time, the Nemero index reached its maximum at the pyrolysis temperature of 500 °C. Among all the water samples, one water sample was of Class II water quality, accounting for 2.4% of all the samples, four water samples were of Class III water quality, accounting for 9.5%, 28 water samples were of Class IV water quality, accounting for 66.7%, and nine water samples were of Class V water quality, accounting for 21.4%. The overall water quality of the leachate was of Class IV groundwater quality, indicating a poor water quality environment.
Obviously, the water quality of the Sample 1 leaching solution was worse than that of Sample 2, and the environmental risk within the Sample 1 mining area from groundwater quality was greater than that within the Sample 2 mining area. The Sample 1 mining area lies within the Songhua River basin, which is a local water supply source. If polluted groundwater converges into the river, it may cause extensive harm. The water depth in the Songhua River Basin is between 80 and 120 m. To avoid pollution, the mining depth should be greater than 150 m.
Due to research limitations, two batches of oil shale samples from two different deposits were used, and there were significant differences in mineral composition, organic matter structure, sedimentary environment, etc. However, relative amounts of various minerals can also change within a single deposit with a change in mineral type and stratum depth [44]. Oil shale is heterogeneous, the distribution of kerogen is random, and the content and composition of organic compounds can vary greatly within one deposit. Hence, it is difficult to find two similar oil shales because the sedimentary conditions between them can be extremely variable, and alteration can occur after deposition. The composition and quality of oil shale can also change within the scope of a deposit. Hence, the analysis results of different oil shale samples from the same deposit can have great differences [45], and when pyrolytic oil shale is sub-packed and used for subsequent leaching experiments, there is the possibility that experimental results can be irregular or the data can be abnormal due to insufficient mixing of sub-samples.
3.4. Health Risk Assessment
The calculated health risk values and total health risk values of the chemical carcinogen Cr and chemical non-carcinogens Fe, Mn, and ammonia nitrogen in all Sample 1 and Sample 2 water samples are shown in Figure 3. The order of the average health risks that may be caused by the consumption of contaminated groundwater for both Sample 1 and Sample 2 was Cr > Mn > Fe > ammonia nitrogen.
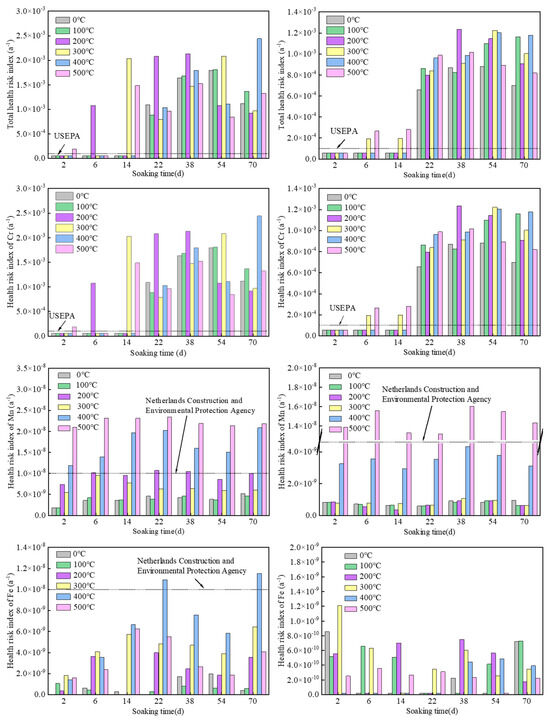
Figure 3.
Health risk index caused by each pollution factor of Sample 1 (left) and Sample 2 (right).
The average health risk and total health risk of the chemical carcinogen Cr in Samples 1 and 2 exceeded the ICRP (5 × 10⁻⁵) and USEPA (1 × 10⁻⁴) recommended maximum acceptable risk values. Twenty-eight water samples out of all the water samples exceeded the maximum acceptable risk value recommended by USEPA, and the samples that exceeded the standard mainly had immersion times of 22, 38, 54, and 70 days, indicating that the extension of immersion time led to a large release of Cr.
The average health risk values of the chemical non-carcinogens Fe, Mn, and ammonia nitrogen did not exceed the maximum acceptable risk values recommended by USEPA. The ammonia nitrogen from Sample 1 did not exceed the Netherlands Construction and Environmental Protection Agency (1 × 10⁻⁸) recommended maximum negligible value. The Fe values from two water samples exceeded the maximum negligible value, and the Mn values of 17 water samples exceeded the maximum negligible value. High values mainly resulted from pyrolysis temperatures of 400 °C and 500 °C, indicating that the increase in pyrolysis temperature leads to a large release of Mn in groundwater. The Fe and ammonia nitrogen values for Sample 2 did not exceed the maximum negligible value recommended by the Netherlands Construction and Environmental Protection Agency. The Mn values from seven water samples exceeded the maximum negligible value. High values were concentrated in the oil shale samples with a pyrolysis temperature of 500 °C, which also confirms that high pyrolysis temperature causes a large release of Mn into groundwater. It can be seen that the health risk of Mn as a chemical non-carcinogen is greater than that of Fe and ammonia nitrogen, and it is the most important non-carcinogenic pollutant, as it is very harmful to the human body. Other similar reports have shown that the long-term intake of large amounts of Mn through drinking water can lead to nervous system poisoning and nerve damage [46,47].
Assuming that the groundwater in the areas where Sample 1 and Sample 2 were extracted is polluted after in situ mining, permeable reaction wall repair technology or pump and treat technology can be used to remediate the groundwater in the contaminated areas. Permeable reaction wall repair technology is applied downstream of contaminated groundwater and is filled with active media materials. When contaminated groundwater passes through the reaction wall, a series of reactions occur so that the groundwater can be purified. Pump and treat technology is a type of ex situ remediation technology that involves extracting polluted groundwater and treating it using one or more technical methods, such as adsorption, filtration, chemical precipitation, chemical oxidation, and membrane treatment. After reaching the required standards, it is then reinjected or discharged into the pipeline network. In addition, based on the concept of groundwater protection, frozen walls, grouting curtains, and gas-driven water-stopping technologies have become groundwater protection technologies in the in-situ extraction process of oil shale.
4. Conclusions
- (1)
- According to leaching tests from two samples of oil shale, the average values of the detected concentrations of Fe, Mn, and sulfate in the leaching solution from Sample 1 exceeded the Class III groundwater quality standard, while values of Cr and ammonia nitrogen did not exceed the standard. The average values of Fe and Mn concentrations in the leaching solution from Sample 2 exceeded the Class III water quality standard, while values of Cr, sulfate, and ammonia nitrogen did not exceed the standard. Mn in Sample 1 and Sample 2 was the most serious heavy metal contaminant exceeding the standard, and this metal should be especially considered when conducting oil shale in situ mining projects.
- (2)
- According to the improved Nemero comprehensive index method, the weighting value of the heavy metal Cr is the largest, as this is the heavy metal element that causes the greatest harm to groundwater quality. The weighting value of sulfate is the smallest, as it is the element that causes the least harm to groundwater quality. Using the Class III water quality as the limit value, the Sample 1 leaching solution was generally of Class V water quality, and the Sample 2 leaching solution was generally of Class IV groundwater quality.
- (3)
- The results of the health risk assessment suggested that the order of the average health risk among the elements tested was Cr > Mn > Fe > ammonia nitrogen. The chemical carcinogen Cr was released from the test oil shale in large quantities with the extension of immersion time, and this is the most harmful heavy metal element. The chemical non-carcinogen Mn may be released into underground water in large quantities with the use of higher pyrolysis temperatures, and its health risk is greater than that of Fe and ammonia nitrogen. It is the chemical non-carcinogen that poses the greatest health risk.
Supplementary Materials
The following supporting information can be downloaded at: https://www.mdpi.com/article/10.3390/w16010185/s1. S1 Collection and processing of seepage experiment samples. S2 Comparative Analysis of Leaching and Percolation Experiments. (Figure S1 Seepage experiment (left) and leaching experiment (right) Actual detection concentration of sulfate.) (Figure S2 Percolation experiment (left) and leaching experiment (right) Actual detection concentration of Mn.) S3 Correlation analysis between leaching experiment and seepage experiment.
Author Contributions
Conceptualization, H.Y. and B.L. (Boyue Liu); methodology, S.H.; validation, B.L. (Bo Liu) and Y.S.; formal analysis, D.J.; investigation, R.L.; resources, S.H.; data curation, X.W. and B.L. (Boyue Liu); writing—original draft preparation, X.W.; writing—review and editing, X.W. and B.L. (Boyue Liu); visualization, W.X.; supervision, H.Y.; project administration, Y.X.; funding acquisition, S.H. All authors have read and agreed to the published version of the manuscript.
Funding
This research was partly funded by the national key research and development project “Ecological environment and geological effect evaluation of in-situ mining of oil shale” (2019YFA0705504) from Ministry of Science and Technology, PRC.
Data Availability Statement
Data are contained within the article and Supplementary Materials.
Conflicts of Interest
Author Shaolin He was employed by PetroChina Planning and Engineering Institute. Author Yang Song was employed by PetroChina Planning and Engineering Institute. Author Wei Xu was employed by PetroChina Planning and Engineering Institute. Author Bo Liu was employed by PetroChina Planning and Engineering Institute. Author Yingjun Xu was employed by PetroChina Planning and Engineering Institute. The remaining authors declare that the research was conducted in the absence of any commercial or financial relationships that could be construed as a potential conflict of interest.
References
- Saif, T.; Lin, Q.; Gao, Y.; Al-Khulaifi, Y.; Marone, F.; Hollis, D.; Bijeljic, B. 4D in situ synchrotron X-ray tomographic microscopy and laser-based heating study of oil shale pyrolysis. Appl. Energy 2019, 235, 1468–1475. [Google Scholar] [CrossRef]
- Bai, F.; Sun, Y.; Liu, Y.; Guo, M. Evaluation of the porous structure of huadian oil shale during pyrolysis using multiple approaches. Fuel 2017, 187, 1–8. [Google Scholar] [CrossRef]
- Kibodeaux, K.R. Evolution of porosity, permeability, and fluid saturations during thermal conversion of oil shale. In Proceedings of the SPE Annual Technical Conference and Exhibition, Amsterdam, The Netherlands, 27–29 October 2014. [Google Scholar] [CrossRef]
- Saif, T.; Lin, Q.; Bijeljic, B.; Blunt, M.J. Microstructural imaging and characterization of oil shale before and after pyrolysis. Fuel 2017, 197, 562–574. [Google Scholar] [CrossRef]
- Gavrilova, O.; Vilu, R.; Vallner, L. A life cycle environmental impact assessment of oil shale produced and consumed in estonia. Resour. Conserv. Recycl. 2011, 55, 232–245. [Google Scholar] [CrossRef]
- Tao, S.; Tang, D.; Xu, H.; Liang, J.; Shi, X. Organic geochemistry and elements distribution in dahuangshan oil shale, southern junggar basin: Origin of organic matter and depositional environment. Int. J. Coal Geol. 2013, 115, 41–51. [Google Scholar] [CrossRef]
- Liu, H.; Jiang, J.; Liu, C.P.; Li, Y.; Han, Q. Assessment of groundwater pollution and its causes in the plain area of Yili River Valley. In Proceedings of the Second International Conference on Social Science and Development, Wuhan, China, 15–17 July 2016. [Google Scholar] [CrossRef]
- Tong, W.; Wang, H. Analysis and Pollution Evaluation of Heavy Metal Content in Arsenic Rock, Sand and Compound Soil in Yulin Area, Shaanxi Province. In IOP Conference Series: Earth and Environmental Science; IOP Publishing: Bristol, UK, 2019; Volume 300, p. 032095. [Google Scholar] [CrossRef]
- Luo, P.; Xu, C.; Kang, S.; Huo, A.; Lyu, J.; Zhou, M.; Nover, D. Heavy metals in water and surface sediments of the Fenghe River Basin, China: Assessment and source analysis. Water Sci. Technol. 2021, 84, 3072–3090. [Google Scholar] [CrossRef] [PubMed]
- Su, K.; Wang, Q.; Li, L.; Cao, R.; Xi, Y. Water quality assessment of Lugu Lake based on Nemerow pollution index method. Sci. Rep. 2022, 12, 1–10. [Google Scholar] [CrossRef]
- Zhang, X.F.; Xiao, C.L.; Li, Y.Q.; Song, D.F. Water environmental quality assessment and protection strategies of the xinlicheng reservoir, china. Appl. Mech. Mater. 2014, 501–504, 1863–1867. [Google Scholar] [CrossRef]
- Si, W.; Li, Q.; Ren, Y.; Peng, Q.; Tian, M.; Cao, Q.; Liu, J. The influence of geological structure on the characteristics of groundwater pollution in the downstream of tailing pond. In IOP Conference Series: Earth and Environmental Science; IOP Publishing: Bristol, UK, 2021; Volume 621, p. 012127. [Google Scholar] [CrossRef]
- Raimi, M.; Adedoyin, O.O.; Nimisngha, D.; Odipe, O.E.; Olalekan, A.S. Health risk assessment on heavy metals ingestion through groundwater drinking pathway for residents in an oil and gas producing area of rivers state, nigeria. Open J. Yangtze Oil Gas 2018, 3, 191–206. [Google Scholar] [CrossRef]
- Zhang, S.; Liu, G.; Sun, R.; Wu, D. Health risk assessment of heavy metals in groundwater of coal mining area: A case study in Dingji coal mine, Huainan coalfield, China. Hum. Ecol. Risk Assess. Int. J. 2016, 22, 1469–1479. [Google Scholar] [CrossRef]
- Su, H.; Kang, W.; Xu, Y.; Wang, J. Assessment of groundwater quality and health risk in the oil and gas field of Dingbian County, Northwest China. Expo. Health 2017, 9, 227–242. [Google Scholar] [CrossRef]
- Çelebi, A.; Şengörür, B.; Kløve, B. Human health risk assessment of dissolved metals in groundwater and surface waters in the Melen watershed, Turkey. J. Environ. Sci. Health Part A 2014, 49, 153–161. [Google Scholar] [CrossRef] [PubMed]
- Yahaya, T.O.; Oladele, E.O.; Fatodu, I.A.; Abdulazeez, A.; Yeldu, Y.I. The concentration and health risk assessment of heavy metals and microorganisms in the groundwater of Lagos, Southwest Nigeria. arXiv 2021, arXiv:2101.04917. [Google Scholar] [CrossRef]
- Yan, J.; Wang, C.; Wang, Z.; Yang, S.; Li, P. Mercury concentration and speciation in mine wastes in Tongren mercury mining area, southwest China and environmental effects. Appl. Geochem. 2019, 106, 112–119. [Google Scholar] [CrossRef]
- HJ 557-2010[S]; Solid Waste Leaching Toxicity Leaching Method Horizontal Oscillation Method. Institute of Solid Waste Pollution Control Technology. Chinese Academy of Environmental Sciences: Beijing, China, 2010. (In Chinese)
- HJ 700-2014[S]; Determination of 65 Elements in Water Quality by Inductively Coupled Plasma Mass Spectrometry. Science and Technology Standards Department of the Ministry of Environmental Protection. China Environmental Publishing House: Beijing, China, 2014.
- GB/T14848-2017[S]; Ministry of Ecology and Environment Groundwater Quality Standards. China Standards Publishing House: Beijing, China, 2017.
- HJ 84-2016[S]; Determination of Inorganic Bright Ions (F−, Cl−, NO2−, Br−, NO3−, PO43−, SO32−, SO42-) in Water Quality by Ion Chromatography. Ministry of Environmental Protection. China Environmental Science Press: Beijing, China, 2016.
- HJ 536-2009[S]; Determination of Ammonia Nitrogen in Water Quality—Salicylic Acid Spectrophotometric Method. Ministry of Environmental Protection. China Standards Publishing House: Beijing, China, 2009.
- Yang, F.; Yuan, L.; Yifu, L.I.; Dandan, H.E.; Liu, X.; Wang, D. Pollution characteristics and ecological risk assessment of heavy metals in sediments of main water systems in hunan province. Acta Ecol. Sin. 2022, 42, 1934–1946. [Google Scholar] [CrossRef]
- Zhang, Y.; Hou, K.; Qian, H. Water quality assessment using comprehensive water quality index and modified Nemerow index method: A case study of Jinghui Canal, North China. In IOP Conference Series: Earth and Environmental Science; IOP Publishing: Bristol, UK, 2020; Volume 467, p. 012125. [Google Scholar] [CrossRef]
- Wang, D.; Yang, C.; Shao, L. The spatiotemporal evolution of hydrochemical characteristics and groundwater quality assessment in Urumqi, Northwest China. Arab. J. Geosci. 2021, 14, 1–14. [Google Scholar] [CrossRef]
- Liang, B.; Han, G.; Zeng, J.; Qu, R.; Liu, M.; Liu, J. Source and risk assessment of trace metals in red soils from Yunnan Province, Southwest China. Clean–Soil Air Water 2021, 49, 2000288. [Google Scholar] [CrossRef]
- Zhang, L.; Zhao, L.; Zeng, Q.; Fu, G.; Feng, B.; Lin, X.; Hou, C. Spatial distribution of fluoride in drinking water and health risk assessment of children in typical fluorosis areas in north China. Chemosphere 2020, 239, 124811. [Google Scholar] [CrossRef]
- Adimalla, N.; Li, P.; Venkatayogi, S. Hydrogeochemical evaluation of groundwater quality for drinking and irrigation purposes and integrated interpretation with water quality index studies. Environ. Process. 2018, 5, 363–383. [Google Scholar] [CrossRef]
- Lan, T.; Wang, F.; Bao, S.; Miao, J.; Bai, Y.; Jia, S.; Cao, Y. The human health risk assessment and countermeasures study of groundwater quality. Environ. Geochem. Health 2023, 45, 3215–3228. [Google Scholar] [CrossRef]
- Adimalla, N.; Li, P. Occurrence, health risks, and geochemical mechanisms of fluoride and nitrate in groundwater of the rock-dominant semi-arid region, Telangana State, India. Hum. Ecol. Risk Assess. Int. J. 2019, 25, 81–103. [Google Scholar] [CrossRef]
- Khan, Y.K.; Toqeer, M.; Shah, M.H. Characterization, Source Apportionment and Health Risk Assessment of Trace Metals in Groundwater of Metropolitan Area in Lahore, Pakistan. Expo. Health 2023, 15, 915–931. [Google Scholar] [CrossRef]
- Li, W.; Wang, M.Y.; Liu, L.Y.; Wang, H.F.; Yu, S. Groundwater heavy metal levels and associated human health risk in the North China Plain. Arab. J. Geosci. 2015, 8, 10389–10398. [Google Scholar] [CrossRef]
- Verma, A.; Singh, N.B. Evaluation of groundwater quality using pollution index of groundwater (PIG) and non-carcinogenic health risk assessment in part of the Gangetic Basin. Acta Geochim. 2021, 40, 419–440. [Google Scholar] [CrossRef]
- Geng, M.; Qi, H.; Liu, X.; Gao, B.; Yang, Z.; Lu, W.; Sun, R. Occurrence and health risk assessment of selected metals in drinking water from two typical remote areas in China. Environ. Sci. Pollut. Res. 2016, 23, 8462–8469. [Google Scholar] [CrossRef] [PubMed]
- Wu, J.; Man, Y.; Sun, G.; Shang, L. Occurrence and health-risk assessment of trace metals in raw and boiled drinking water from rural areas of China. Water 2018, 10, 641. [Google Scholar] [CrossRef]
- Tanwer, N.; Deswal, M.; Khyalia, P.; Laura, J.S.; Khosla, B. Assessment of groundwater potability and health risk due to fluoride and nitrate in groundwater of churu district of rajasthan, india. Environ. Geochem. Health 2023, 45, 4219–4241. [Google Scholar] [CrossRef] [PubMed]
- Giri, S.; Singh, A.K. Human health risk assessment via drinking water pathway due to metal contamination in the groundwater of Subarnarekha River Basin, India. Environ. Monit. Assess. 2015, 187, 63. [Google Scholar] [CrossRef]
- Ahmed, A.S.; Hossain, M.B.; Babu, S.O.F.; Rahman, M.M.; Sarker, M.S.I. Human health risk assessment of heavy metals in water from the subtropical river, Gomti, Bangladesh. Environ. Nanotechnol. Monit. Manag. 2021, 15, 100416. [Google Scholar] [CrossRef]
- Krishna, A.K.; Mohan, K.R. Risk assessment of heavy metals and their source distribution in waters of a contaminated industrial site. Environ. Sci. Pollut. Res. 2014, 21, 3653–3669. [Google Scholar] [CrossRef]
- Wu, J.; Bian, J.; Wan, H.; Ma, Y.; Sun, X. Health risk assessment of groundwater nitrogen pollution in Songnen Plain. Ecotoxicol. Environ. Saf. 2021, 207, 111245. [Google Scholar] [CrossRef] [PubMed]
- Yadav, K.; Raphi, M.; Jagadevan, S. Geochemical appraisal of fluoride contaminated groundwater in the vicinity of a coal mining region: Spatial variability and health risk assessment. Geochemistry 2021, 81, 125684. [Google Scholar] [CrossRef]
- Masood, N.; Hudson-Edwards, K.A.; Farooqi, A. Groundwater nitrate and fluoride profiles, sources and health risk assessment in the coal mining areas of Salt Range, Punjab Pakistan. Environ. Geochem. Health 2022, 44, 715–728. [Google Scholar] [CrossRef] [PubMed]
- Patterson, J.H.; Hurst, H.J.; Levy, J.H.; Killingley, J.S. Mineral reactions in the processing of Australian Tertiary oil shales. Fuel 1990, 69, 1119–1123. [Google Scholar] [CrossRef]
- Raukas, A.; Punning, J.M. Environmental problems in the Estonian oil shale industry. Energy Environ. Sci. 2009, 2, 723–728. [Google Scholar] [CrossRef]
- Khous, D.; Ait-Amar, H.; Belaid, M.; Chorfi, H. Geochemical and isotopic assessment of groundwater quality in the alluvial aquifer of the Eastern Mitidja Plain. Water Resour. 2019, 46, 443–453. [Google Scholar] [CrossRef]
- Kawser Ahmed, M.; Baki, M.A.; Kundu, G.K.; Islam, S.; Islam, M.; Hossain, M. Human health risks from heavy metals in fish of Buriganga river, Bangladesh. SpringerPlus 2016, 5, 1–12. [Google Scholar] [CrossRef]


Disclaimer/Publisher’s Note: The statements, opinions and data contained in all publications are solely those of the individual author(s) and contributor(s) and not of MDPI and/or the editor(s). MDPI and/or the editor(s) disclaim responsibility for any injury to people or property resulting from any ideas, methods, instructions or products referred to in the content. |
© 2024 by the authors. Licensee MDPI, Basel, Switzerland. This article is an open access article distributed under the terms and conditions of the Creative Commons Attribution (CC BY) license (https://creativecommons.org/licenses/by/4.0/).