Article

Hydrological Simulation Study in Gansu Province of China Based on Flash Flood Analysis

1
China Institute of Water Resources and Hydropower Research, Beijing 100038, China
2
Gansu Ganlan Water Resources and Hydropower Survey and Design Institute Co., Ltd., Lanzhou 730030, China
3
Gansu Provincial Water Conservancy Bureau, Lanzhou 730030, China
*
Author to whom correspondence should be addressed.
Water 2024, 16(3), 488; https://doi.org/10.3390/w16030488
Submission received: 2 January 2024 / Revised: 23 January 2024 / Accepted: 29 January 2024 / Published: 2 February 2024

Abstract

:
The calibration and validation of hydrological model simulation performance and model applicability evaluation in Gansu Province is the foundation of the application of the flash flood early warning and forecasting platform in Gansu Province. It is difficult to perform the simulation for Gansu Province due to the fact that it covers a wide range, from north to south, with multiple climate types and diverse landforms. The China Flash Flood Hydrological Model (CNFF) was implemented in this study. A total of 11 model clusters and 289 distributed hydrological models were divided based on hydrology, climate, and land-use factors, among others. A spatiotemporally mixed runoff method and the Event-Specific Geomorphological Instantaneous Unit Hydrograph (GIUH) were applied based on large-scale fast parallel computation. To improve model calibration and validation efficiency, the RSA method (Regionalized Sensitivity Analysis) was used for CNFF model parameter sensitivity analysis, which could reduce the number of model parameters that need to be adjusted during the calibration period. Based on the model sensitivity analysis results, the CNFF was established in Gansu Province to simulate flood events in eight representative watersheds. The average NSE, REQ, and ET were 0.76 and 0.73, 9.1% and 12.6%, and 1.2 h and 1.7 h, respectively, in the calibration and validation period. In general, the CNFF model shows a good performance in multiple temporal and spatial scales, thus providing a scientific basis for flash flood early warning and analysis in Gansu Province.

1. Introduction

In recent years, flash floods have occurred frequently, lasted for a long time, were destructive, and affected a wide range of areas, causing heavy property losses and casualties [1,2]. In the flood season of 2021, floods affected 58.9 million people in China, 590 people were dead and missing, 3.515 million people were urgently relocated, and 203,000 houses collapsed, causing direct economic losses of 240.6 billion yuan [2]. At present, flash flood forecasting technology is one of the most important foundations for disaster prevention and reduction in my country. It can extend the forecast period and improve the scientific nature of flash flood risk early warning. How to accurately simulate heavy rain and flash floods, conduct timely flash flood forecasts and early warnings, and achieve safe transfer of people and property is the key to flash flood disaster prevention [3,4,5,6].
In order to improve the simulation accuracy and calculation efficiency of heavy rain floods, watershed hydrological models, such as HEC [7], SWMM [8], NWS-RFS [9], PRMS [10], Topmodel [11,12], etc., are widely used in flood forecasting early warning in countries such as the United States, the United Kingdom, Australia, Canada, Sweden, and China [13,14]. So far, there are three types of hydrological models applied to flash flood forecasting: lumped models, semi-distributed models, and distributed models [15]. The watershed parameters in the lumped model are homogenized and do not consider the spatial changes in geographical elements within the watershed. The low spatial resolution results in insufficient flash flood simulation accuracy [16]. However, if the data conditions are limited and you want to obtain calculation results in a short time, the lumped model is the most suitable hydrological model. The semi-distributed hydrological model TOPMODEL uses a geomorphic index to reflect the distribution pattern of runoff movement in the basin, which can solve the situation where the grid unit slope in flat terrain is 0° and the flow direction cannot be determined [17]. The distributed hydrological model uses high-precision topography data, which can reflect the spatial distribution characteristics of topography, land use, and soil types throughout the basin and improve the accuracy of flash flood warnings [18]. For example, in addition to considering hydrological processes such as interception, evapotranspiration, infiltration, surface runoff, mid-soil flow, and underground runoff, the SHE model uses the finite difference method of energy conservation partial differential equations to calculate vertical water movement [19,20,21]. It has high accuracy, but the computational cost and time cost are too high, and it is not suitable for flash flood simulations with large and concentrated floods and a short peak duration. The loosely coupled type uses each unit grid or sub-basin as a hydrological response unit and applies a conceptual lumped model for simulation. The biggest advantage of this structure is that it is suitable for complex watersheds with different soil types, land use, and topography, and it can model and implement rapid simulation in areas lacking data [22]. To this end, the National Flash Flood Disaster Prevention and Control Project Team developed a distributed hydrological model based on a loosely coupled structure: the Chinese Flash Flood Hydrological Model (CNFF), which greatly extended the foreseeable period of flash floods and improved the scientific nature of early warning. Fujian, Jilin, Henan, Guangdong, and other places have successfully implemented the operational application of flash flood disaster warning and forecasting [4,5].
In order to further improve the applicability of CNFF to areas with different climate characteristics and underlying surface conditions and improve the model algorithm library, this paper conducted a study on the model algorithm of CNFF in the Gansu region and evaluated the flood simulation accuracy and applicability of the model in small- and medium-sized watersheds. This provides a certain scientific basis for the application of CNFF in flood analysis and flash flood warning and forecasting in small watersheds in Gansu Province.

2. Research Area and Methods

2.1. Research Area

Gansu is located in the geographical center of the motherland, with geographical coordinates of 32°11′–42°57′ north latitude and 92°13′–108°46′ east longitude, with a total area of 425,800 km2. The terrain slopes from southwest to northeast, with the highest elevation being 6009 m, the lowest elevation being 288 m, and the average elevation being 2260 m. The topography is complex and diverse, including mountains, plateaus, plains, river valleys, deserts, Gobi, and other types. It can be roughly divided into six major regions: the Longnan Mountains, with overlapping mountains and rich vegetation; the dry and water-deficient Longzhong Loess Plateau; Gannan Plateau, with wide grasslands and abundant water plants; Gobi, with flat terrain and abundant water resources in Hexi Corridor; the Qilian Mountains, with year-round snow and winding glaciers; and the area north of the Hexi Corridor, with high winds, strong sand, and exposed rocks.
There are 11 water systems in three major river basins in Gansu Province (Figure 1). Their distribution is as follows. The inland river basins include the Shule River system, the Sugan Lake system, the Heihe River system, and the Shiyang River system. The Yellow River basin includes the Tao River system, Huangshui River system, Yellow River system, Wei River system, Jing River system, and Beiluo River water system. The Yangtze River Basin has the Jialing River water system (Figure 1). The total length of each water system is shown in Table 1.
Because Gansu covers a wide area from north to south and spans multiple climate types, Gansu has diverse climate types. Most areas have a dry climate, with arid and semi-arid areas accounting for 75% of the total area. The annual precipitation in various parts of the province ranges from 36.6 to 734.9 mm, generally decreasing from southeast to northwest. The precipitation in the area to the west of Wushaoling decreased significantly, while the precipitation in the Longnan Mountains in Southern Gansu and east of the Qilian Mountains was relatively high. Affected by the monsoon, the flood season is concentrated from June to August, accounting for 50–70% of the annual precipitation. The climate is changeable, and heavy rains occur frequently, making it extremely vulnerable to the threat of flash floods.

2.2. Data Sources and Processing

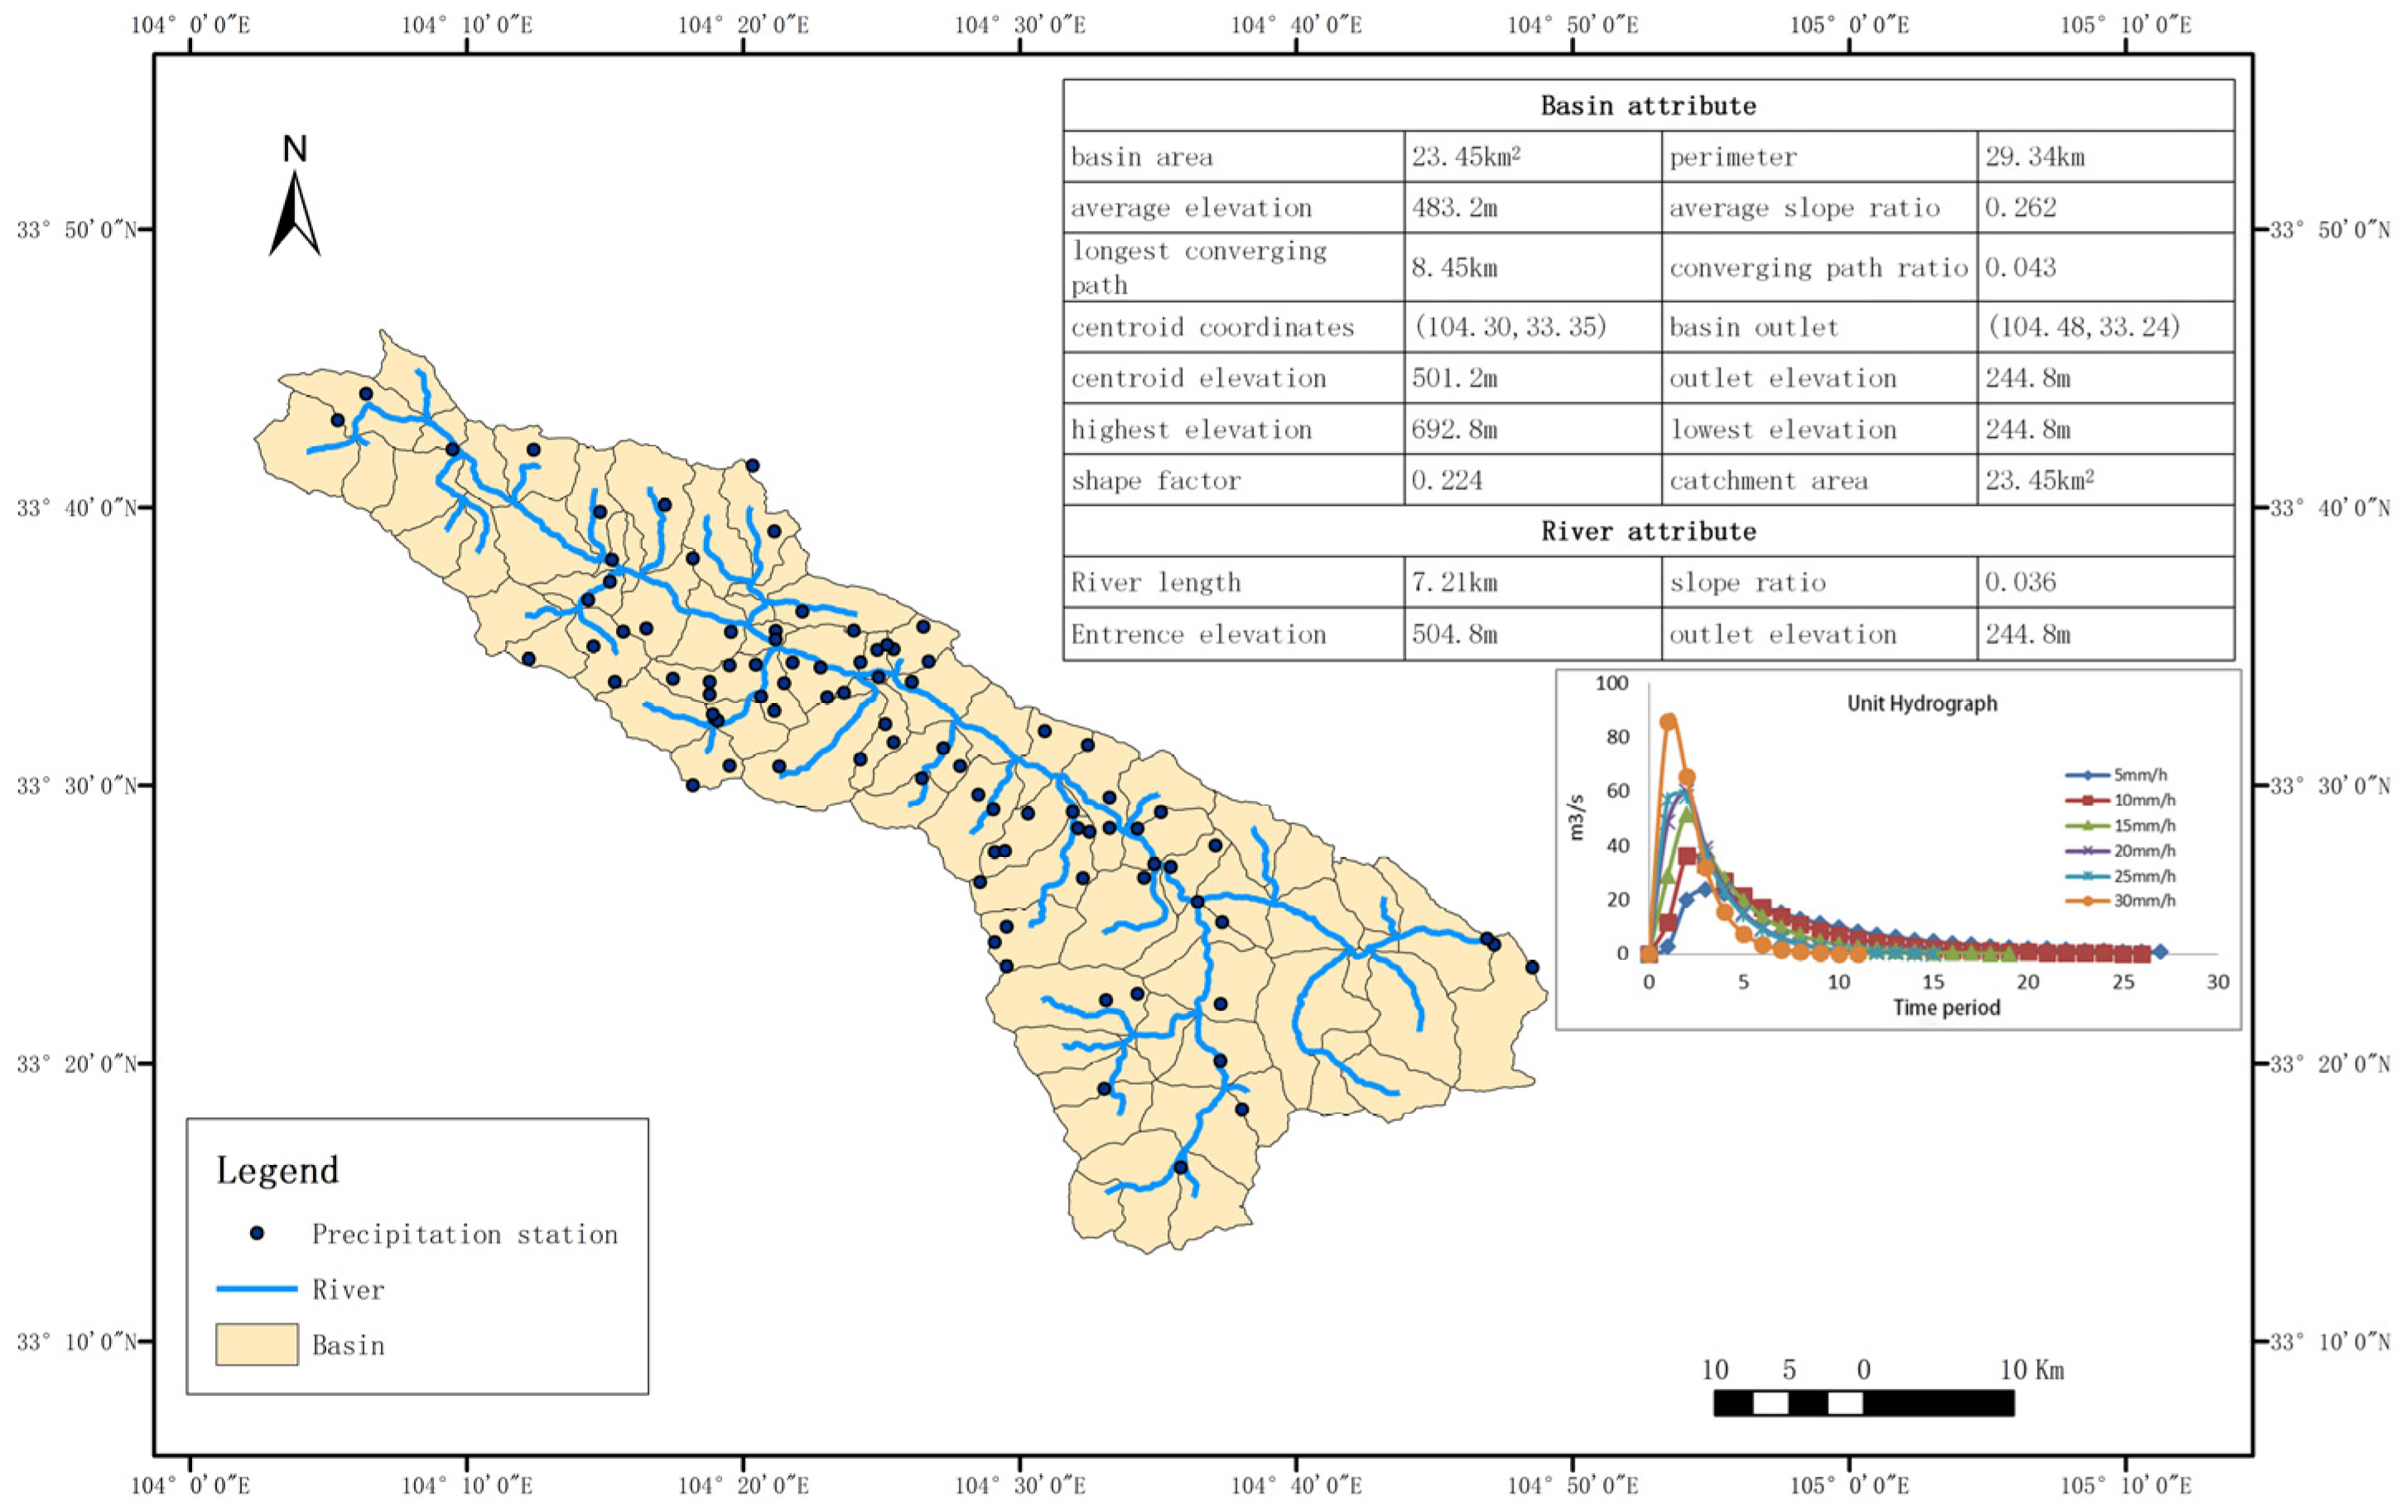
The preprocessing of model data is an indispensable part of the model application process. The supporting data for this study come from the “National Flash Flood Disaster Prevention and Control Project Basic Data Collection and Work Base Map Production Project”. Based on the river network data and underlying surface data, such as topography and landforms extracted from the high-precision DEM of Gansu Province, the province is divided into 34,900 small watersheds, with a total watershed area of 523,300 km2, and the small watershed area is between 10 and 50 km2, with an average area of 15 km2. Minxian County in the Longnan Mountains is used as an example to demonstrate the division of small watersheds (Figure 2). A total of more than 50 pieces of characteristic information in 4 categories and 20 subcategories were extracted for each small watershed, including basic attributes such as watersheds and river sections, underlying surface, and small watershed unit lines (Figure 2).
The input data sources used in this study are as follows: (1) The basic geographical data come from the National Geographic Center of China website [23]. The basic geographical information types mainly include high-precision DEM data (25 m), DOM data (2.5 m), and river networks data. (2) The soil texture data, land use, and vegetation types were derived from the “National Flash Flood Disaster Survey and Assessment Work Base Map”. The processing principle was to select the data with the largest proportion in the small watershed to represent the soil texture, land use, and vegetation-type attribute data. (3) The slope roughness and infiltration characteristics of the underlying surface of the small watershed were also derived from the “National Flash Flood Disaster Investigation and Assessment Base Map”. The small watershed slope roughness value was determined by applying land-use and vegetation-type data to analyze the corresponding relationship between land-use type and small watershed-slope roughness. The Infiltration data were determined by applying soil texture to analyze the corresponding relationship between soil texture and the infiltration characteristics of the small watershed. (4) The rainfall driving data come from the Gansu Provincial Hydrology Bureau. There are 5842 rainfall stations in Gansu Province that are used for the rainfall driving data of the CNFF model (Figure 3). (5) Hydrological data come from the Gansu Provincial Hydrological Bureau. There are 855 hydrological stations in Gansu Province, including 192 reservoir hydrological stations and 663 river hydrological stations (Figure 3).

2.3. CNFF Hydrology Model Principles and Methods

The CNFF model is a distributed hydrological model established based on the flash flood forecast and warning subsystem, which can quickly and efficiently simulate floods in river basins at different spatial scales and different climate types. The division of flash flood forecasting and early warning zones is based on the topological structure of the natural river basin water system, based on the principle of similarity of natural geographical conditions and hydrological characteristics within the zone, comprehensively considering climate conditions, topography, and landforms; and the distribution of water conservancy project construction, laying a data foundation for the parallel calculation of the CNFF mode [24]. It improves the flash flood simulation efficiency of the CNFF model and adapts to the hydrological and meteorological conditions in different regions. Its runoff-generation module covers a variety of runoff-generation methods, such as full storage, mixed runoff generation, and super seepage runoff generation. Considering that flash floods often occur in hilly areas with little or no data, the model independently developed a standardized unit line for topography that takes into account the impact of rain intensity and introduced a real-time rolling calculation method of river flood evolution parameters in areas with no data.

2.3.1. Runoff Module

Based on the national soil texture-type data set, the research team used unsaturated numerical simulation methods to calculate 12 standard soil infiltration characteristic parameters and the 6 h and 24 h maximum infiltration depths under flash flood conditions. Based on the wetness index SWI, an algorithm model library for three runoff production modes, namely saturation-excess runoff, infiltration-excess runoff, and mixed runoff, was implemented. When SWI ≥ 0.65, the algorithm library calls for the three water-source full-runoff method for calculation; when SWI < 0.20, the CNFF model calls for the super-seepage runoff method and the large house runoff method in the algorithm library to calculate based on the parameters of the actual area. When 0.20 ≤ SWI < 0.65, the spatiotemporal variable-source mixed-flow generation method in the algorithm library is required for calculation (Table 2).
The mode of mixed runoff with variable sources in space and time mainly includes plane mixing, vertical mixing, and period mixed runoff. The basic principle of planar mixed runoff generation is to divide topography and hydrological response units based on small watershed and underlying surface data, which are fast response units, slow response units, and delayed response units. Using soil infiltration-characteristic parameters and infiltration rate, hydrological response units are further divided into three types, namely fast, medium, and slow, and the division principles of hydrological response units in small watersheds and their main corresponding runoff generation modes are determined [25]; see Table 2 for details. The basic principle of vertical mixed runoff is to use the concept of the reservoir to generalize the water exchange between capillary water, gravity water, saturated water, and groundwater. The soil area where the capillary water is located is divided into the shallow soil area and the deep soil area in real time based on the soil moisture content and cumulative infiltration calculated per unit step. The shallow soil area is judged based on the real-time soil status of the unit time step simulated by the model. In the process of over-infiltration or full storage, the deep soil area uses saturation-excess runoff for simulation calculations. The basic principle of period mixed runoff production is the soil water redistribution model, which simulates and calculates the soil water infiltration process in the vadose zone. The Green–Ampt model is used in the CNFF model, which has a small amount of calculation and high calculation accuracy, and is widely used in the calculation of infiltration and infiltration-excess runoff surface runoff [26,27,28].

2.3.2. Convergence Module

The CNFF model convergence module uses the GIUH. The concentration velocity of every cell is derived based on the DEM and land use. Rainfall intensity, which is the main factor that influences velocity, is considered in the method as follows [6]:
v = k s 0.5 i n
where k is a coefficient that is determined by land use, s is the slope of a sub-basin or cell, and i is the rainfall intensity. Moreover, n is a constant which represents the value of the influence of rainfall intensity on the velocity, according experience, n = 0.4 [6].

2.3.3. River Routing

The CNFF model uses the Muskingum method to calculate river flood evolution. For areas without data, the river cross-section shape is summarized into three shapes based on actual conditions, namely parabola, triangle, and rectangle. This method comprehensively considers the river cross-section shape and the upstream water process, greatly simplifies the complex process of river evolution, and achieves rapid real-time rolling calculations [6,29]. The parameters are calculated using physical characteristics of the channel and floods [29]:
k = 0.69 n 0.6 P 0.4 L 3600 Q 0 0.2 i 0.3 x = 0.5 0.35 Q 0 0.3 n 0.6 i 1.3 P 0.8 L ,   for   parabolic   channel   cross   section k = 0.75 n 0.6 P 0.4 L 3600 Q 0 0.2 i 0.3 x = 0.5 0.375 Q 0 0.3 n 0.6 i 1.3 P 0.8 L ,   for   triangular   channel   cross   section k = 0.6 n 0.6 P 0.4 L 3600 Q 0 0.2 i 0.3 x = 0.5 0.3 Q 0 0.3 n 0.6 i 1.3 P 0.8 L ,   for   rectangular   channel   cross   section
where L is the channel length, n is the roughness, P is the wetted perimeter, and i is the slope. Q 0 is the reference flow, which is a function of the channel lowest flow and flood peak flow during one simulated flood event. The Muskingum parameters vary for different river segments and different flood events when the river routing process is simulated by the CNFF. The physical characteristics of the river segments are obtained from DEM or surveys.

2.4. Evaluation Criteria

The evaluation of the simulation effect of the CNFF model uses three indicators, the certainty coefficient (Nash–Sutcliffe, NES) [30], the flood peak relative error (REQ), and the peak occurrence time error (ET), which are currently widely used in hydrology. The certainty coefficient is used to evaluate the overall simulation prediction level of the model, ranging from 0 to 1. Generally, a value greater than 0.9 indicates a high degree of fit between the flood simulation forecast process and the measured flow process and is recognized as a Class A forecast scheme. The relative error of the flood peak is used to evaluate the relative difference between the simulated peak value and the measured peak value. If the value approaches 0, it means that the difference between the simulated value and the actual value is very small, and the simulation effect is very ideal. The error of the peak time is used to evaluate the difference between the simulated flood peak arrival time and the actual flood peak arrival time. If the value approaches 0, it means that the simulated flood arrival time is consistent with the actual flood peak arrival time. The specific formula is as follows [29]:
N S E = 1 i = 1 n   Q o b i Q s i m i 2 i = 1 n   Q o b i Q o b s ¯ 2
R E Q = Q o , p Q s , p Q o , p
E T = T o , p T s , p
where Qobi is the observed flow sequence (m3/s), Qsimi is the simulated flow sequence (m3/s), Q ¯ o b s  is the average measured flow rate (m3/s), Qo,p is the measured peak flow rate (m3/s), Qs,p is the simulated flood peak flow (m3/s), To,p is the measured flood peak arrival time (h), and Ts,p is the simulated flood peak arrival time.

3. Results and Analysis

3.1. Hydrological Model Construction

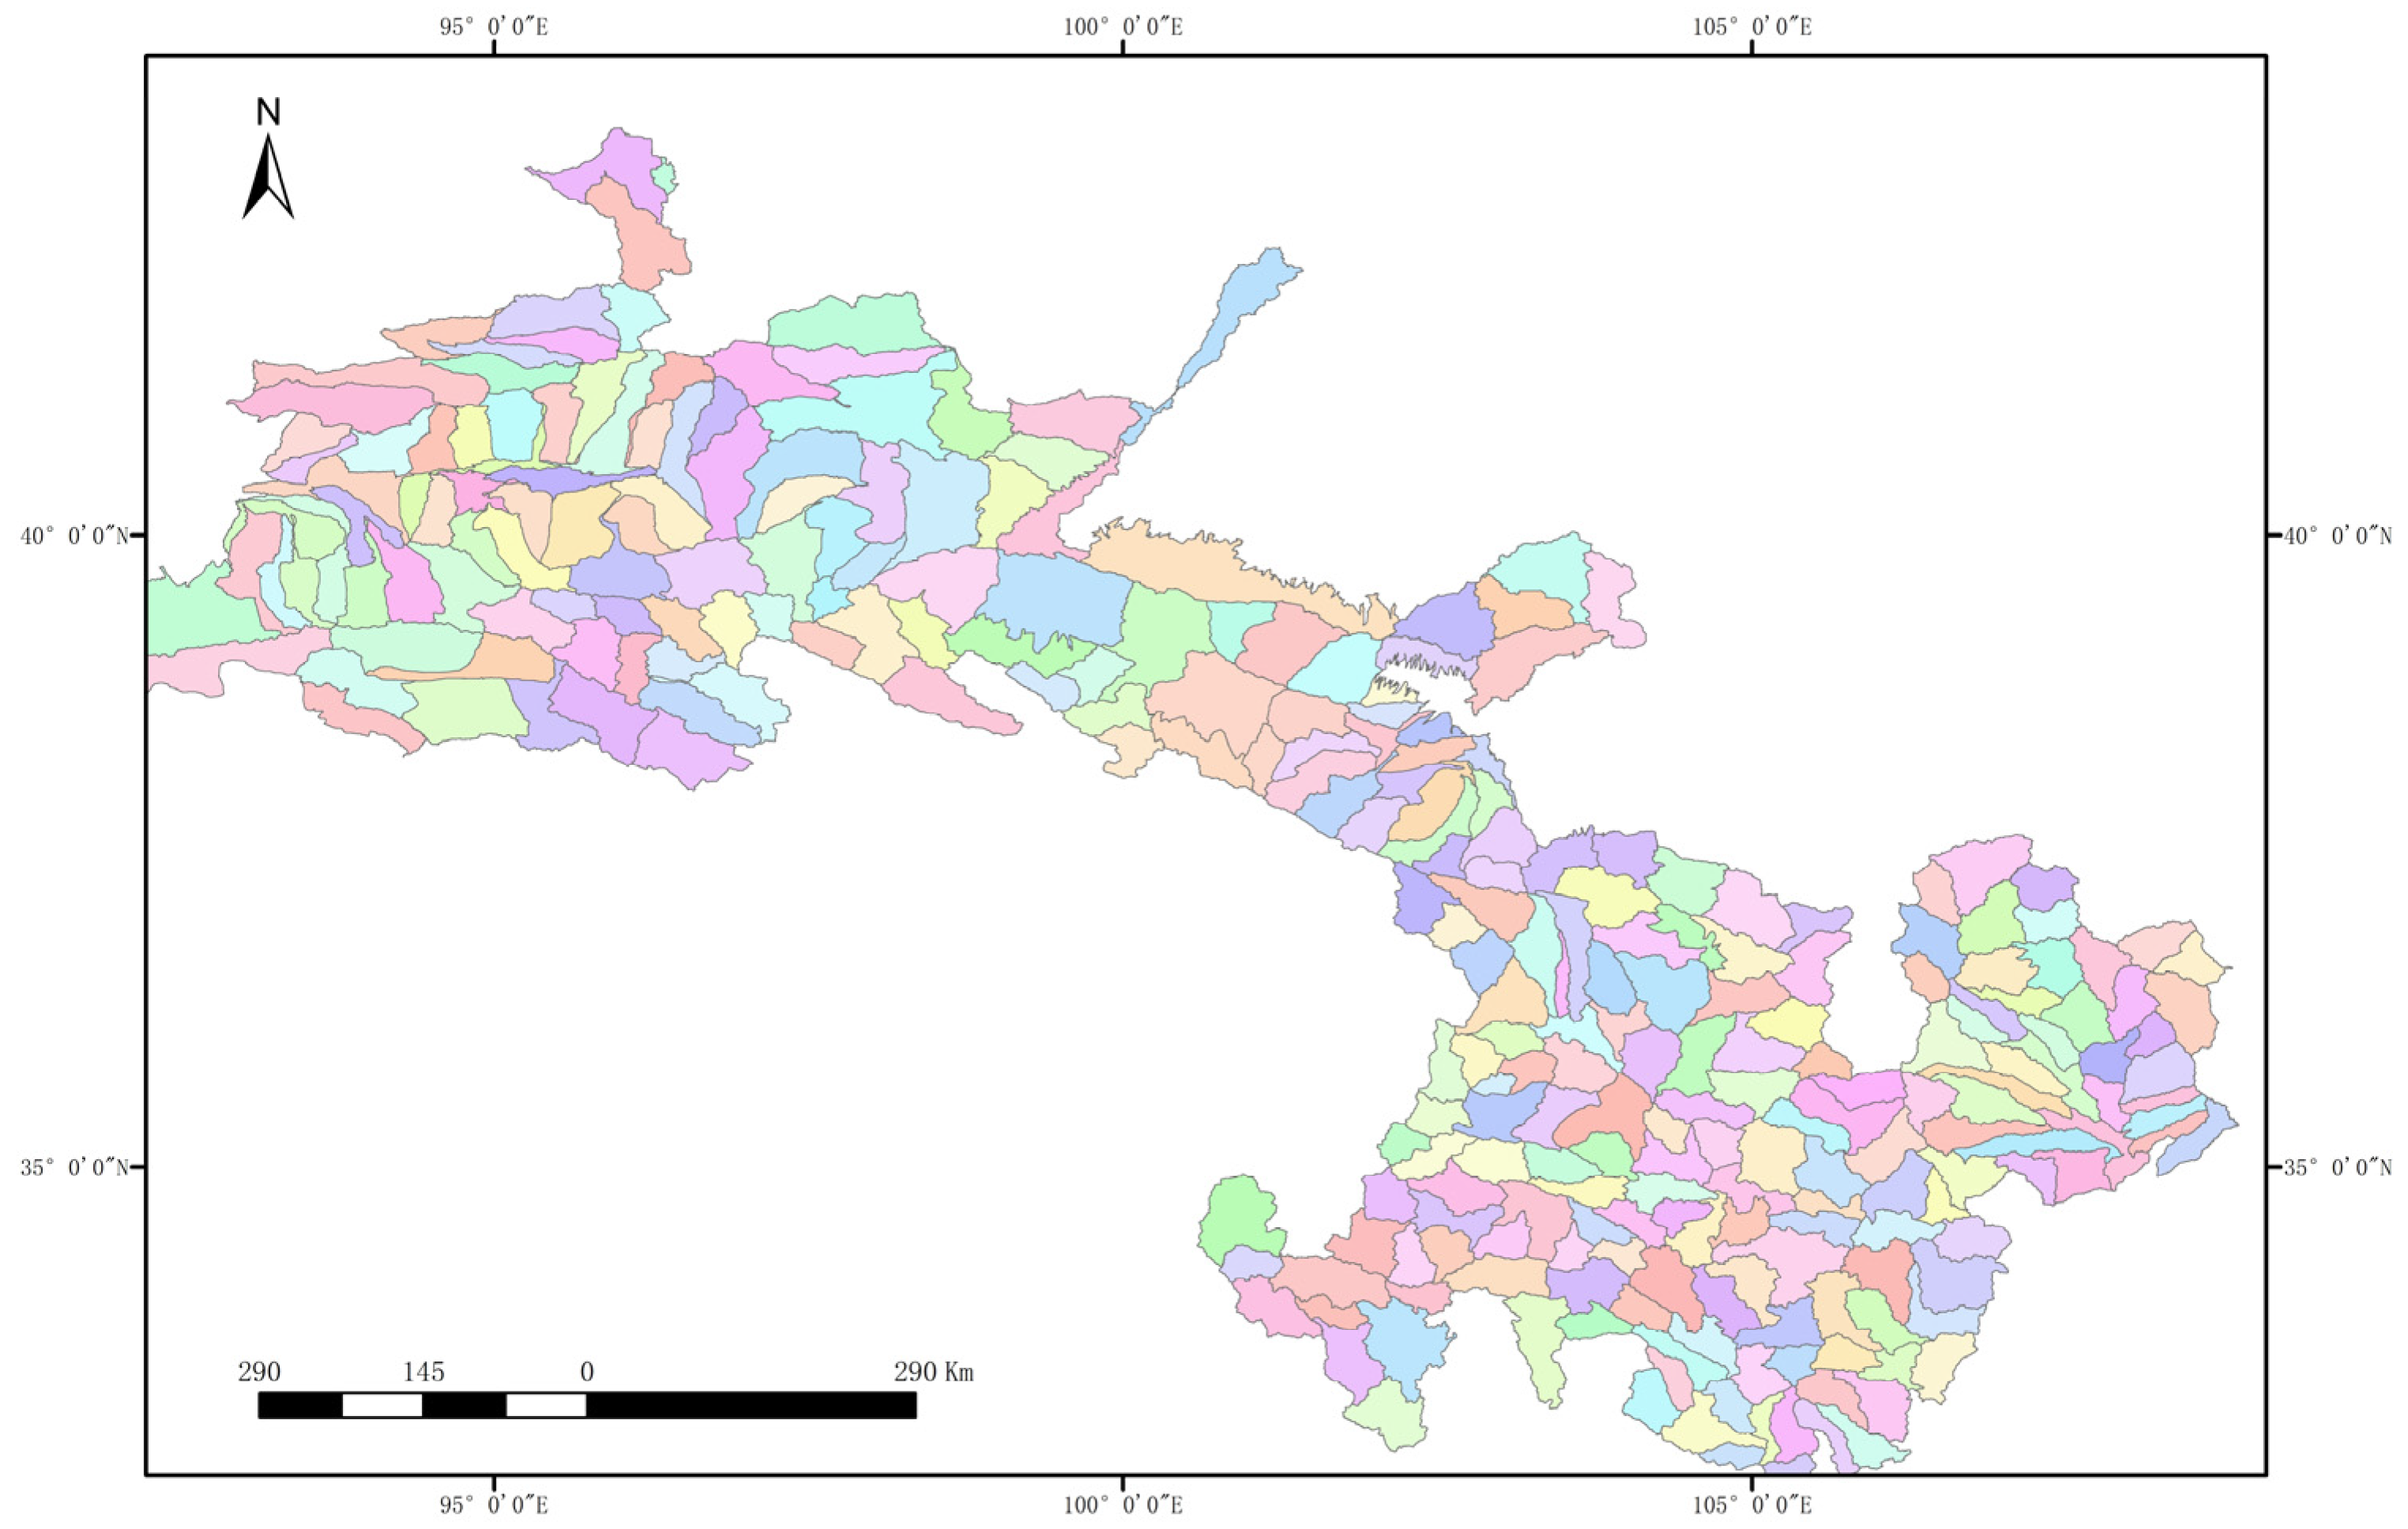
The first-level partition (cluster) of the CNFF model takes the second-level water system in Gansu Province as the main reference basis and comprehensively considers the effects of the second-level hydrological partition, three major steps, underlying surface characteristics, and construction projects to achieve rapid flood parallel simulation calculations. Based on the abovementioned model cluster construction basis, Gansu Province is divided into 11 model clusters. The inland river basin includes the Shule River model cluster, Sugan Lake model cluster, Heihe model cluster, and Shiyang River model cluster; the Yellow River basin includes the Taohe model cluster, Huangshui model cluster, Yellow River model cluster, Weihe model cluster, and Jinghe model cluster. Finally, the Beiluo model cluster and the Jialing River model cluster are in the Yangtze River basin (Table 3). The scope of each model cluster is shown in Figure 4. On the basis of model clusters, the model range is further divided based on the similarity of underlying surface characteristics. Each distributed system is established through seven types of hydrological elements (small watershed, river section, node, reservoir, water distribution, water source, and depression) and six major hydrological processes (rainfall, evaporation, runoff, confluence, river evolution, and reservoir regulation and storage). A total of 289 distributed hydrological models were constructed based on the topological relationships of the basin water system within the hydrological model.
There are no hydrological stations in the Sugan Lake and Beiluo River systems, and parameter calibration and verification cannot be carried out, so this study did not consider the simulation of this water system. In order to reflect the simulation conditions of the nine major river systems, basins were selected for research and analysis based on conditions such as even distribution of rainfall stations in the basin and complete hydrological data. The specific locations are shown in Figure 5. Through the analysis of meteorological and hydrological conditions in Gansu, the average annual potential evaporation in the study area is large, rainfall is relatively low, and the distribution within and between years is uneven. The soil moisture index in most areas of the study area is in the range of 0.20 ≤ SWI < 0.65, and the climate type is semi-humid and drought. According to the actual regional climate conditions, the CNFF model calls for the spatiotemporal variable-source mixed-runoff method in the algorithm library to construct a distributed hydrological model [29], which mainly includes plane mixing, vertical mixing, and period mixed runoff.

3.2. Sensitivity Analysis

CNFF model parameters are divided into three categories: input parameters, initial parameters, and calibration parameters. Among them, input parameters refer to input data that can be obtained directly through data or land use, soil type, and hydrological zoning maps. Such parameters are input at the initial stage and remain unchanged during the subsequent model parameter adjustment process; the second type of parameters are initial parameters, which are initial values set according to the actual situation before the model is run; and the third type of parameters are those with physical meaning model parameters. Such parameters are determined through corresponding data, including soil type, land use, hydrogeological zoning, terrain moisture index map, water holding capacity, plant root depth, evaporation limit burial depth, soil permeability coefficient, etc., and then the parameters are calibrated. Since the CNFF model involves a large number of parameters that need to be calibrated, it is difficult to ensure the accuracy of all parameters at the same time, so it is very necessary to conduct parameter sensitivity analysis. By evaluating the sensitivity of parameters, the number of model parameters that need to be adjusted for parameter rate timing is reduced, and sensitive parameters that affect simulation accuracy are selected for parameter calibration [31,32,33,34].
This paper adopts the RSA method [35], selects nine watersheds in the study area for parameter sensitivity analysis, and selects three flood events for analysis. Three indicators, NSE, REQ, and ET, were selected to conduct multiple sensitivity analyses on the parameters. Since the results of the sensitivity analysis of model parameters for different objective functions (C) are different, this paper not only considers the objective function individually but also uses a trade-off method to construct a combined objective function, and it sensitizes the model parameters by considering the characteristics of each objective function. The sensitivity analysis is specifically as follows (4):
C = ω 1 ( 1 N S E ) + ω 2 R E Q
In the above formula, C is the combined objective function, and w1 and w2 are the trade-off coefficients of different objective functions. Since the above two objective functions are of equal importance, the values of w1 and w2 are both 1/2.
In this study, the nonlinear flow generation method was selected for model simulation, and the calibration parameters associated with linear flow generation were not considered. Therefore, there are 12 model parameters involved in the calibration. Assuming that the model parameters are uniformly distributed, use Monte Claro in CNFF
The model parameters were sampled within the feasible range (1000 times), and 1000 sets of parameter values were obtained. Then, the values were imported into the CNFF model for simulation calculation, and the objective function value and combined objective function value were calculated based on the simulation results. The objective function standard is used as the basis for distinguishing between samples that have done something and those that have done nothing, specifically: NSE > 0.7, REQ < 0.3, ET < 3 h, C < 0.3. According to the sample data results of action and inaction, the cumulative distribution curve of each parameter is calculated, respectively, and G(x) and U(x) are obtained. Kolmogorov–Smirnov (K-S) is used to test the fitting degree of the cumulative function of samples with and without action [35], specifically as follows (5):
D = m a x | G ( x ) U ( x ) |
In the above formula, G(x) and U(x), respectively, represent the cumulative distribution curve of parameter x in the sample and the cumulative distribution curve of parameter x in the sample without. D represents the maximum vertical distance of the x parameter between the two cumulative distribution curves. In the K-S test, the selected significance level (α) is 0.05, the null hypothesis can be expressed as H 0 G ( x ) = U ( x ) , and the alternative hypothesis is expressed as H 1 G ( x ) U ( x ) . If p ≤ 0.05, the null hypothesis (H0) is rejected; that is, the parameter is sensitive. According to the relative sensitivity, it can be divided into four categories: highly sensitive (D > 0.2, p ≤ 0.05), medium sensitive (0.1 ≤ D ≤ 0.2, p ≤ 0.05), relatively sensitive (D < 0.1, p ≤ 0.05), and insensitive (p ≥ 0.05) [36].
According to the above method, a table of model parameter sensitivity results for different objective functions was obtained (Table 4) in which three asterisks indicate high sensitivity, two asterisks indicate moderately sensitive parameters, one asterisk indicates mild sensitivity, and no asterisks indicate insensitive. When the objective function is the statistical objective function NSE, the parameters with high sensitivity are Satv, and the parameters without sensitivity are Expnonliner, SG Exp, Cfast_sq, CG, and CGSink. When the objective function is the flood characteristic objective function REQ, there are no highly sensitive parameters, and the insensitive parameters are SoilMax, SoilGMax, Cslowsq, CG, and CGSink. When the objective function is the flood characteristic objective function ET, there are no highly sensitive parameters, and the insensitive parameters are Cnonliner, RsoilMax, Soilmax, SoilCMax, SGEexp, Cslowsq, CG, and CGSink. When the objective function is based on C, the highly sensitive parameter is Satv, and the insensitive parameters are SoilGMax, Cslowsq, CG, and CGSink. In summary, it can be seen from the above results that the parameters with higher sensitivity in the CNFF hydrological model are gravity and priority flow reservoir water storage capacity, coefficients in the nonlinear runoff generation algorithm, the maximum possible runoff generation area ratio, etc., indicating that the type of vegetation and soil in the study area has a greater impact on the simulation results of the CNFF hydrological model. From the perspective of each hydrological module in the CNFF hydrological model, the sensitivity of the relevant parameters of the soil module is higher than that of the groundwater module. This shows that the groundwater in the study area has little influence on the simulation of the overall runoff process, the base flow is relatively stable, and the changes in runoff are mainly reflected in surface runoff and mid-soil flow.

3.3. Model Calibration

According to the results of the sensitivity analysis of model parameters, parameters were calibrated for the watersheds in the study area, namely the Changmabao Watershed of the Shule River System, the Fengle River Basin of the Black River System, the Jiutiaoling Watershed of the Shiyang River System, theXiangtang basin of Huang River system the Jingchuan Basin of the Jing River system, the Qin’an Basin of the Wei River system, and the Sanjiaji Basin of Tao River system and the Huangluba Watershed of the Jialing River system is shown in Figure 5. The calibration parameter results of the nine watersheds are shown in Table 5.

3.4. Model Discussion

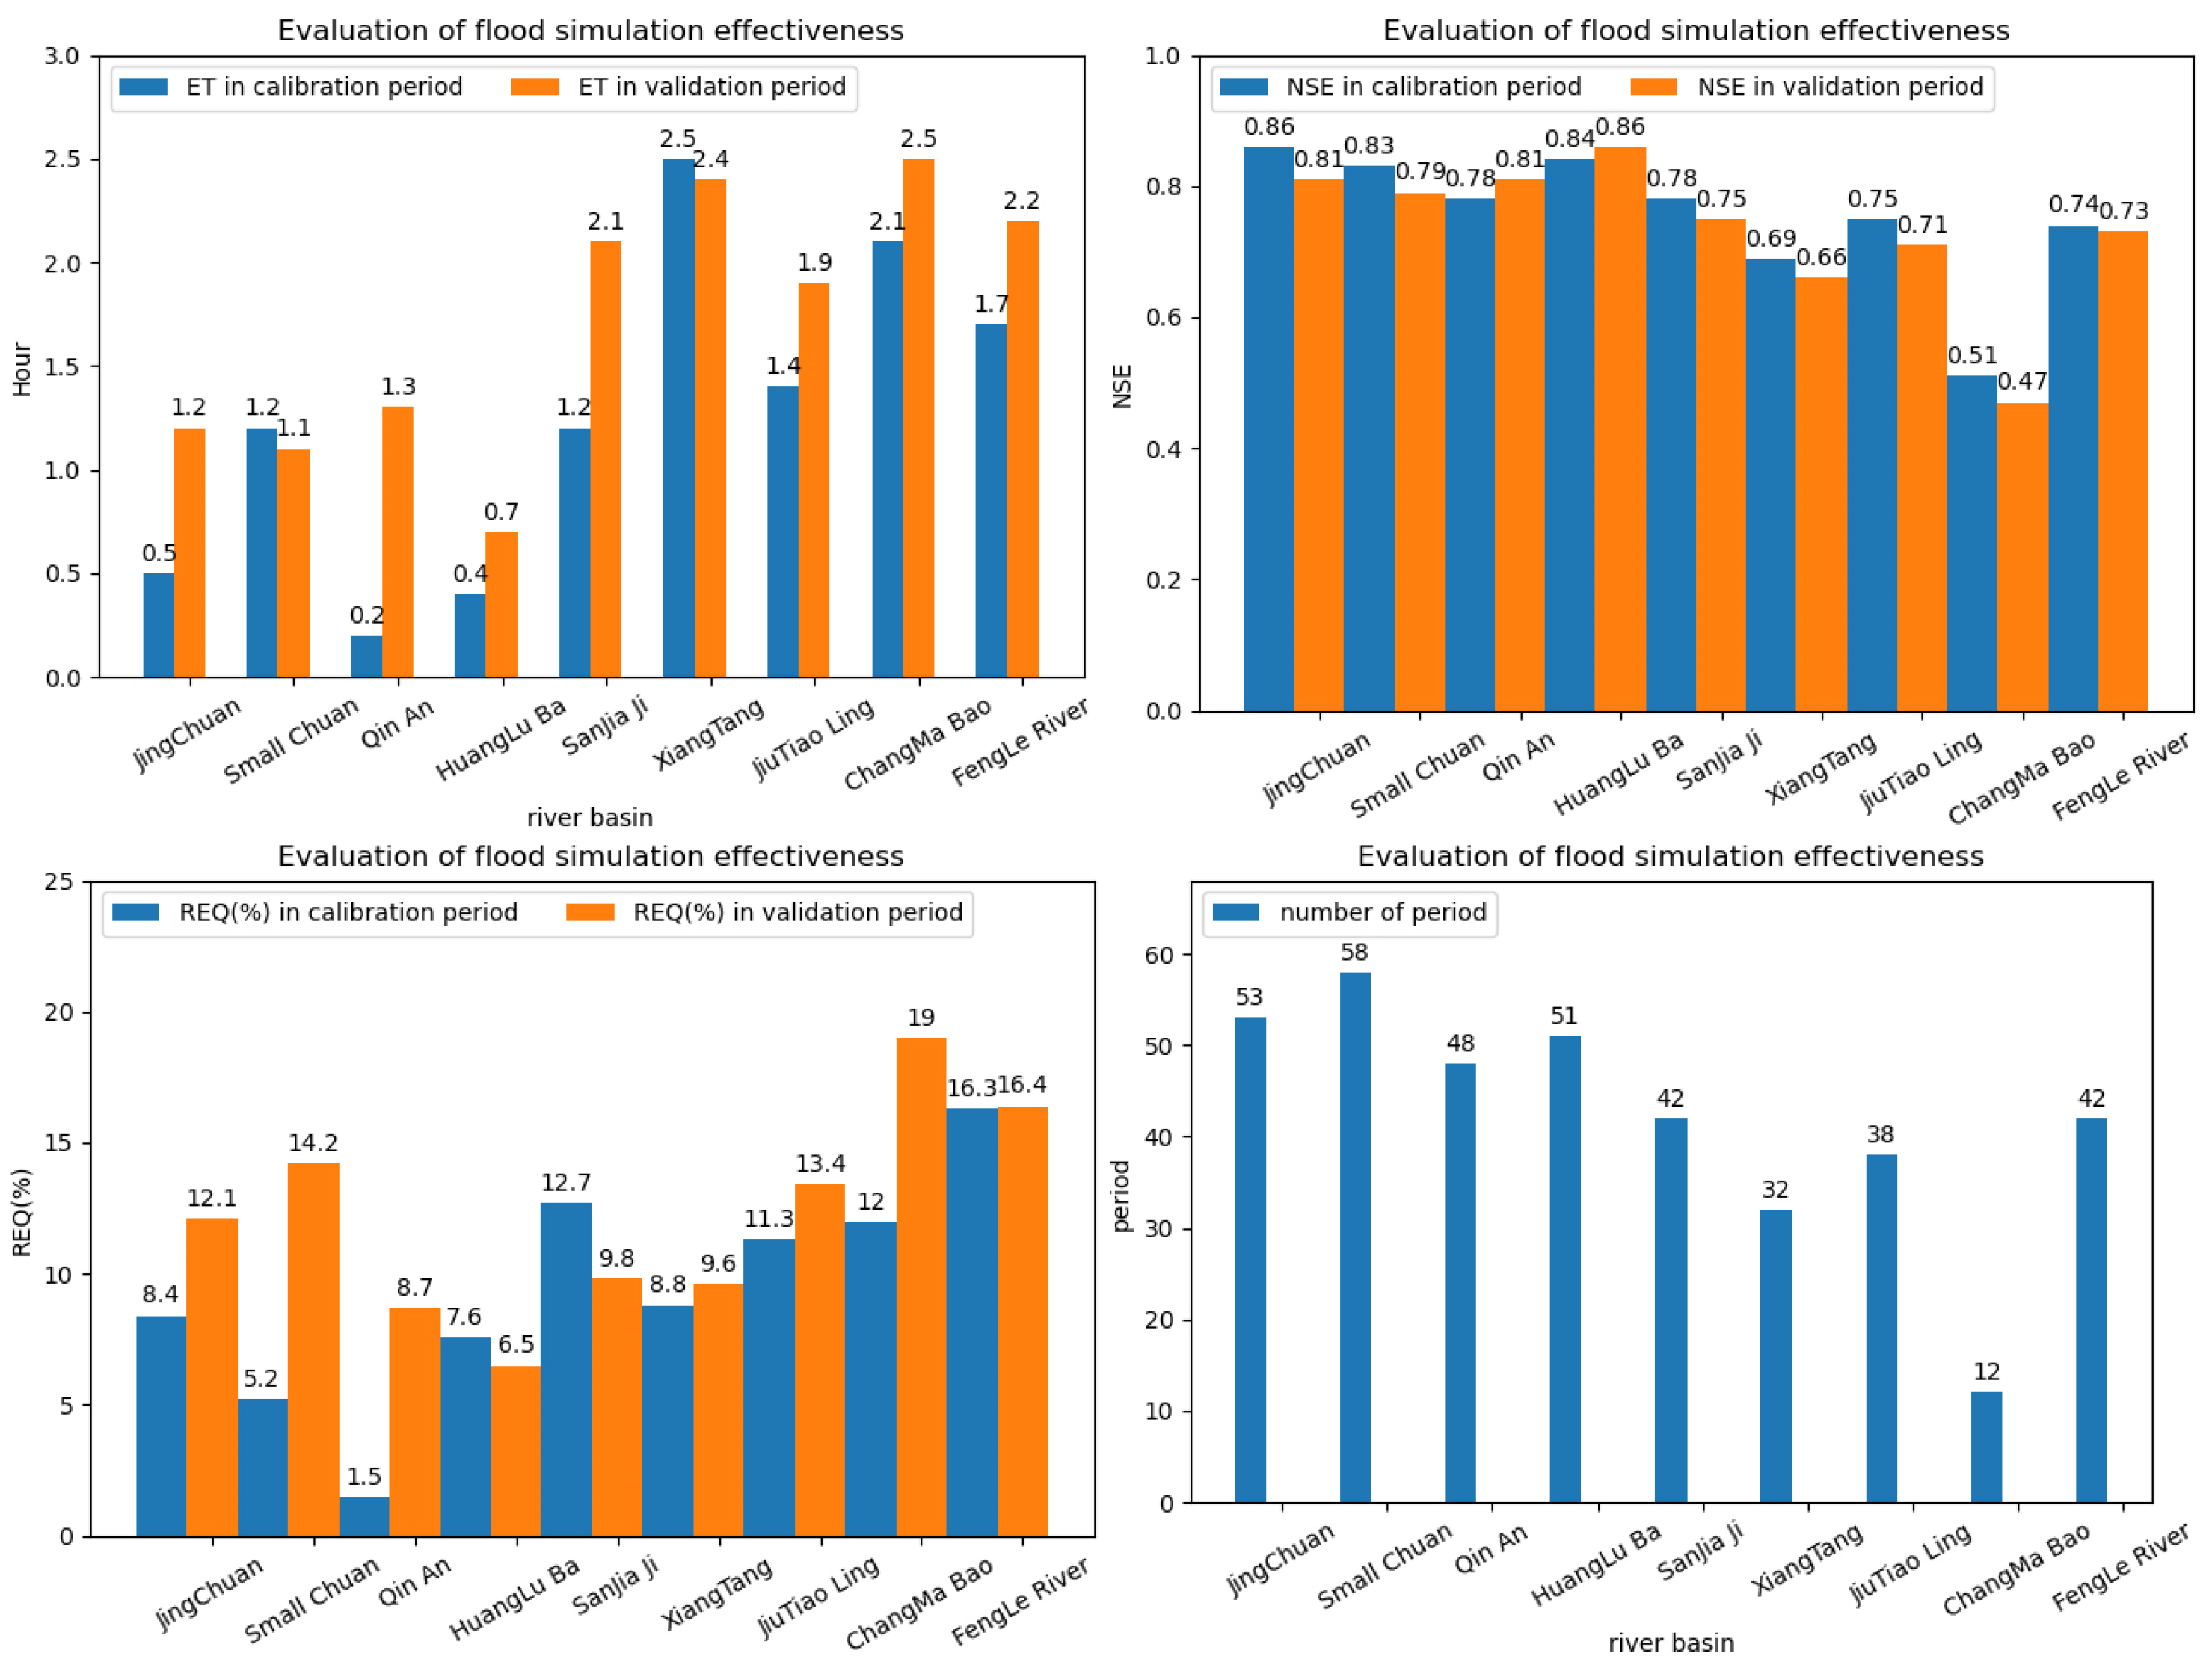
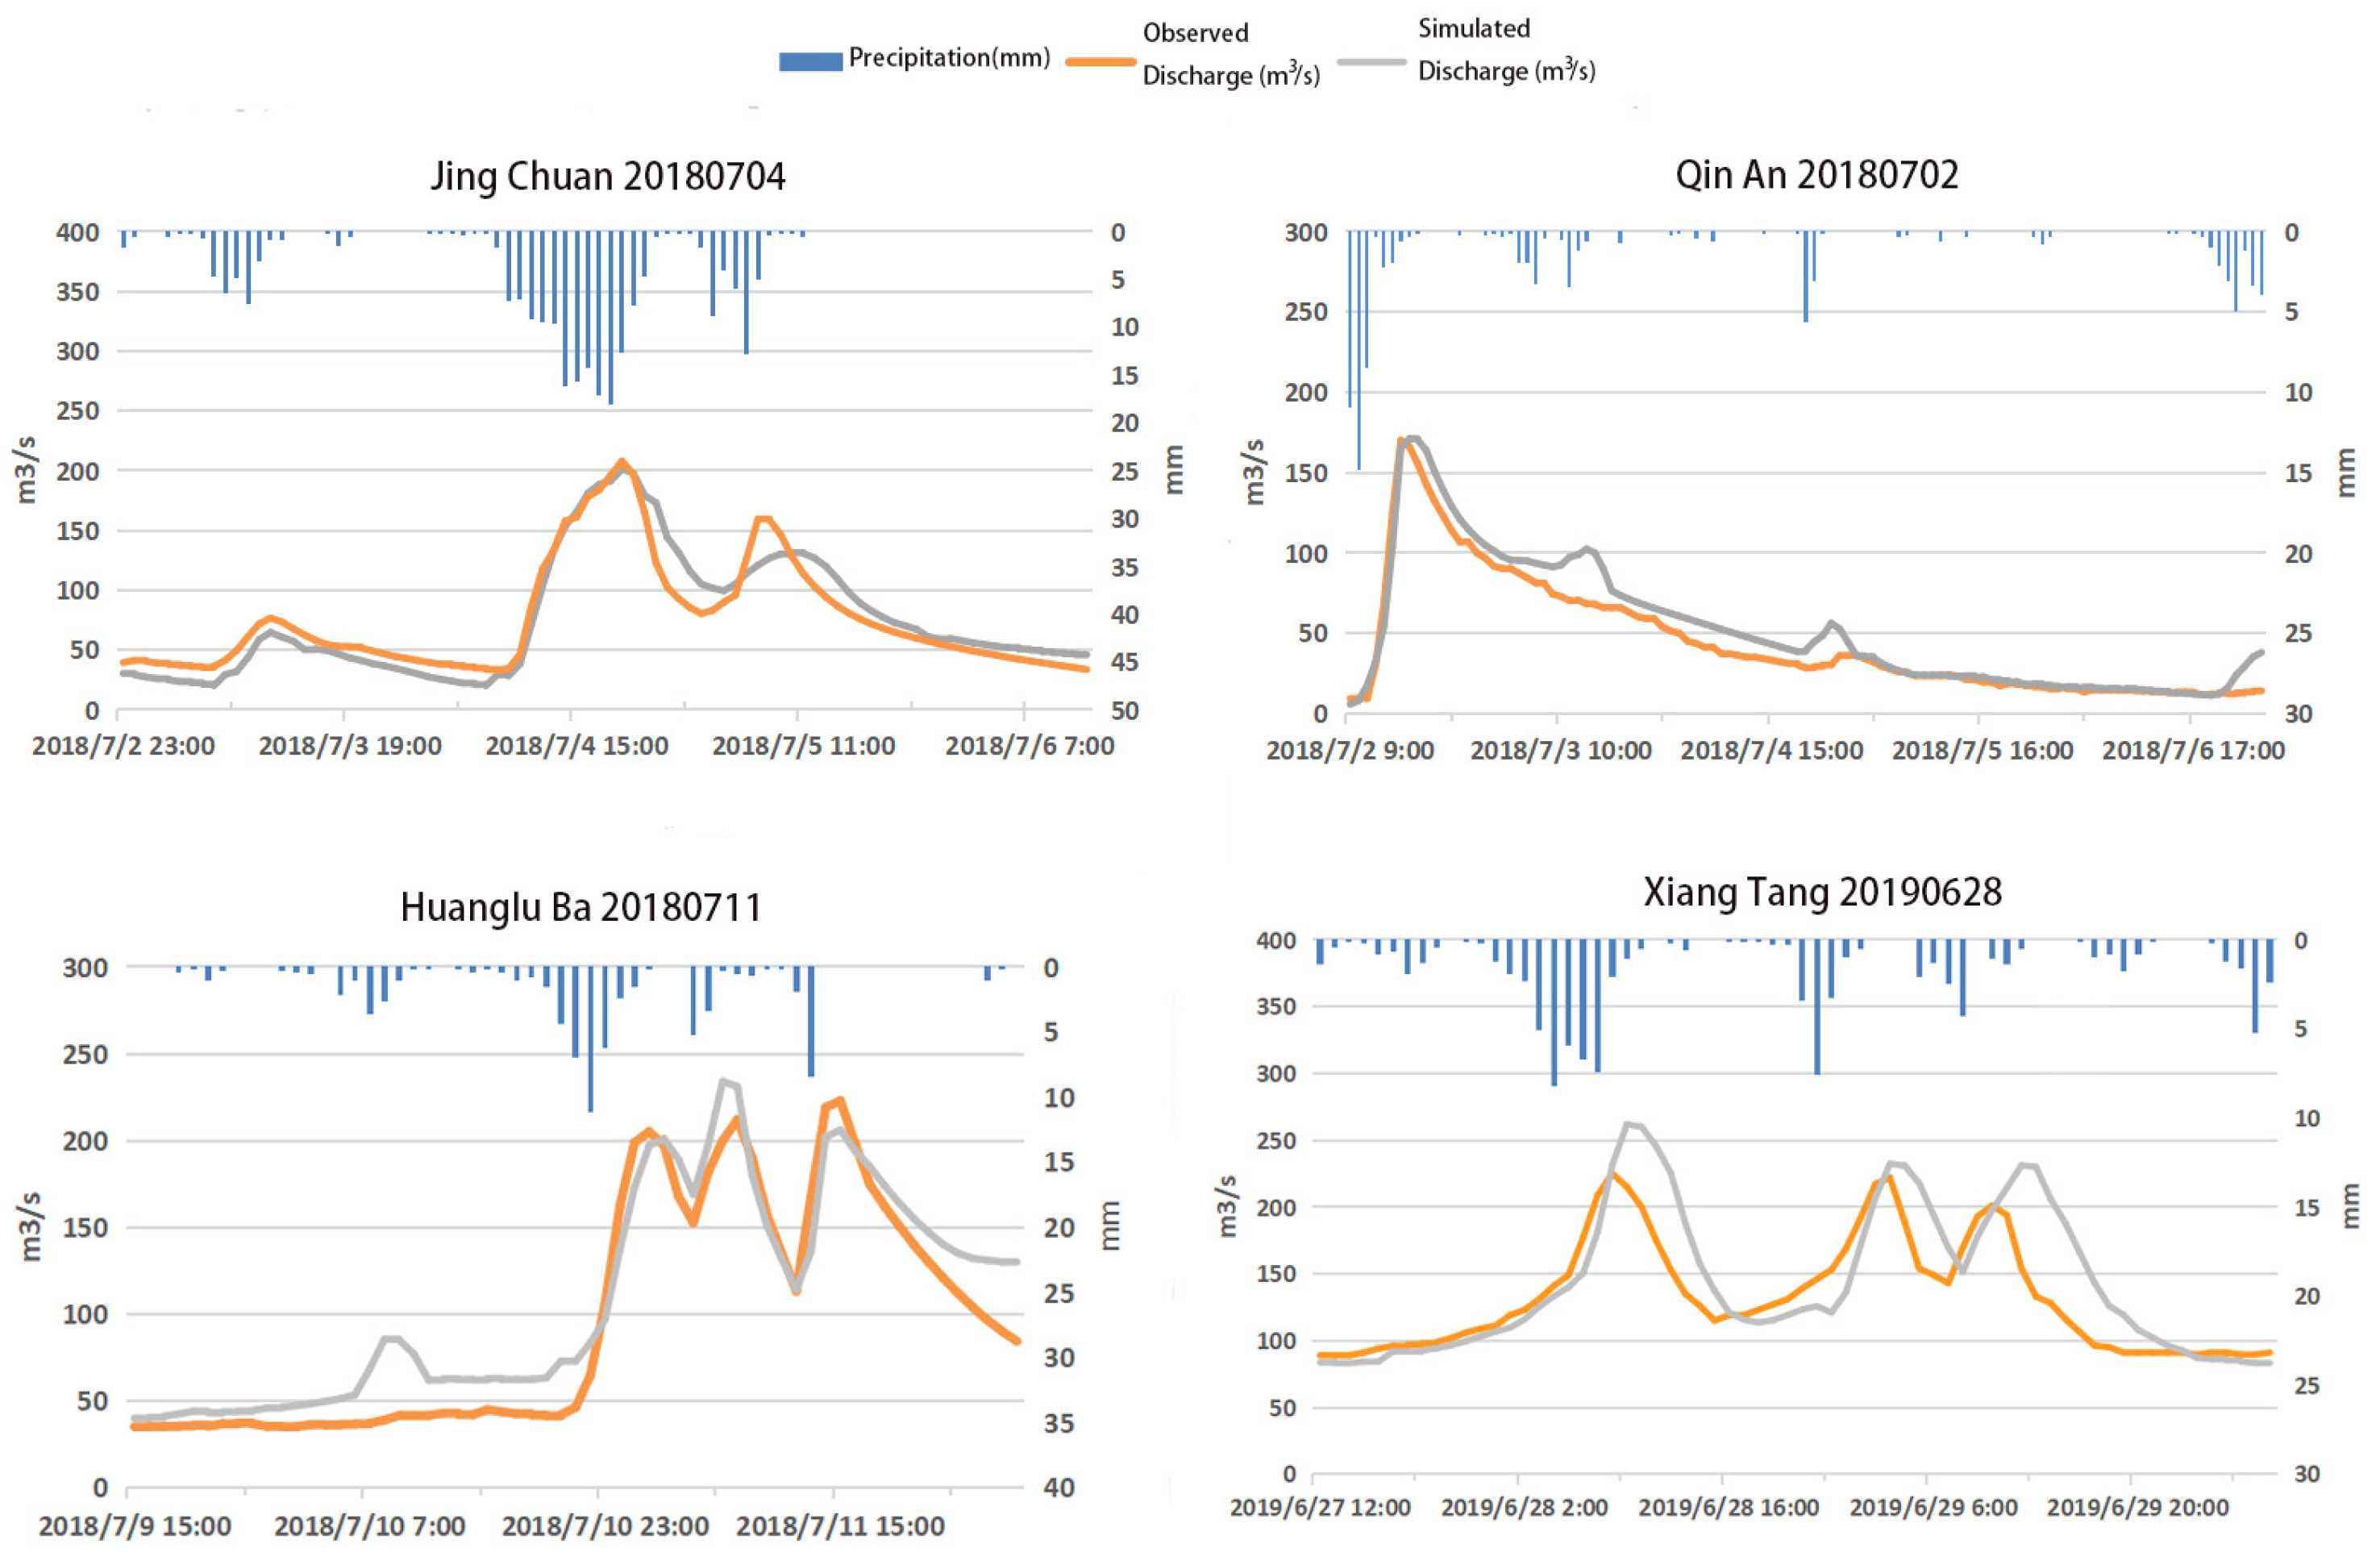
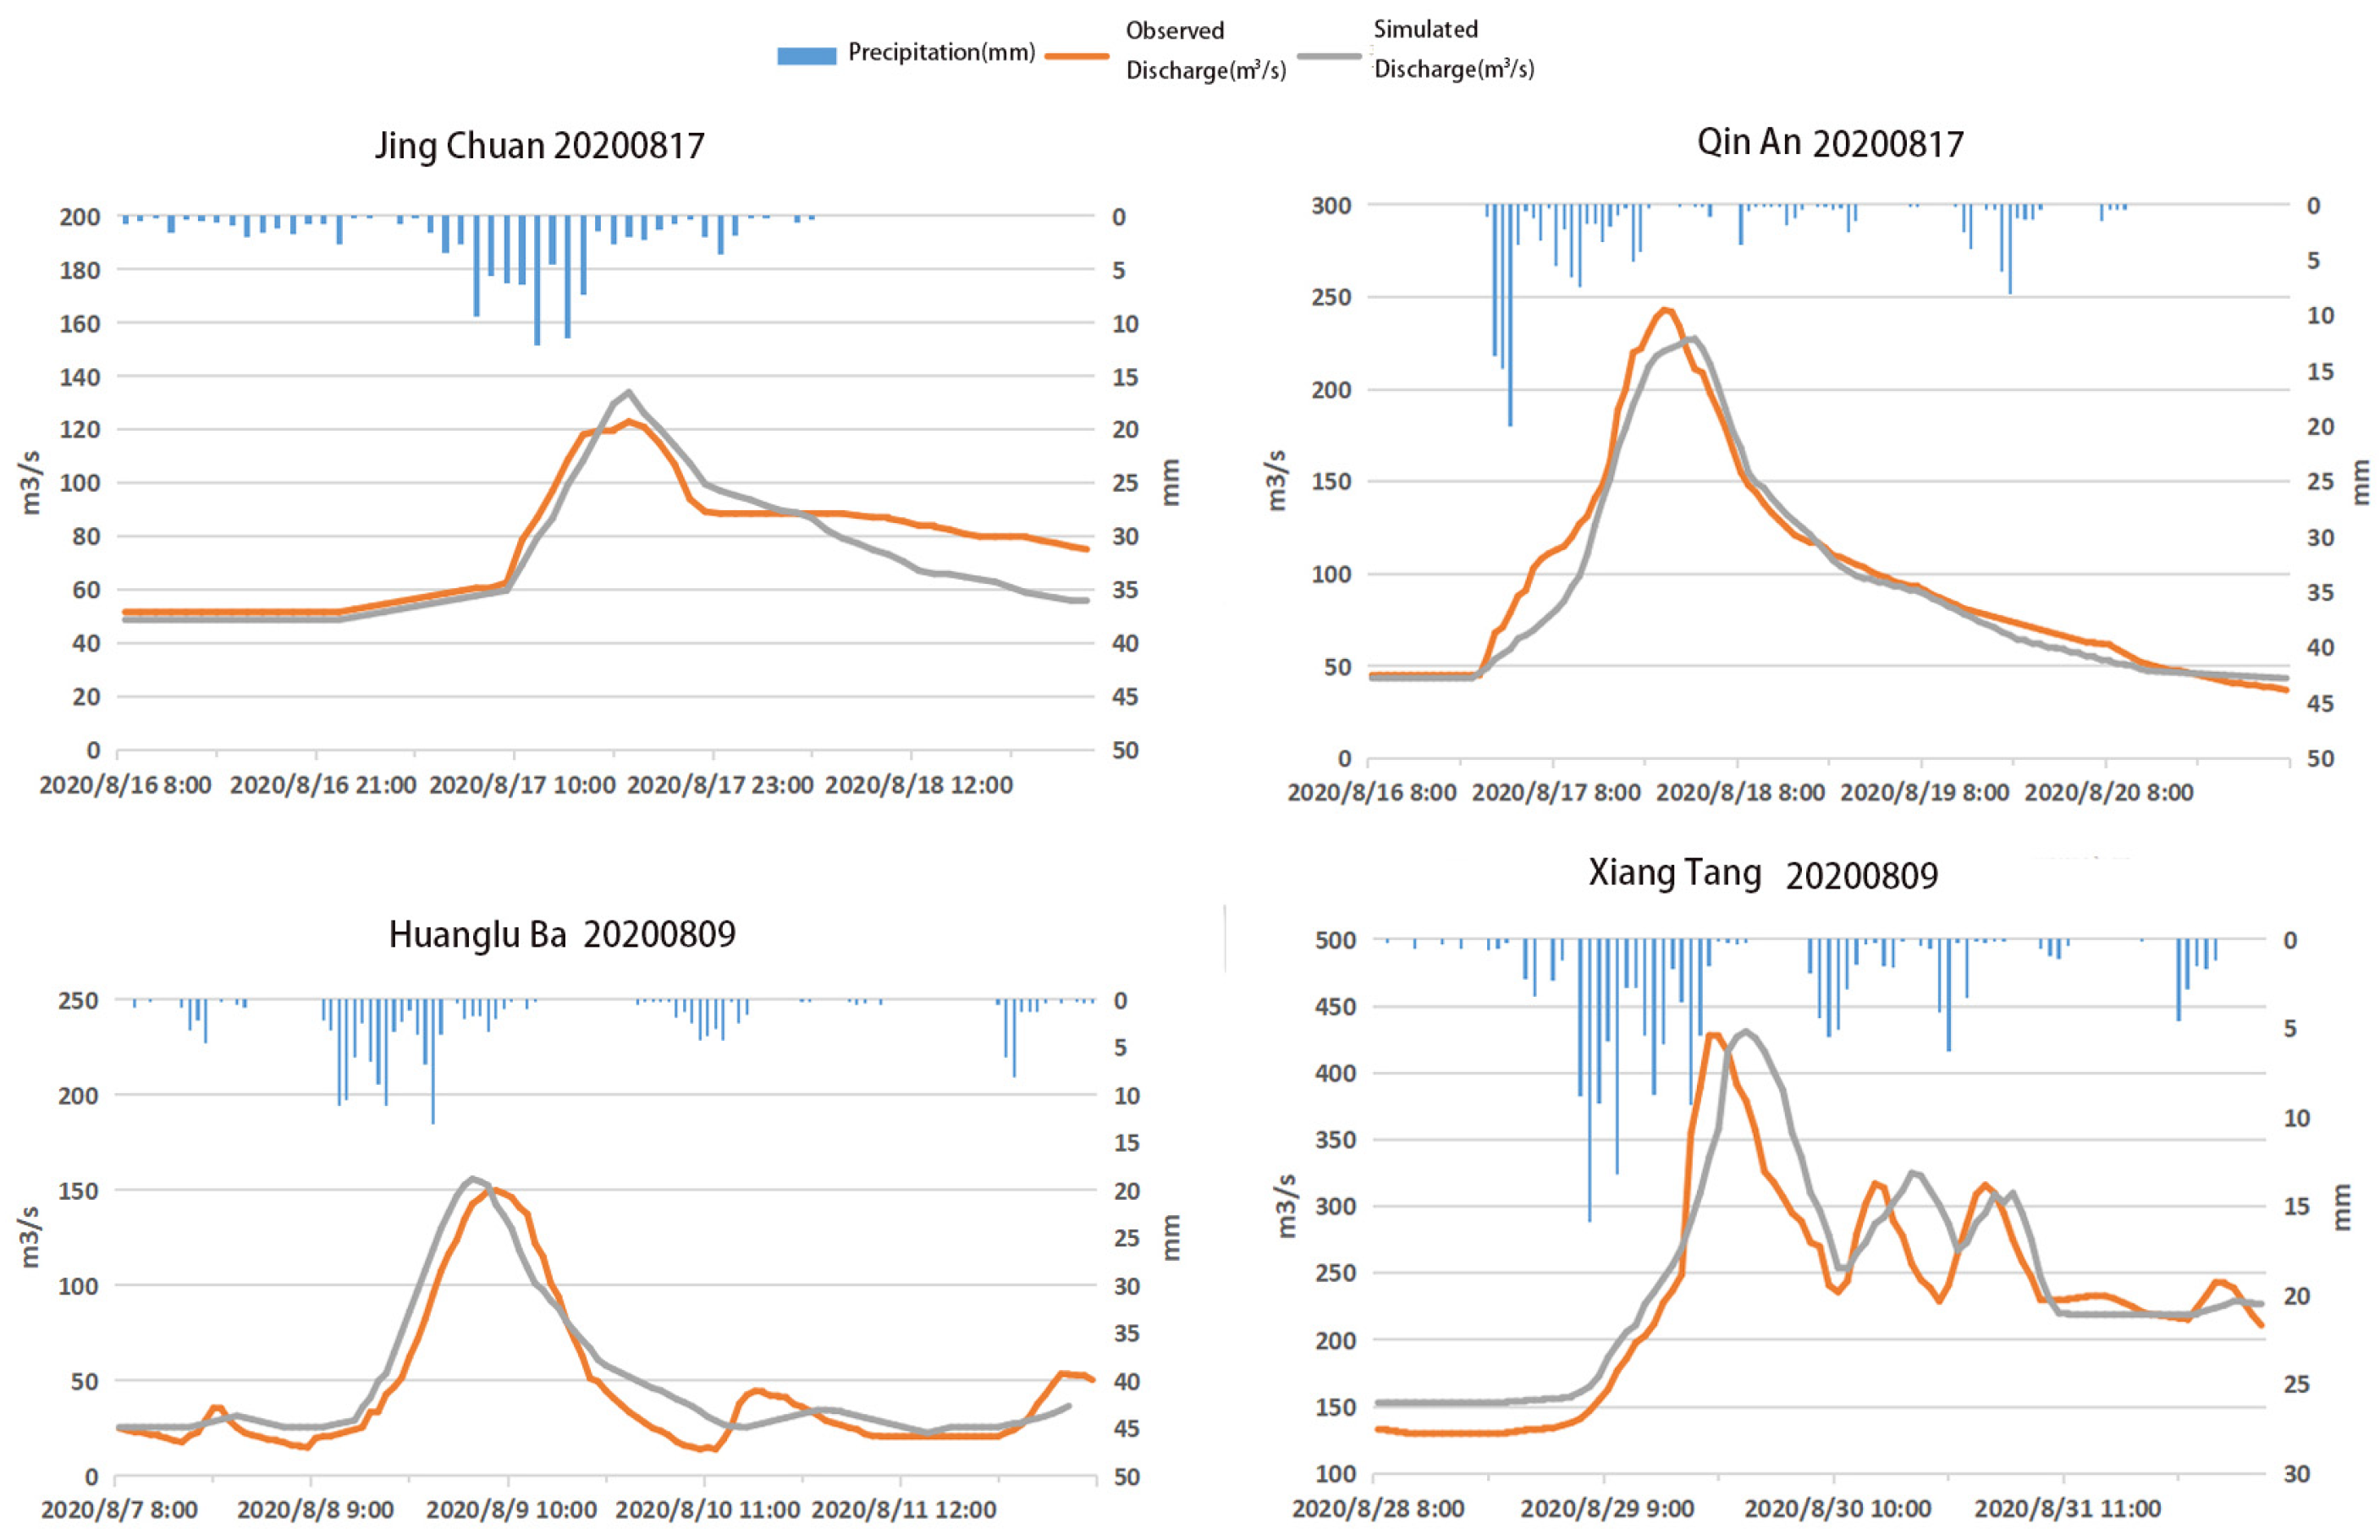
Based on the analysis of the application effects of 318 floods in the above nine basins, the average certainty coefficients of all basin rates in the study area during the regular and verification periods are 0.76 and 0.73; the average peak flow errors are 9.1% and 12.6%, respectively; and the average peak flow time errors are 1.2 h and 1.7 h. Table 5 shows the results of the flood simulation effect evaluation in nine basins. Figure 5 and Figure 6 show the regular results of partial basin rates and the verification period results of partial basins, respectively.
It can be seen from the results that the simulation results in the Jinghe River, Yellow River, Weihe River, and Jialing River basins are relatively good. The certainty coefficients in the regular rate and verification periods are both around 0.8, and the relative error of the peak flow is controlled at around 10%. The peak time error is within 1 h. The simulation results in the Taohe, Huangshui, Shiyanghe, and Heihe River basins are average. The certainty coefficients in the rate period and verification period are around 0.7, the relative errors in peak flow are around 10–15%, and the peak time errors are around 1.5 h. The simulation effect of the Shule River Basin is not ideal. The deterministic data of the rate period and the verification period are about 0.5. The relative error of the flood peak flow varies greatly. The rate period is 12%, the verification period is 19%, and the peak time error is about 2 h. Part of the calibration and verification results are shown in Figure 7 and Figure 8. The floods in Jingchuan on 4 July 2018, Qin’an on 2 July 2018, Huangluba on 11 July 2018, and Xiangtang on 28 June 2019 were all during periods of heavy rainfall. The concentration of heavy rainfall in the basin was high, and generate high discharge. Except for Qin’an, the other three river basins all produced flood peak superposition effects. Among them, the maximum rainfall in the Jingchuan River Basin occurred at 18:00 on 4 July, one hour earlier than the maximum peak flow. The remaining sites also have high fitting degrees, indicating that the model has good practicability in this region.
According to the simulation results, generally speaking, the CNFF model shows good applicability at different time and spatial scales in Gansu Province. The stations in the Jinghe River Basin, Yellow River Basin, Weihe River Basin, and Jialing River Basin are densely deployed. The rainfall data can reflect the actual rainfall conditions, and the model simulation effect is ideal. The simulation results in this area are basically consistent with the conclusions drawn by Li Changbin [36]. The Taohe River Basin and the Huangshui River Basin are high in altitude and are dominated by plateaus and mountains. The rainfall varies greatly with the terrain, causing the simulation effect to be affected to a certain extent, but overall, it is good. Snowmelt runoff exists in some areas of the Shiyang River and Heihe River basins. For seasonal inland river basins, snowmelt is one of the main source of runoff. Since the snowmelt model was not considered, the simulation results in this area were not accurate enough. However, the general trends of the simulated flow hydrograph and the actual flow hydrograph are similar. This conclusion is basically consistent with the results of Shang Ling [37], who used a hydrological model (HIMS) to simulate the Shiyang River Basin.
The simulation results of the Shule River Basin are not ideal, with a certainty coefficient of only 0.51. The degree of fit between the simulated flow process and the actual flow process is low, and the relative error deviations of peak time and flood peak are also relatively high. The main reason is that rainfall stations are sparsely distributed in the Shule River Basin, and rainfall data cannot truly reflect the rainfall conditions in the Shule River Basin. The Shule River Basin covers an area of 41,300 km2, accounting for 9.7% of the total area of Gansu Province. There are only 107 rainfall stations, with a station coverage density of 386 km2/station, and the proportion of rainfall stations is 1.8% of the rainfall stations in Gansu Province. Other watersheds in the Shule River, such as Dangcheng Bay, Panjiazhuang, Shuangtabao, etc., also have problems with varying degrees of unsatisfactory simulation results. The research results of Sun Boyang [38] and others using the distributed hydrological model (DTVGM) are relatively consistent with the simulation results of the CNFF flash flood hydrological model in the Shule River Basin in Gansu Province. However, DTVGM is a daily runoff simulation and cannot carry out the simulation of short-term flash floods and heavy rains.

4. Conclusions

The Gansu Province Flash Flood Warning and Forecasting Platform is crucial for timely and accurate heavy rain and flash flood forecasting and early warning, as well as for achieving the safe transfer of people and property. As the core expert decision-making system of the flash flood early warning and forecasting platform, the CNFF hydrological model is necessary to carry out calibration verification and applicability evaluation of the simulation effect of the CNFF hydrological model in Gansu [39]. Based on the high-precision DEM, water system, land use, and other underlying surface data and historical flood event data of Gansu Province, this study selected watersheds in nine major river systems to conduct a CNFF calibration verification analysis. The conclusions are as follows:
(1) The model parameter sensitivity analysis is based on four different objective functions, namely certainty coefficient (NSE), flood peak relative error (REQ), peak occurrence time error (ET), and their combined objective function (C). Different parameters show different degrees of sensitivity based on different objective functions, and the insensitive parameters are generally the same: Cslowsq, CG, and CGSink respectively. According to the sensitivity analysis results, it was found that vegetation and soil types in the study area have a greater impact on the simulation results of the CNFF hydrological model. From the perspective of each hydrological module in the CNFF hydrological model, the sensitivity of the relevant parameters of the soil module is higher than that of the groundwater module. This shows that the groundwater in the study area has little influence on the simulation of the overall runoff process, the base flow is relatively stable, and the changes in runoff are mainly reflected in surface runoff and mid-soil flow.
(2) Using three evaluation indicators, namely the certainty coefficient, flood peak relative error, and peak appearance time error, to evaluate the applicability of the CNFF model in nine river basins in Gansu shows that the average certainty coefficient of all river basin rates in the study area during the regular and verification periods is 0.76 and 0.73; the average peak flow errors are 9.1% and 12.6% respectively; and the average peak time errors are 1.2 h and 1.7 h. Therefore, the CNFF model shows good applicability at different time and spatial scales.
(3) Although the CNFF model can be compatible with the runoff generation and confluence characteristics of different climate types in the simulation process of the natural hydrophysics of the watershed, due to the special geographical location and climatic conditions of Gansu Province, as well as the complex cause and mechanism of heavy rain and flood processes in small- and medium-sized watersheds, rainfall, human activities, parameter uncertainty, data conditions in the study area, etc., will reduce the actual simulation accuracy. In addition, in future research, multisource precipitation data with high spatial and temporal resolution can be used to further improve the applicability of the model in Gansu.

Author Contributions

B.Z. carried out the analysis and wrote the paper. R.L. developed the CNFF model and organized the project implementation. Y.W. designed the system framework and developed the project implementation plan. S.T. and K.W. participated in the results analysis and paper correction. All authors have read and agreed to the published version of the manuscript.

Funding

This research was funded by National Natural Science Foundation of China, grant number 42271095, identification of flash flood risk driving factors and simulation of amplification effects.

Data Availability Statement

Data are contained within the article.

Conflicts of Interest

Author Yingtang Wei and Kai wei were employed by the company Gansu Ganlan Water Resources and Hydropower Survey and Design Institute Co., Ltd. The remaining authors declare that the research was conducted in the absence of any commercial or financial relationships that could be construed as a potential conflict of interest.

References

  1. Wu, Z.; He, B.; Tian, J.; Lu, J.; Liu, R. The theoretical framework for digitalized mountain flood control and its implementation path. China Water Resour. 2022, 8, 41–46. [Google Scholar]
  2. Trigo, R.M.; Ramos, C.; Pereira, S.S.; Ramos, A.M.; Zêzere, J.L.; Liberato, M.L.R. The deadliest storm of the 20th century striking Portugal: Flood impacts and atmosphere circulation. J. Hydrol. 2016, 541, 597–610. [Google Scholar] [CrossRef]
  3. He, B.; Huang, X.; Guo, L. Mountain flood disaster prevention routes and core construction contents in China. Flood Prev. Drought Relief China 2012, 22, 19–22. [Google Scholar]
  4. Sun, D.; Liu, C.; He, B. Research progress on theory and technology of mountain flood disaster prevention and control. Flood Prev. Drought Relief China 2022, 32, 24–33. [Google Scholar]
  5. Singh, V.P. Hydrologic modeling: Progress and future directions. Geosci. Lett. 2018, 5, 15. [Google Scholar] [CrossRef]
  6. Jia, P.; Liu, R.; Ma, M.; Liu, Q.; Wang, Y.; Zhai, X.; Xu, S.; Wang, D. Flash Flood Simulation for Ungauged Catchments Based on the Distributed Hydrological Model. Water 2019, 11, 76. [Google Scholar] [CrossRef]
  7. Hydrologic Engineering Center. HEC-1 Food Hydrograph Package: User’s Manual; Army Corps of Engineers: Davis, CA, USA, 1968. [Google Scholar]
  8. Metcalf and Eddy, Inc.; University of Florida and Water Resources Engineers, Inc. Storm Water Management Model, Vol 1-Fnal Report; EPA Report No. 11024DOV07/71 (NITS PB-203289); Environmental Protection Agency: Washington, DC, USA, 1971. [Google Scholar]
  9. Burnash, R.J.C.; Ferral, R.L.; McGuire, R.A. A Generalized Streamflow Simulation System-Conceptual Modeling for Digital Computers Report; U.S. National Weather Service, Silver Spring, Maryland, and Department of Water Resources, State of California: Sacramento, CA, USA, 1973. [Google Scholar]
  10. Leavesley, G.H.; Lichty, R.W.; Troutman, B.M.; Saindon, L.G. Precipitation Run of Modeling System-User’s Manual; U. S. Geological Survey Water Resources Investigations Report 83-4238; USGS: Denver, CO, USA, 1983. [Google Scholar]
  11. Beven, K. TOPMODEL: A critique. Hydrol. Process. 1997, 11, 1069–1085. [Google Scholar] [CrossRef]
  12. Singh, V.P.; Frevert, D.K. (Eds.) Watershed Models; CRC Press: Boca Raton, FL, USA; Taylor and Francis: Boca Raton, FL, USA, 2006. [Google Scholar]
  13. El-Nasr, A.A.; Arnold, J.G.; Feyen, J.; Berlamont, J. Modelling the hydrology of a catchment using a distributed and a semi-distributed model. Hydrol. Process. 2005, 19, 573–587. [Google Scholar] [CrossRef]
  14. Zoccatelli, D.; Borga, M.; Viglione, A.; Chirico, G.B.; Schl, G.B. Spatial moments of catchment rainfall: Rainfall spatial organisation, Catchment morphology, and flood response. Hydrol. Earth Syst. Sci. Discuss. 2011, 8, 5811–5847. [Google Scholar] [CrossRef]
  15. Wang, Y.; Liu, R.; Guo, L.; Tian, J.; Zhang, X.; Ding, L.; Wang, C.; Shang, Y. Forecasting and Providing Warnings of Flash Floods for Ungauged Mountainous Areas Based on a Distributed Hydrological Model. Water 2017, 9, 776. [Google Scholar] [CrossRef]
  16. Barthold, F.E.; Workoff, T.E.; Cosgrove, B.A.; Gourley, J.J.; Novak, D.R.; Mahoney, K.M. Improving Flash Flood Forecasts: The HMT-WPC Flash Flood and Intense Rainfall Experiment. Bull. Am. Meteorol. Soc. 2015, 96, 1859–1866. [Google Scholar] [CrossRef]
  17. Hapuarachchi, H.A.P.; Wang, Q.J.; Pagano, T.C. A review of advances in flash flood forecasting. Hydrol. Process. 2011, 25, 2771–2784. [Google Scholar] [CrossRef]
  18. Wagner, W.; Scipal, K.; Pathe, C.; Gerten, D.; Lucht, W.; Rudolf, B. Evaluation of the agreement between the first global remotely sensed soil moisture data with model and precipitation data. J. Geophys. Res. 2003, 108. [Google Scholar] [CrossRef]
  19. Beven, K.J. Rainfall-Runoff Modeling: The Primer; John Wiley & Sons: Chichester, UK, 2012; pp. 84–96. [Google Scholar]
  20. Abbott, M.B.; Bathurst, J.C.; Cunge, J.A.; O’Connell, P.E.; Rasmussen, J. An introduction to the European Hydro logical System, ‘SHE’, 1: History and philosophy of a physically-based, distributed modeling system. J. Hydrol. 1986, 87, 45–59. [Google Scholar] [CrossRef]
  21. Abbott, M.B.; Bathurst, J.C.; Cunge, J.A.; O’Connell, P.E.; Rasmussen, J. An introduction to the European Hydro logical System, ‘SHE’, 2: Structure of a physically-based, distributed modeling system. J. Hydrol. 1986, 87, 61–77. [Google Scholar] [CrossRef]
  22. Kuriqi, A.; Ardiclioglu, M.; Muceku, Y. Investigation of seepage effect on river dike’s stability under steady state and transient conditions. Pollack Period. 2016, 11, 87–104. [Google Scholar] [CrossRef]
  23. National Geomatics Center of China. National Geomatics Database. 2019. Available online: https://ngcc.cn/ngcc/ (accessed on 1 January 2023).
  24. Wang, X.; Zhai, X.; Zhang, Y.; Guo, L. Evaluating flash flood simulation capability with respect to rainfall temporal variability in a small mountainous catchment. J. Geogr. Sci. 2023, 33, 2530–2548. [Google Scholar] [CrossRef]
  25. Moriasi, D.N.; Arnold, J.G.; Van Liew, M.W.; Binger, R.L.; Harmel, R.D.; Veith, T. Model evaluation guidelines for systematic quantification of accuracy in watershed simulations. Trans. Asabe 2007, 50, 885–900. [Google Scholar] [CrossRef]
  26. Green, W.; Ampt, G. Studies of soil physics-the flow of air and water through soils. J. Agric. Sci. 1911, 4, 11–24. [Google Scholar]
  27. Huo, W.; Li, Z.; Zhang, K.; Wang, J.; Yao, C. GA-PIC: An improved Green-Ampt rainfall-runoff model with a physically based infiltration distribution curve for semi-arid basins. J. Hydrol. 2020, 586, 124900. [Google Scholar] [CrossRef]
  28. Liu, R.; Guo, L.; Wang, Y.; Zhang, X.; Liu, Q.; Shang, Y.; Zhai, X.; Tian, J.; Huang, X. A Parallel Flood Forecasting and Warning Platform Based on HPC Clusters. EPiC Ser. Eng. 2018, 3, 1232–1239. [Google Scholar]
  29. Song, X.; Kong, F.; Zhu, Z. Application of Muskingum routing method with variable parameters in ungauged basin. Water Sci. Eng. 2011, 4, 1–12. [Google Scholar]
  30. Nash, J.E.; Sutcliffe, J.V. River flow forecasting through conceptual models part I: A discussion of principles. J. Hydrol. 1970, 10, 282–290. [Google Scholar] [CrossRef]
  31. Kavetski, D.; Kuczera, G.; Franks, S.W. Bayesian Analysis of Input Uncertainty in Hydrological Modeling: Application. Water Resour. Res. 2006, 42, W03407. [Google Scholar] [CrossRef]
  32. Stewart, R.D. A dynamic multidomain Green-Ampt infiltration model. Water Resour. Res. 2018, 54, 6844–6859. [Google Scholar] [CrossRef]
  33. Wu, S.J.; Hsu, C.T.; Lien, H.C.; Chang, C.H. Modeling the effect of uncertainties in rainfall characteristics on flash flood warning based on rainfall thresholds. Nat. Hazards 2015, 75, 1677–1711. [Google Scholar] [CrossRef]
  34. Spear, R.C.; Hornberger, G.M. Eutrophication in Peel Inlet, II, Identification of critical uncertainties via generalized sensitivity analysis. Water Res. 1980, 14, 43–49. [Google Scholar] [CrossRef]
  35. Xu, S.; He, G.; Fang, H.; Bai, S.; Wu, X. Parameter uncertainty and sensitivity analysis of the three Gorges Reservoir and Xiangxi River EFDC model. J. Hydrol. 2022, 610, 127881. [Google Scholar] [CrossRef]
  36. Li, C. Research of Distributed Hydrologic Modeling in a Typical Large Scale Watershed in Longxi Loess Plateau of China. Ph.D. Thesis, Lanzhou University, Lanzhou, China, 2006. [Google Scholar]
  37. Shang, L. Estimate Runoffs Based on HIMS model of Xiying River Basin. Ph.D. Thesis, Gansu Agriculture University, Lanzhou, China, 2013. [Google Scholar]
  38. Sun, B. Research on Distributed Hydrological Simulation and Impact Assessment of Climate Change in Arid and Semi-Arid Regions of Northwest China. Ph.D. Thesis, North China Electric Power University, Beijing, China, 2014. [Google Scholar]
  39. Wen, L.; Yu, Z.; Zhang, K.; Ragettli, S.; Zhou, M.; Gao, Y.; Ju, Q.; Liu, C. Factors influencing calibration of a semi-distributed mixed runoff hydrological model: A study on nine small mountain catchments in China. J. Hydrol. Reg. Stud. 2023, 47, 101418. [Google Scholar] [CrossRef]
Figure 1. Eleven water system in Gansu Province.
Water 16 00488 g001
Figure 2. Sub-watershed and attribute information.
Water 16 00488 g002
Figure 3. Hydrological and rainfall stations.
Water 16 00488 g003
Figure 4. The 289 distributed hydrological models in Gansu Province.
Water 16 00488 g004
Figure 5. Nine distributed models and model clusters in study areas in Gansu Province.
Water 16 00488 g005
Figure 6. Evaluation of flood simulation effectiveness in nine river basins.
Water 16 00488 g006
Figure 7. Calibration results in basins.
Water 16 00488 g007
Figure 8. Validation results in basins.
Water 16 00488 g008
Table 1. Total length of each water system.
Water SystemLength
Shule River336.45 km
Sugan Lake245.7 km
Black River306.05 km
Shiyang River146.89 km
Huang River154.84 km
Tao River268.04 km
Yellow River215.54 Km
Wei River221.43 km
Jialing River321.84 km
Jing River254.51 km
Beiluo River90.80 km
Table 2. Principles of watershed hydrological response unit division and its main corresponding runoff generation method.
Response UnitDescriptionDeeper ClassificationRunoff Generation MethodInfiltration RateSoil Saturation Rate, κ0/(cm/h)Average Slope,
J/°
Soil Depth,
h/cm
Fast responseRunoff generation is fast, and it is easily influenced by rainfallfastInfiltration-excess runoffμ ≤ 0.25κ0 ≤ 0.1J > 0.1h ≤ 20
middleMixed
Saturation-excess runoff
0.25 ≤ μ ≤ 0.60.1 ≤ κ0 ≤ 0.620 < J ≤ 25
slowSaturation-excess
interflow
0.6 ≤ μ ≤ 10.6 ≤ κ0 ≤ 115 < J ≤ 20
Slow responseRunoff generation is slow, and it starts to generate when rainfall reaches a certain amountFast Infiltration-excess runoff
Mixed
Saturation-excess runoff
1 ≤ μ ≤ 1.51 ≤ κ0 ≤ 5J ≤ 1520 < h ≤ 50
meddleInfiltration-excess runoff
Mixed
Saturation-excess runoff
5 ≤ κ0 ≤ 15
slowinterflow15 ≤ κ0 ≤ 30
Delay responseHardly influenced by rainfall Infiltrationμ ≤ 1.5κ0 > 30J ≤ 1550 < h ≤ 80
Table 3. Basic information of model clusters.
Model ClusterSub-Basin Hydrological ModelArea (km2)
Beiluo River basin34934830
Black River basin57063081,231
Yellow River basin46333966,296
Huangshui River basin678610,469
Jialing River basin34543452,645
Jing River basin27893141,627
Shiyang River basin40943362,965
ShuLe River basin718059111,159
Sugan River basin1735927,977
Tao River basin20622231,690
Wei River basin22162332,490
Table 4. Parameter sensitivity results of different objective functions.
ParametersObjective FunctionCombined Objective Function
NSEREQETC
Rmax*****
Cnonliner*** **
Expnonliner ***
Satv**********
RsoilMax** *
SoilMax* **
SoilGMax*
SGExp * **
Cfast_sq ***
Cslowsq*
CG
CGSink
Notes: *** indicate high sensitivity, ** indicate moderately sensitive parameters, * indicates mild sensitivity, and no asterisk indicates insensitivity.
Table 5. Calibration parameter results for nine watersheds.
ParametersJing RiverWei RiverJialing RiverTao RiverYellow RiverHuang RiverShiyang RiverBlack RiverShuLe River
Rmax0.80.70.90.80.50.50.40.50.5
Cnonliner0.080.050.050.040.030.030.0280.010.01
Expnonliner0.20.20.20.20.20.20.20.20.2
Satv757080757070707060
RsoilMax151520151313131311
SoilGMax0.10.10.10.10.050.050.050.050.05
Soilmax554060505050504040
SGExp0.10.10.10.10.10.10.10.10.1
Cfast_sq0.080.050.050.040.040.040.040.050.04
Cslowsq0.050.030.030.020.020.020.030.020.03
CG0.10.10.10.10.10.10.10.10.1
CGSink0.050.050.050.050.050.050.050.050.05
Ssnow000000000
Disclaimer/Publisher’s Note: The statements, opinions and data contained in all publications are solely those of the individual author(s) and contributor(s) and not of MDPI and/or the editor(s). MDPI and/or the editor(s) disclaim responsibility for any injury to people or property resulting from any ideas, methods, instructions or products referred to in the content.