1. Introduction
Landslides are common geological hazards that occur when sections of rock and soil on a mountain slope undergo shear displacement along a certain weak structural plane (zone) under the action of gravity and move toward lower parts of a slope as a whole, and it often occurs during or after rainfall events (Nazrien et al. [
1]; Margielewski and Urban [
2]; He et al. [
3]). Landslides occurring in areas with rivers, reservoirs, lakes, or coasts can generate waves of energy during their rapid entry into the water, causing severe disasters (Rudy and Barry [
4]; Mohammed and Fritz [
5]; Tan et al. [
6]; Trinaistich et al. [
7]; Chen et al. [
8]). Rivers and channel-type reservoirs are semi-enclosed water bodies; therefore, unlike landslides in open ocean environments, the waves generated by landslides entering the water can spread to the opposite bank in a relatively short period of time, overturning ships docked along the coast and damaging water conservancy and water transport facilities. Moreover, due to the large volume of landslides relative to water depth, landslides will quickly deposit after entering the water, causing dramatic changes in local topography in the near field in an instant, blocking river channels and even forming landslide dams (Yu et al. [
9] and Cao et al. [
10]). In practice, the movement of landslide masses is very complex. During the movement process, factors such as the shape of the sliding surface, the mass of the sliding mass, mechanical parameters, and boundary conditions are constantly in a state of change. These changing factors will have a great impact on the process of landslide movement, the shape of the accumulation body, and the generated swells (Heller et al. [
11]; Miller et al. [
12]).
Fritz et al. [
13,
14] used pneumatic landslide triggering devices to control the influencing factors of sliding, accurately reproducing the sliding process of the landslide and obtaining independent variables of a single sliding parameter. They studied the maximum displacement and displacement rates of water bodies when a sliding body enters the water. However, the sliding mass in their experimental model only uses a single rigid block. Cheng et al. [
15] analyzed the impact compaction mechanism of high-speed rock landslides based on the formation process of large-scale landslide dams in high mountain canyon areas. Liu et al. [
16], based on their understanding of the mechanism of high-speed landslides and their analysis of the characteristics of movement and accumulation, posited that the deformation and velocity inside sliding masses are uneven, and the process of landslide sliding is accompanied by the accumulation, release, and loss of variable performance. Wang and Yin [
17] studied the stress situations of landslides on reservoir banks, divided the movement process of the landslide into different stages, applied the slice method to determine the movement speed of the sliding slope, and selected the Xintan landslide for an example analysis. Based on the mechanical properties of slip surfaces, Liu et al. [
18] divided slip surfaces into elastic medium and strain weakening zones and proposed an energy calculation formula for landslide movement processes. By analyzing the characteristics of the Guili landslide development in the upper reaches of the Jinsha River, Xu et al. [
19] used numerical calculation models to predict the unstable movement process of the landslide, obtaining the accumulation state and movement speed of the landslide at different times. These studies did not consider the influence of the granularization of landslide mass on the movement process and accumulation morphology. Dong et al. [
20] established a mathematical discriminant for landslide stability evaluation by collecting the characteristic parameters of 43 landslides in Japan. Wang et al. [
21] found through field surveys that different depositional landforms would be formed in the debris flow depositional area of landslides due to the variation in the width of the accumulation area. However, Dong et al. [
20] and Wang et al. [
21] did not conduct a detailed analysis of the landslide movement process and the changes in the morphology of the accumulation body.
Due to the different heights of the receiving water body when a landslide enters the water, it may be partially or completely submerged by the water body after sliding. Huang et al. [
22] visually classified deep and shallow-water landslides based on the inundation of landslide bodies after sedimentation. They referred to landslides that were completely submerged after sedimentation as deep-water landslides, while those that were not completely submerged after sedimentation were referred to as shallow-water landslides. However, a shallow-water landslide is a relative concept that depends on the proportional relationship between the thickness, length, and water depth of the landslide body rather than the actual water depth. The Qianjiangping landslide, Xintan landslide, Jiguanling landslide, and Tangjiaxi landslide in the Three Gorges Reservoir area of China’s Yangtze River, and the Vajont landslide that occurred in the artificial reservoir in Northern Italy in 1963 (Bosa and Petti [
23]), were all typical shallow-water landslides. Zhao [
24] provided a discrimination method for landslides in shallow and deep-water areas, established an indoor physical model, analyzed the interaction process between the slider and water, and divided the sliding process of the slider into three stages: rapid acceleration, slow acceleration, and rapid deceleration. However, Zhao’s classification lacks a starting stage and does not provide information on the magnitude of the change in landslide movement speed. Virulet et al. [
25] used two different numerical calculation methods to simplify the shallow-water model to simulate the generation of surge waves in two-dimensional block shallow-water landslides. They derived the scaling law of the evolution of maximum wave amplitudes in the near field over time. However, he did not consider the three-dimensional sliding motion of granular landslides. Han et al. [
26] established a dispersed model of rock mass landslides based on the development characteristics of rock mass fractures in the Three Gorges Reservoir area. They analyzed the evolution law of rock mass landslides during the sliding process and the inundation situation after a landslide stopped moving and obtained an empirical formula for the inundation rate of fractured rock mass landslides. However, the influence of hydrodynamic factors was not considered in his study.
Compared with landslides in deep-water areas, landslide masses sliding into shallow water can instantly cause significant changes in the local terrain in the near field, causing river blockages and even forming landslide dams, inducing strong disturbances to the surrounding water bodies. The resulting swells exhibit strong nonlinearity. It is necessary to analyze the water motion characteristics of loose rock landslides from a shallow water perspective and the inundation situation after water entry stops to study the near-field wave characteristics of landslide surges in shallow-water areas. Based on previous research on landslides and waves under static water conditions, this study considered the influence of hydrodynamic factors and combined the development characteristics of rock fractures in the Three Gorges Reservoir area to establish a three-dimensional model of scattered rock landslide surges. By analyzing the image sequence extracted using high-speed cameras, the evolution law of rock landslides during the sliding process is obtained based on the morphology and inundation situation of the accumulation body after a landslide body stops moving. Through experimental data and theoretical analysis, a method for determining the landslide inundation rate and the width of the accumulation body was developed. The research results can provide a theoretical basis and technical support for ensuring the safety of water conservancy and water transport projects in mountainous areas and preventing landslide hazards.
2. Simulation Methods of the Model Test
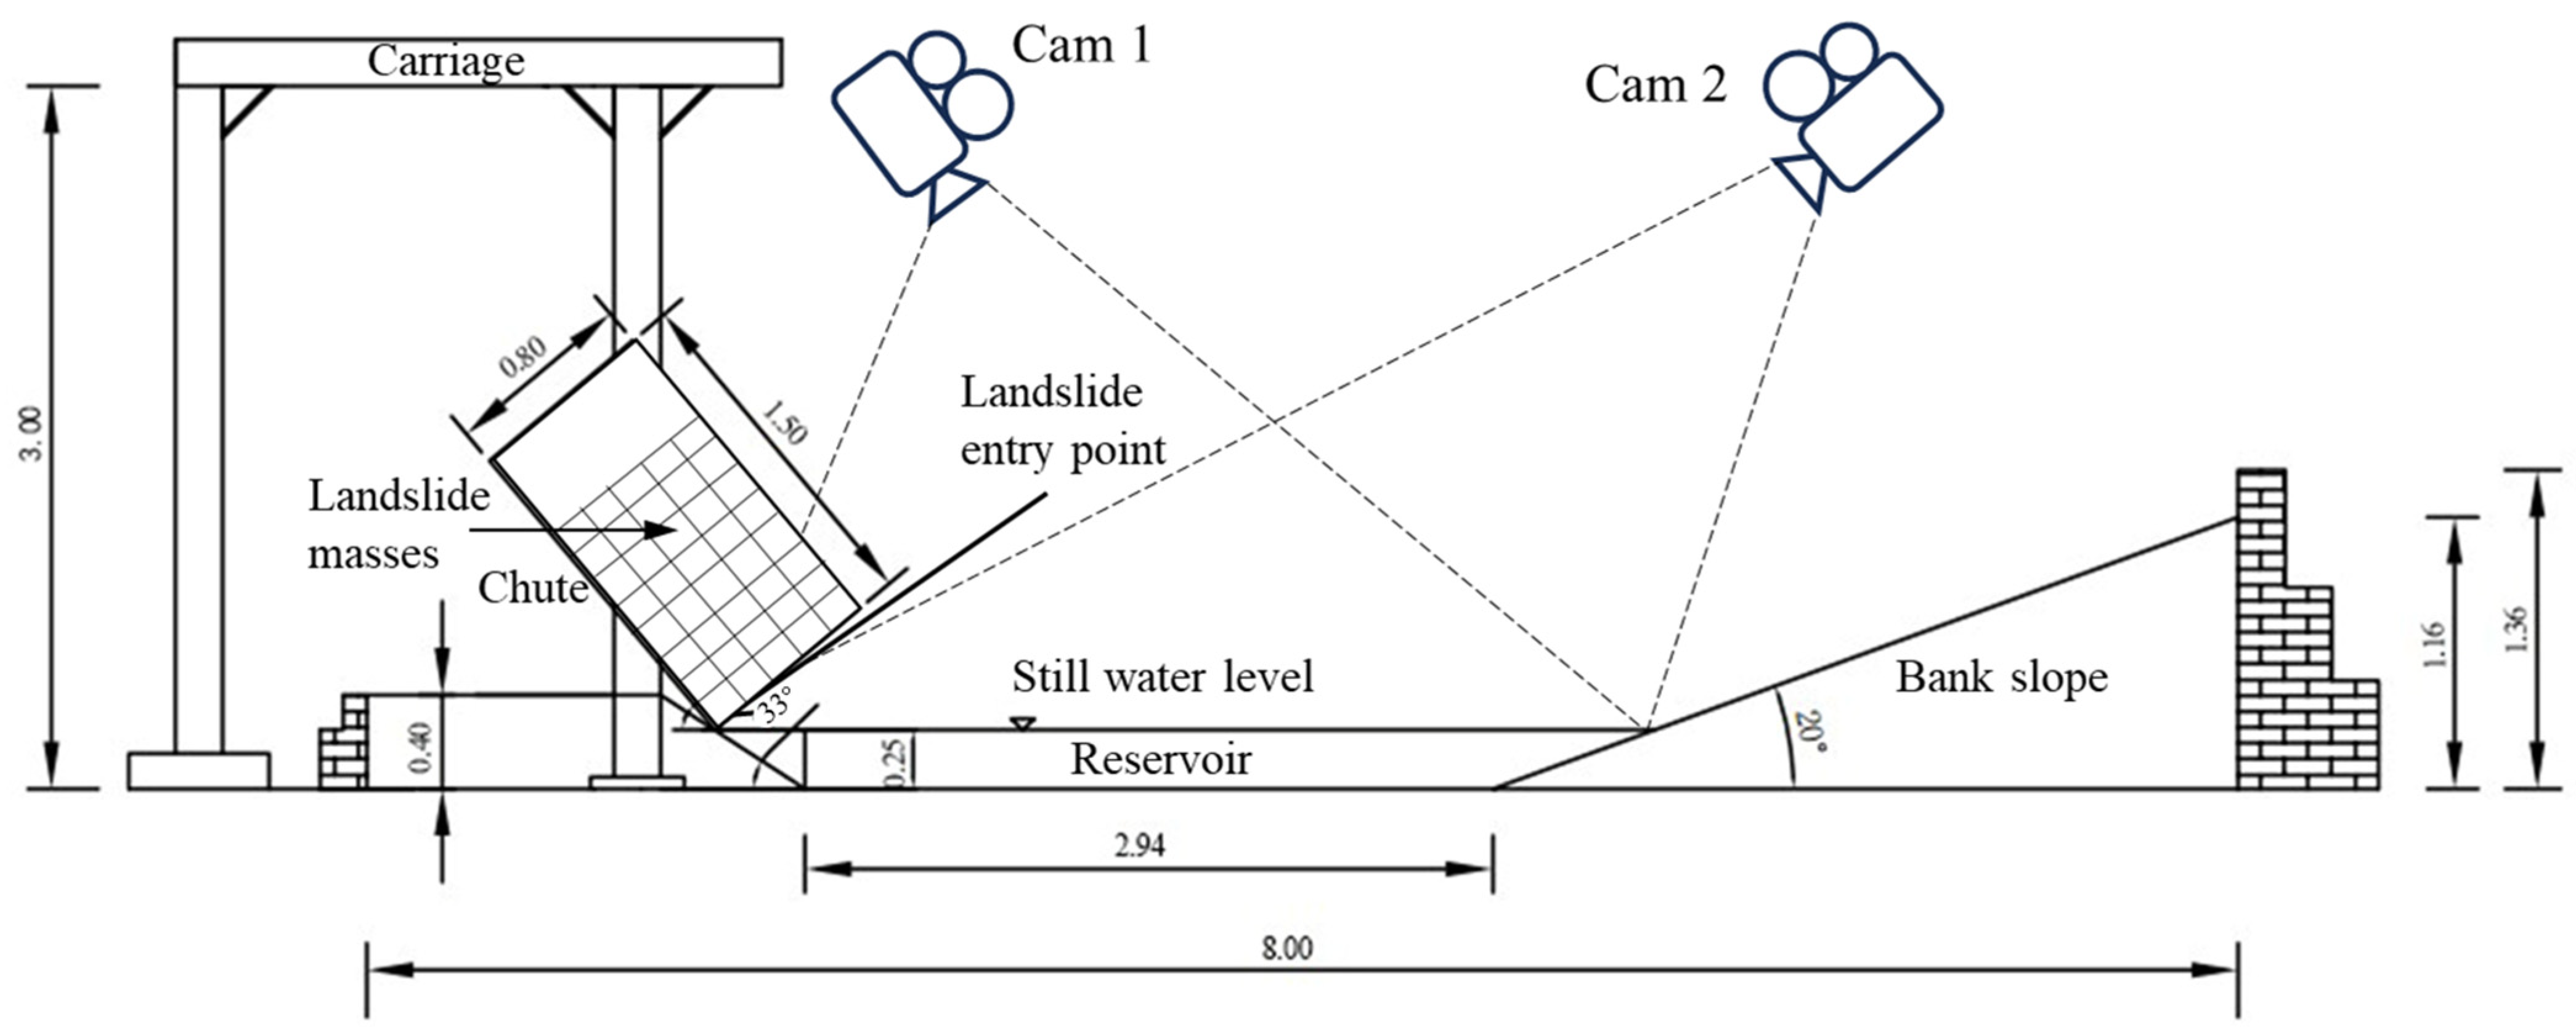
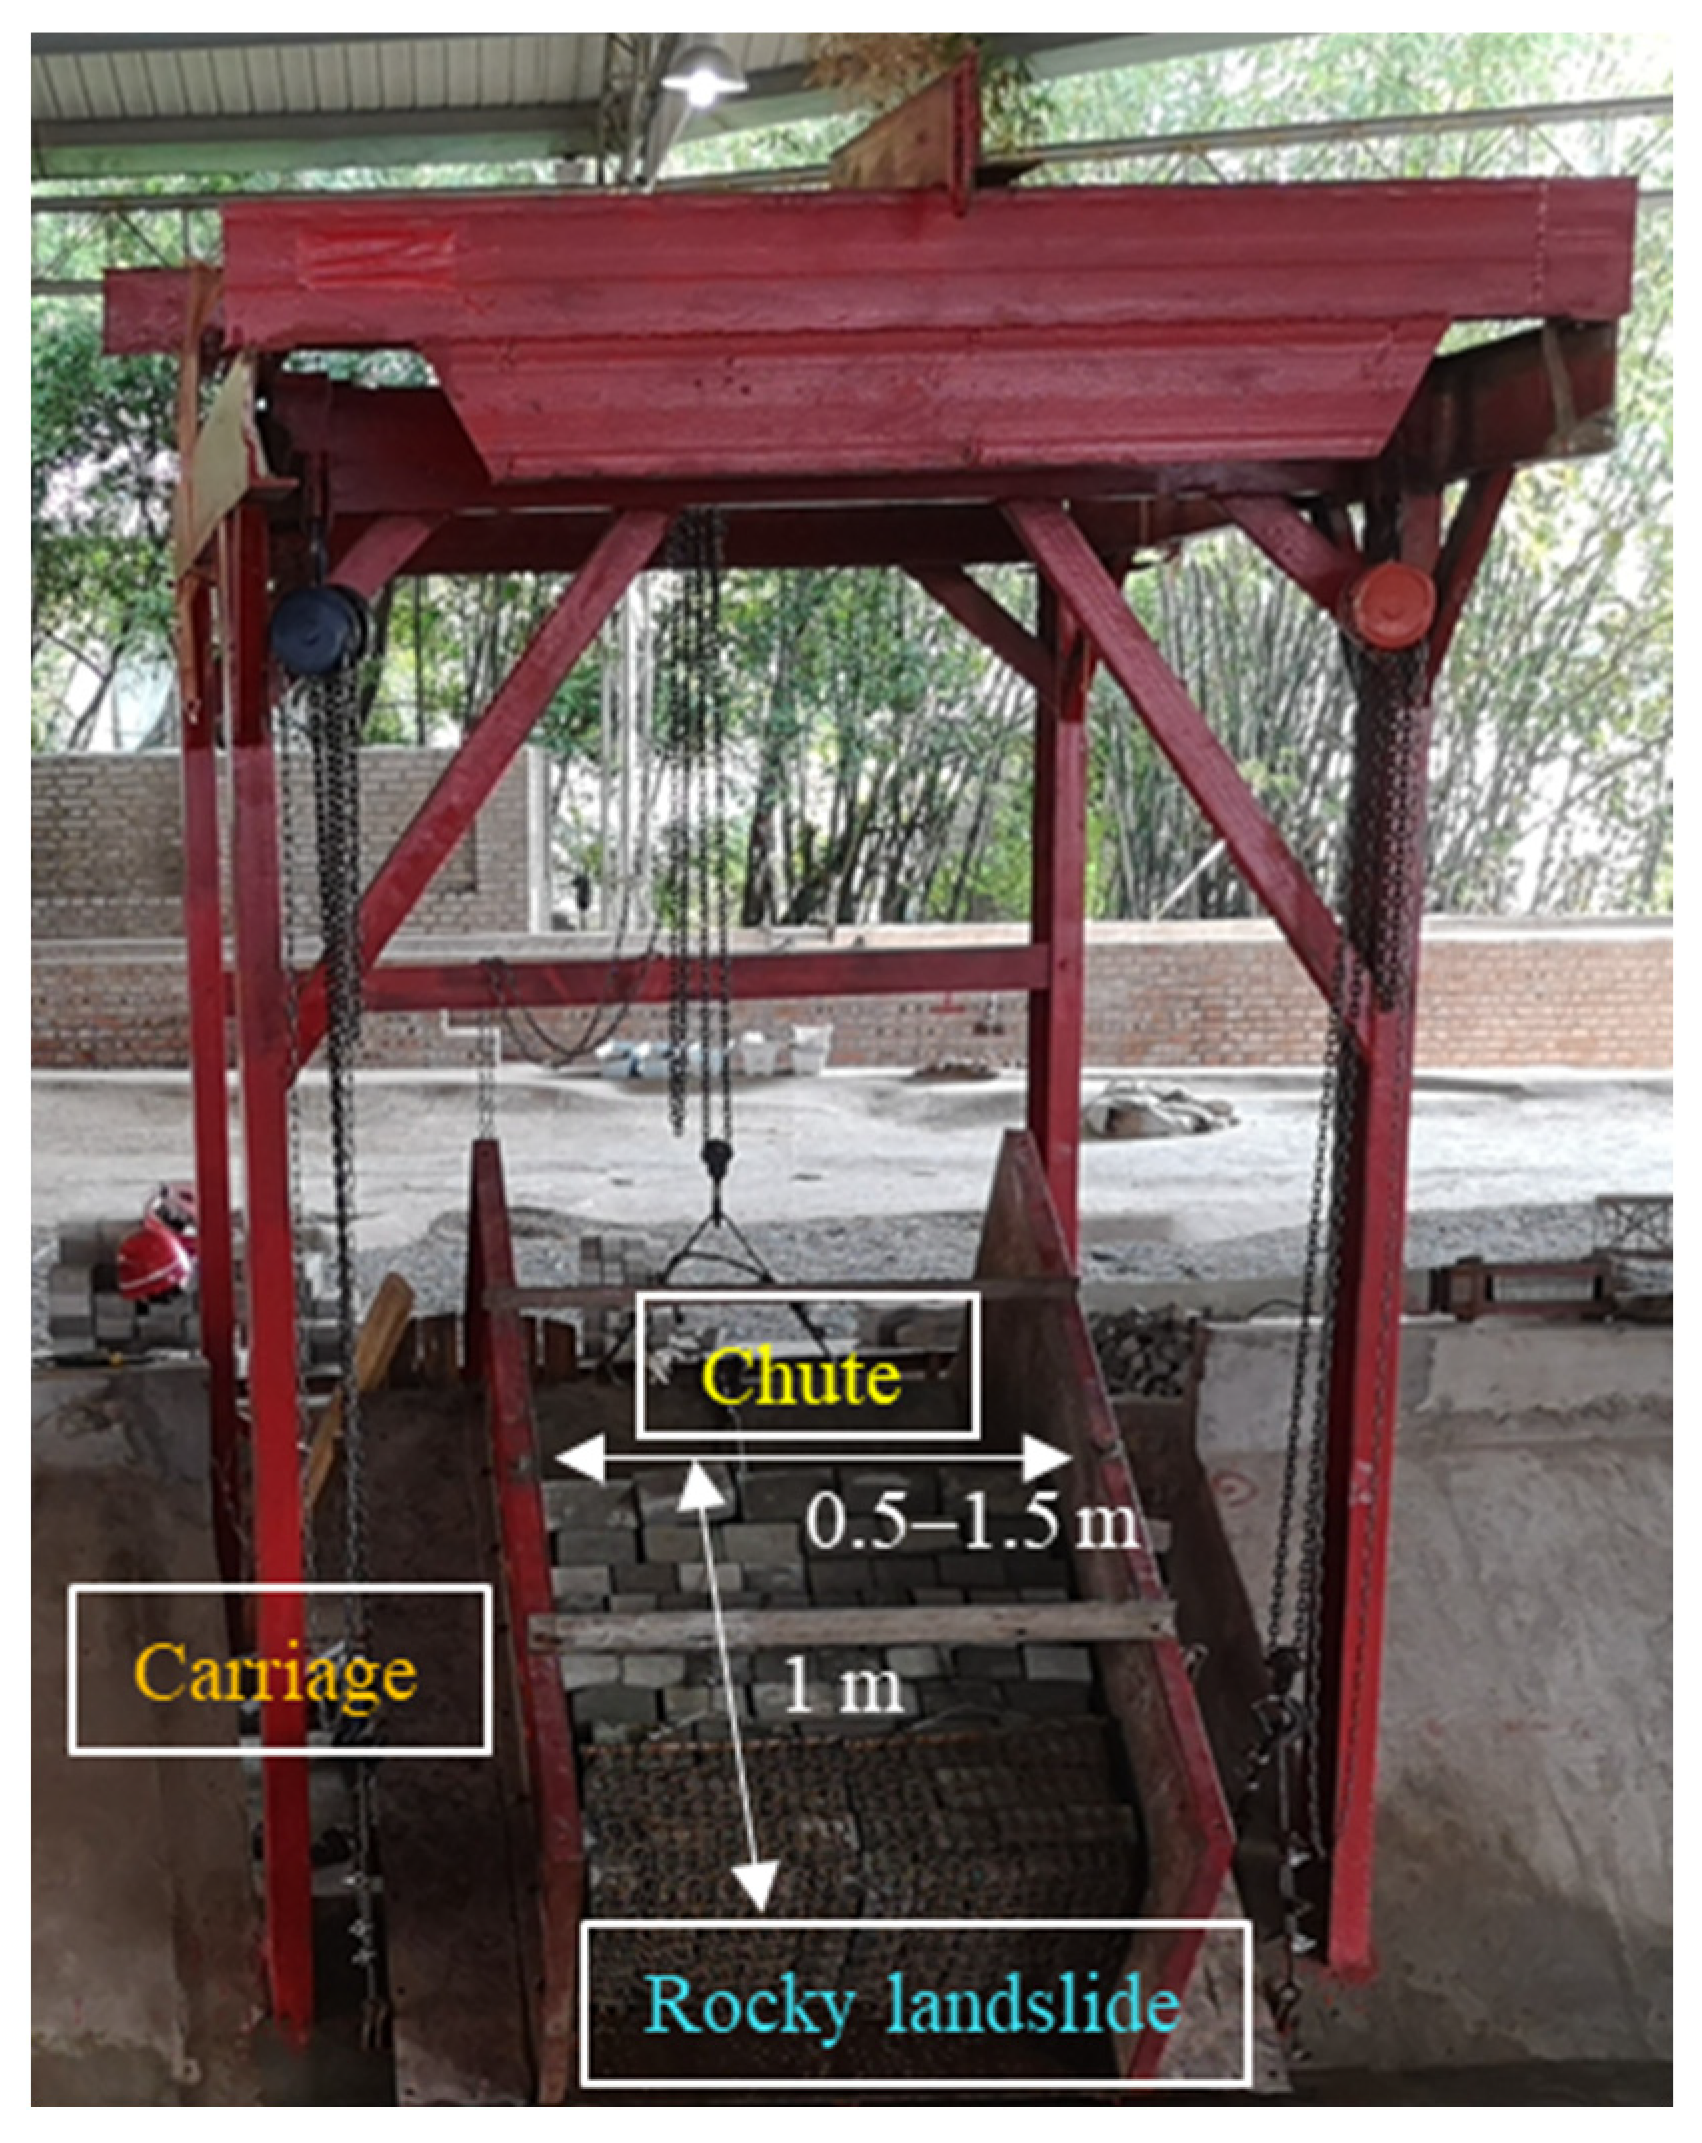
The landslide surge model test was conducted at the National Engineering Research Center for River Channel Regulation Engineering of Chongqing Jiaotong University. The model selected a typical bend section in the Three Gorges Reservoir area of the Yangtze River as the prototype. The research team conducted model design, computer mapping, and physical construction according to a normal scale of 1:70. The model tank centerline was 60 m long, with a top width of 8.0 m, a bottom width of 2.94 m, a height of 1.6 m, a bend center angle of 90 degrees, and a tank bottom slope of 1.5‰. The slopes on both sides of the water tank were taken as the average slope of the mainstream of the Yangtze River at the Three Gorges Reservoir area, with average slopes of 30° and 20° on the left convex bank and right convex bank, respectively. A chute with an adjustable sliding surface angle and landslide volume was placed on the left bank of the river channel, and multiple high-speed cameras were installed at different positions in the tank to track and record the multi-stage motion process. The frame rate of the camera was set to 100 fps. The physical model of the river channel is shown in
Figure 1, and the layouts of the carriage and chute are shown in
Figure 2 and
Figure 3. Compared with the original physical model test of straight-channel landslide surges under static water conditions, this bend section tank model considered the impact of water flow dynamics on landslide surge, which could better simulate the mechanism of landslide surge under a complex water environment and its impact on navigation safety.
According to the structure of the rock landslides in the Three Gorges Reservoir area of the Yangtze River, rigid blocks of different sizes were selected for model tests, as shown in
Figure 3. The model tests utilized rock landslide volumes of 0.2 m
3, 0.4 m
3, 0.6 m
3, and 0.9 m
3; sliding surface slope angles of 30°, 40°, 50°, and 60°; water flow velocities of 0.18 m/s, 0.24 m/s, 0.30 m/s, and 0.36 m/s; and water depths of 0.15 m, 0.20 m, 0.25 m, and 0.30 m. Then, a combination of a four-factor four-level orthogonal test design and a single-factor test design was used to determine 28 model test condition sets (
Table 1).
3. Results and Discussion
3.1. Division of the Landslide Movement Process
The movement of landslide masses is the most critical factor in generating swells, and its movement characteristics determine the final characteristics and degree of harm of the swells. Due to unfavorable topographical and geological conditions, mountains may be affected by a series of external environmental factors, such as rainfall, river erosion, reservoir water level fluctuations, and geological vibration, resulting in collapses and landslides. From mechanics and strain perspectives, the sliding mechanisms and motion characteristics of landslide masses under different types and environments are extremely complex and difficult to study; they remain the focus of contemporary research.
Current research methods on the movement characteristics of large and medium-sized rock landslides mainly include field surveys and measurements, physical model testing, theoretical analysis, and numerical simulation calculations. Due to the strong suddenness, short movement time, and a high degree of hazards of large and medium-sized landslides, existing research techniques still experience difficulty monitoring natural landslide movement processes. The landslide movement process can only be judged, speculated, and inverted based on on-site investigations of the geometric form and material composition of landslide deposits, residual traces, and other information after the landslide has occurred. Therefore, physical model tests have high practical value and important research significance for simulating the rock landslide movement process.
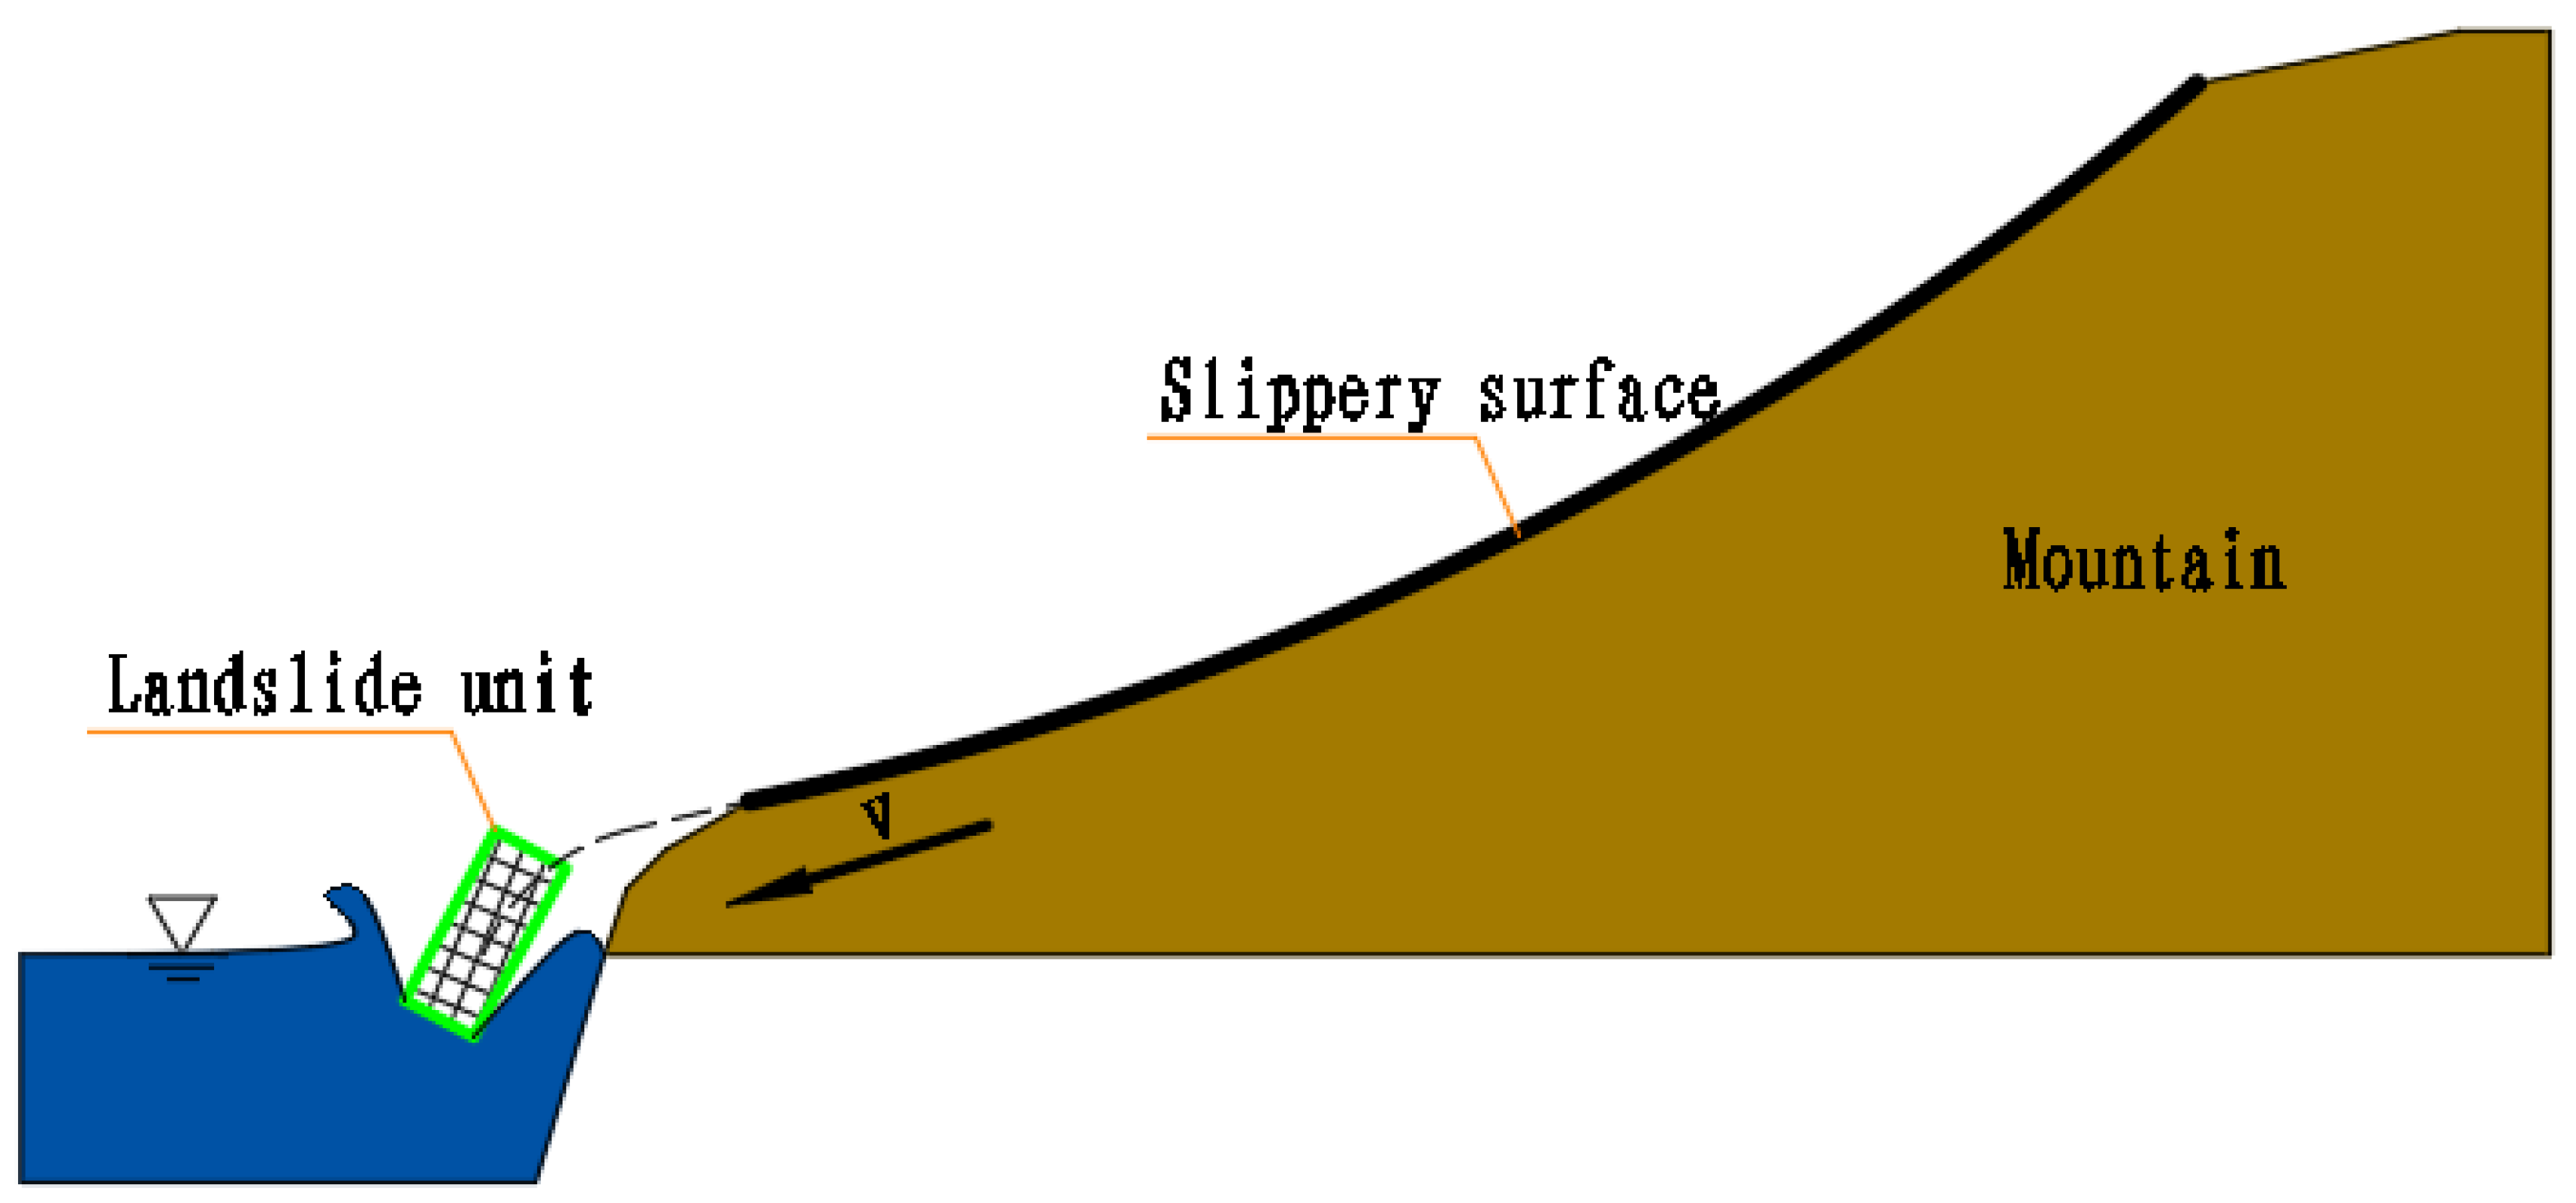
Based on existing on-site investigation and physical model test simulation results, the landslide movement process can be divided into four stages: the starting stage, the accelerating sliding stage, the slow acceleration or deceleration stage, and the rapid deceleration stage. The time required for the entire movement is relatively short. Of course, in these four stages, if the inclination of the sliding surface is small and the resistance to sliding friction is large, there may not be an accelerated sliding stage. In most cases, after a landslide starts, there is an approximately linear acceleration process, followed by slow acceleration or slow deceleration, and finally, a rapid stop (Zu [
27]).
- (1)
Starting stage of the landslide mass
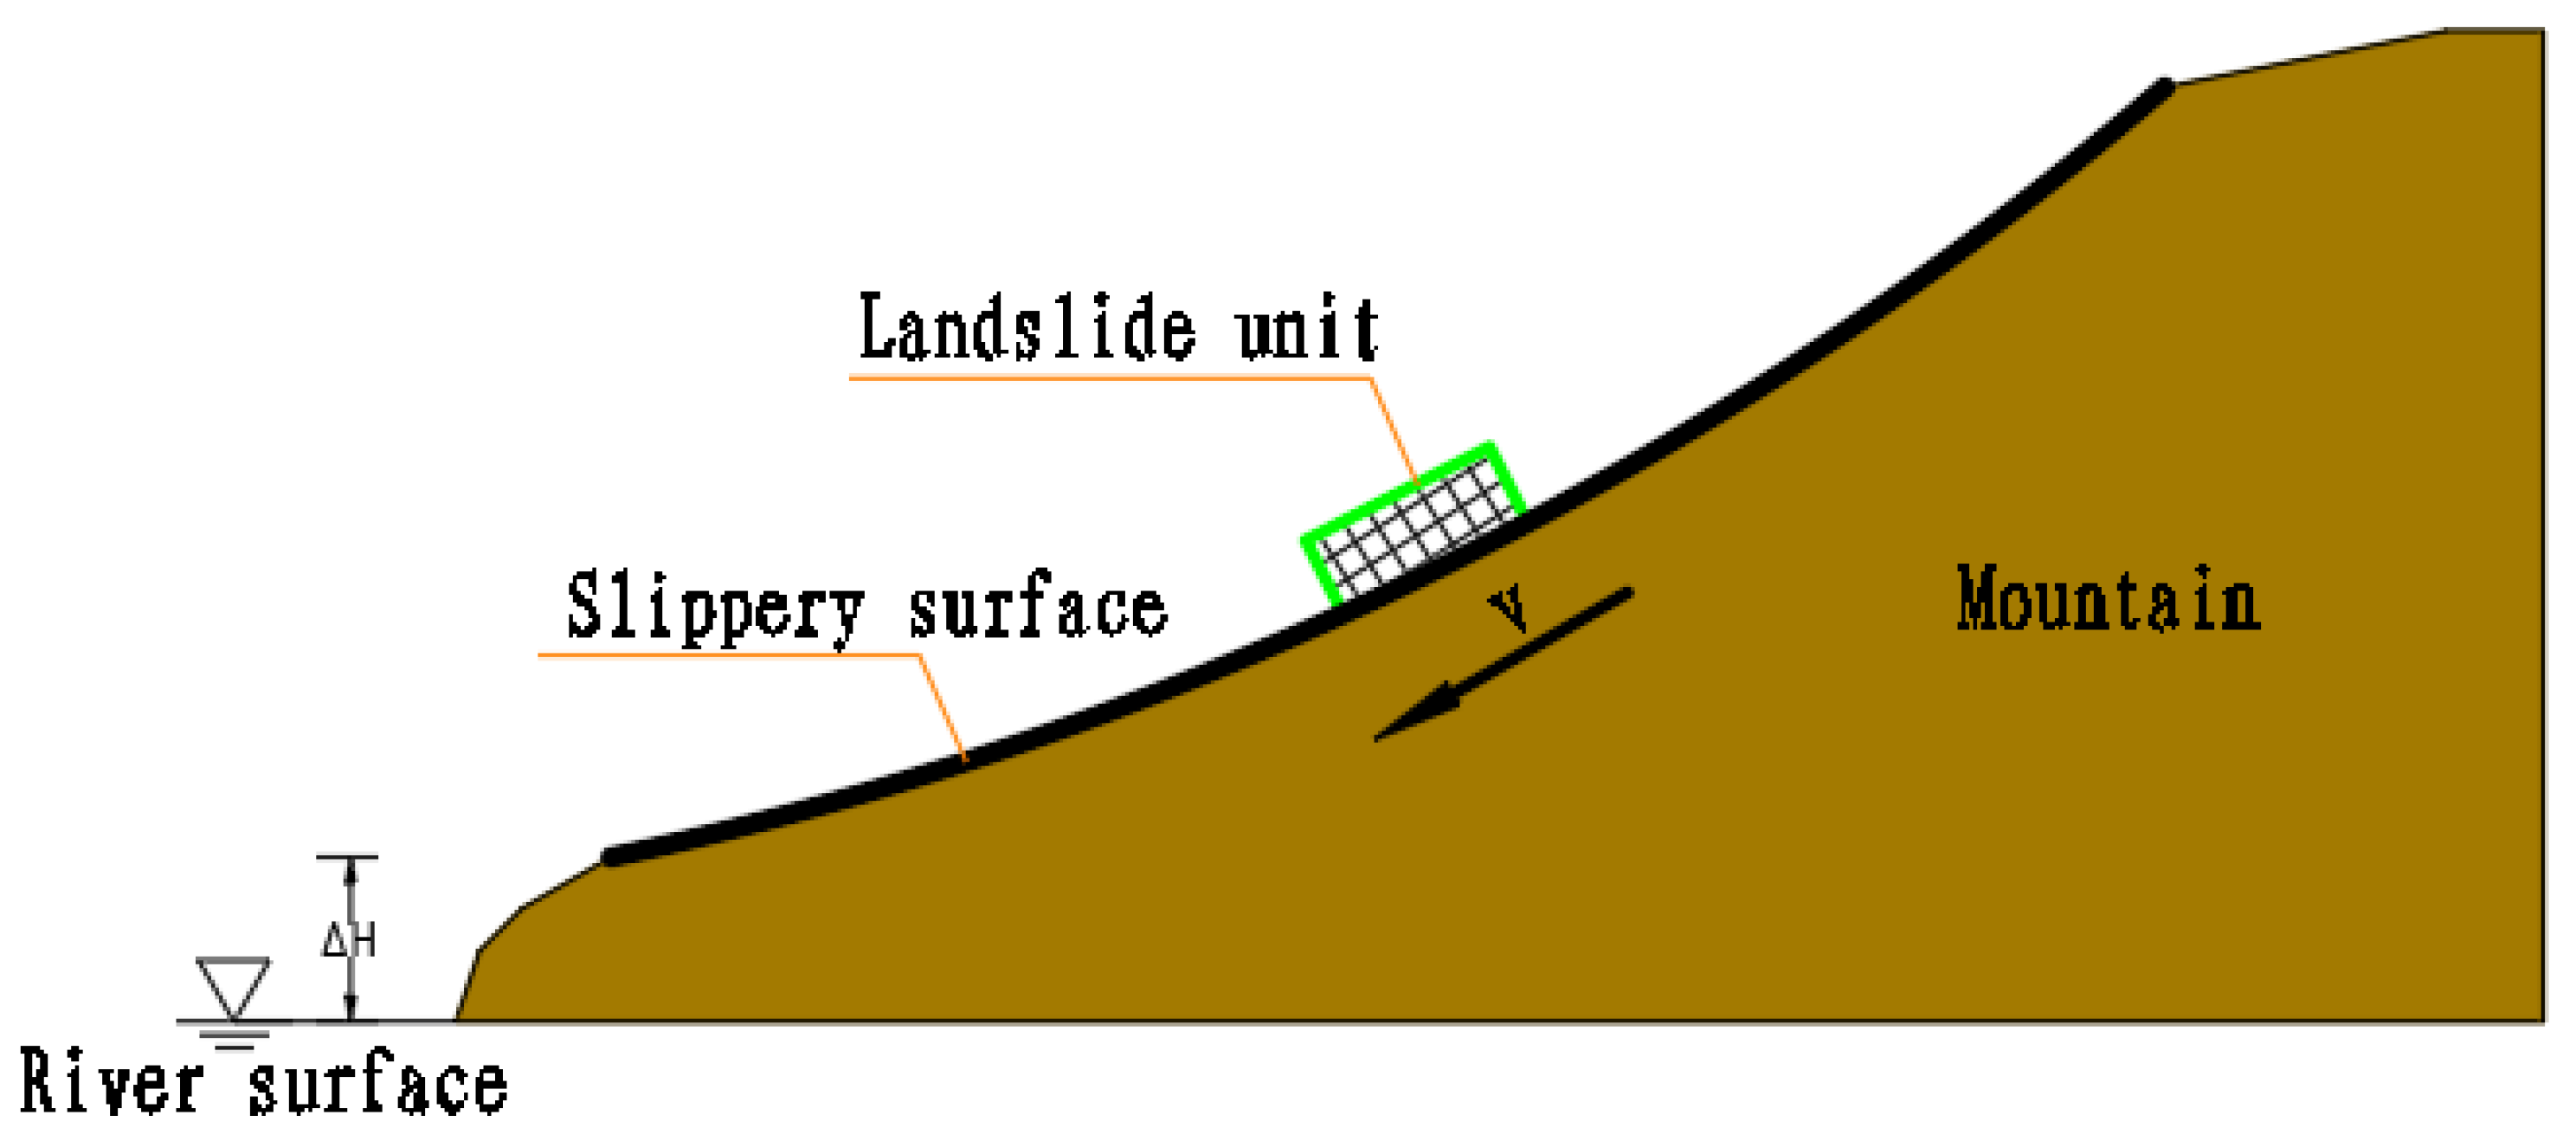
Due to the presence of weak surfaces and uneven stress distribution, a certain part of the slope undergoes slow deformation, resulting in tension cracks and shear cracks. When a whole moving surface is formed in the weak layer, a landslide mass is formed, and the rock mass slowly moves along the weak layer in the free direction, which starts to appear as a starting phenomenon (as shown in
Figure 4); this stage can also be called the departure stage. At this time, the velocity and acceleration of the landslide mass are relatively small.
- (2)
Accelerated sliding stage of the landslide mass
After a landslide starts to move, due to its high center of gravity and the presence of a certain amount of water in the gaps, the component of the landslide’s weight along the slope surface is greater than the shear friction resistance of the sliding groove surface. The landslide entered the stage of accelerated sliding (as shown in
Figure 5). During the accelerated sliding process of a landslide, there are often sounds of rock crushing, rolling, and collisions. When the sliding speed is high, it may even generate airwaves. At this stage, the potential energy of the landslide body continues to increase and is converted into kinetic energy and internal frictional energy, while internal frictional energy dissipates in the form of thermal energy, sound energy, and other forms. However, the kinetic energy accumulated during the energy conversion process of the landslide is ultimately converted into surge wave energy after the landslide slides into water. The acceleration of the slide during the acceleration sliding stage is basically related to the inclination angle of the sliding surface. The larger the inclination angle of the sliding surface, the greater the acceleration; it generally accelerates in a straight line.
- (3)
Slow acceleration or deceleration stage of the landslide mass
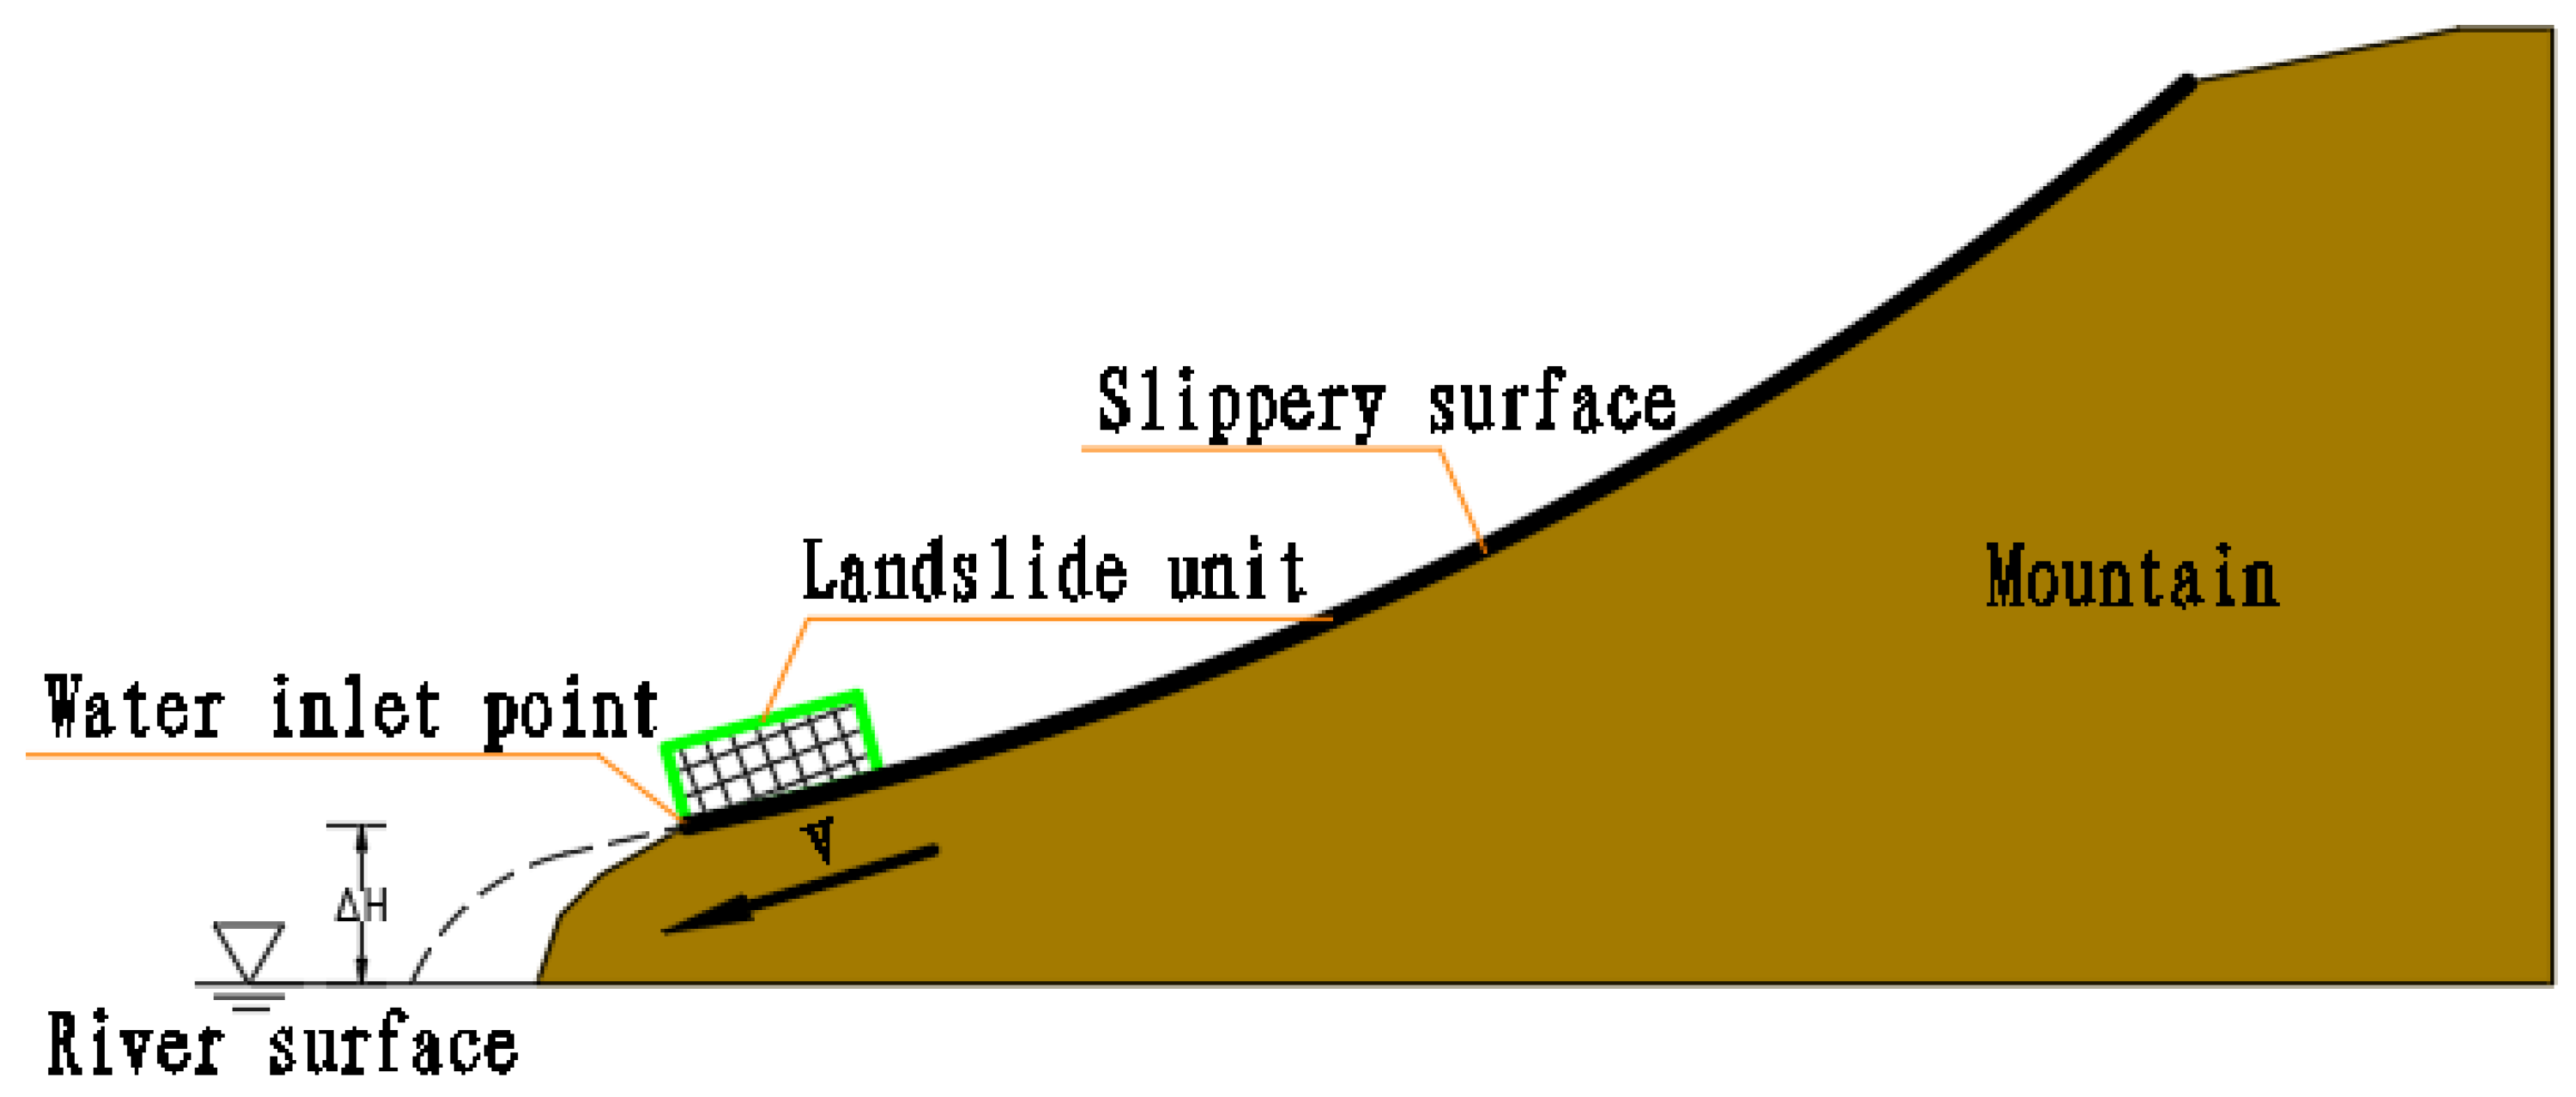
After a landslide body rapidly slides down a slope, its center of gravity decreases, and the energy is gradually consumed. Therefore, the sliding speed of the landslide body gradually decreases, and the movement of the landslide body tends to stabilize. This stage can also be called the relatively stable stage. When the leading edge of the sliding block reaches a position near the water inlet point (as shown in
Figure 6), if the landslide body is at a certain height above the water surface, it will first detach from the sliding groove and enter the water through the air. If the shear outlet height is near the water surface, it will slide directly into the water along the chute. At this stage, the motion of the slider begins to become nonlinear and is affected by friction, air resistance, and drag force, resulting in a slow acceleration or slow deceleration in speed and a decrease in acceleration.
- (4)
Rapid deceleration stage of landslide mass
After entering the water, the landslide body is affected by the resistance of the water body and the enormous frictional resistance generated when it reaches the bottom of the river, and it begins to decelerate sharply and quickly stops moving within a short period. (as shown in
Figure 7). The speed and acceleration will sharply decrease, manifesting as negative acceleration. At this stage, swells are also generated immediately. Factors such as landslide mass, the river water body, and river morphology play the most direct roles in the formation mechanism of landslide surges.
3.2. Experimental Simulation of the Movement Process of Loose Rock Landslides
In response to the four stages of landslide movement detailed above, model tests of a loose rock landslide were conducted and simulated with similarity to the landslide movement process in this study. The experiment used high-definition cameras to record the landslide movement process fully. It used a total video converter to convert the video collected during this process into images in order to clearly observe the changes in the shape of the landslide during the movement process.
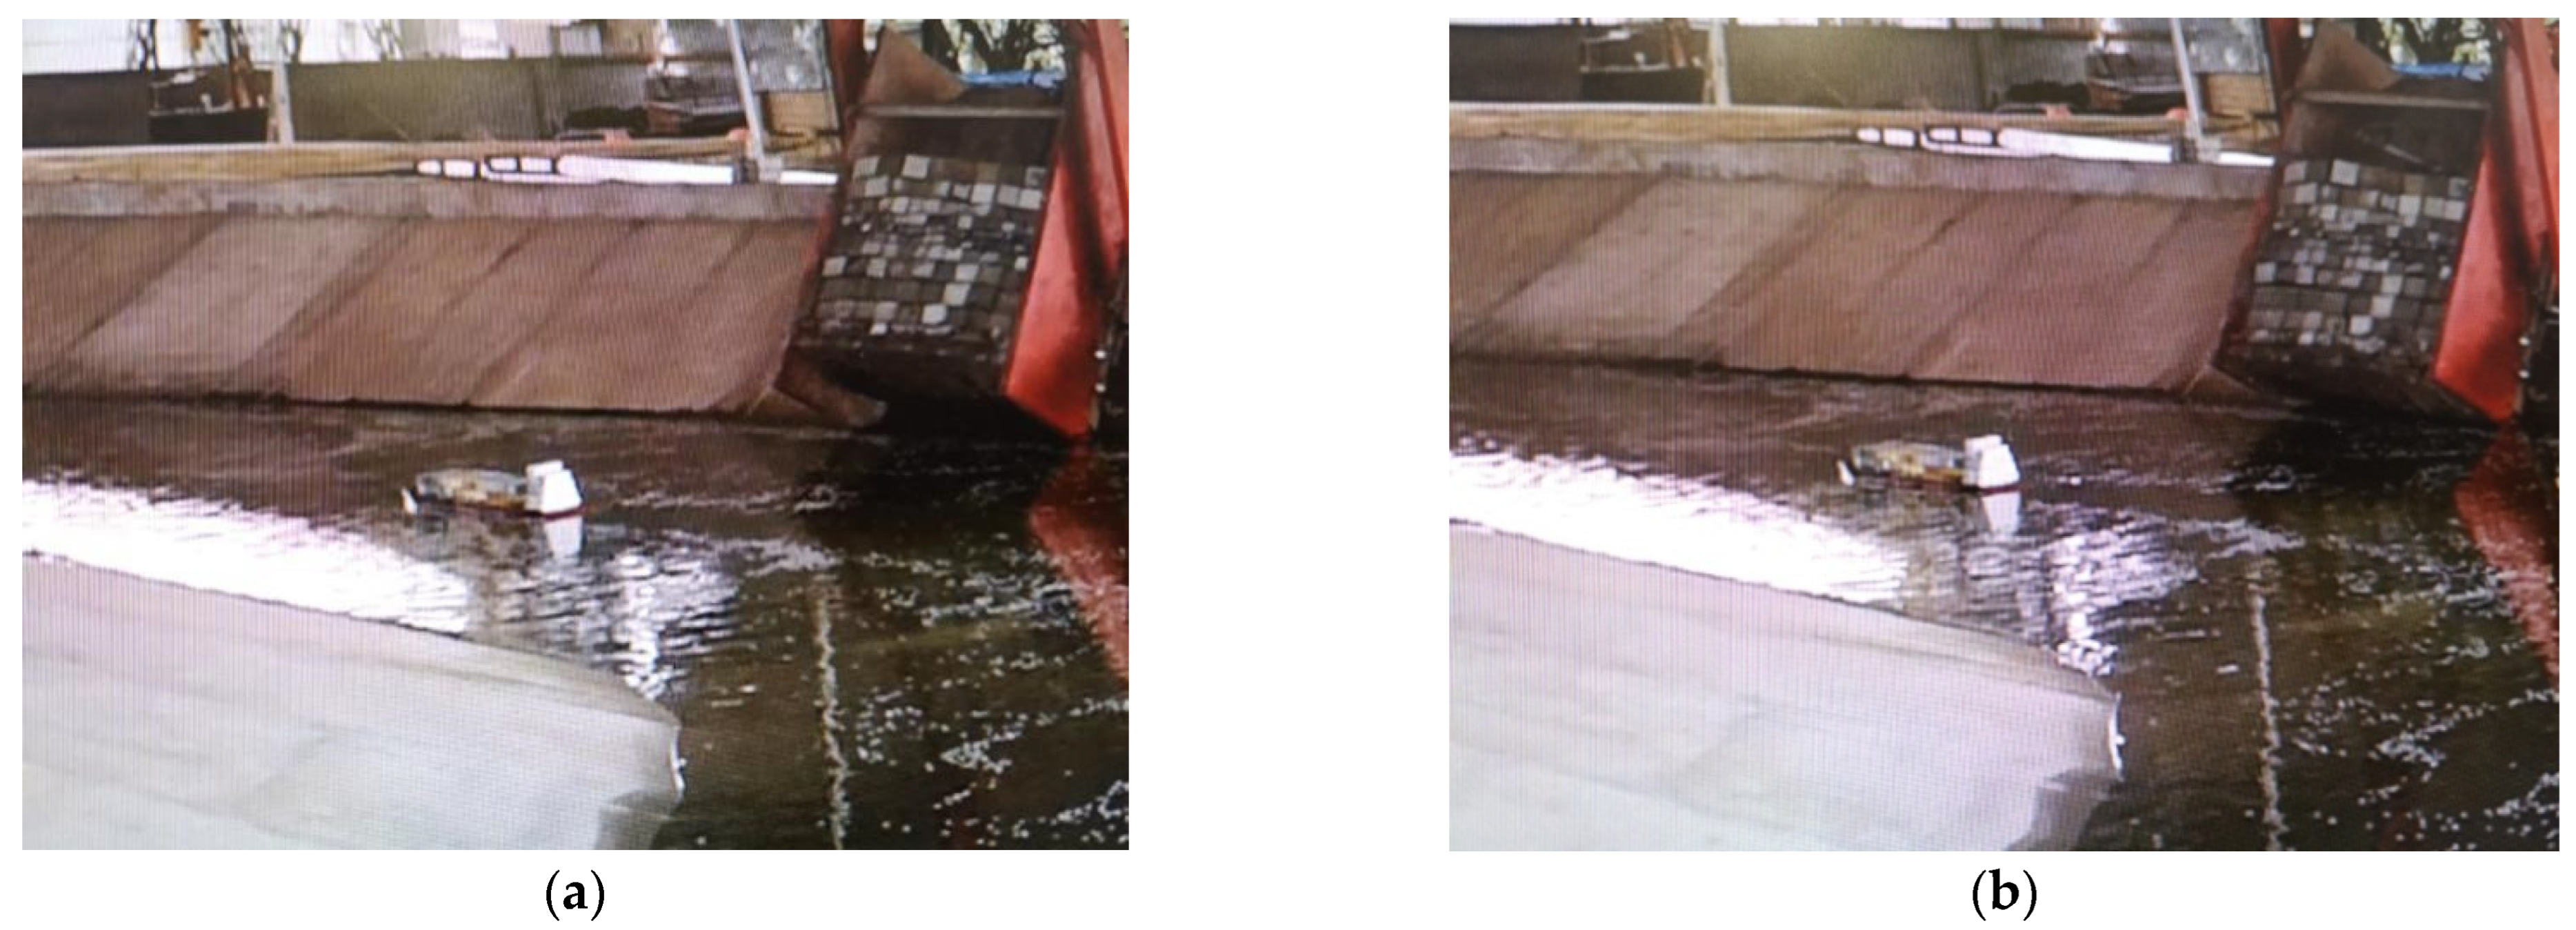
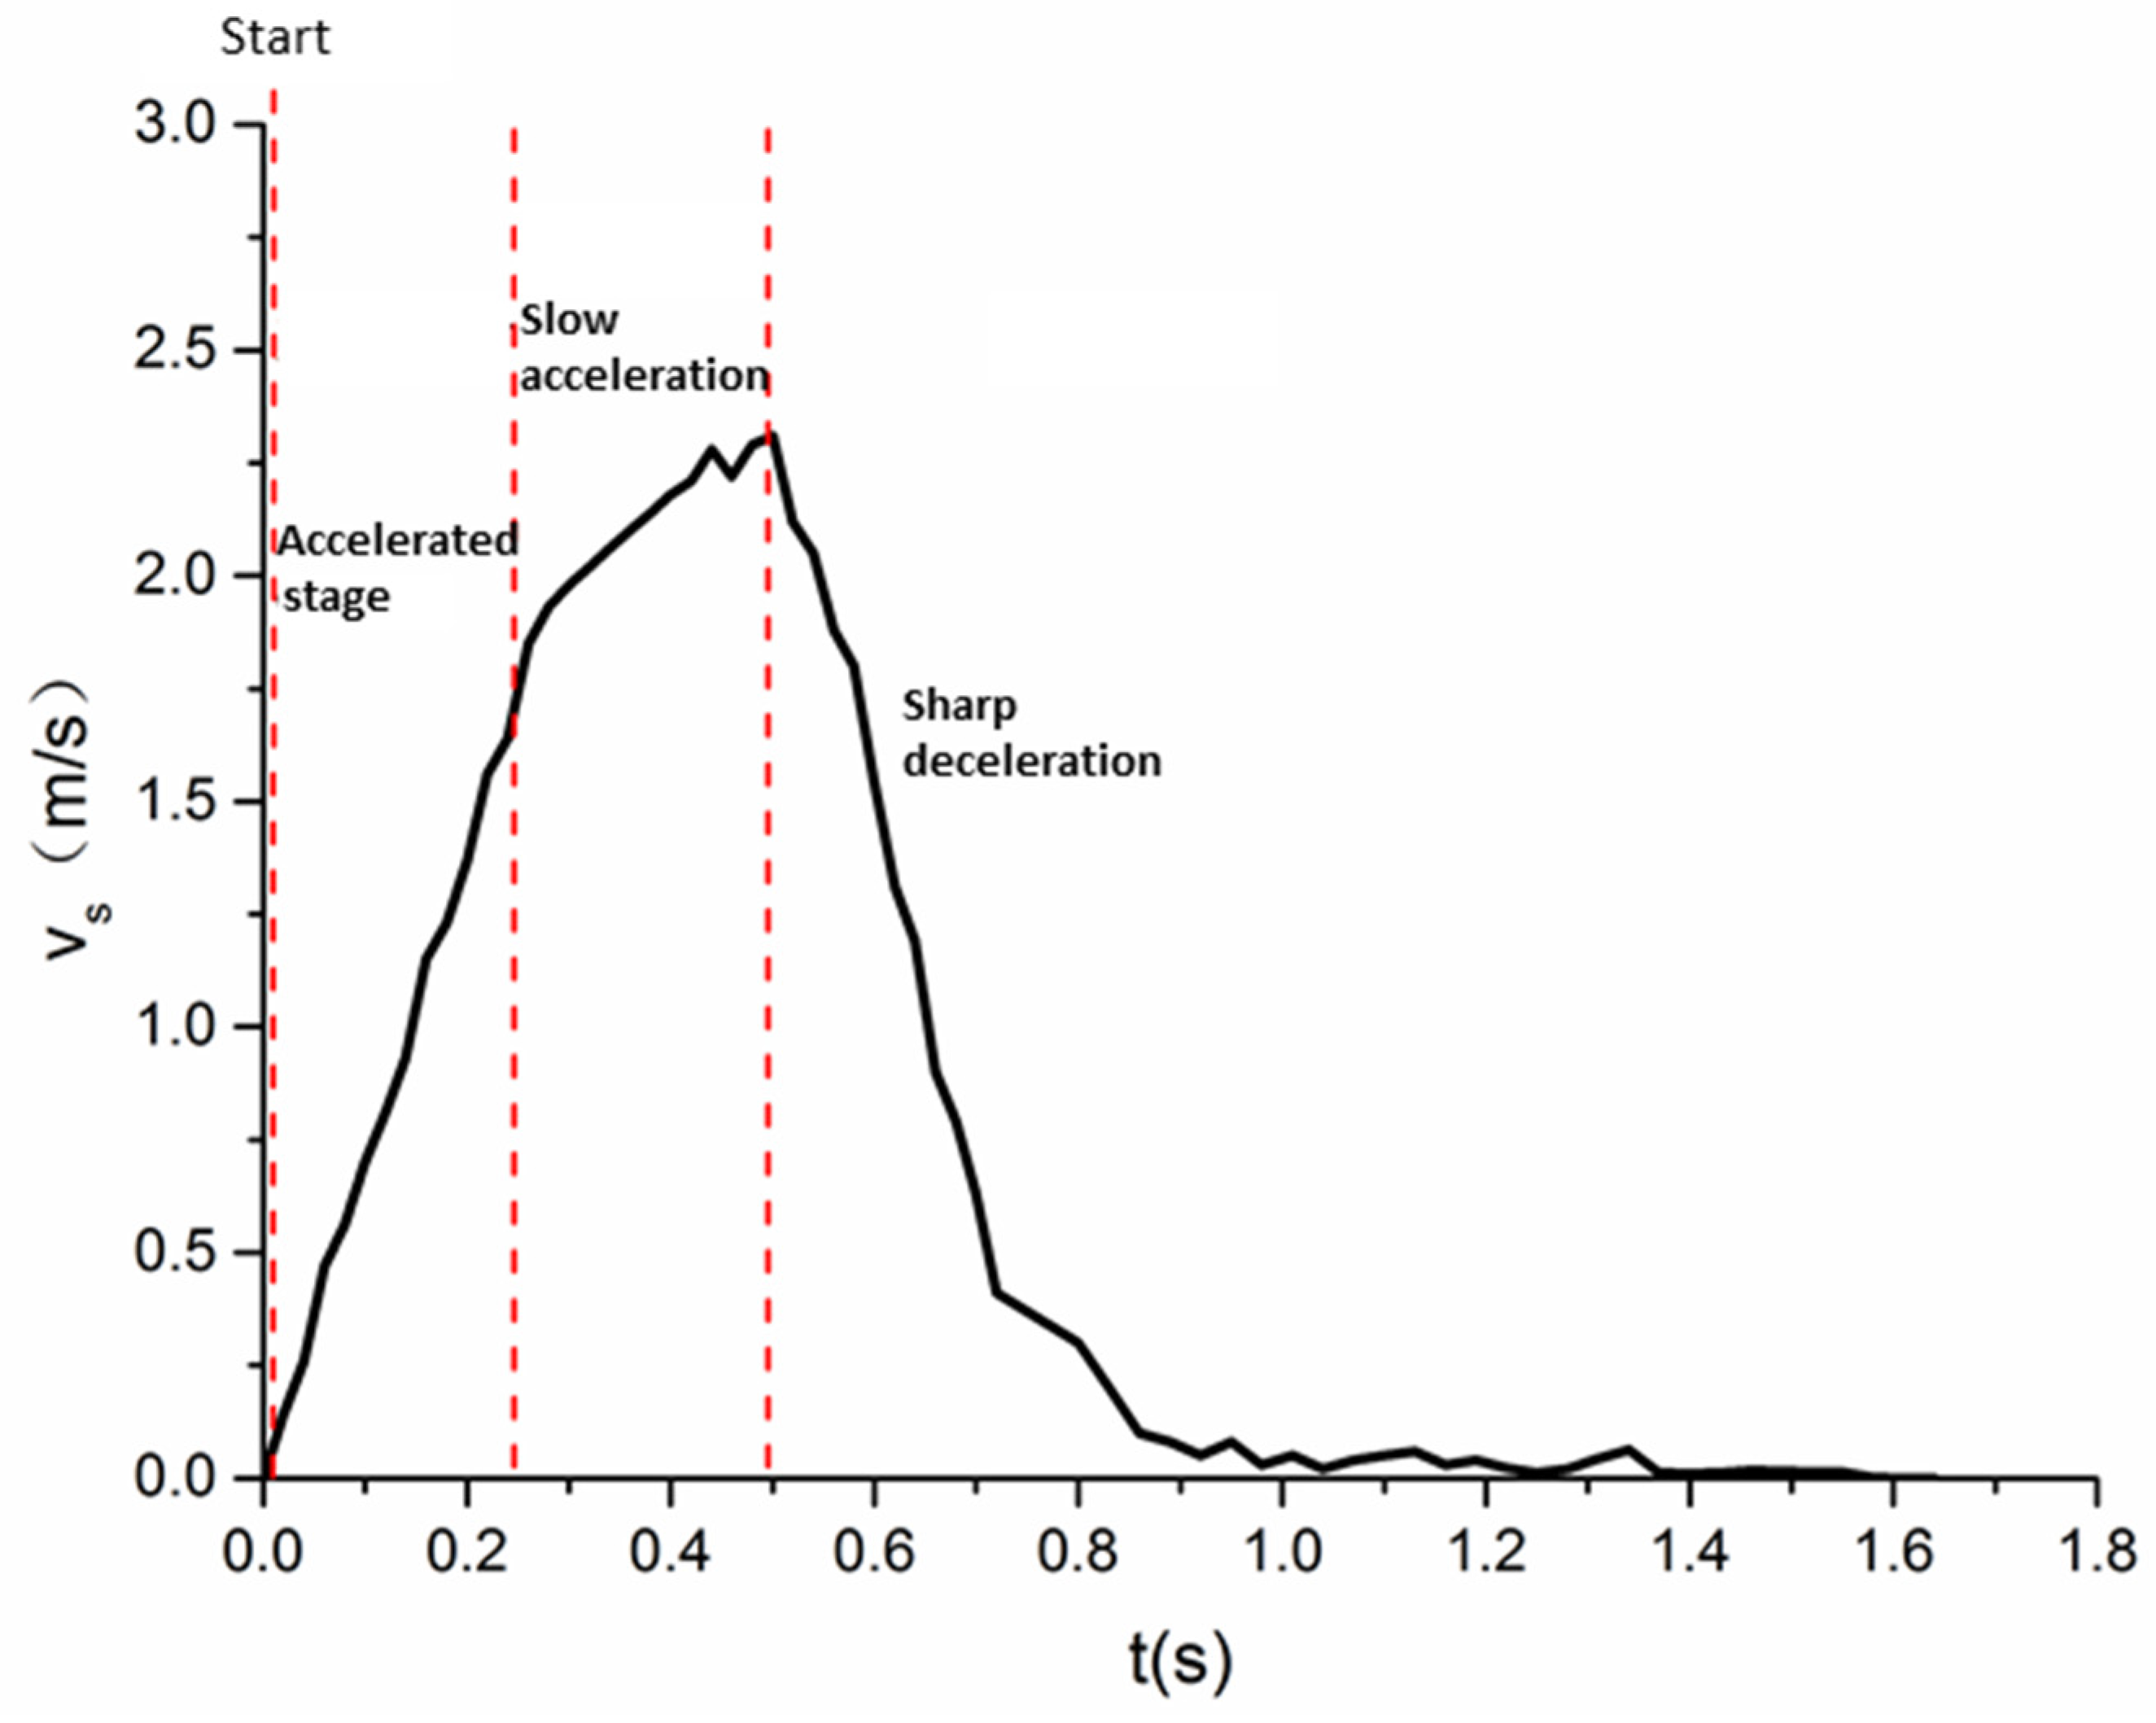
During each test, blocks of different sizes were arranged according to the distribution of the cracks; then, the parameters were adjusted according to the model test conditions. The landslide began to move and entered a data collection state. After the instrument had completed the collection record, the testing of this group was completed. The high-definition video screenshots of the landslide movement process taken during the M10 model test were selected, and the variation in the landslide movement speed was analyzed over time, as shown in
Figure 8 and
Figure 9. From the figures, it can be seen that the motion process of the simulated landslide in the experiment was similar to the motion characteristics of the four stages of the landslide mentioned above.
The first stage: after the gate of the chute opened, the landslide block as a whole began to move along the chute in a very short period of time, which was the starting stage (
Figure 8a).
The second stage: under the force of gravity, the landslide body accelerated along the sliding groove, and during the sliding process, phenomena such as compression, fragmentation, dispersion, and impact occurred; this was the accelerated sliding stage (
Figure 8b).
The third stage: during the sliding process, the center of gravity of the landslide gradually decreased, energy was gradually consumed, and the sliding speed gradually decreased before reaching motion balance until the front edge of the landslide was about to impact the water surface. This was the stage of slow acceleration or deceleration (
Figure 8c).
The fourth stage: after the landslide entered the water, it underwent settlement or lateral diffusion due to the resistance of the water body or the drag force of the water flow, resulting in a sharp decrease in movement speed. After reaching the bottom under the water, it stopped moving, representing the stage of rapid deceleration (
Figure 8d).
Due to the small height difference between the simulated loose rock landslide and the water surface, the completion time of the above four processes was very short: approximately 1–3 s. This is in line with the strong suddenness and short movement time characteristics of actual large and medium-sized rock landslides. In fact, the movement patterns of the four stages of loose landslide particles are similar to the characteristics of layer moving, contact moving, and jump moving in river sediment movement. The movement of landslide particles after entering water is similar to the sedimentation, diffusion, and movement of sediment particles along slopes and riverbeds. At the same time, the movement of loose landslide particles is similar to the movement of debris flow and can thus be regarded as a type of debris flow or particle flow movement. Therefore, research can be conducted based on relevant theories in sediment motion mechanics.
3.3. Shape and Submergence Rate of Landslide Deposits
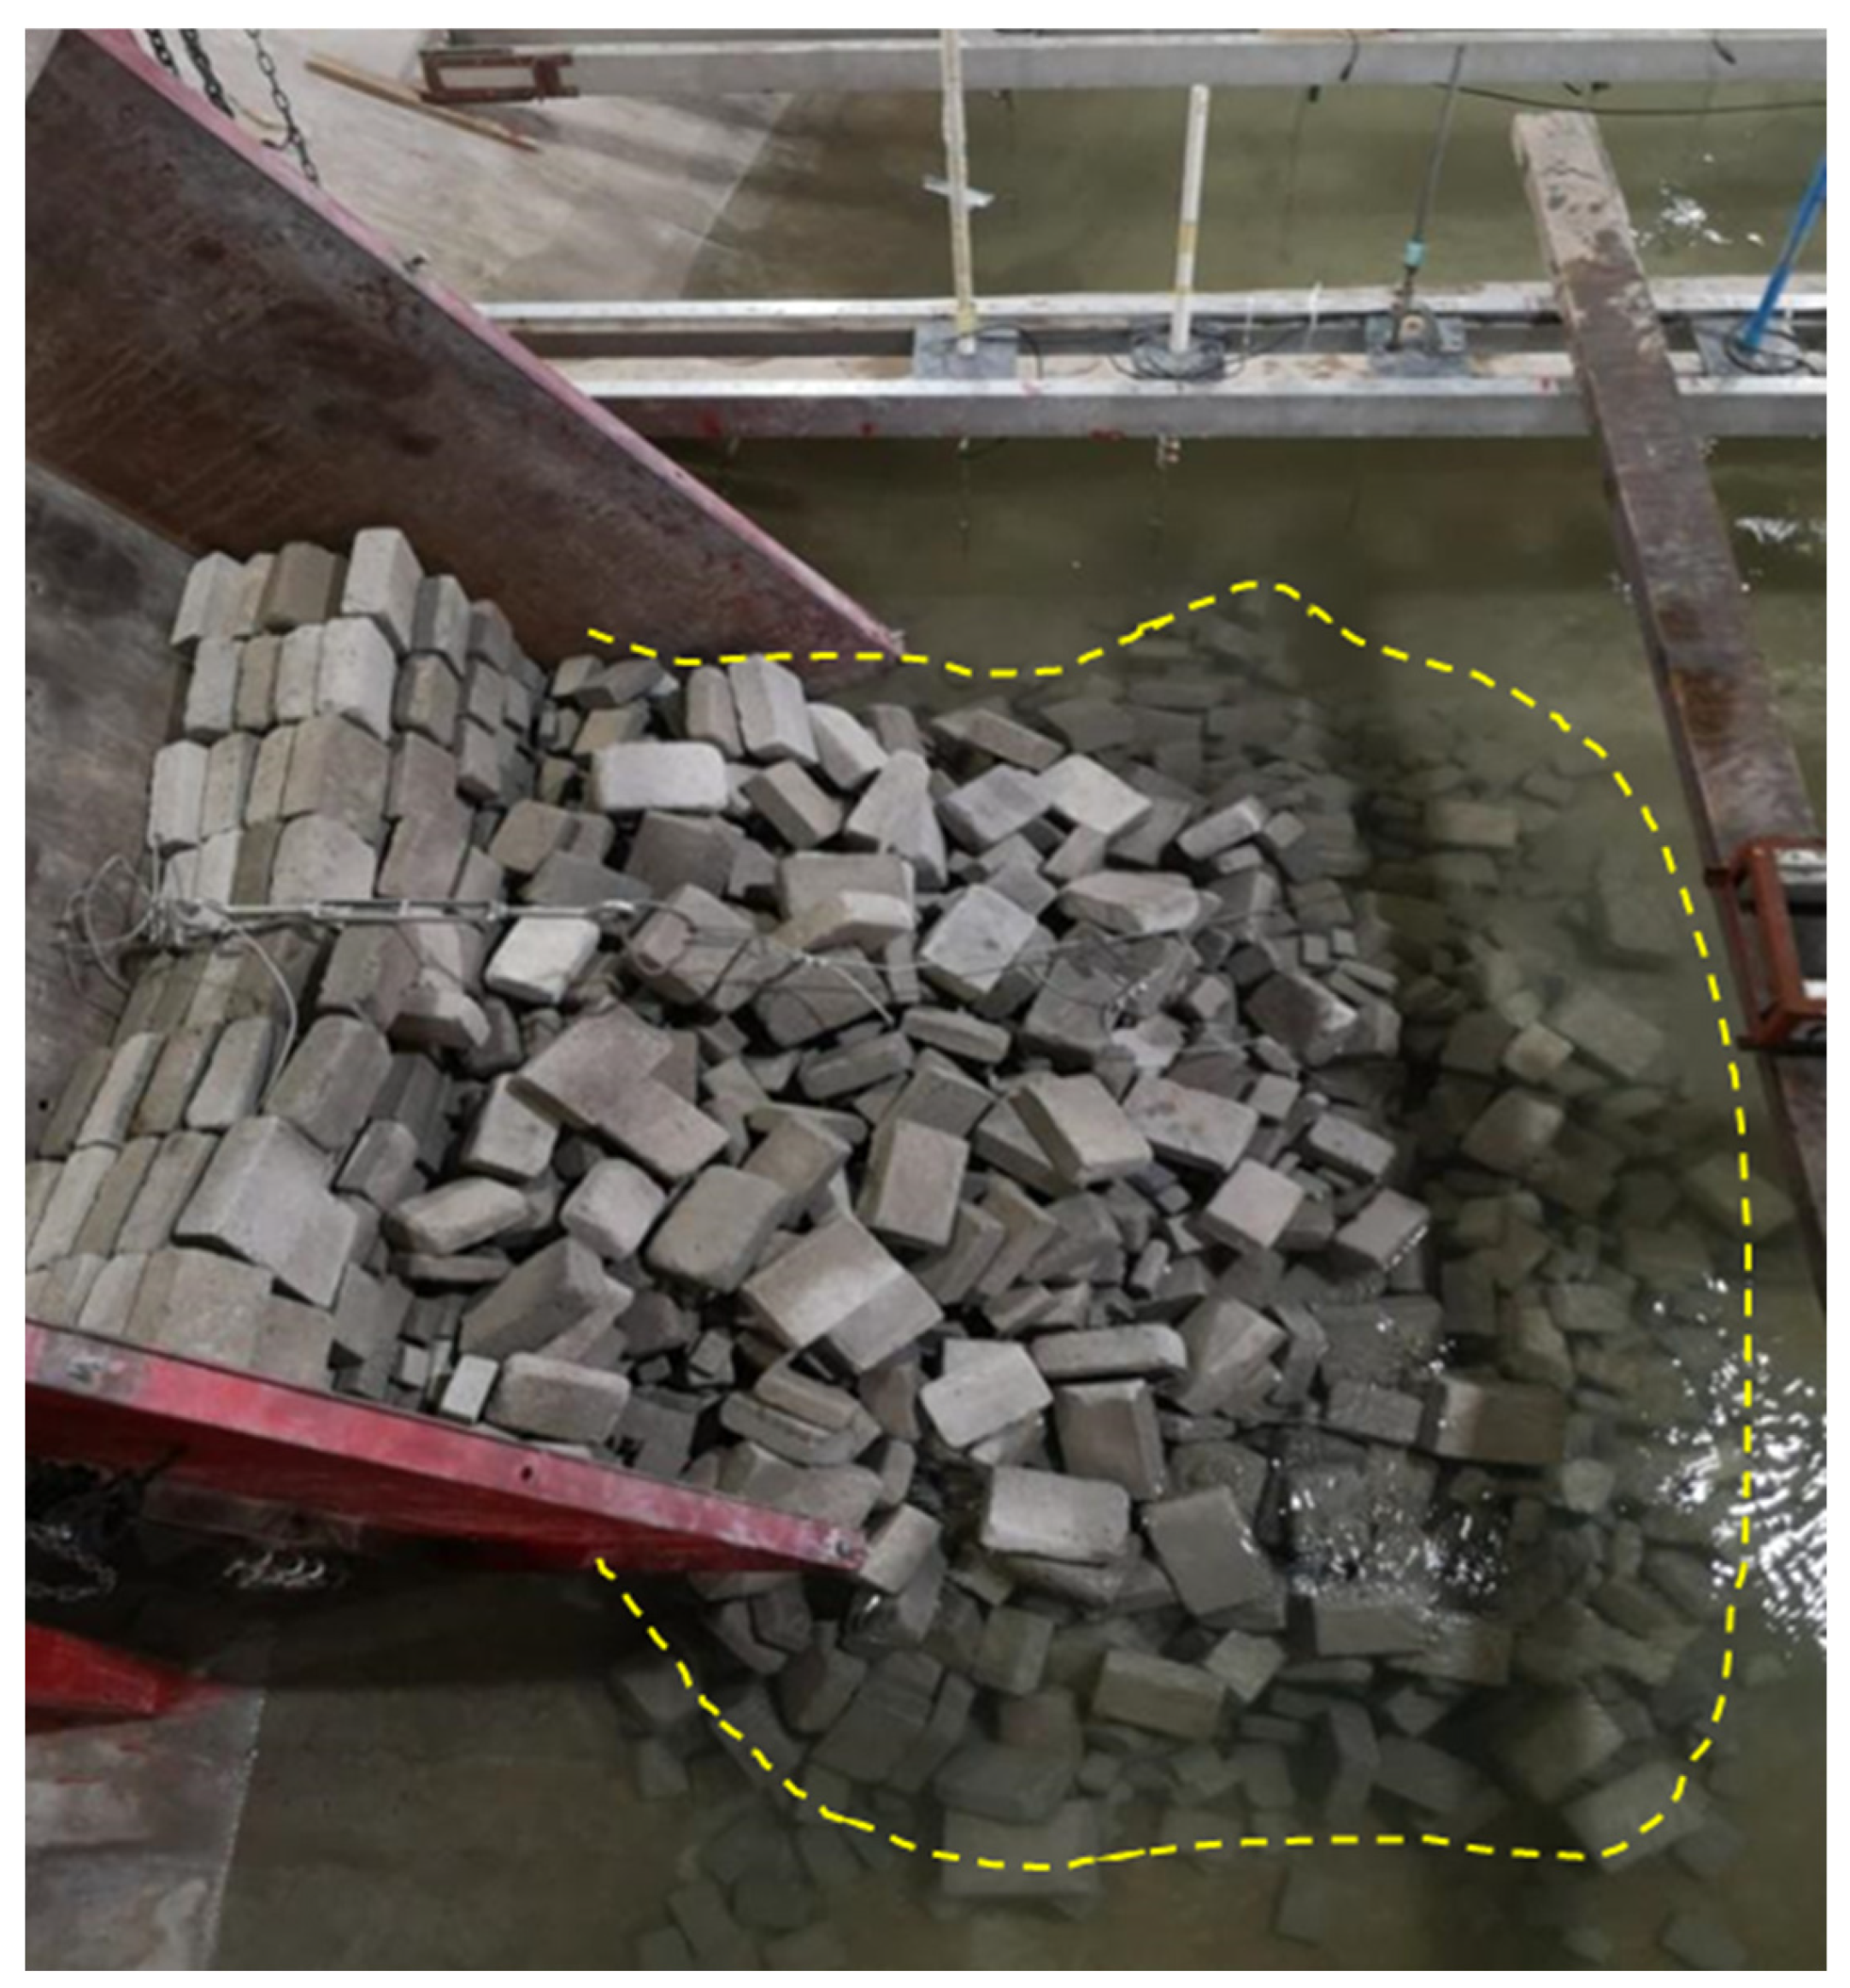
For landslides in shallow waters, the test landslide body in this study showed that during the movement process, the block movement speed of the front edge and upper part of the landslide body was faster than that of the rear edge and lower part. The maximum thickness of the landslide body also rapidly decreased as the landslide accelerated downwards. However, as time goes on, the sliding speed of the landslide body slows down, and the thickness of the landslide body also tends to stabilize until it enters the water. As the landslide continues to slide, its thickness continues to decrease while its length increases. After the initial front edge sliding mass stops moving at the bottom of the water, the subsequent sliding part of the sliding mass continues to accumulate in the water or spreads around to form a riverbed accumulation body until the accumulation body is exposed to the water surface. The subsequent sliding mass stops moving and no longer enters the water body. At this time, some of the sliding mass will stop on the land slope. Vajont gradually becomes a shape with a small thickness of the upper part above water and a large thickness and width of the underwater accumulation, featuring fan-shaped features. The submerged accumulation is partially shaped like an elliptical, circular table, with many large particles distributed on the surface layer of the accumulation.
Figure 10 shows the morphological characteristics of landslide accumulation in the model test of this study.
After sliding into the water, the landslide body may be partially or completely submerged due to the varying depths of the water body. The submergence rates of landslide masses are an important parameter for distinguishing between shallow-water and deep-water landslides and are also an important factor affecting the characteristics of near-field swell and the degree of disaster. Usually, if a landslide body is not completely submerged in the water and there is still some exposure above the water surface, this type of landslide can be defined as a shallow-water landslide; if the landslide is completely deposited in the water body, it can be called a deep-water landslide. At present, the volume discrimination method is used to distinguish the two, i.e., the volume of the landslide body is represented by
, and the volume of the underwater accumulation body is represented by
: if
, it relates to a shallow-water landslide; if
, it pertains to a deep-water landslide [
25]. Landslides in shallow-water areas may cause river blockages or even the formation of barrier lakes due to the size of the landslide entering the river, which seriously affects navigation safety and engineering facilities. Typical examples of landslides in shallow-water areas include the Xintan landslide, Jiguanling landslide, Qianjiangping landslide, and Tangjiaxi landslide in China, and Italy’s Vajont Reservoir landslide.
There are two main differences between landslides in shallow and deep waters. First, landslides in shallow waters are partially submerged, resulting in changes to the shape of the river channel, which can easily cause river blockages and have significant impacts. However, landslides in deep waters are completely submerged in the water body, which has a smaller impact on the river channel. Second, according to existing surveys and research results, under the same conditions, the height of the surge caused by landslides in shallow waters is greater than that of landslides in deep waters. The higher the surge, the greater the energy it carries, and the stronger the harm. Therefore, the degree of disaster caused by landslides in shallow waters far exceeds that of landslides in deep waters (Han [
28]). There are relatively rich research results on landslide surges in deep-water areas, but there are relatively few research results on landslide surges in shallow-water areas.
Defining the landslide inundation rate,
, as the percentage of inundation volume,
, to the total landslide volume,
, yields the following equation:
In this study, the inundation volume of a landslide mass was measured and calculated under 28 experimental conditions, with the inundation rate for each condition calculated according to Equation (1). The results are shown in
Table 2 and
Figure 11. From this, it was found that the landslide inundation rates under all experimental conditions were 0.25~0.75, and the relatively concentrated inundation rate was 0.35~0.65. The landslide surge tests in this study were not completely submerged deep-water landslide surge tests but related to the shallow-water landslide surge test.
3.4. Identification of the Degree of River Blockage Caused by Scattered Landslides
A simple discrimination method can be used to determine whether a loose landslide will cause a river blockage after entering the water, i.e., the ratio of the maximum bottom width of the landslide accumulation body to the bottom width of the river channel (Liu [
29]):
In Equation (2), represents the blockage discrimination coefficient, also known as the blockage degree coefficient; represents the maximum bottom width of the underwater accumulation body (m); and represents the bottom width of the river channel (m).
The greater the value of , the greater the possibility of blocking the river and the more severe the potential blockage. If , it indicates the formation of landslide dams that block rivers, causing the most severe disasters.
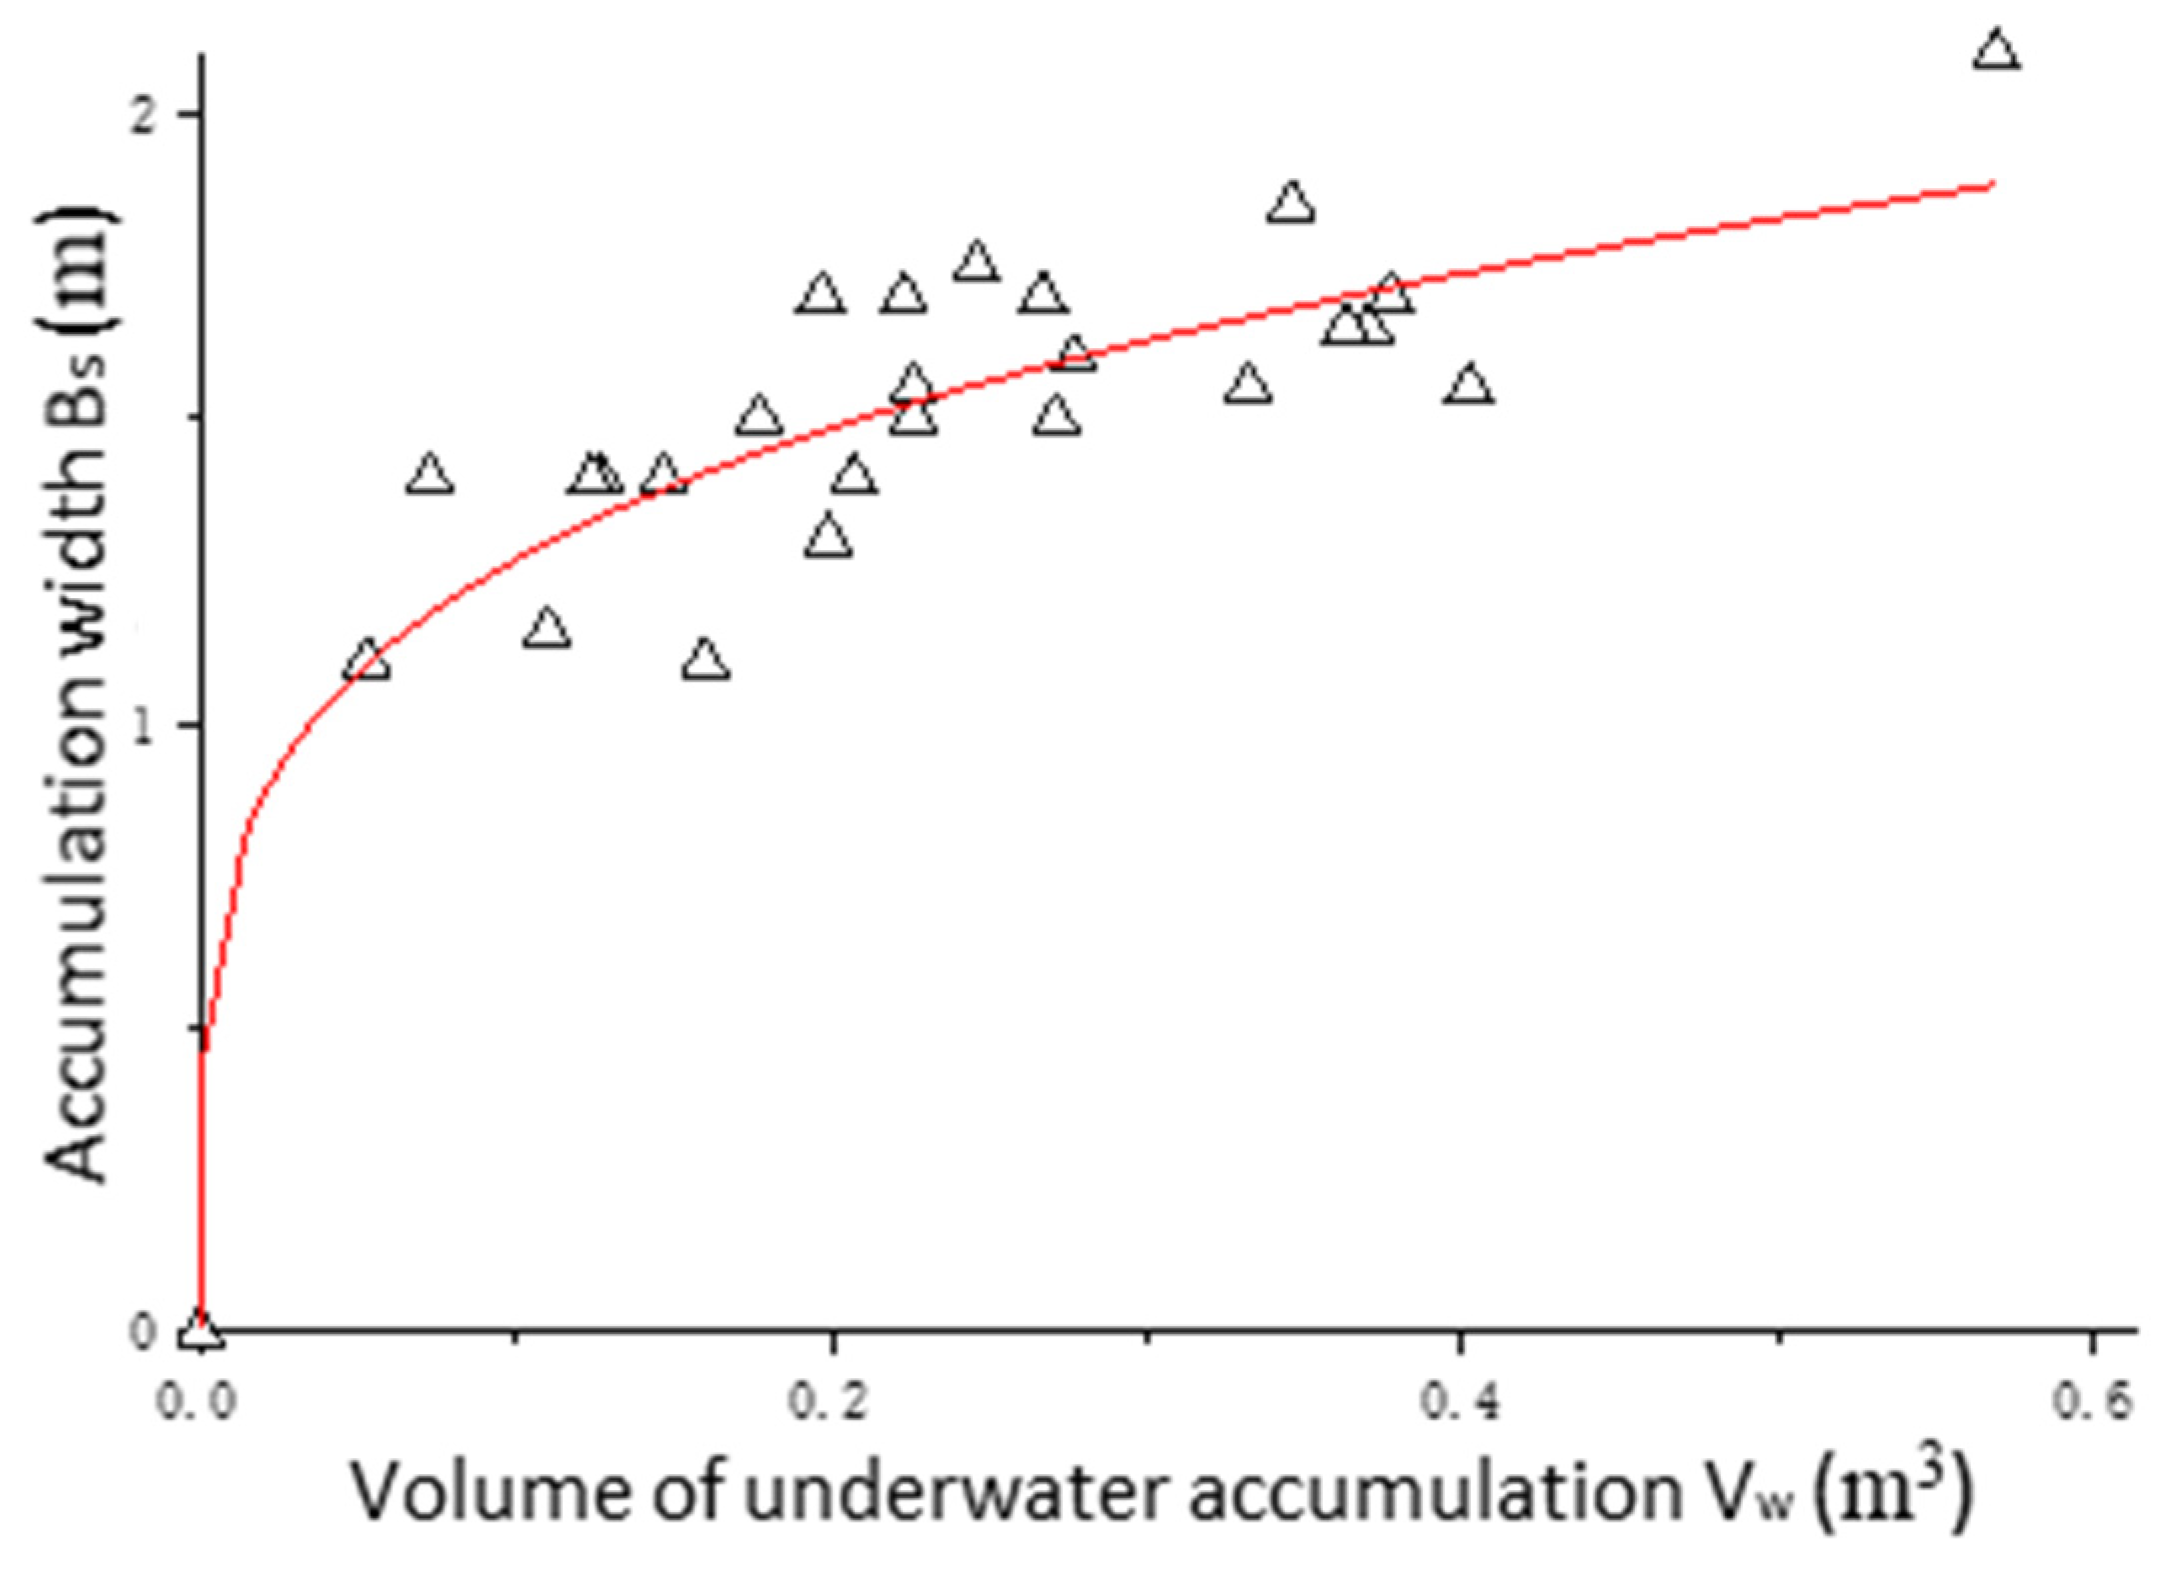
Table 2 shows that under all test conditions, the bottom width of the underwater accumulation body was 1.1–2.1 m, with a maximum bottom width of 2.1 m. The bottom width of the test tank was 2.94 m; thus, the ratio,
, of the maximum width of underwater accumulation to the width of the river bottom was 0.71, i.e., less than 1, indicating that the possibility of landslide dams blocking the river channel is extremely low. During the testing process under various working conditions, there were no cases of landslide blockages causing river interruption or even barrier lakes. According to experimental data, the relationship between the maximum bottom width of the accumulation body and the volume of the underwater accumulation body was plotted, as shown in
Figure 12. At the same time, the relationship was fitted between the width,
, of the dimensionless accumulation body (the ratio of the maximum bottom width,
, of the underwater accumulation body to the bottom width,
, of the river channel) and the volume,
, of the dimensionless landslide underwater accumulation body (the ratio of the volume,
, of the landslide body entering the water to the volume,
, of the water body), yielding a power function relationship with good correlation between the two (R
2 = 0.87), as shown in the following equation:
From
Figure 12 and Equation (3), the volume of underwater accumulation is directly proportional to the degree of blockage of the river channel. Therefore, under the same conditions, as the volume of a landslide increases, the volume of underwater accumulation will also increase, increasing the severity degree of river blockages and even forming barrier lakes.
4. Conclusions
Based on the structural characteristics of rock mass in the Three Gorges Reservoir area, the characteristics of main and tributary river channels, and the flow conditions, a three-dimensional granular rock landslide surge model test underwater flow dynamics was designed and conducted in this paper. The experimental simulation of the four stages: starting, accelerating, slowly accelerating or decelerating, and rapidly decelerating of the movement process of the landslide body was conducted, and the variation process of the movement speed with time was given. The morphological changes of the landslide during its movement were analyzed, and it was concluded that the submerged accumulation body partially presented the characteristics of an elliptical truncated cone. The submergence rate of the landslide body under various test conditions was calculated statistically, and the relationship between the dimensionless accumulation width, , and dimensionless landslide submerged accumulation volume, , was obtained using dimensionless fitting analysis. The results showed that the volume of the landslide body entering the water was directly proportional to the degree of river channel blocking. The research results in this article are only applicable to landslides in shallow waters; there may be deviations in deep waters. This experiment mainly studied the movement and accumulation characteristics of granular rock landslides; further research is needed on the movement and accumulation characteristics of steep rock and soil landslides.


