Abstract
The article considers a mathematical model of the hydrolithospheric process taking into account the skin effect. A methodology for using the results of groundwater inflow testing to determine the parameters of approximating models that take into account skin effects is presented. In addition, the problems of modeling hydrodynamic processes taking into account random factors are considered. A statistical analysis of well monitoring data was carried out and an algorithm for studying processes was developed. Using the obtained approximating models, a procedure for solving the problem of selecting the optimal number of production wells has been developed. Based on the results of the groundwater inflow testing, the prospects for the development and use of new aquifers can be determined.
1. Introduction
Currently, billions of people directly depend on groundwater resources. At a time when anthropogenic factors exert a significant influence on the environmental aspect of this crucial resource, the issue of the ecological safety of mineral and groundwater is becoming a common challenge for humanity as a whole. When examining the extraction of mineral water on a global scale, several key problems can be identified at present, arising in the development of deposits [1,2,3].
The first problem, which is at the same time the most important and can also entail very serious consequences, is insufficient study of the area in which the deposit will be developed [4,5]. Mineral water extraction requires a thorough study of the area before development, as well as consideration of many aspects related to the mining conditions of specific deposits. It is also crucial to fully study the area in which mining will be carried out, at all its ecological levels, since the development of a mineral water deposit is a complex process that can affect all natural and environmental aspects of the surrounding area [6,7,8].
Before starting the development of a mineral water deposit, it is essential to consider all the physical and geological aspects of the deposit itself, its distance from populated areas, the intensity of production, the physical and geological characteristics of the surrounding soils, as well as all the environmental conditions of the area [9,10,11]. Additionally, it is critical to draw up a plan for the development of the deposit, and not to neglect the recommended conditions for the technological process of developing a mineral water deposit.
Often, neglecting to properly study the area and aspects of mining can lead to dire consequences for the ecology of the surrounding area, as well as for people living in surrounding settlements. For example, insufficient study of aspects of production can lead to multiple violations in field development technology, leading to insufficient or too intensive production, and the consequences of this can include violations of the ecological balance of the production region, geological disasters, mudflows, landslides, depletion of the region’s aquifer, and many others [12,13,14]. Also, among the global problems, we must highlight the environmental problem of the anthropogenic impact on the quality of underground mineral waters.
In the 19th and 20th centuries, due to globalization and industrial revolutions, the active growth of settlements, factories, and enterprises began. The main substances that these objects release, particularly into the soil, are, for example, petroleum products, zinc or copper compounds, mercury, phenols, and so on—all of these are the main substances that pollute underground water sources. Consequently, the main reason for the decline in water quality and the deterioration of its physical and chemical composition has come to be human activity, that is, our environmentally damaging behavior and environmental pollution.
In general, the state of water resources directly depends on the state of the ecological environment of the region, its biosphere and chemical processes, and hydrogeological conditions. Today, humans’ influence on groundwater continues to increase. Our massive development has an active influence on the upper layers of soil, and it is there that the main potable water reserves are located. In addition, they are most susceptible to pollution due to the relatively low distance to the upper soil layer and low filtration. This contributes to the very slow self-purification of such waters. Furthermore, it transpires that after underground waters, pollution travels no further, meaning aquifers become a kind of final reservoir for pollution. It can also be noted that due to the same mass development and anthropogenic influence, the load on the reservoir increases greatly, which leads to the migration of water into deeper or neighboring layers, while continuing to be polluted [15,16,17,18].
In discussing mineral water deposits, it is essential to take into account their spatial dimensions. This necessitates conceptualizing the management subject as a system characterized by distributed parameters. Moreover, when examining this system, the impact of random factors on hydrogeological processes should not be overlooked.
Comprehensive details on the construction of mathematical models for hydrological processes are extensively presented in the studies by E.A. Lomakin, I.K. Gavich, P.K. Konosavsky, and V.V. Antonov, among others [18,19,20]. These researchers have significantly advanced the development of methodologies for creating two-dimensional models. However, their methodologies are not directly applicable to developing three-dimensional models of spatially distributed objects. The analysis of distributed systems, particularly in the frequency domain, was explored in [21,22,23]. Recent research in control systems with distributed parameters, particularly the works of Director JSC “Narzan” and A.V. Malkov, have been pivotal in refining theoretical approaches to controlling hydrogeological entities [2,24,25]. In the realm of stochastic systems, meanwhile, there are numerous contributions to date [26,27,28]. However, these studies, whether focusing on concentrated or distributed systems in the control field, do not delve into the analysis of random processes.
Therefore, the primary objectives of this study were enhancing the economic efficiency of mineral water extraction while minimizing environmental threats. With those in mind, we set out to analyze hydrogeological processes under random influences, find methods and algorithms for management, and identify laws for optimal functioning of the technological process [29,30,31].
To achieve the above objectives, the study of hydrodynamic processes in aquifers and the construction of mathematical models for the rational use of water resources is a priority, and the specific direction we took with this study was to investigate the control system of hydrolithospheric processes, aimed at preserving the quality and reserves of the mineral water in the deposit by controlling the piezometric level in the exploited aquifer. To that end, it was necessary to conduct a detailed analysis of the hydrogeological object, examining the inherent random processes that affect the hydrodynamic parameters during the exploitation of the deposit [32,33,34,35]. With that purpose, systematic analytical modeling of the technical and physical elements of the research object at different management levels was required, followed by the development of a mathematical model that accounts for random disturbances [2,36,37]. The object of study was an exploited site in the Caucasian Mineral Waters region.
2. Materials and Methods
Observational data from monitoring wells indicate the consistency of oscillations in pressure. These fluctuations might stem from various sources, including disruptions in the technological process due to equipment malfunction, or changes in aquifer flow rates influenced by weather and human activities. The human factor is significant; for instance, ongoing urban development over the past two decades in the extraction area under study has impacted soil settlement and altered impermeable layer structures. Moreover, in areas lacking centralized sewage systems, septic tank pollutants seep into the groundwater, exacerbated by rainfall. While such issues might not significantly impact the mineral water quality under high aquifer pressure, unregulated water extraction causes pressure drops, leading to the infiltration of impurities into the exploited layers and aggravating environmental conditions [38,39,40,41].
Sometimes, when influenced by a range of factors, the observed pressure variations can only be interpreted as uncertain and random processes. These should be factored into the development of mathematical models for hydrolithospheric extraction processes. Additionally, seismic activities, with their unpredictable or random impacts on the deposit, are also worth considering. The hypothesized random factors are thought to affect water flow speeds in the aquifer and the rate of pressure decrease. When analyzing pressure trends in monitoring wells, it can be inferred that the model’s limitations include taking these random fluctuations to have a stationary nature [42,43,44]. In this study, a statistical analysis of piezometric level data from the monitoring wells in the specific deposit area was conducted to verify this hypothesis [45,46,47,48].
2.1. Statistical Analysis
Often, examining the graphical representation of a process is adequate to identify non-stationarity [18,19,20,21,22,23,24,25] in a series. However, to provide statistically robust evidence of stationarity, specific techniques are necessary. Here, methods like constructing the process’s correlogram and segmenting it into sequential observation groups were chosen for comparative analysis [49,50,51].
Our analysis of the piezometric level data series from the deposit’s monitoring well, employing the first method and using a correlogram, is depicted in Figure 1. The fact that the first-order autocorrelation coefficient is the highest suggests the presence of a trend in the time series.
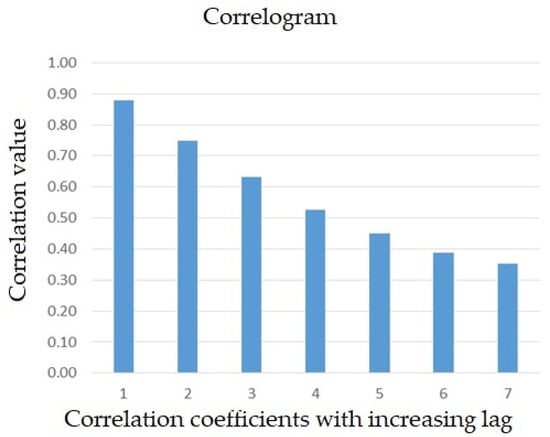
Figure 1.
Correlogram showing the correlation coefficients between the original series of observations and the series shifted by time steps (from 1 to 7) [51].
The correlation decreases steadily with increasing lag, pointing to the series’ stationarity, indicating that its probabilistic characteristics remain constant over time. To validate these findings, we examined the data using a secondary method for determining stationarity [2,52,53,54].
The results of previous studies were summarized and systematized in the form of an algorithm that can be used when analyzing monitoring data from sensors at observation wells of a hydrogeological object in order to assess the stationarity of processes. The analysis technique is divided into several stages, some of which can be repeated until the desired results are obtained:
- (1)
- Monitoring the dynamics of the piezometric level in observation wells. Obtaining time series from sensors;
- (2)
- Estimating the stationarity of a series using a correlogram:
- (2.1)
- Calculating the correlation coefficient for the original series versus series with a lag (1st, 2nd, 3rd order, etc.);
- (2.2)
- Constructing a histogram using autocorrelation. Obtaining a correlogram;
- (2.3)
- Then, performing correlogram analysis: if the correlogram fades and tends to zero, then we accept the hypothesis that the series is stationary; otherwise, the hypothesis of stationarity is not accepted;
- (3)
- Estimating the stationarity of a series by using the method of sequential grouping:
- (3.1)
- Dividing a series into successive groups with an equal number of observations;
- (3.2)
- Calculating the means and variances of the resulting groups;
- (3.3)
- Comparing the means using Student’s t-test: if tcalc < ttable, then the hypothesis of stationarity is accepted; if tcalc > ttable, then the stationarity hypothesis is not accepted;
- (4)
- Removing trends:
- (4.1)
- Taking the differences in two consecutive values of the time series Δ;
- (4.1)
- The resulting series of residues is also analyzed using the t-test: if tcalc < ttable, then the stationarity hypothesis is accepted; if tcalc > ttable, then the hypothesis of stationarity is not accepted—it is necessary to repeat point 4.1 (taking differences in the next order until the series comes to a stationary form).
This technique may be used to model random impacts on a hydrogeological object.
2.2. Mathematical Models of Aquifers
Based on the findings of our studies of the hydrogeological object, a mathematical model of the deposit was compiled, as shown in Figure 2. Extraction of hydromineral raw materials is carried out using one production well. To monitor the state of hydrolithospheric processes, two monitoring wells were installed.
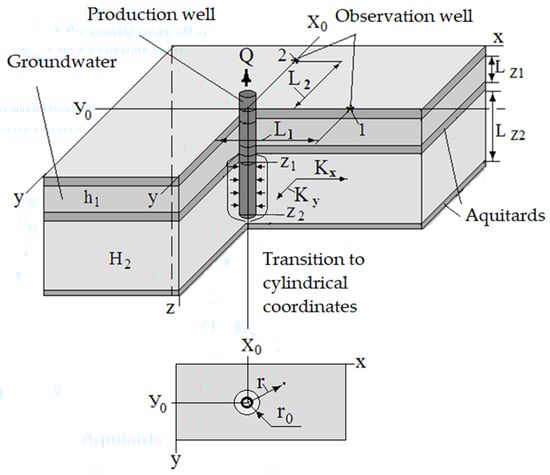
Figure 2.
Object of study.
The groundwater inflow testing carried out showed that a skin effect occurs around the production wells (the fine fraction of the rock is carried out along with the extracted raw materials). The hydraulic radius of the well with a negative skin effect increases, and with a positive one, it decreases. Figure 3 shows the formation of the hydraulic radius of the well (“well”) and depression funnel.
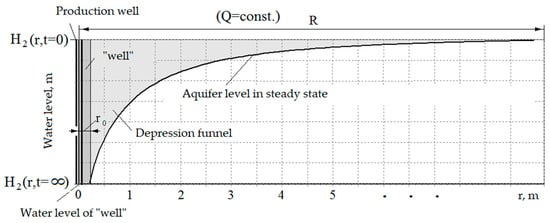
Figure 3.
Formation of a depression funnel.
Taking into account the formation of the hydraulic radius of the well and funnel, the mathematical model of hydrodynamic processes should be written in Cartesian and radial coordinates [55,56,57,58].
A description of the process in groundwater is as follows:
A description of the process in the aquifer is as follows:
Boundary conditions are described in the form of Darcy conditions. The boundary between the groundwater layer and the exploited aquifer is as follows:
Here, b1—flow coefficient 1/day; h1—pressure in the groundwater, m; H2, H2k—pressure in the exploited aquifer, m; —parameters of groundwater conductivity level along coordinate axes, m2/day; —filtration parameters of the exploited formation along the coordinate axes, m/day; —flow parameter on the side surface of the well, m/day; —elastic capacity of the aquifer, 1/m; μ—water loss coefficient, 1/m; r—radial coordinate, m (radius of the cylindrical coordinate system); z—Cartesian coordinate, m (height of the cylindrical coordinate system); Lz1, Lz2, R—values of the height of the layers and the radius of the depression funnel, m; τ—simulation time; h1,0, H2,0—initial pressure levels in the aquifers, m; and Q—flow rate, m3/day.
The developed mathematical model (1–9) cannot be solved by means of analytical methods. The studies given in [1] show that for a given flow rate of a production well, with an increase in the well radius r0 (Figure 2), the influence of flow rate on the level of the aquifer decreases.
The mathematical model was verified using field experiments at the mineral water deposit. When simulating the discrete model, it was found that with a flow rate Q = 100 m3/day (in Equation (2)), the decrease in water level at the location of the production well will be 2.55 m. Then, during the field experiments for 10 days with an average flow rate Q = 100 m3/day on the real deposit, the decrease in water level was 2.57 m. The model values and natural values of the water level decrease were close, which indicated the adequacy of the use of the mathematical model.
2.3. Problems of Modeling the Hydrolithospheric Processes under Consideration
The mathematical models discussed above do not have an analytical solution. In practice, discrete analogues of the equations under consideration are used to obtain numerical solutions. In this case, the following tasks are solved:
- Assessing the possibility of using the deposit under consideration in practical activities (determining the optimal location and number of production wells, maximum flow rates, etc.);
- Designing closed-loop control systems for production wells;
- Forecasting the development of hydrolithospheric processes in the near and long term.
Real hydrolithospheric processes certainly differ from the processes described by mathematical models. When describing mathematical models, it is assuming the following:
- Physical parameters do not depend on spatial coordinates. In reality, the parameters for different points in the spatial domain will differ;
- The geometric parameters of the areas in which the processes under consideration occur change according to nonlinear laws (for example, the thickness of aquitards nonlinearly depends on spatial coordinates; therefore, the flow coefficients for different points will differ);
- The geometric dimensions of the “wells” formed around production wells change during the operation of the wells.
In practice, solving problems of studying hydrolithospheric processes requires finite-dimensional approximation methods. These approximation methods should be used very carefully when studying systems with distributed parameters, because discretization of partial differential equations significantly [2] changes the properties of the model (a discontinuity in phase spaces occurs). That is, by developing a discrete model instead of a mathematical one, we produce a completely new object that differs in properties from the originally specified one. Research shows that when the discretization step size along Cartesian and radial coordinates changes, the characteristics of the discrete model also change.
In order to adjust the parameters of the developed field model, the results of groundwater inflow testing are used. When carrying out groundwater inflow testing, the physical parameters of the hydrolithospheric process can be calculated [3], and the dynamic and static characteristics of the process can be determined.
Solutions to practical problems using only the results of the groundwater inflow testing need to be considered, along with the determination of the parameters of the link that approximates the statics and dynamics of the process under consideration.
The research results given above show that in order to determine the parameters of distributed approximating links [4], it is preferable to use the results of phase analysis carried out at the deposit under study. If such results are absent, then verified discrete models should be used that describe the hydrolithospheric processes of the aquifer in question.
Through groundwater inflow testing, for the deposit under consideration, it was found that at a production well flow rate of 100 m3/day [2,49,59], the value of the production well influence coefficient K1 = 0.0257. Furthermore, the values of the coefficients of influence of the production well on the control wells are as follows: when the control well is removed from the production well at a distance L1 = Lx = 50 m, K2 = 0.00413; when the control well is removed from the production well at a distance L2 = Ly = 60 m, K3 = 0.00237.
To determine the dynamic characteristics of the process under consideration, a harmonic input action of the following form was applied to the input [60,61,62,63,64]:
Q(τ) = Q + 0.3·Q·sin(ω·τ), ω = 0.0005 1/s,
Q = 100 m3/day (or Q = 100/(3600·24) m3/s).
Q = 100 m3/day (or Q = 100/(3600·24) m3/s).
A graph of level changes in a production well (at the point where the sensor was installed at a depth of 75 m), with a harmonic input effect and over a time interval when the output function was close to a quasi-stationary mode, is shown in Figure 4. The value of the phase shift in this case indicates that at a high flow rate, the water level in the aquifer falls, and at a low flow rate, the water level in the reservoir increases [65,66,67,68]. Through calculations, the phase shift of the output signal relative to the input influence was obtained:
Δφ = −2π∙0.738/3.625 = −1.279.
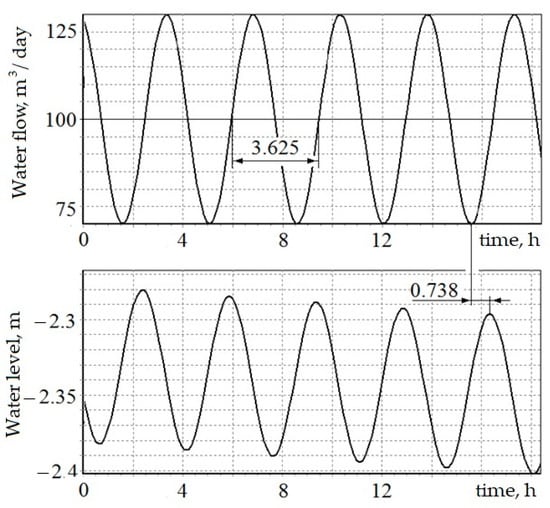
Figure 4.
Change in level in a production well.
We experimented with a technique for determining the parameters of links that approximate the static and dynamic characteristics of the objects under consideration. In this case, we assumed that the filtering coefficients for spatial coordinates {x,y} were different. The structure of the link that approximates the static and dynamic parameters of the object was written in the following form:
Here, K, Kn, D, a—determined coefficients; s—Laplace operator; and x, y—spatial coordinates.
As is known, around the production well, as a result of the skin effect, a “well” is formed. A mathematical description of the processes involved is shown in (2). Let us assume that its radius is r0 (Figure 2). Relation (12) is written in cylindrical coordinates:
Taking into account the “well”, (13) can be written:
The method for determining the static parameters of the approximating link (12) (a = jω = 0) takes the following stages.
When equating the static gains of the approximating link (14) to the values of K1 and K2, and assuming that L1 − r0 ≈ L1 (Figure 2) and L2 − r0 ≈ L2, we obtain a system of equations:
When substituting in the calculated values K1 = 0.0257, K2 = 0.00413, r0 = 0.2 m, L1 = Lx = 50 m, L2 = Ly = 60 m, and K3 = 0.00237, the following is produced:
When solving the resulting system, the following result will be obtained: D = 0.001449, K = 0.0010549, and Kn = 1.07647.
The mathematical model of the object, reflecting the static interaction, is written as follows:
During groundwater inflow testing, the dynamic characteristics of the control object were also studied. Since the sensor was located in the well area, the relationship for determining the phase of the approximating link could be written as follows:
By substituting in the original data D = 0.001449, K = 0.0010549, ω = 0.0005, and ∆φ1 = −1.279, and solving equation (18) numerically, we obtained a = 0.00004103. Since the dynamic characteristics (Figure 3) were measured inside the “well”, the dynamics and statics of the process under consideration can be described by the following equations:
2.4. Determining the Optimal Number of Wells
When developing a deposit, the prospects for the volume of hydromineral raw materials produced are determined. The possibility of constructing a “cluster” of production wells is considered. The area in which to locate the wells in question is determined based on landscape conditions.
A popular region for the extraction of hydromineral raw materials is the Caucasian Mineral Waters region, which has a mountainous landscape. Taking this as the setting, let the production well be positioned in the gorge shown in Figure 5.
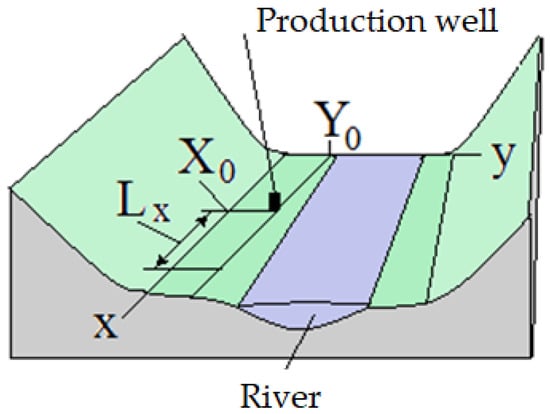
Figure 5.
Production well location.
2.5. Statement of the Problem of Optimizing the Number of Wells in a Selected Area
For the deposit under consideration, we sought to determine the number of production wells (n) that provides the maximum income (MI) over ten years of operation. In doing so, we assumed that the extraction of hydromineral raw materials was carried out within 3650 days; r0,i = 0.2 m (radii of the “wells”); N—the cost of 1 m3 of hydromineral raw materials was 500/1,000,000 million RUB; Cp—the cost of developing and maintaining one well for 10 years was 30 million RUB; the subsoil use tax was 7.5%; and Pz—the fixed costs over 10 years amounted to 100 million RUB. At the same time, the value of level decreases (∆Hi) in the zones where production wells were located was 10 m. The static transmission coefficient was described by relation (17).
The number of parameters that are taken into account when calculating profit can be expanded in accordance with the legislative framework. Increasing the number of parameters will lead to adjustments of the calculating formula.
3. Results
The procedure for solving the problem is divided into the following stages.
The influence of the j-th production well on the decrease in the level in the μ-th production well is described by the following ratio:
where ∆Hμ—level decrease in the considered μ-th well (μ = 1, …, n); r0,j—given radius; rμ,j is the distance from the μ-th to the j-th interacting wells (if the coordinates of producing wells change in x and y, then the calculation of rμ,j is carried out using (14)); n—number of wells; Qμ—flow rate of μ-th well; and Qj—flow rate of the j-th well.
By taking
and transforming it, we obtain a matrix equation for determining the flow rates of production wells.
The total water flow rate (Q) can be determined from the ratio:
The profit over ten years of field operation is determined by the following equation:
MI = (Q·N − Q·N·0.075)·3650 − Cp·n − Pz.
A program was developed to calculate the maximum income when the number of production wells was changed. Based on the calculation results, we plotted the graphs shown in Figure 6.
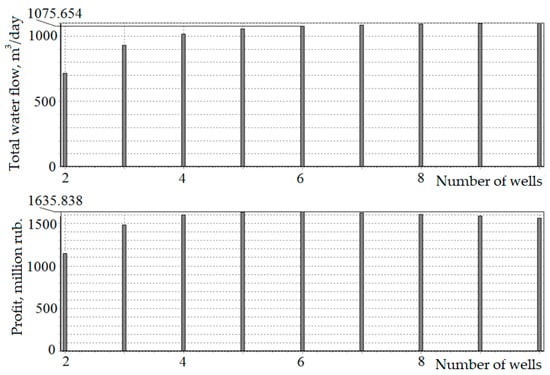
Figure 6.
Graphs of changes in water flow rate and profit with an increase in the number of wells.
The optimal number of production wells was found to be six. With six wells, the maximum income over 10 years of field operation will be 1635.838 million RUB and the total daily flow rate will be 1075.654 m3 of mineral water. So, based on the results obtained, there is no need to construct more wells.
4. Discussion
Excessive extraction of water results in a decline in the quality of the extracted mineral water and alters the chemical composition of the product. The expansion of a depression funnel can cause disturbances in the structure of the aquifer system and the disappearance of mineral springs. This scenario is applicable to all water sources situated in the Caucasian Mineral Waters region. Consequently, there is a potential risk of environmental deterioration of mineral water deposits.
Employing mathematical modeling allows for efficient control of the mineral water extraction process. Through the analysis of random factors, it becomes feasible to anticipate a decline in the piezometric level within aquifers. Furthermore, the optimization of the number of production wells can be achieved by developing mathematical models for hydrogeological entities.
Upon commencing production in the field, a limited number of wells is typically installed. With a surge in consumer demand for the supplied products (hydro-mineral raw materials), the number of wells can be increased. However, the construction of wells is very expensive. Furthermore, each well requires constant maintenance, which leads to a significant increase in labor and financial costs. To ensure it is worthwhile, a technique is used to determine the optimal number of wells, which allows the production company to maintain high profitability [1,2,65].
The maximum number of wells (for the aforementioned case) to be outfitted in segment Lx (Figure 6) should be capped at six. As has been shown, with a further increase in the number of wells, the profit does not increase, but even decreases. This suggests that there is no need to build even more wells. This optimal well count ensures not only high profits but also adherence to production standards since it allows for the preservation of mineral water quality and prevents the destruction of aquifers.
Techniques that have been applied to develop specific design solutions have a certain value to science. Furthermore, they can be used in engineering practice for studying hydrolithospheric processes in other fields. For instance, this technique for determining the optimal number of wells can be used not only for models with the skin effect but also for other distributed models [65,66,67,68]. Similarly, the outcomes derived from computer modeling methods [29,69,70] can find practical applications in related domains [71,72], particularly in distributed systems with hydrodynamic processes.
5. Conclusions
In this study, we have explored methods for investigating hydrogeological entities and methods for researching distributed control systems using the results of test filtration works. The existing technological process for extracting mineral water from deposits has also been analyzed. Among the main tasks accomplished within the study are the following:
- Statistical processing of operating mode data for the deposit revealed the stationarity of hydrolithospheric processes, enabling the modeling of stationary random influences. These influences may lead to a decrease in the piezometric level below the permissible norm, disruption of the structure of the hydrogeological entity, and a loss of the mineral water source.
- Through the results of groundwater inflow testing, the prospects for developing and utilizing new deposits were determined. Additionally, possibilities for upgrading the existing mineral water deposits were identified through the selection of the optimal number of extraction wells.
In the future, we plan to develop a control system using the resulting model. The synthesis of controllers will make it possible to automatic control the process of mineral water extraction in real-time, further increasing environmental safety in the region.
Author Contributions
Conceptualization, M.-A.M.A. and I.M.P.; methodology, I.M.P.; software, V.V.T.; validation, M.-A.M.A., I.M.P. and V.V.T.; formal analysis, M.-A.M.A.; investigation, I.M.P.; resources, I.M.P.; data curation, V.V.T.; writing—original draft preparation, M.-A.M.A.; writing—review and editing, I.M.P.; visualization, M.-A.M.A.; supervision, I.M.P.; project administration, V.V.T.; funding acquisition, V.V.T. All authors have read and agreed to the published version of the manuscript.
Funding
This research received no external funding.
Data Availability Statement
The data presented in this study are available on request from the corresponding author.
Conflicts of Interest
The authors declare no conflicts of interest.
References
- Pershin, I.M.; Nosova, V.A.; Tsapleva, V.V. Mathematical modeling of hydrolithosphere processes taking into account the processes in “wells”. Mod. Sc. Innov. 2022, 3, 54–61. (In Russian) [Google Scholar]
- Malkov, A.V.; Pershin, I.M.; Pomelyaiko, I.S. Kislovodskoe Deposit of Carbonic Mineral Waters: System Analysis, Diagnostics, Forecast, Control; Nauka: Moscow, Russia, 2015; 283p. (In Russian) [Google Scholar]
- Golovina, E.; Khloponina, V.; Tsiglianu, P.; Zhu, R. Organizational, Economic and Regulatory Aspects of Groundwater Resources Extraction by Individuals (Case of the Russian Federation). Resources 2023, 12, 89. [Google Scholar] [CrossRef]
- Golovina, E.I.; Grebneva, A.V. Management of groundwater resources in transboundary territories (on the example of the Russian Federation and the Republic of Estonia). J. Min. Inst. 2021, 252, 788–800. [Google Scholar] [CrossRef]
- Pershin, I.M.; Papush, E.G.; Kukharova, T.V.; Utkin, V.A. Modeling of Distributed Control System for Network of Mineral Water Wells. Water 2023, 15, 2289. [Google Scholar] [CrossRef]
- Asadulagi, M.-A.M.; Fedorov, M.S.; Trushnikov, V.E. Control Methods of Mineral Water Wells. In Proceedings of the 2023 V International Conference on Control in Technical Systems (CTS), Saint Petersburg, Russia, 21–23 September 2023; pp. 152–155. [Google Scholar]
- Shapiro, S.L.; Kopkov, M.P.; Potseshkovskaya, I.V. Problems of the organization of surface and underground space (e.g., historical embankments of Saint Petersburg). E3S Web Conf. 2021, 266, 03016. [Google Scholar] [CrossRef]
- Potseshkovskaya, I.V.; Soroka, A.N. Revitalization of urban industrial areas based on sustainable development principles. E3S Web Conf. 2021, 266, 8012. [Google Scholar] [CrossRef]
- Polekhina, V.S.; Shestopalov, M.Y.; Ilyushin, Y.V. Identification of Magnetic Field Strength Realisation as a Necessary Solution for High-Quality Metal Synthesis. In Proceedings of the 2022 Conference of Russian Young Researchers in Electrical and Electronic Engineering, Saint Petersburg, Russia, 25–28 January 2022; pp. 831–833. [Google Scholar]
- Afanaseva, O.; Bezyukov, O.; Pervukhin, D.; Tukeev, D. Experimental Study Results Processing Method for the Marine Diesel Engines Vibration Activity Caused by the Cylinder-Piston Group Operations. Inventions 2023, 8, 71. [Google Scholar] [CrossRef]
- Marinina, O.; Nechitailo, A.; Stroykov, G.; Tsvetkova, A.; Reshneva, E.; Turovskaya, L. Technical and Economic Assessment of Energy Efficiency of Electrification of Hydrocarbon Production Facilities in Underdeveloped Areas. Sustainability 2023, 15, 9614. [Google Scholar] [CrossRef]
- Marinina, O.; Kirsanova, N.; Nevskaya, M. Circular Economy Models in Industry: Developing a Conceptual Framework. Energies 2022, 15, 9376. [Google Scholar] [CrossRef]
- Fetisov, V.; Gonopolsky, A.M.; Zemenkova, M.Y.; Andrey, S.; Davardoost, H.; Mohammadi, A.H.; Riazi, M. On the Integration of CO2 Capture Technologies for an Oil Refinery. Energies 2023, 16, 865. [Google Scholar] [CrossRef]
- Fetisov, V.; Tcvetkov, P.; Müller, J. Tariff approach to regulation of the European gas transportation system: Case of Nord Stream. Energy Rep. 2021, 7, 413–425. [Google Scholar] [CrossRef]
- Sidorenko, A.A.; Dmitriev, P.N.; Alekseev, V.Y.; Sidorenko, S.A. Improvement of techno-logical schemes of mining of coal seams prone to spontaneous combustion and rockbumps. J. Min. Inst. 2023, 264, 949–961. [Google Scholar]
- Malyshkov, G.B.; Nikolaichuk, L.A.; Sinkov, L.S. Legislative regulation of waste management system development in Russian federation. Int. J. Eng. Res. Technol. 2019, 12, 631–635. [Google Scholar]
- Sidorenko, A.A.; Sidorenko, S.A.; Ivanov, V.V. Numerical modelling of multiple-seam coal mining at the Taldinskaya-Zapadnaya-2 mine. ARPN J. Eng. Appl. Sci. 2021, 5, 568–574. [Google Scholar]
- Martirosyan, A.V.; Martirosyan, K.V.; Chernyshev, A.B. Investigation of Popov’s Lines’ Limiting Position to Ensure the Process Control Systems’ Absolute Stability. In Proceedings of the 2023 XXVI International Conference on Soft Computing and Measurements (SCM), Saint Petersburg, Russia, 24–26 May 2023; pp. 69–72. [Google Scholar]
- Zhang, B.; Ma, J.; Khan, M.A.; Repnikova, V.; Shidlovskaya, K.; Barykin, S.; Ahmad, M.S. The Effect of Economic Policy Uncertainty on Foreign Direct Investment in the Era of Global Value Chain: Evidence from the Asian Countries. Sustainability 2023, 15, 6131. [Google Scholar] [CrossRef]
- Kondrasheva, N.K.; Eremeeva, A.M. Production of biodiesel fuel from vegetable raw materials. J. Min. Inst. 2023, 260, 248–256. [Google Scholar] [CrossRef]
- Saleh, A.; Gad, A.; Ahmed, A.; Arman, H.; Farhat, H.I. Groundwater Hydrochemical Characteristics and Water Quality in Egypt’s Central Eastern Desert. Water 2023, 15, 971. [Google Scholar] [CrossRef]
- Pershin, I.M.; Kukharova, T.V.; Tsapleva, V.V. Designing of distributed systems of hydrolithosphere processes parameters control for the efficient extraction of hydromineral raw materials. J. Phys. Conf. Ser. 2021, 1728, 012017. [Google Scholar] [CrossRef]
- Katysheva, E.G. Application of BigData technology to improve the efficiency of Arctic shelf fields development. IOP Conf. Ser. Earth Environ. Sci. 2021, 937, 042080. [Google Scholar] [CrossRef]
- Katysheva, E.G. The Role of the Russian Arctic Gas Industry in the Northern Sea Route Development. IOP Conf. Ser. Earth Environ. Sci. 2020, 539, 012075. [Google Scholar] [CrossRef]
- Ilyushin, Y.V. Development of a Process Control System for the Production of High-Paraffin Oil. Energies 2022, 15, 6462. [Google Scholar] [CrossRef]
- Van Thang, N.; Thang Vinh, P.; Rogachev, M.; Korobov, G.; Zhurkevich, A.; Islamov, S. A comprehensive method for determining the dewaxing interval period in gas lift wells. J. Petrol. Explor. Prod. Technol. 2023, 13, 1163–1179. [Google Scholar]
- Legkokonets, V.A.; Islamov, S.R.; Mardashov, D.V. Multifactor analysis of well killing operations on oil and gas condensate field with a fractured reservoir. In Proceedings of the International Forum-Contest of Young Researchers: Topical Issues of Rational Use of Mineral Resources, London, UK, 18–20 April 2018; pp. 111–118. [Google Scholar]
- Korshunov, G.I.; Eremeeva, A.M.; Drebenstedt, C. Justification of the use of a vegetal additive to diesel fuel as a method of protecting underground personnel of coal mines from the impact of harmful emissions of diesel-hydraulic locomotives. J. Min. Inst. 2021, 247, 39–47. [Google Scholar] [CrossRef]
- Martirosyan, K.V.; Chenyshev, A.B.; Martirosyan, A.V. Application of Bayes Networks in the Design of the Information System “Mineral Water Deposit”. In Proceedings of the 2023 XXVI International Conference on Soft Computing and Measurements (SCM), Saint Petersburg, Russia, 24–26 May 2023; pp. 236–239. [Google Scholar]
- Afanaseva, O.; Neyrus, S.; Navatskaya, V.; Perezhogina, A. Risk Assessment of Investment Projects Using the Simulation Decomposition Method. In Fundamental and Applied Scientific Research in the Development of Agriculture in the Far East (AFE-2022); Springer: Cham, Switzerland, 2023; Volume 706, pp. 776–785. [Google Scholar]
- Rudneva, I.I.; Gaisky, P.V.; Shaida, V.G.; Shaida, O.V. Assessing Climate and Human Activity Effects on Hypersaline Lake Ecosystem: Case Study of Saki Lake, Crimea. Water 2023, 15, 456. [Google Scholar] [CrossRef]
- Nikolaichuk, L.; Ignatiev, K.; Filatova, I.; Shabalova, A. Diversification of the portfolio of international oil and gas assets using cluster analysis. Int. J. Eng. Trans. A 2023, 36, 1783–1792. [Google Scholar] [CrossRef]
- Eremeeva, A.M.; Ilyushin, Y.V. Automation of the control system for drying grain crops of the technological process for obtaining biodiesel fuels. Sci. Rep. 2023, 13, 14956. [Google Scholar] [CrossRef] [PubMed]
- Fetisov, V.; Ilyushin, Y.V.; Vasiliev, G.G. Development of the automated temperature control system of the main gas pipeline. Sci. Rep. 2023, 13, 3092. [Google Scholar] [CrossRef] [PubMed]
- Ilyushin, Y.; Afanaseva, O. Spatial Distributed Control System of Temperature Field: Synthesis and Modeling. ARPN J. Eng. Ap. Sci. 2021, 16, 1491–1506. [Google Scholar]
- Afanaseva, O.; Ilyushin, Y. Analysis and processing of the hydrolitospheric plast information remote sensing through the theory of systems with distributed. SGEM 2018, 18, 35–40. [Google Scholar] [CrossRef]
- Ilyushina, A.N.; Pershin, I.M.; Trushnikov, V.E.; Novozhilov, I.M.; Pervukhin, D.A.; Tukeyev, D.L. Design of Induction Equipment Complex using the Theory of Distributed Parameter Systems. In Proceedings of the 2023 V International Conference on Control in Technical Systems (CTS), Saint Petersburg, Russia, 21–23 September 2023; pp. 79–82. [Google Scholar] [CrossRef]
- Ilyushina, A.N.; Pershin, I.M.; Trushnikov, V.E.; Novozhilov, I.M.; Pervukhin, D.A.; Tukeyev, D.L. Design of a Software Complex for Control of Induction Equipment of Metallurgical Manufacture using Systems Theory. In Proceedings of the 2023 V International Conference on Control in Technical Systems (CTS), Saint Petersburg, Russia, 21–23 September 2023; pp. 83–87. [Google Scholar] [CrossRef]
- Plotnikov, A.V.; Trushnikov, V.E.; Pervukhin, D.A.; Shestopalov, M.Y. Mathematical Simulation of the Formation Pressure Monitoring System in the Water-Drive Gas Reservoir. In Proceeding of the 2023 XXVI International Conference on Soft Computing and Measurements (SCM), Saint Petersburg, Russia, 24–26 May 2023; pp. 77–81. [Google Scholar] [CrossRef]
- Kozyrev, B.A.; Sizyakov, V.M. Heap leaching of red mud by the formate method. Obogashchenie Rud 2021, 4, 40–45. [Google Scholar]
- Kozyrev, B.A.; Sizyakov, V.M.; Arsentyev, V.A. Principles of rational processing of red mud with the use of carboxylic acids. Non-Ferrous Met. 2022, 53, 30–34. [Google Scholar] [CrossRef]
- Rogachev, M.K.; Aleksandrov, A.N. Justification of a comprehensive technology for preventing the formation of asphalt-resin-paraffin deposits during the production of highlyparaffinic oil by electric submersible pumps from multiformation deposits. J. Min. Inst. 2021, 250, 596–605. [Google Scholar] [CrossRef]
- Aleksandrov, A.N.; Kishchenko, M.A.; Van, T.N. Simulating the formation of wax deposits in wells using electric submersible pumps. In Advances in Raw Material Industries for Sustainable Development Goals; Aleksandrov, A.N., Ed.; CRC Press: London, UK, 2021; pp. 283–295. [Google Scholar] [CrossRef]
- Fetisov, V.; Shalygin, A.V.; Modestova, S.A.; Tyan, V.K.; Shao, C. Development of a Numerical Method for Calculating a Gas Supply System during a Period of Change in Thermal Loads. Energies 2023, 16, 60. [Google Scholar] [CrossRef]
- Schipachev, A.; Fetisov, V.; Nazyrov, A.; Donghee, L.; Khamrakulov, A. Study of the Pipeline in Emergency Operation and Assessing the Magnitude of the Gas Leak. Energies 2022, 15, 5294. [Google Scholar] [CrossRef]
- Nikolaev, A.; Romanov, A.; Zaripova, N.A.; Fetisov, V.G. Modeling of flow in field pipeline to confirm effectiveness of insertion of splitting couplings in control of rill-washing corrosion. IOP Conf. Ser. Earth Environ. Sci. 2018, 194, 082030. [Google Scholar] [CrossRef]
- Nikolaev, A.; Samigullin, G.H.; Samigullina, L.G.; Fetisov, V.G. Non-stationary operation of gas pipeline based on selections of travel. IOP Conf. Ser. Mater. Sci. Eng. 2018, 327, 022074. [Google Scholar] [CrossRef]
- Zhukovsky, Y.L.; Semenyuk, A.V.; Alieva, L.Z.; Arapova, E.G. Blockchain-based digital platforms to reduce the carbon footprint of the mining industry. MIAB 2022, 6, 361–378. [Google Scholar] [CrossRef]
- Afanasyev, M.; Pervukhin, D.; Kotov, D.; Davardoost, H.; Smolenchuk, A. System Modeling in Solving Mineral Complex Logistic Problems with the Anylogic Software Environment. Trans. Res. Procedia 2022, 68, 483–491. [Google Scholar]
- Cheremisina, O.V.; Ponomareva, M.A.; Molotilova, A.Y.; Mashukova, Y.A.; Soloviev, M.A. Sorption purification of acid storage facility water from iron and titanium on organic polymeric materials. J. Min. Inst. 2023, 264, 971–980. [Google Scholar] [CrossRef]
- Ilyushin, Y.V.; Asadulagi, M.-A.M. Development of a Distributed Control System for the Hydrodynamic Processes of Aquifers, Taking into Account Stochastic Disturbing Factors. Water 2023, 15, 770. [Google Scholar] [CrossRef]
- Ilyushin, Y.; Golovina, E. Stability of temperature field of the distributed control system. ARPN J. Eng. Appl. Sci. 2020, 15, 664–668. [Google Scholar]
- Plotnikov, A.V.; Pervukhin, D.A.; Trushnikov, V.E.; Shestopalov, M.Y. Mathematical Modeling of the Automatic Control System of Formation Pressure in a Gas Reservoir. In Proceedings of the 2023 V International Conference on Control in Technical Systems (CTS), Saint Petersburg, Russia, 21–23 September 2023; pp. 126–129. [Google Scholar] [CrossRef]
- Maksarov, V.V.; Maksimov, D.D.; Sinyukov, M.S. Quality control of complex contour surfaces in aluminium alloy items during magnetic abrasive finishing. Tsvetnye Metall. 2023, 4, 96–102. [Google Scholar] [CrossRef]
- Novozhilov, I.M.; Sidorenko, A.A.; Tukeyev, D.L. Design of Software and Hardware Complex of Temperature Field Diagnostics using the Theory of Distributed Parameter Systems. In Proceedings of the 2023 V International Conference on Control in Technical Systems (CTS), Saint Petersburg, Russia, 21–23 September 2023; pp. 88–91. [Google Scholar] [CrossRef]
- Kukharova, T.V.; Ilyukhina, Y.A.; Shestopalov, M.Y. Development of a Methodology for Controlling the Process of Heating Metal Blanks in a Methodical Furnace. In Proceedings of the 2022 Conference of Russian Young Researchers in Electrical and Electronic Engineering (ElConRus), Saint Petersburg, Russia, 25–28 January 2022; pp. 718–721. [Google Scholar] [CrossRef]
- Afanaseva, O.; Ilyushin, Y. Analysis and synthesis of distributed icedrill heating control system of mountain reconnaissance drilling rig. SGEM 2018, 18, 41–48. [Google Scholar] [CrossRef]
- Eremeeva, A.M.; Kondrasheva, N.K.; Khasanov, A.F.; Oleynik, I.L. Environmentally Friendly Diesel Fuel Obtained from Vegetable Raw Materials and Hydrocarbon Crude. Energies 2023, 16, 2121. [Google Scholar] [CrossRef]
- Olt, J.J.; Maksarov, V.V.; Petrishin, G.V.; Panteleyenko, E.F.; Liskovich, M.I. Magnetic Abrasive Machining of Hard Workpieces by New Diffusion-Alloyed Materials. Russ. Eng. Res. 2023, 43, 314–318. [Google Scholar] [CrossRef]
- Martirosyan, A.A.; Martirosyan, K.V. Quality improvement information technology for mineral water field’s control. In Proceedings of the IEEE Conference on Quality Management, Transport and Information Security, Information Technologies (IT&MQ&IS), Nalchik, Russia, 4–11 October 2016; pp. 147–151. [Google Scholar] [CrossRef]
- Kukharova, T.V.; Utkin, V.A.; Boev, I.V. Observation and Prediction Systems Modeling for Human Mental State. In Proceedings of the International Multi-Conference on Industrial Engineering and Modern Technologies, Vladivostok, Russia, 3–4 October 2018; p. 8602831. [Google Scholar] [CrossRef]
- Bakovsky, V.B.; Golovkin, S.I.; Kukharova, T.V.; Utkin, V.A.; Chalaya, E.N.; Shabaldin, N.A. Acute period of polytrauma in children in the light of discriminant analysis. Russ. J. Pediatr. Surg. 2020, 10, 145–156. [Google Scholar] [CrossRef]
- Brigadnov, I.A.; Maksarov, V.V.; Olt, J.J. Optimal Acceleration or Braking of Massive Flywheels at the Strength Limit. Mech. Solids 2023, 58, 404–414. [Google Scholar] [CrossRef]
- Sidorenko, A.A. Computer modeling of rock massif stress condition for mining planning on overworked seam. J. Phys. Conf. Ser. 2020, 1661, 012082. [Google Scholar] [CrossRef]
- Pershin, I.M.; Papush, E.G.; Malkov, A.V.; Kukharova, T.V.; Spivak, A.O. Operational Control of Underground Water Exploitation Regimes. In Proceedings of the 2019 3rd International Conference on Control in Technical Systems, Saint-Petersburg, Russia, 30 October–1 November 2019; pp. 77–80. [Google Scholar] [CrossRef]
- Satsuk, T.P.; Sharyakov, V.A.; Sharyakova, O.L. Erratum to: Automatic Voltage Stabilization of an Electric Rolling Stock Catenary System. Russ. Electr. Eng. 2021, 92, 349. [Google Scholar] [CrossRef]
- Ilyushin, Y.V.; Afanasieva, O.V. Synthesis of a distributed control system. Int. J. Control Theory Appl. 2016, 9, 41–60. [Google Scholar]
- Kazanin, O.I.; Sidorenko, A.A.; Meshkov, A.A.; Sidorenko, S.A. Reproduction of the longwall panels: Modern requirements for the technology and organization of the development operations at coal mines. Eur. Min. 2020, 2, 19–23. [Google Scholar] [CrossRef]
- Kazanin, O.I.; Sidorenko, A.A.; Sidorenko, S.A.; Ivanov, V.V.; Mischo, H. High productive longwall mining of multiple gassy seams: Best practice and recommendations. Acta Montan. Slovaca 2022, 27, 152–162. [Google Scholar] [CrossRef]
- Maksarov, V.V.; Efimov, A.E.; Olt, Y. Improving the quality of hole processing in welded products made of dissimilar materials with a new boring tool. Int. J. Adv. Manuf. Technol. 2022, 3, 1027–1042. [Google Scholar] [CrossRef]
- Islamov, S.R.; Bondarenko, A.V.; Gabibov, A.F.; Mardashov, D.V. Polymer compositions for well killing operation in fractured reservoirs. In Advances in Raw Material Industries for Sustainable Development Goals; Taylor & Francis: London, UK, 2021; pp. 343–351. [Google Scholar] [CrossRef]
- Islamov, S.R.; Bondarenko, A.V.; Mardashov, D.V. A selection of emulsifiers for preparation of invert emulsion drilling fluids. In Topical Issues of Rational Use of Natural Resources; Taylor & Francis: London, UK, 2020; pp. 487–494. [Google Scholar] [CrossRef]
Disclaimer/Publisher’s Note: The statements, opinions and data contained in all publications are solely those of the individual author(s) and contributor(s) and not of MDPI and/or the editor(s). MDPI and/or the editor(s) disclaim responsibility for any injury to people or property resulting from any ideas, methods, instructions or products referred to in the content. |
© 2024 by the authors. Licensee MDPI, Basel, Switzerland. This article is an open access article distributed under the terms and conditions of the Creative Commons Attribution (CC BY) license (https://creativecommons.org/licenses/by/4.0/).