
A Tool for Identifying Suitable Places for the Placement of Blue-Green Infrastructure Elements, a Case Study on the Cities of the Moravian-Silesian Region, Czech Republic


Abstract
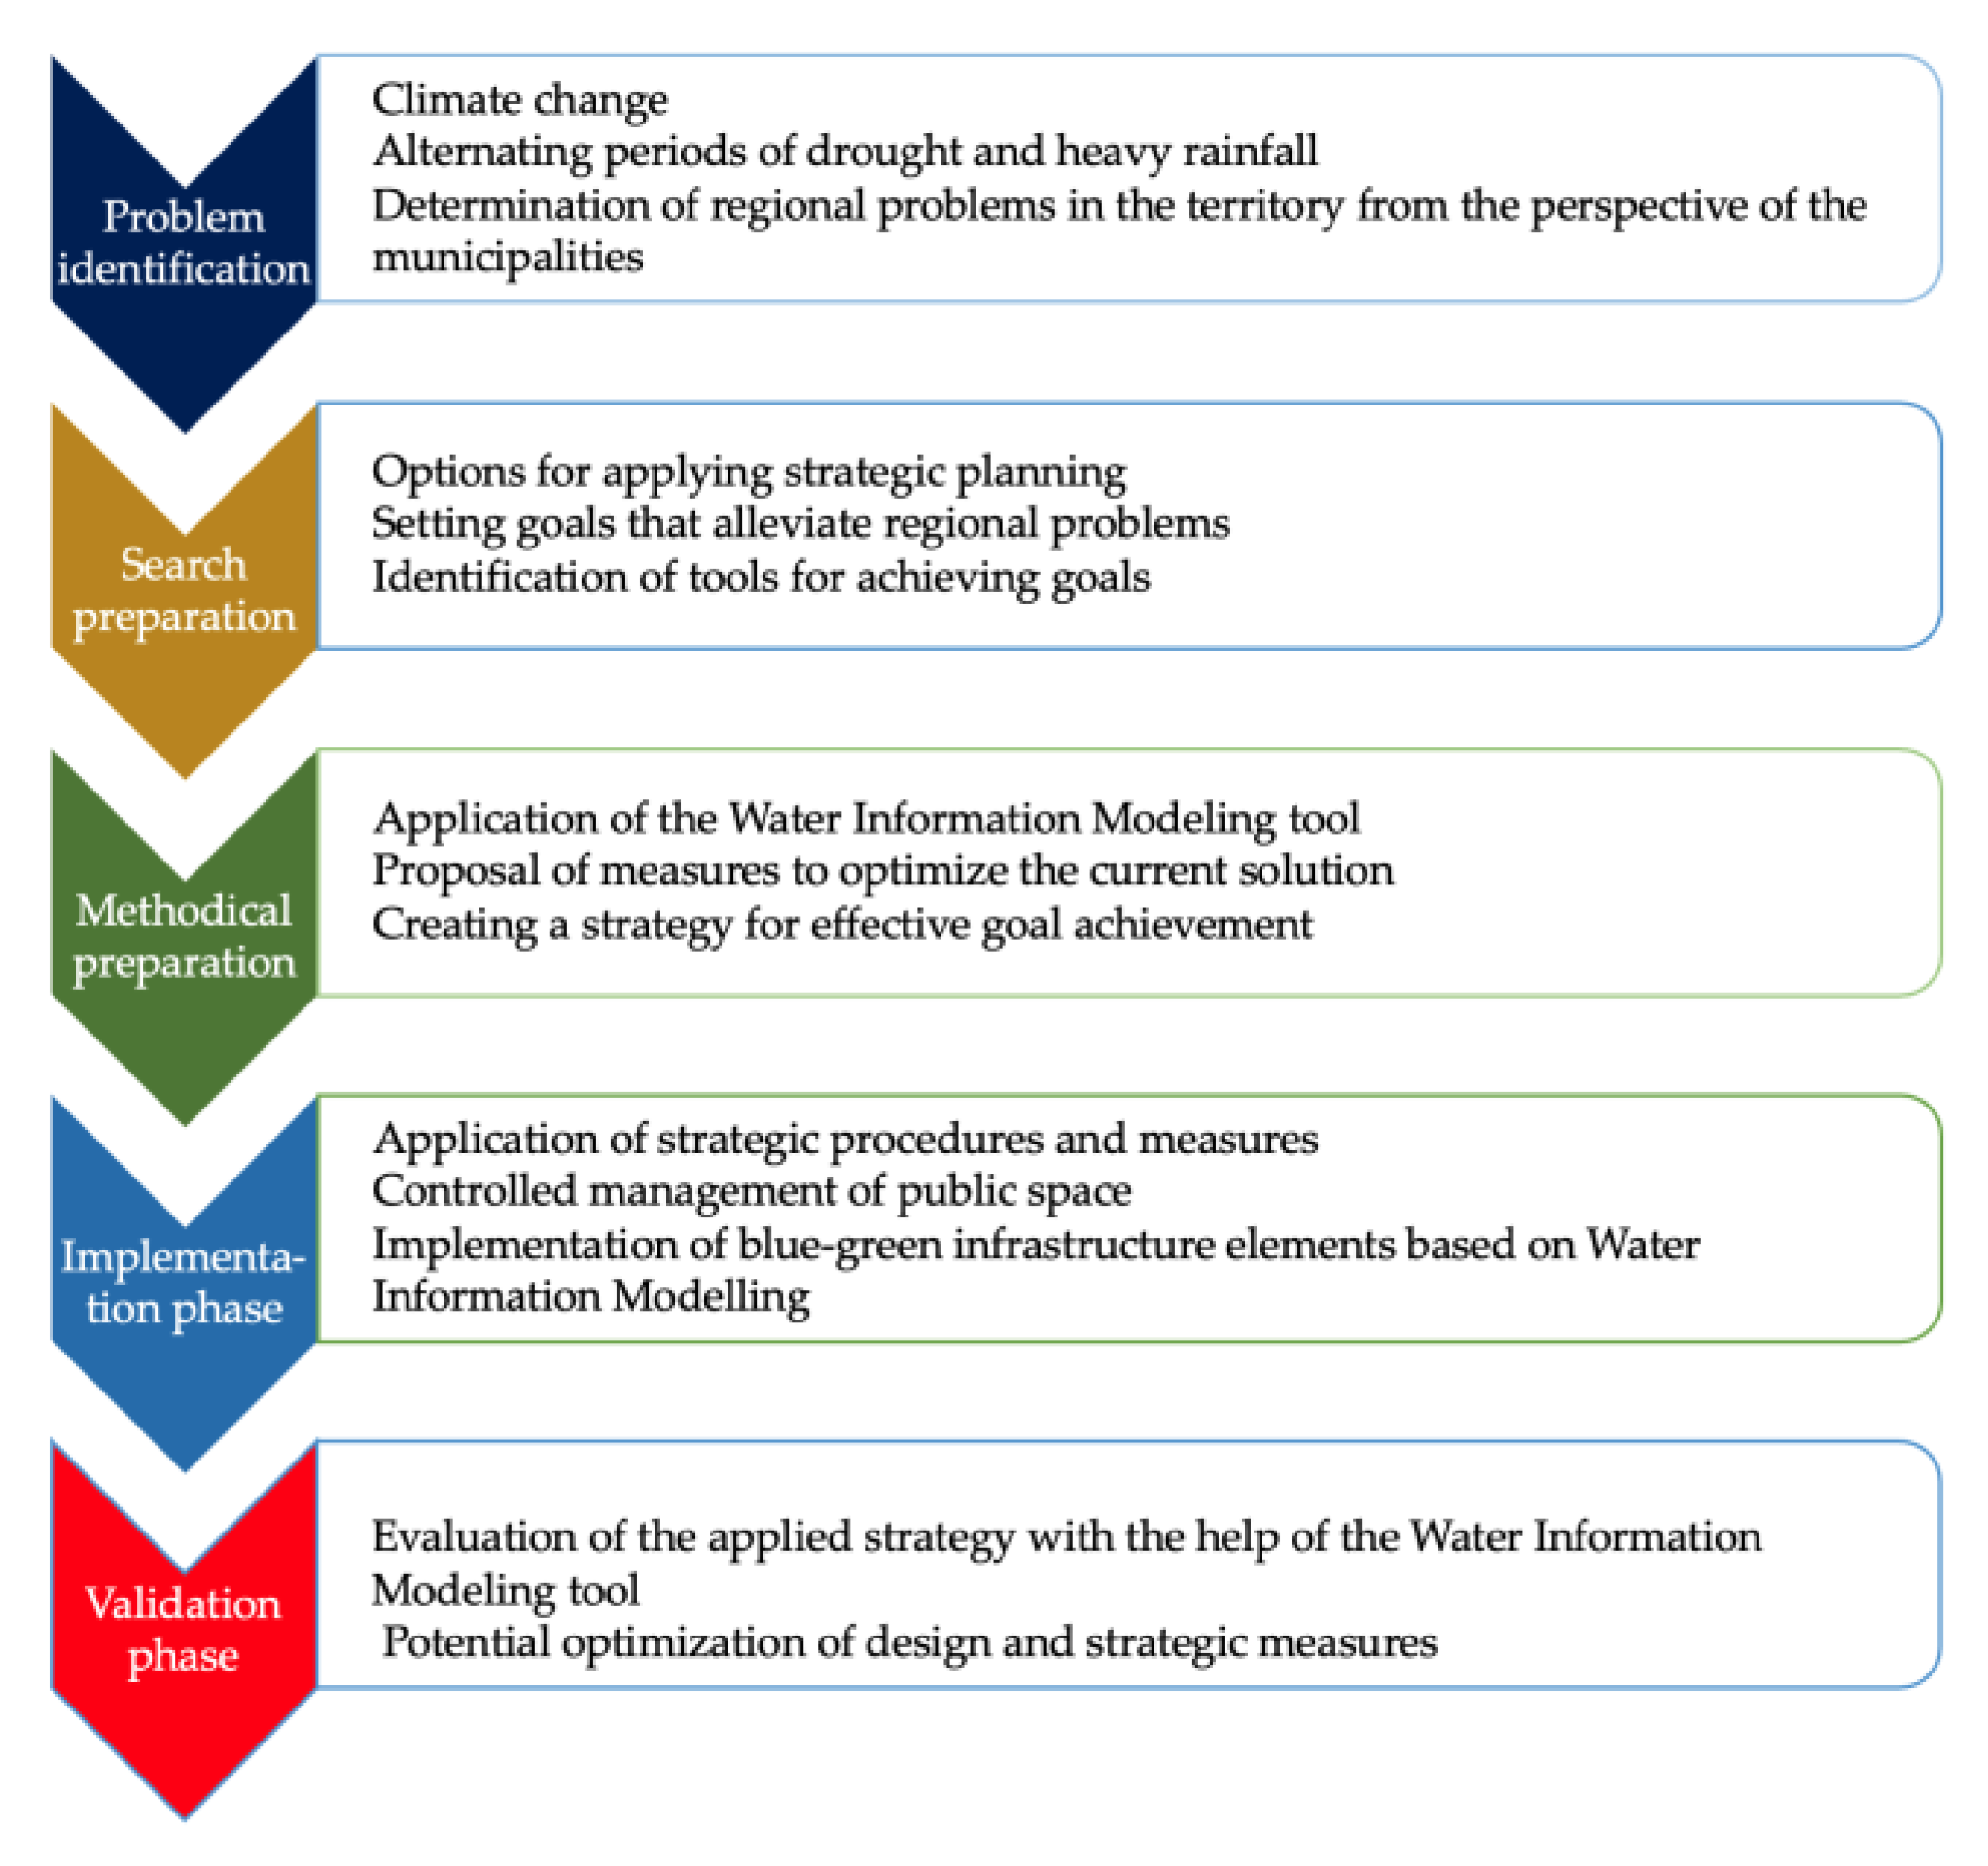
1. Introduction
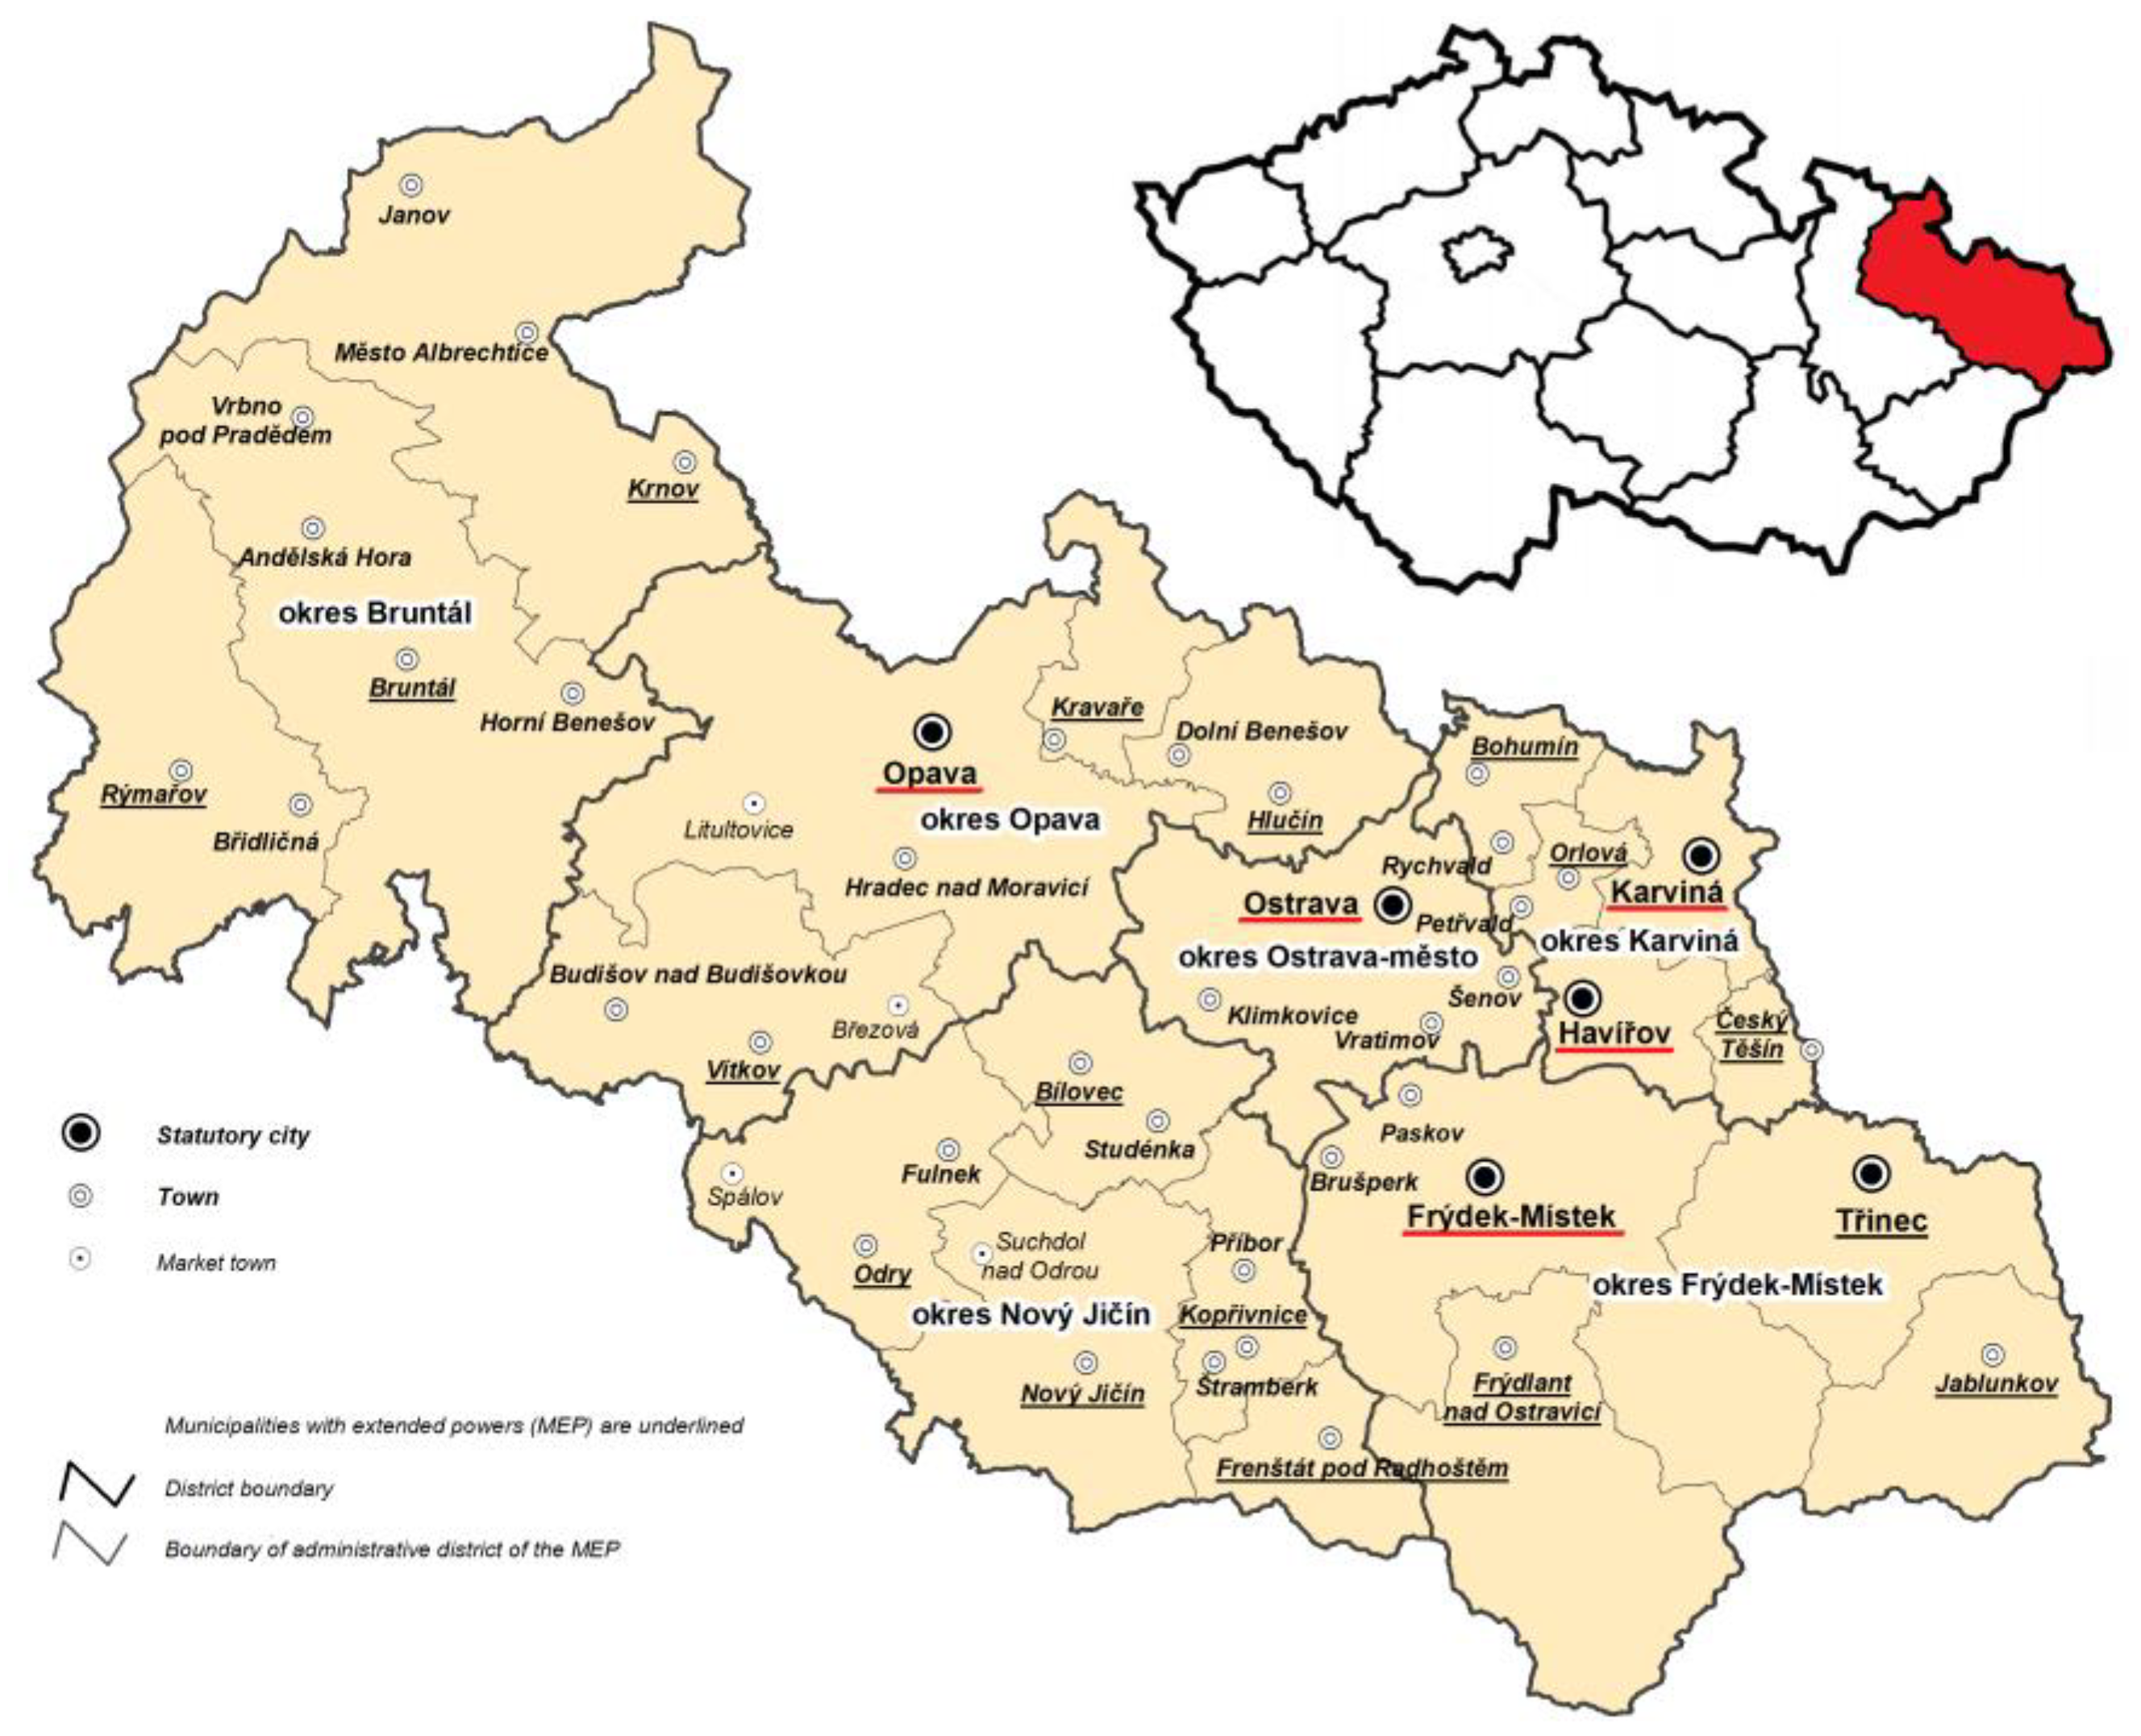
2. Study Area
3. Materials and Methods
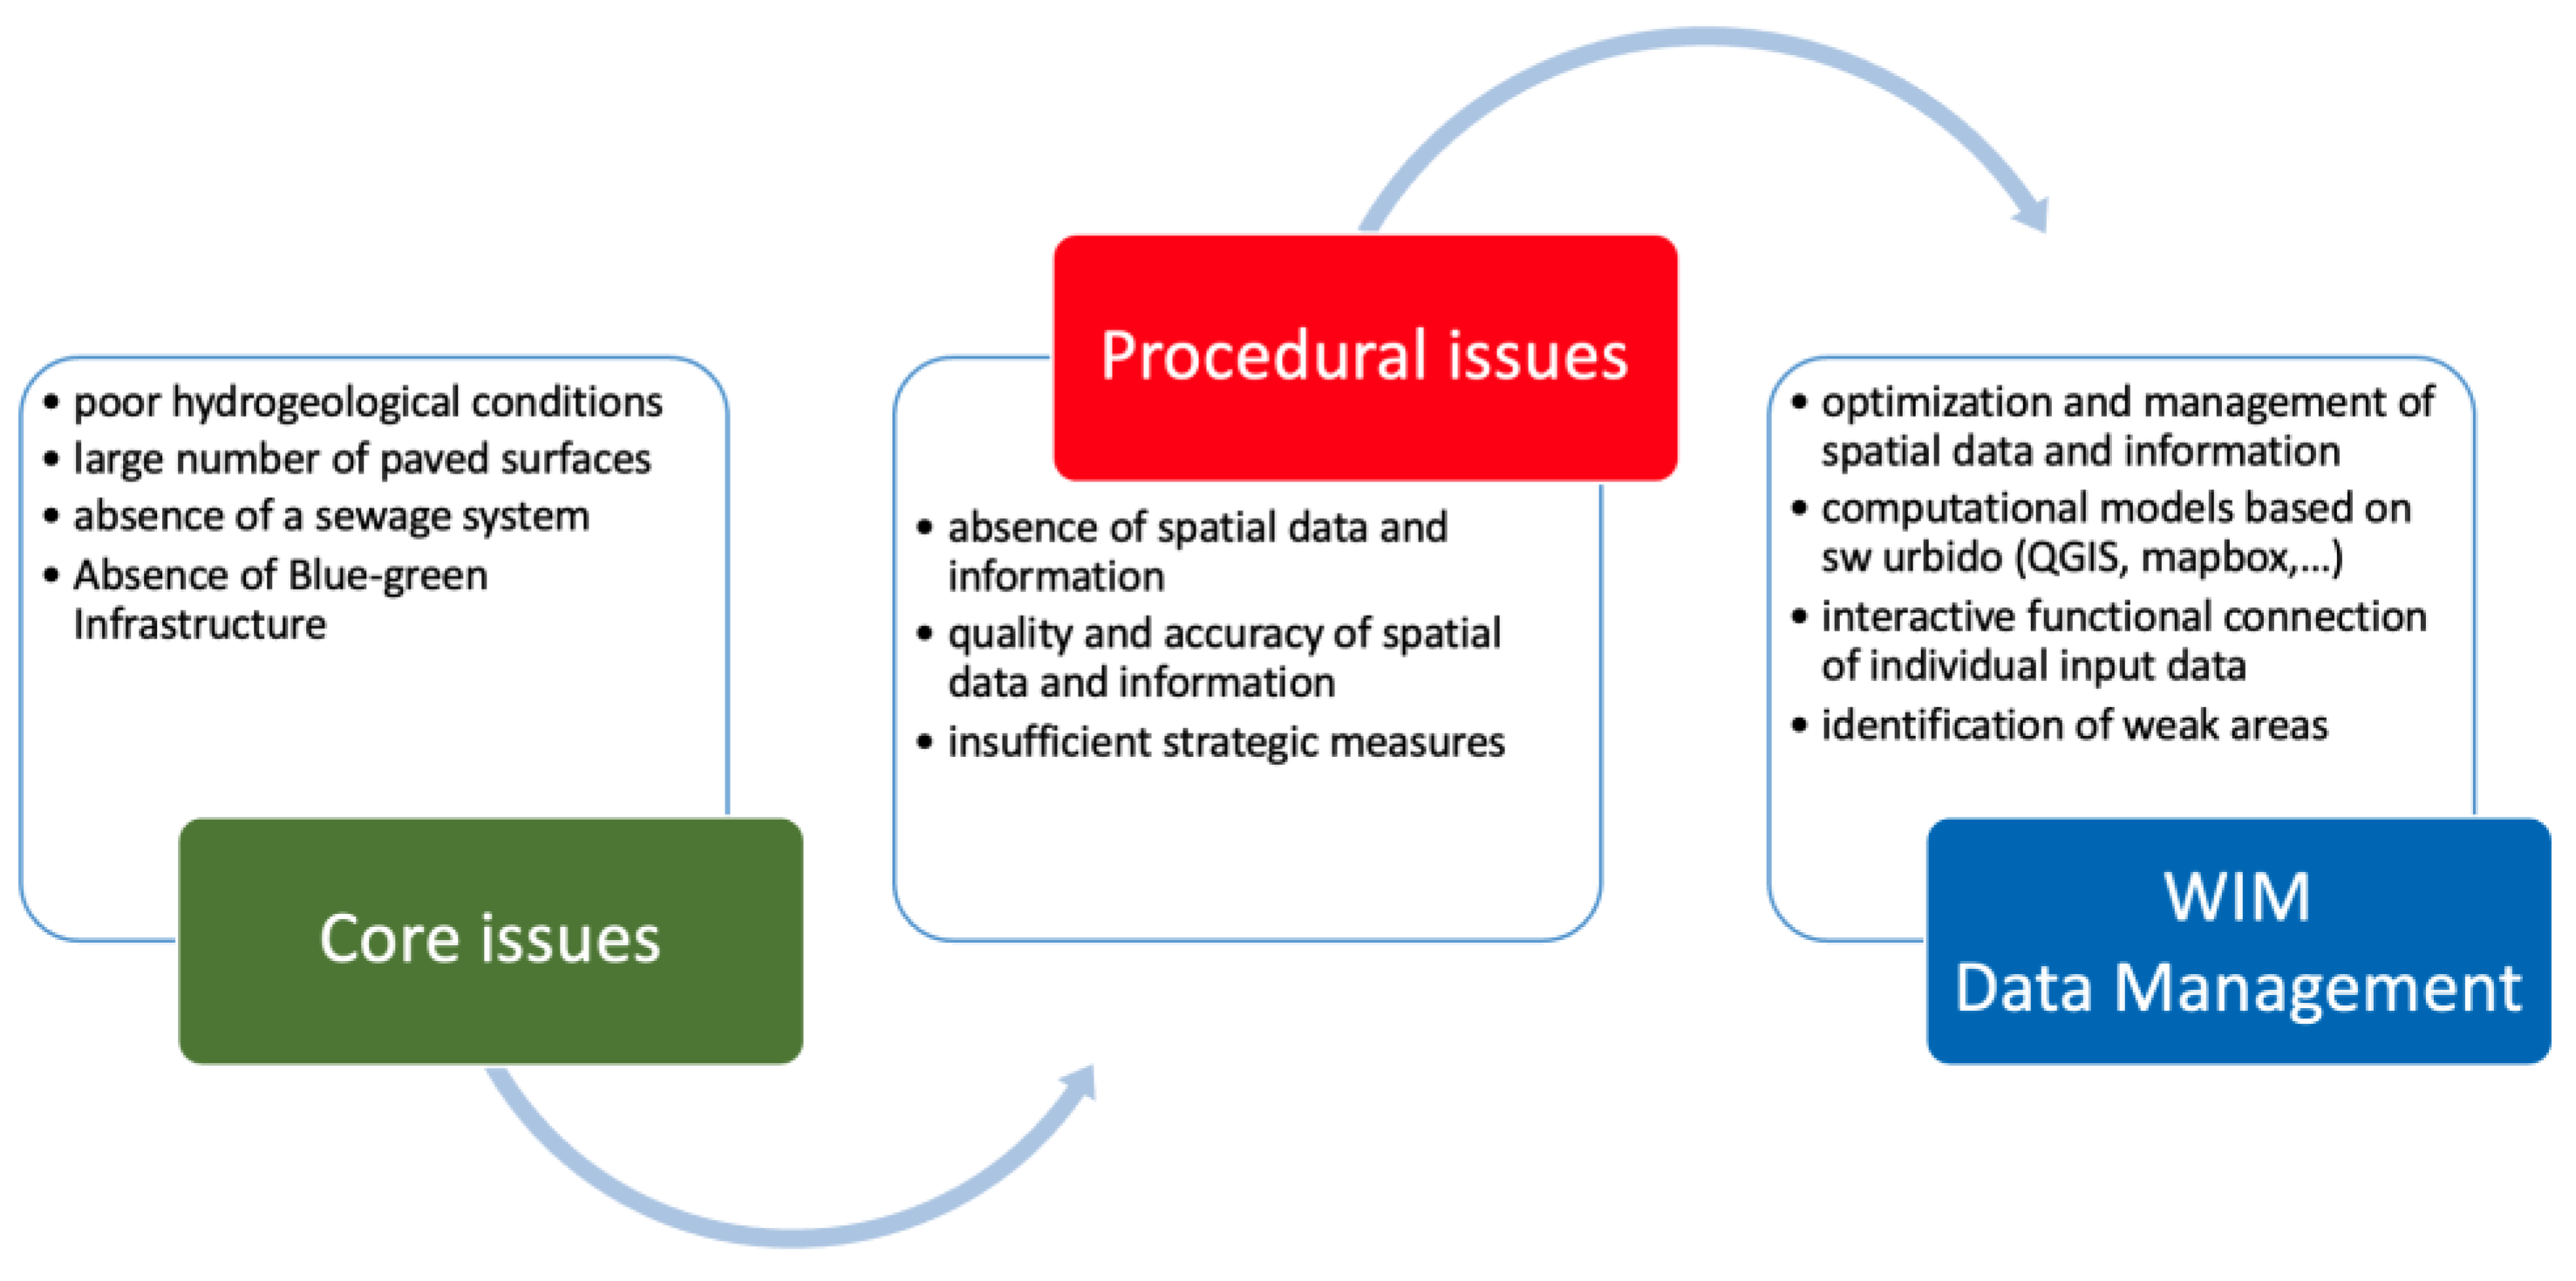
3.1. Research Questions
- Can the provided and detected data be used for implementation into the proposed application?
- Will it be possible to run the map application on a regular desktop computer?
- Is the application really set up correctly?
- Will the usability of the application be ensured by municipalities in practice?
- Were any disadvantages of the model identified?
3.2. Data Collection
3.2.1. Precipitation
3.2.2. Data Collection Background
- Basic map (default background)—Czech Office for Surveying, Mapping and Cadaster;
- Satellite map—Czech Office for Surveying, Mapping and Cadaster;
- Cadastral map—Czech Office for Surveying, Mapping and Cadaster;
- Flood map—5-year water level—Ministry of the Environment;
- Flood map—20-year water level—Ministry of the Environment;
- Flood map—100-year water level—Ministry of the Environment;
- Passport of communications—municipality;
- Passport of parking areas—municipality;
- Passport of paved surfaces—municipality;
- Passport of unpaved surfaces—municipality;
- Passport of greenery—municipality;
- Sewer network passport (only points of street drains, heights of street drain covers, or replacement of missing data for contour lines)—municipality; network administrator;
- ψ values—the rainwater runoff coefficient for the given drained area—technical standard.
3.3. Methods and Tools
3.4. Calculation Methods for Drainage of Rainwater from the Territory
3.5. Tools Used for Computer Representation of Locations
4. Rainwater Information Management
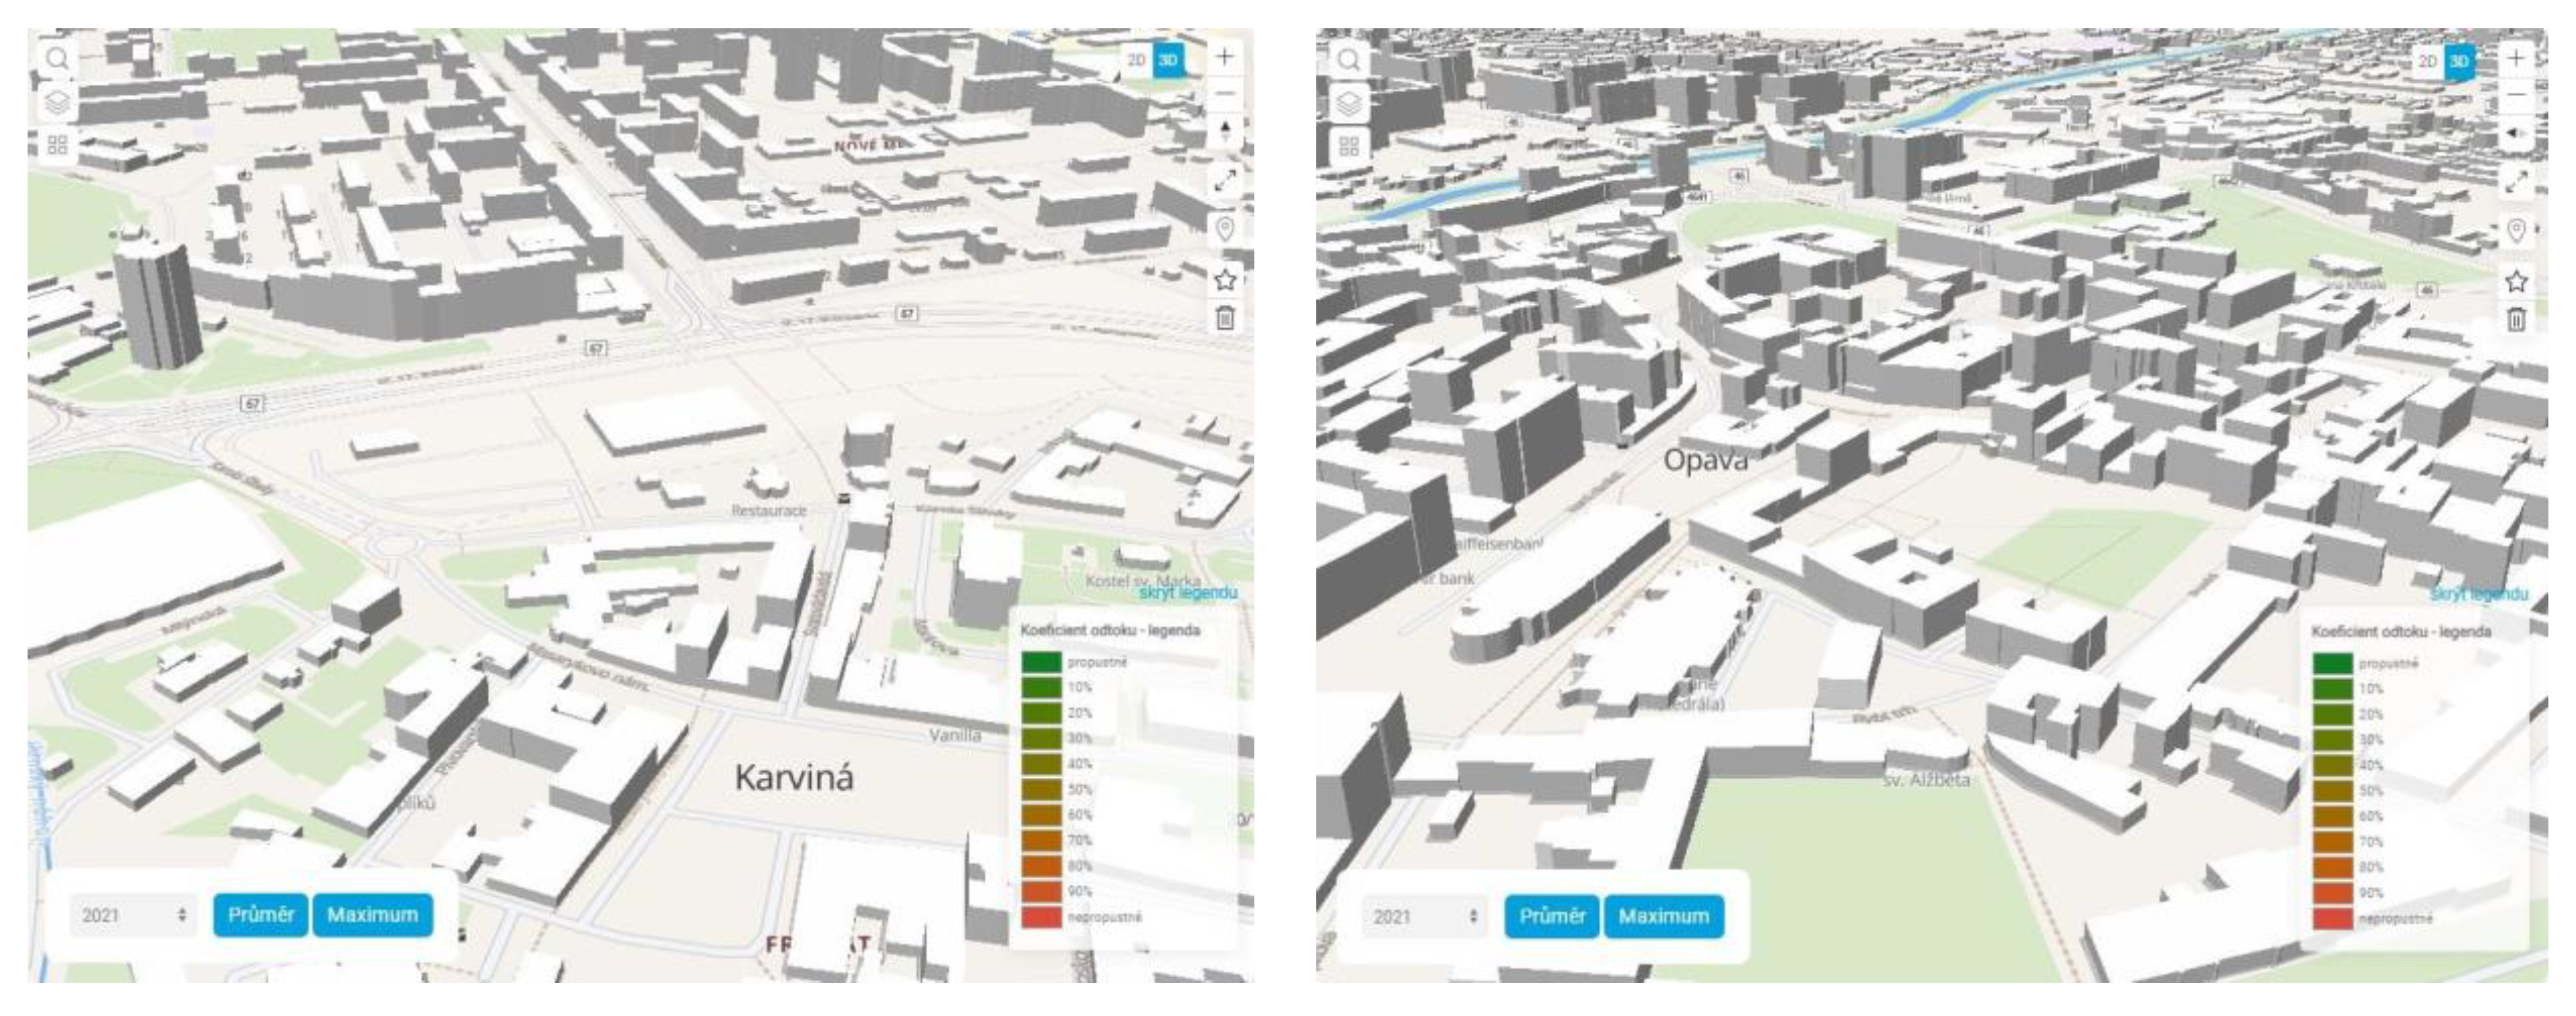
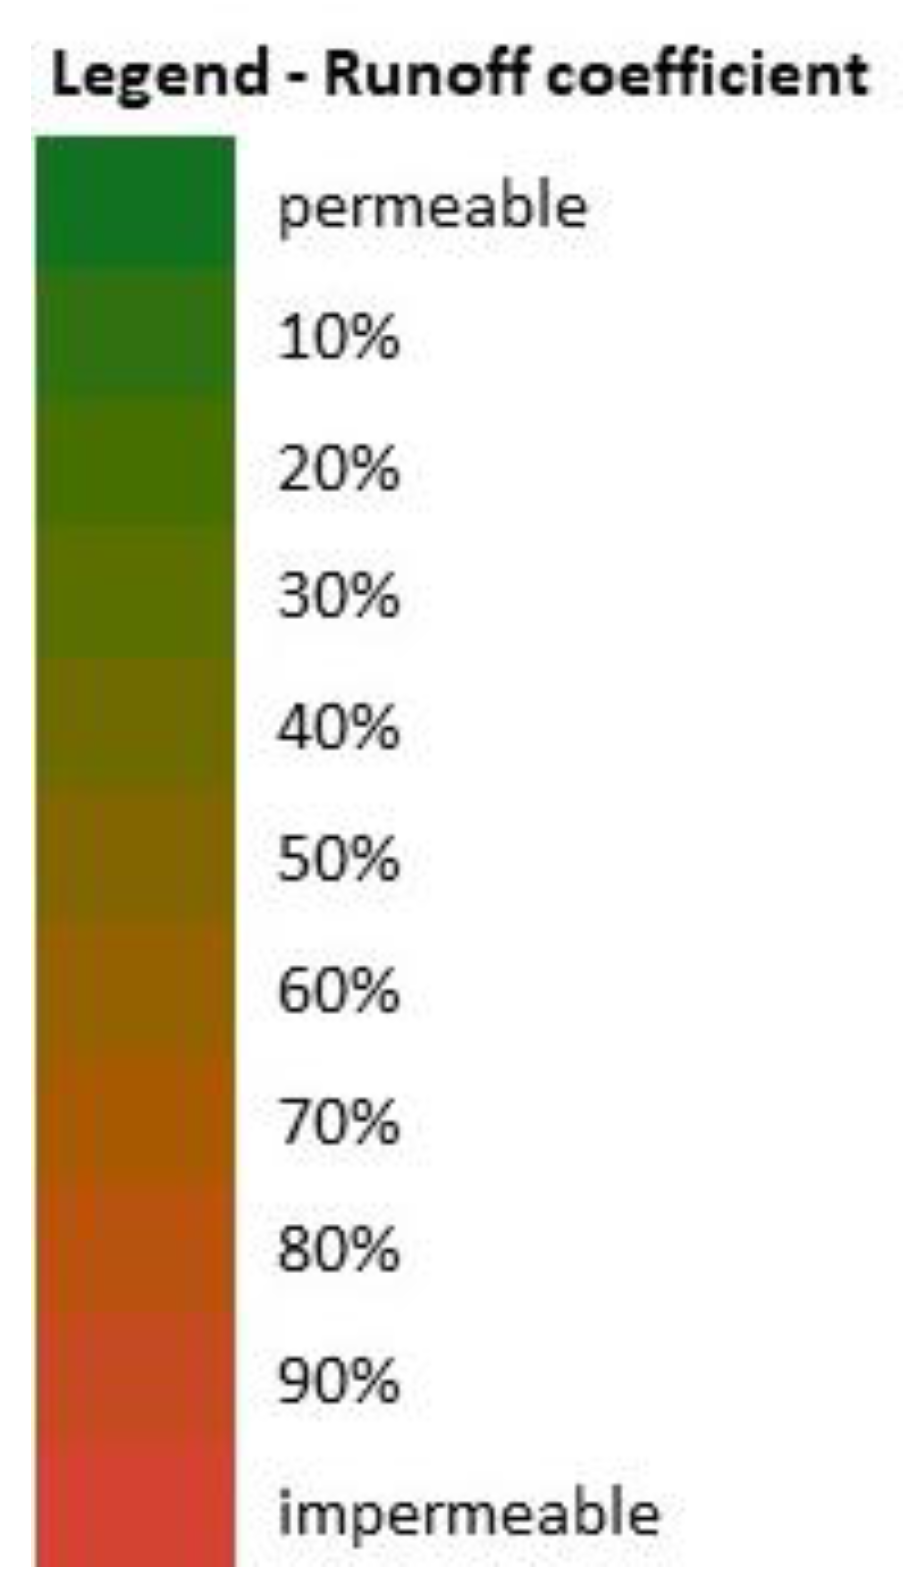
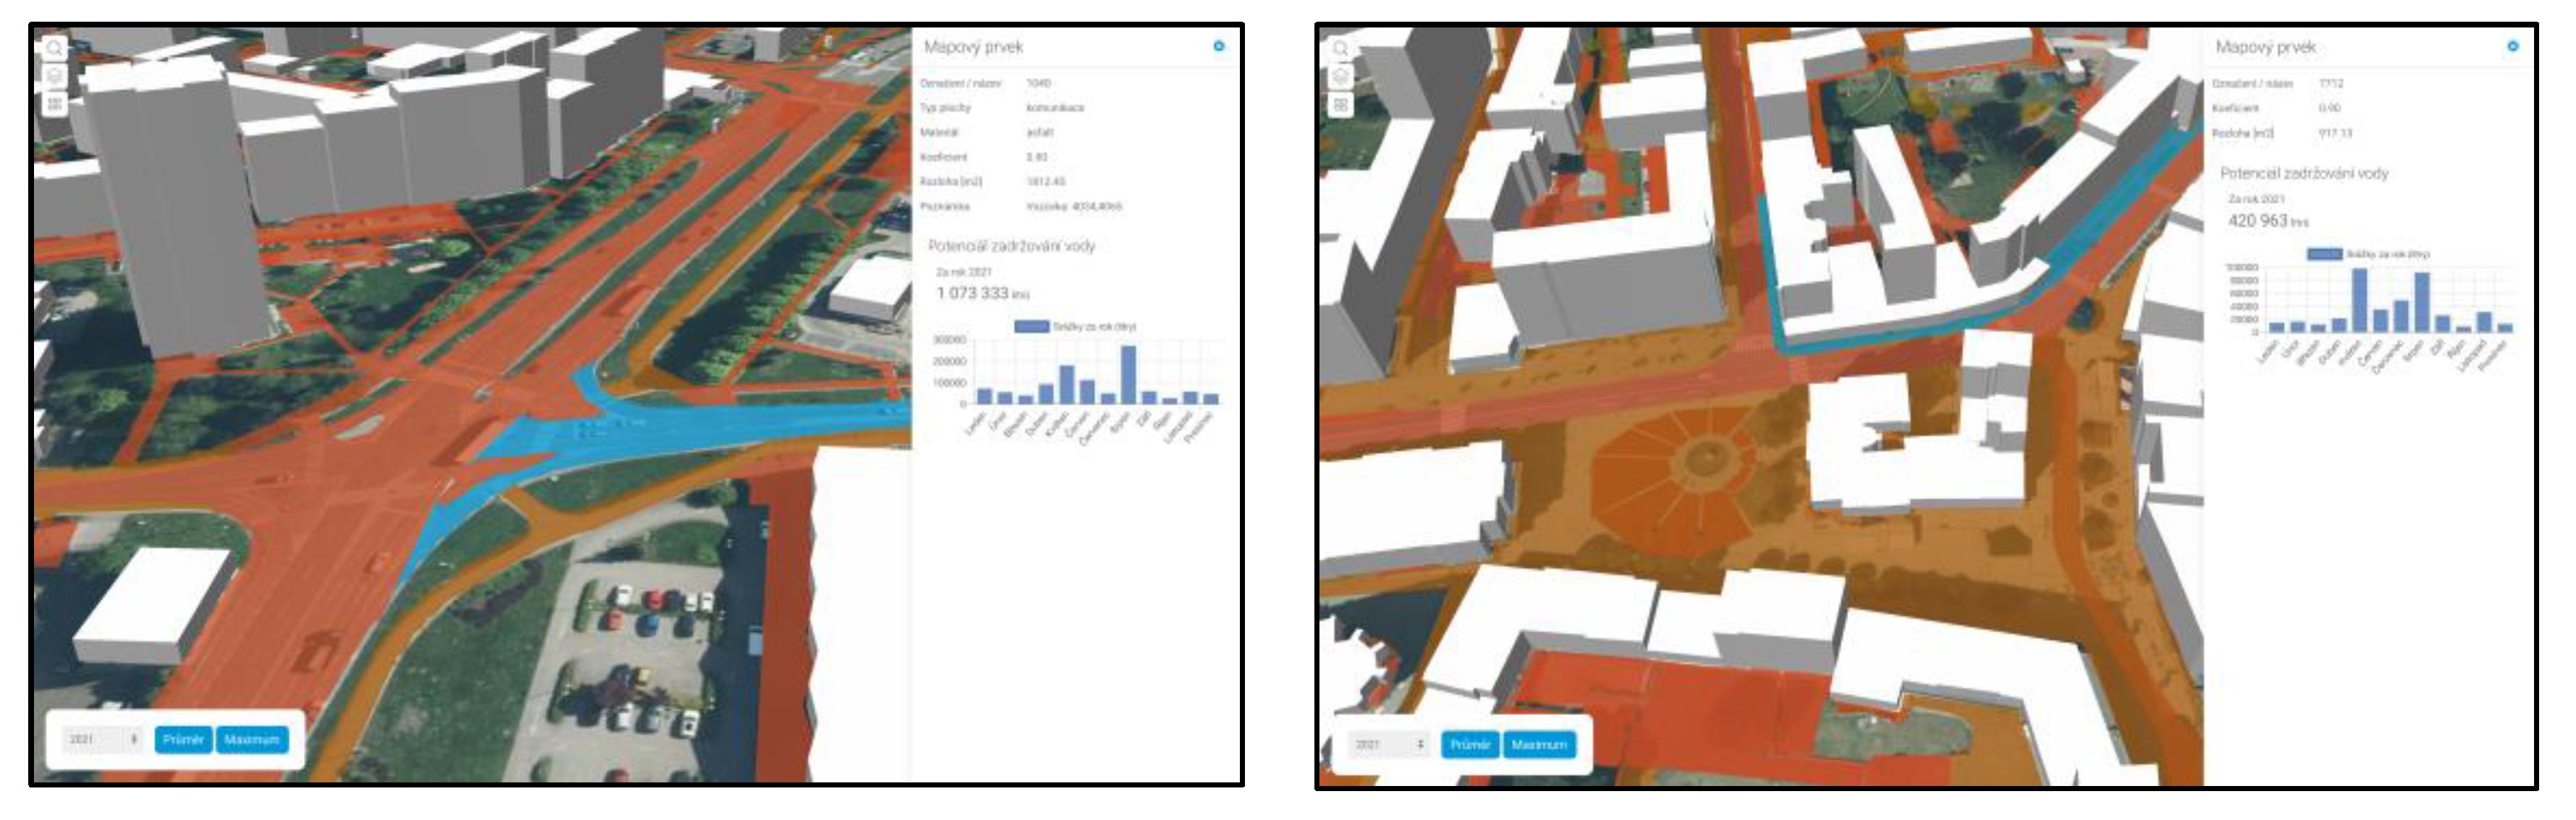
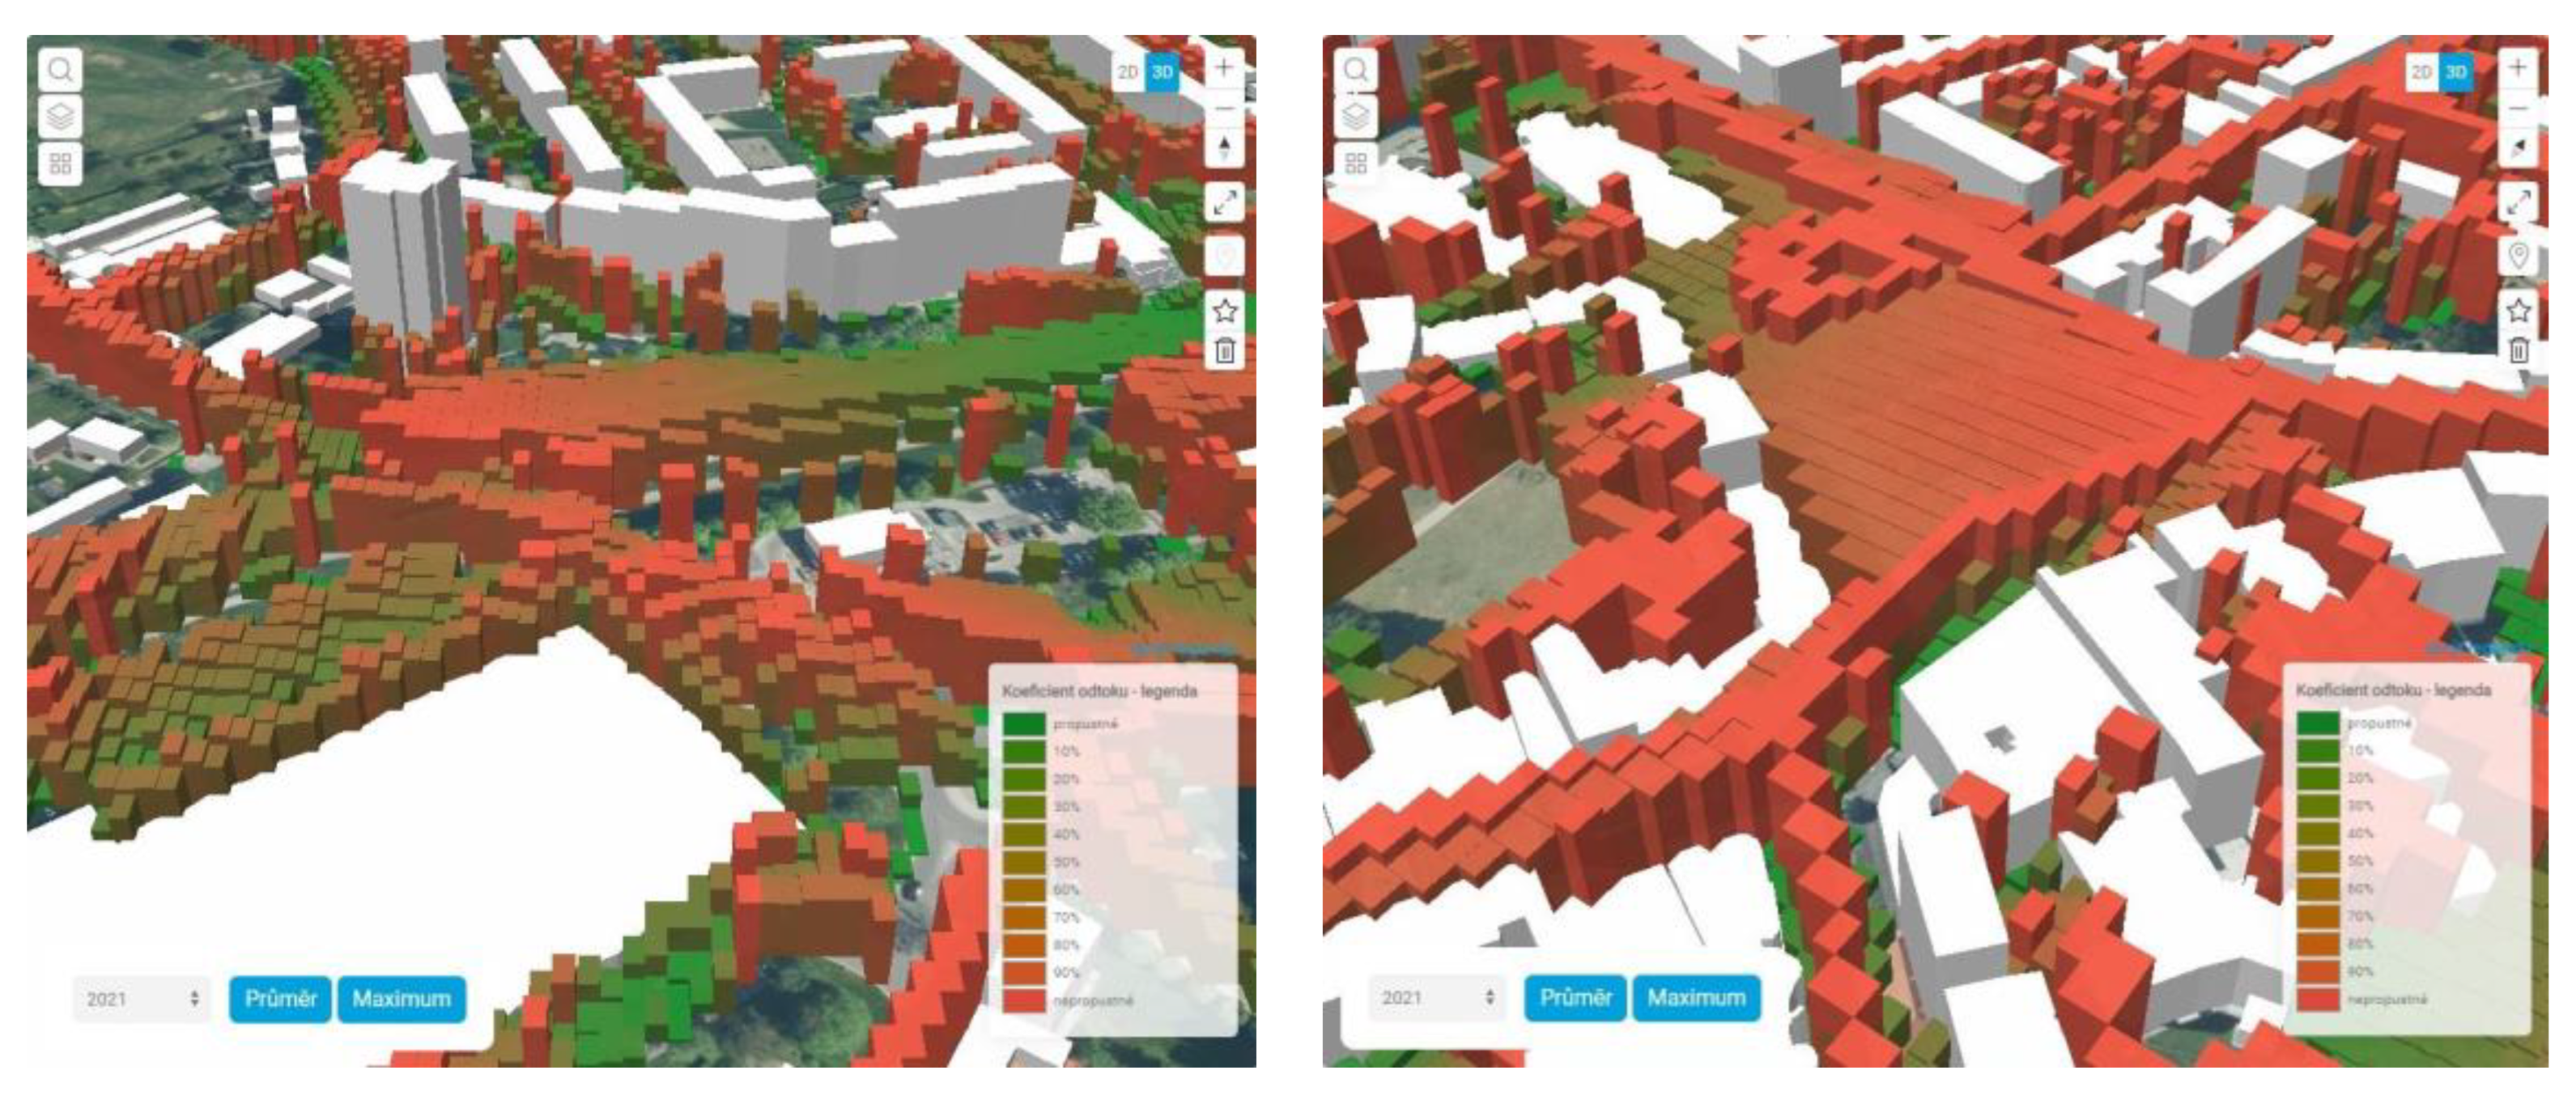
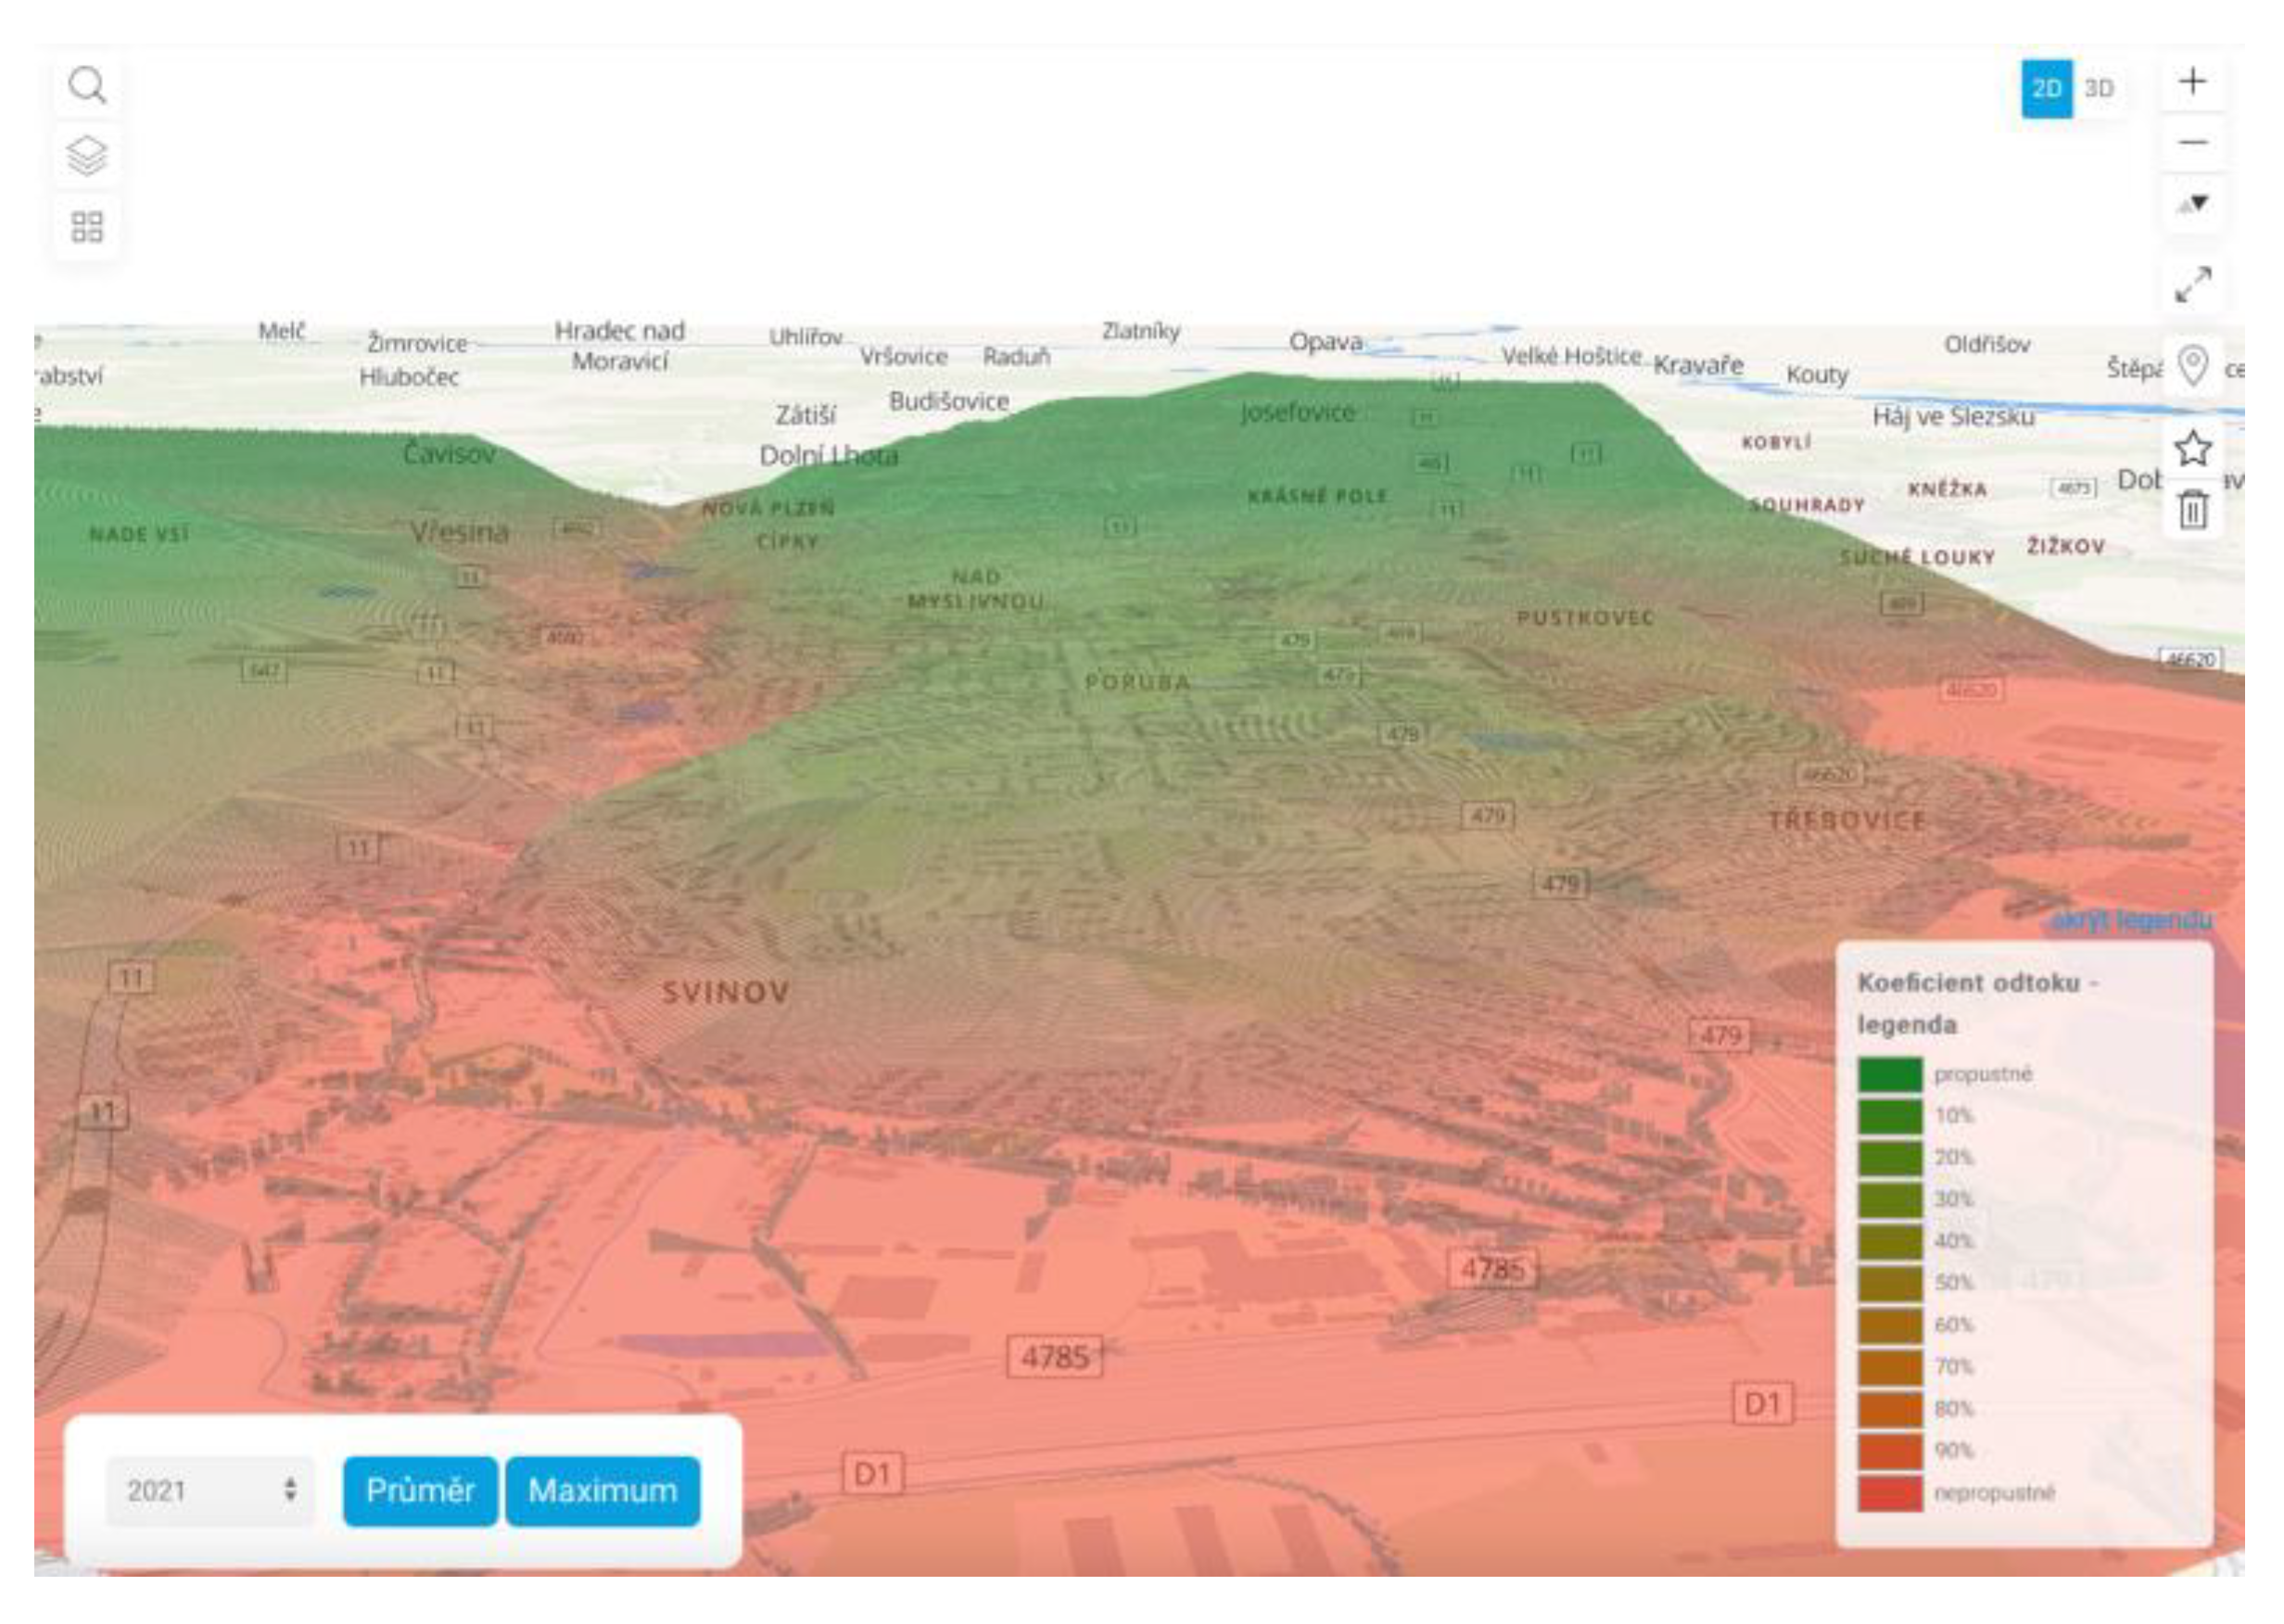
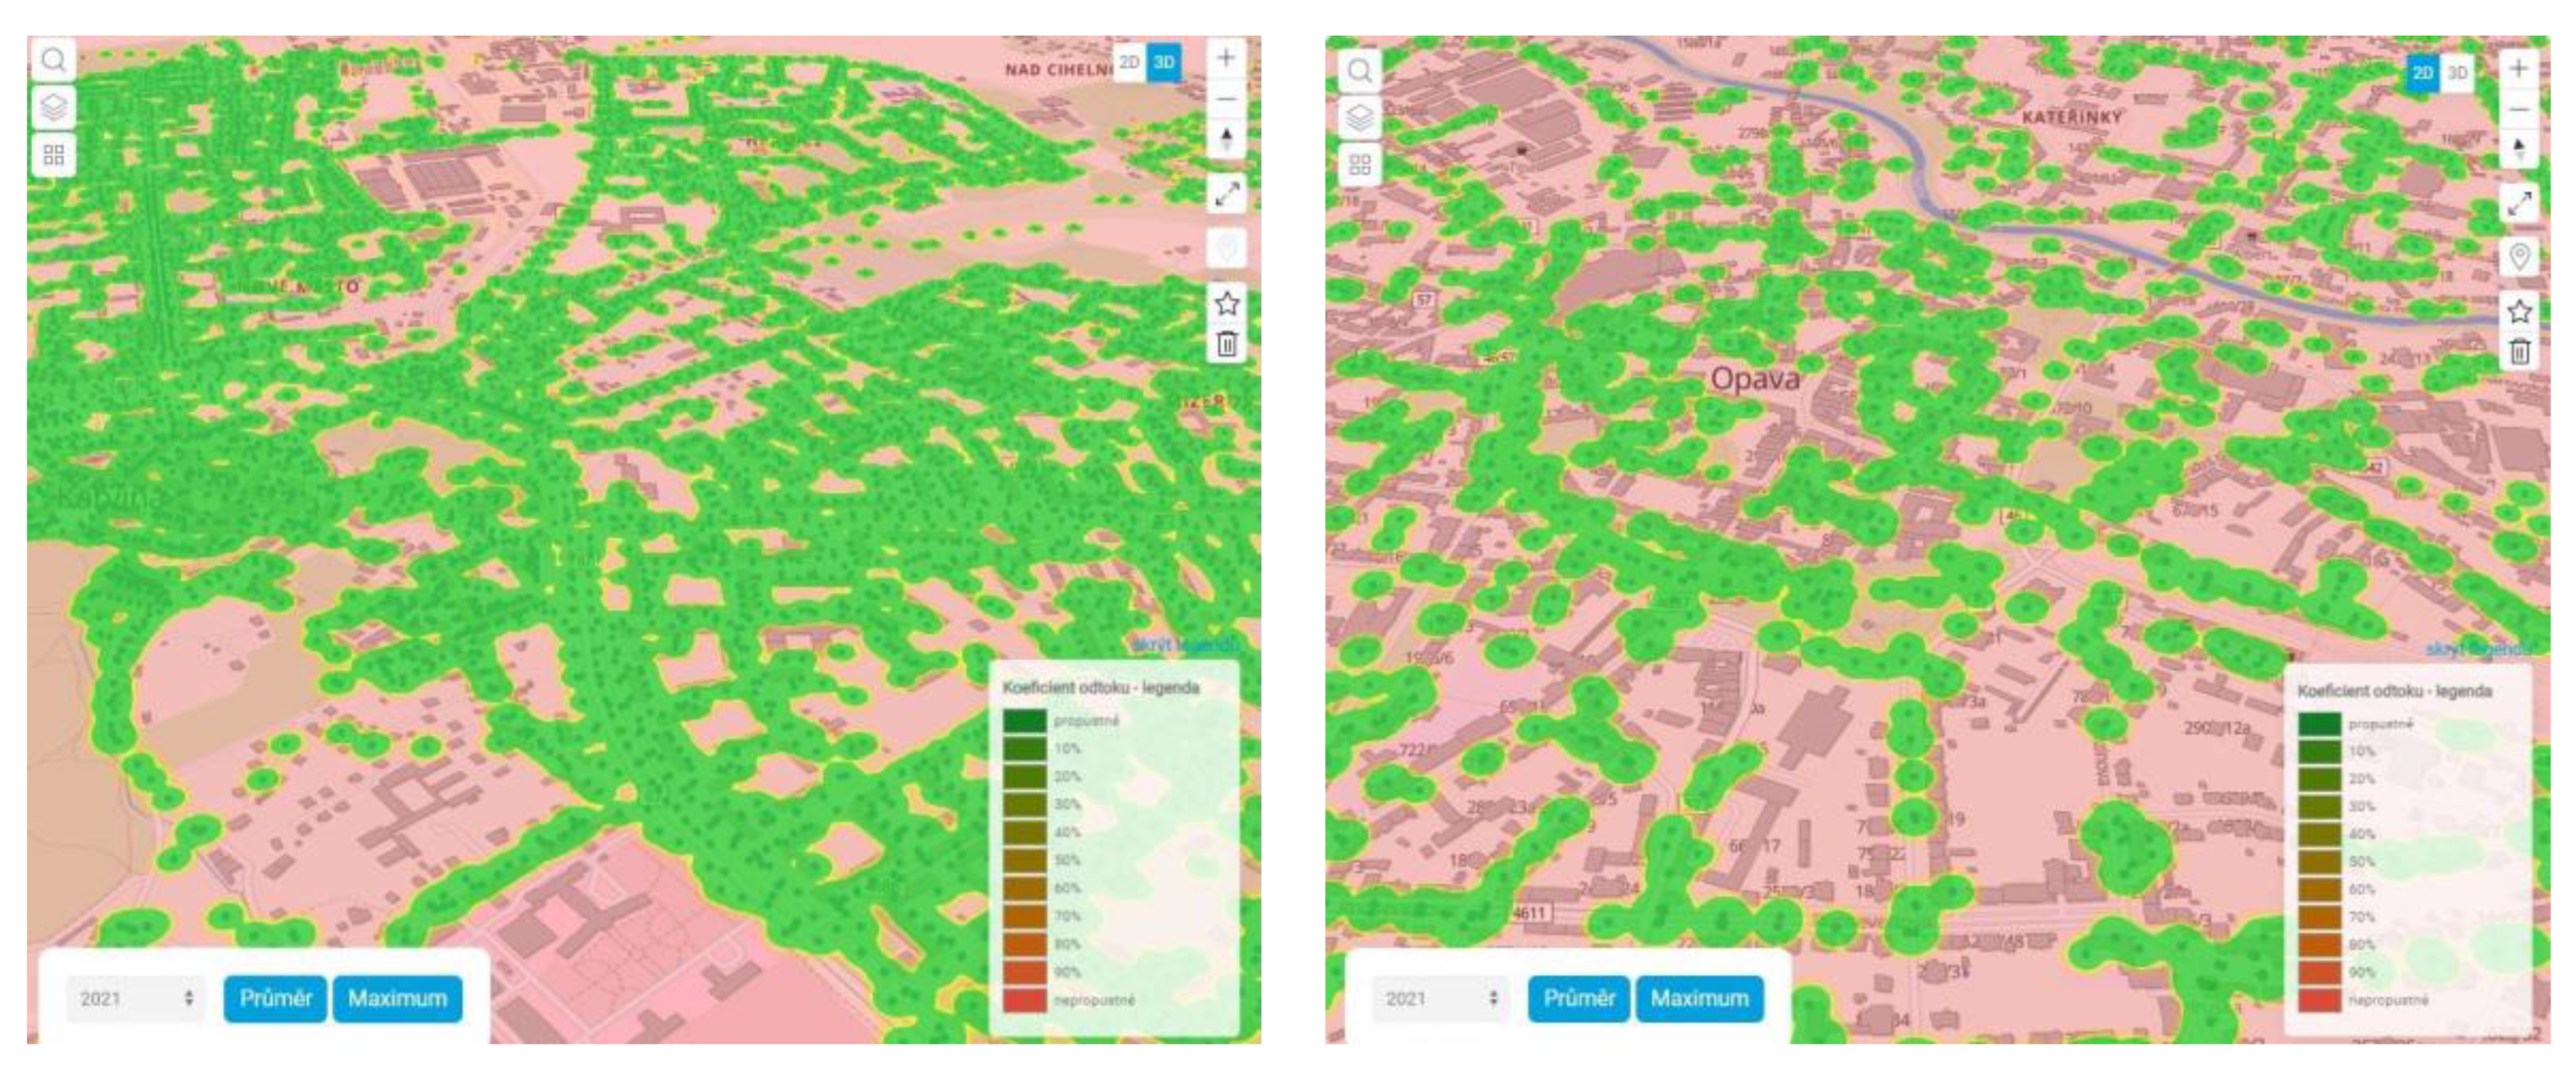
- Runoff coefficient—a map showing the basic range of public areas classified according to the water permeability of the given surface, or according to the runoff coefficient of the given area. Individual sub-areas are interactive, and it is thus possible to view individual attributes of a given map element (area, area type, surface material, total surface runoff, etc.).
- Drains—a map extracting data about the city sewer system, with inflow objects being graphically represented here—street drains, or objects used to divert surface runoff rainwater into the sewer network.
- Heat map—an interpolation map showing the density of sewer inlets. Based on a simple graphic representation, the map shows the accumulation of street drains (point objects) on the municipal sewer network in a given municipality.
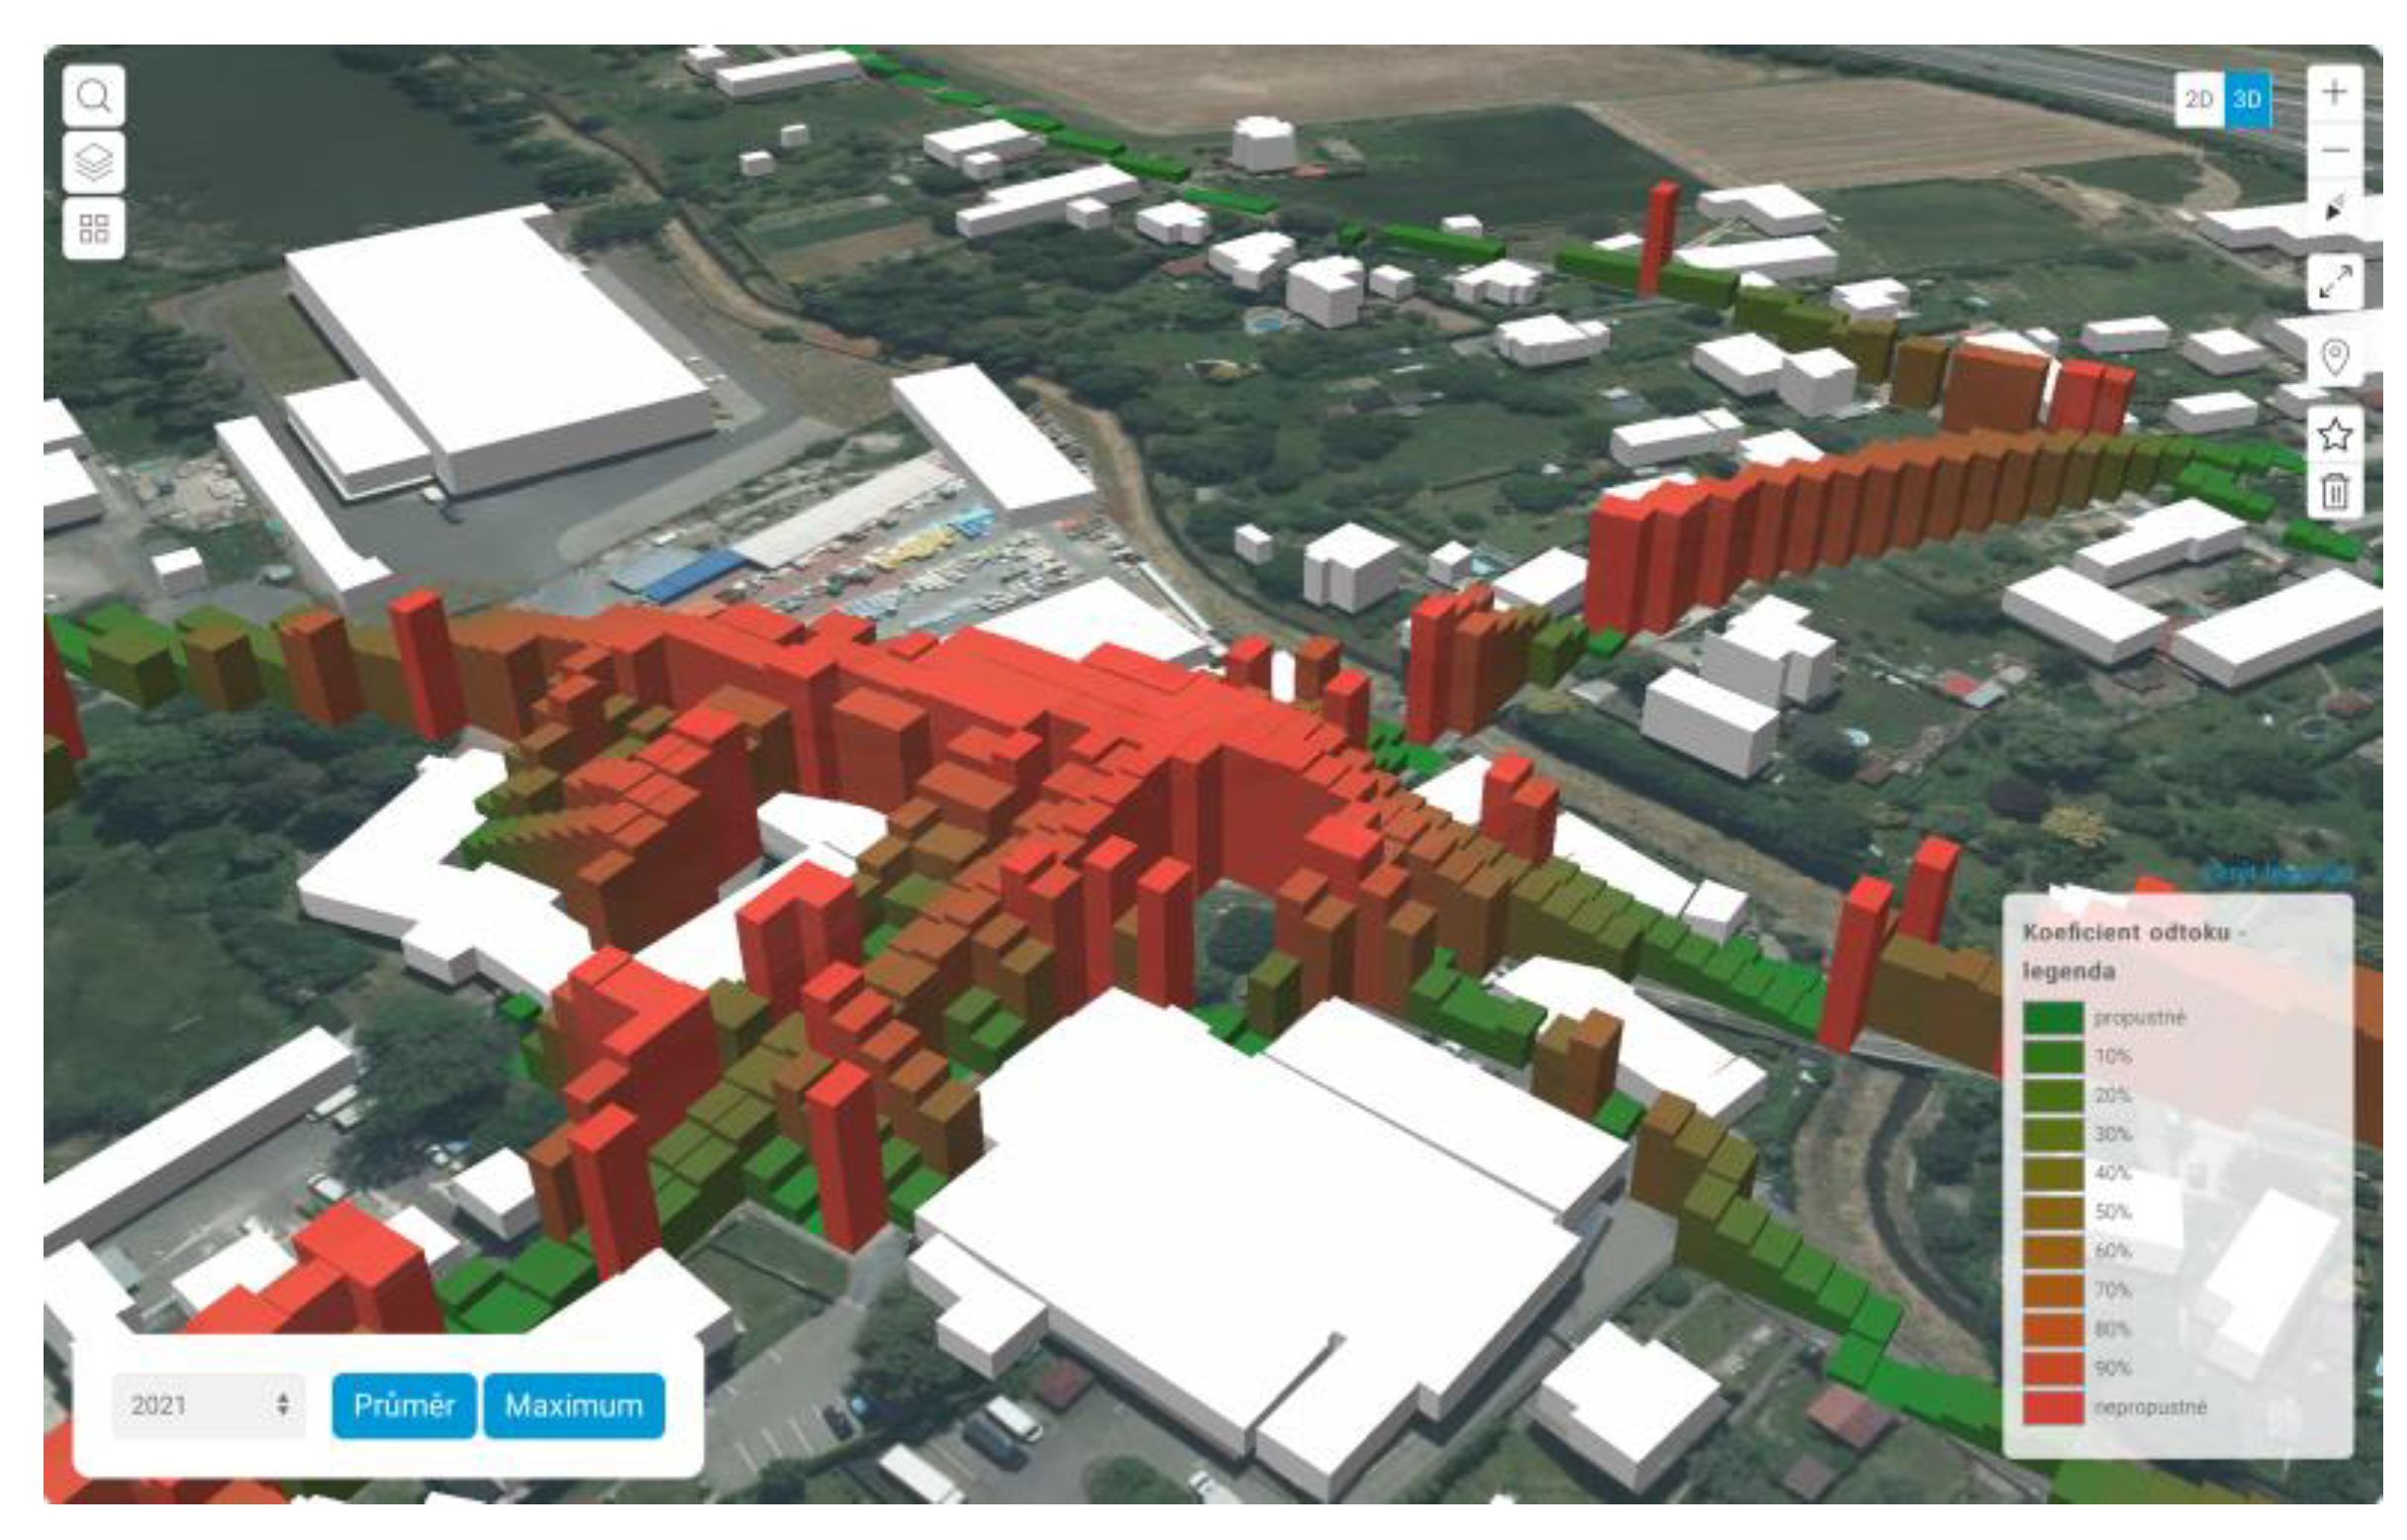
- Visualization of precipitation in 3D—an interactive map showing in 3D part of the total precipitation that creates surface runoff from a given area. The individual totals are thus represented by the height (of the water column), which is influenced by the coefficient of runoff of rainwater typical for the given surface.
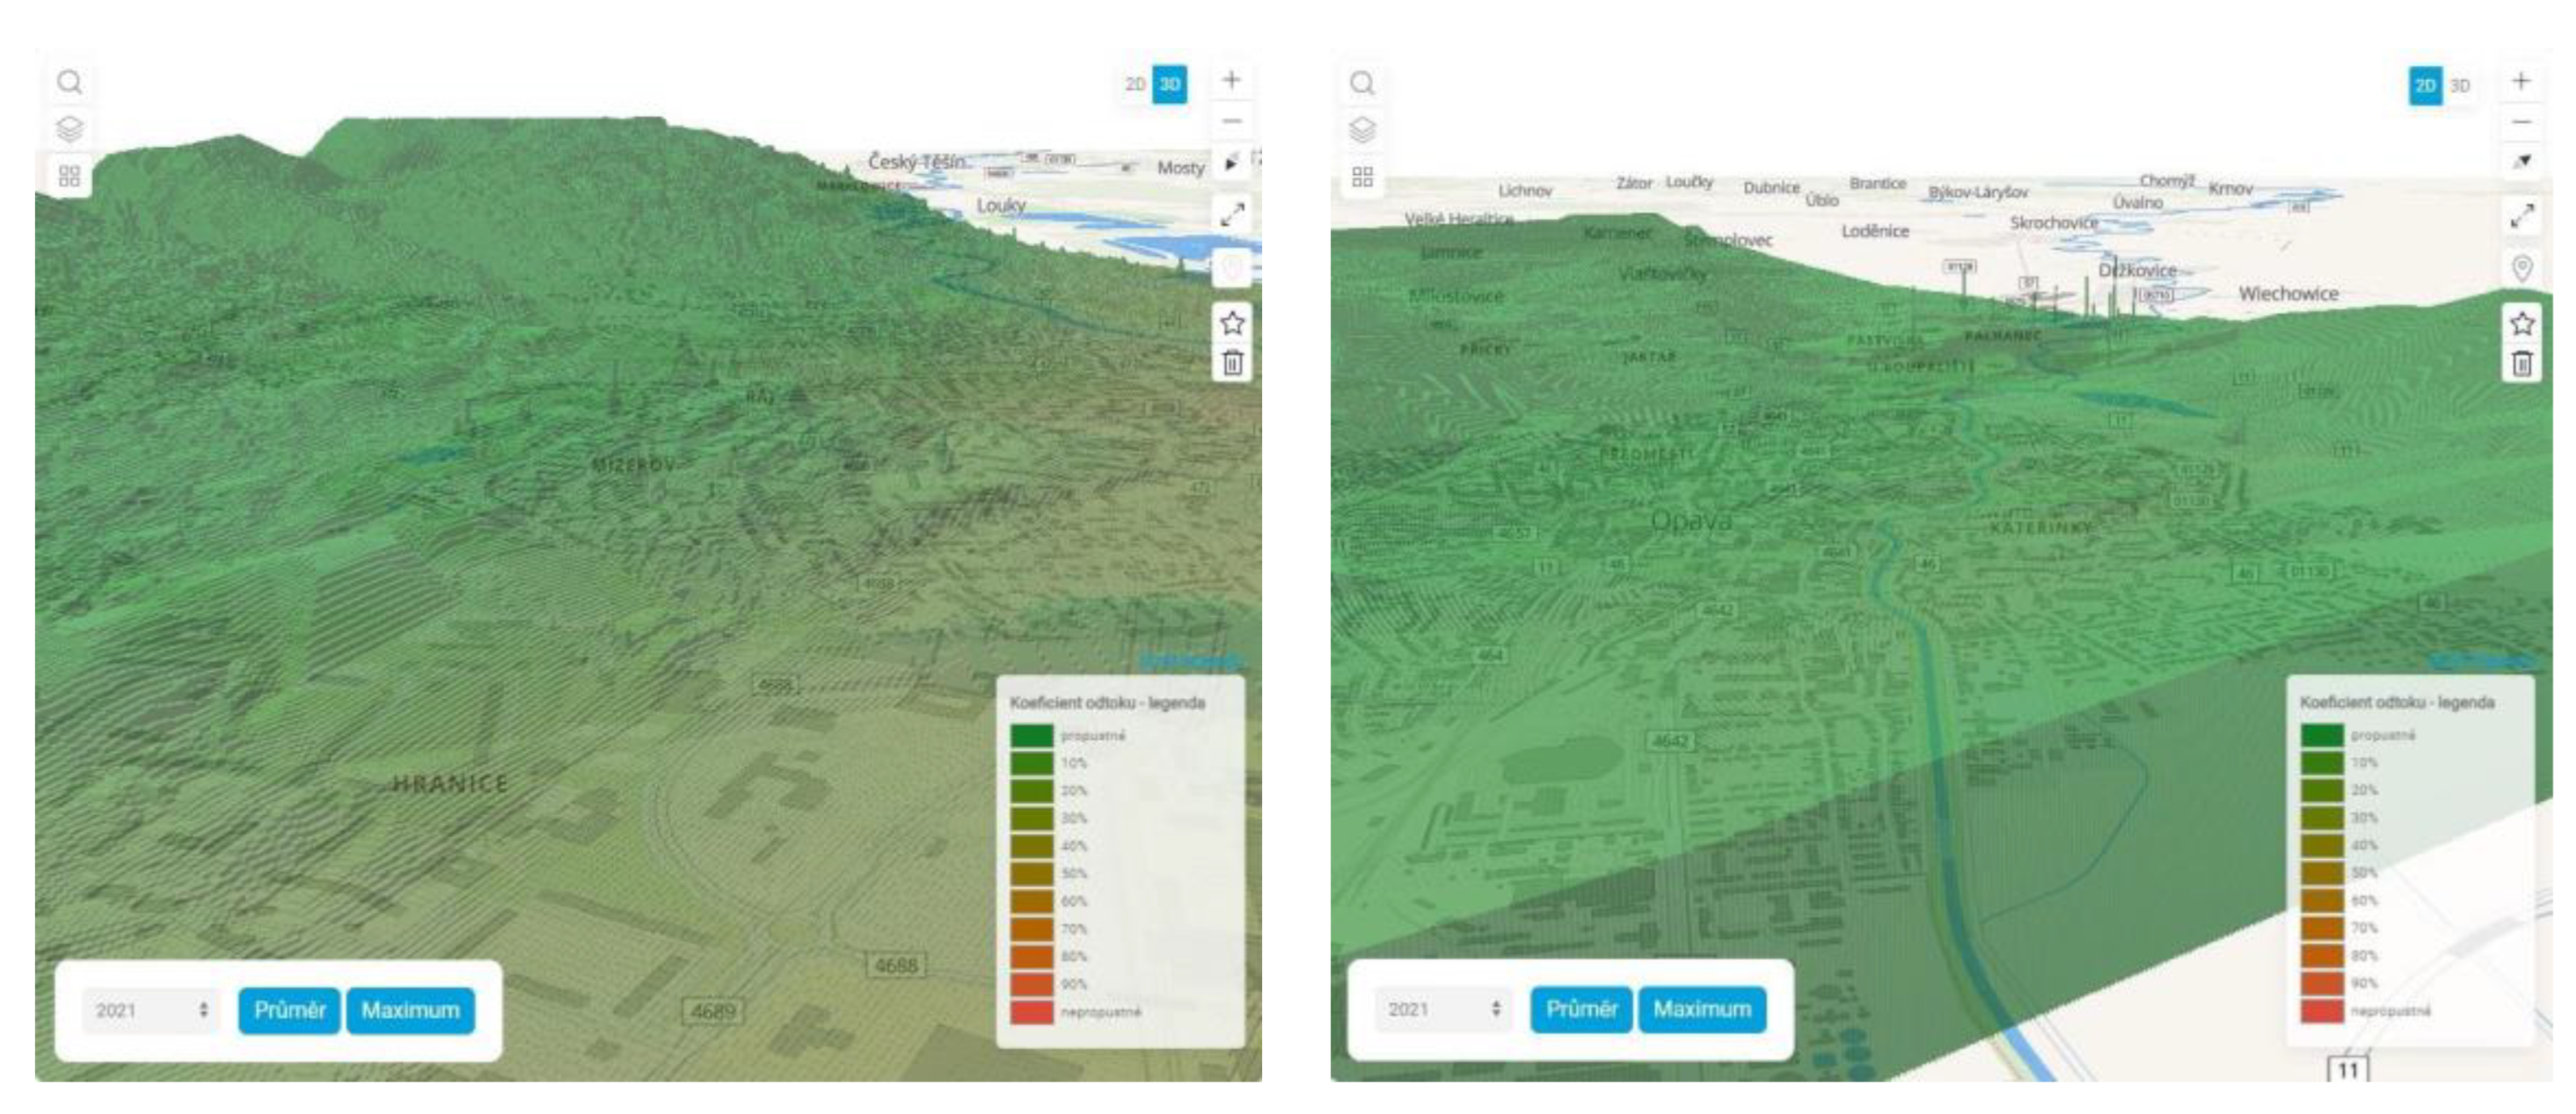
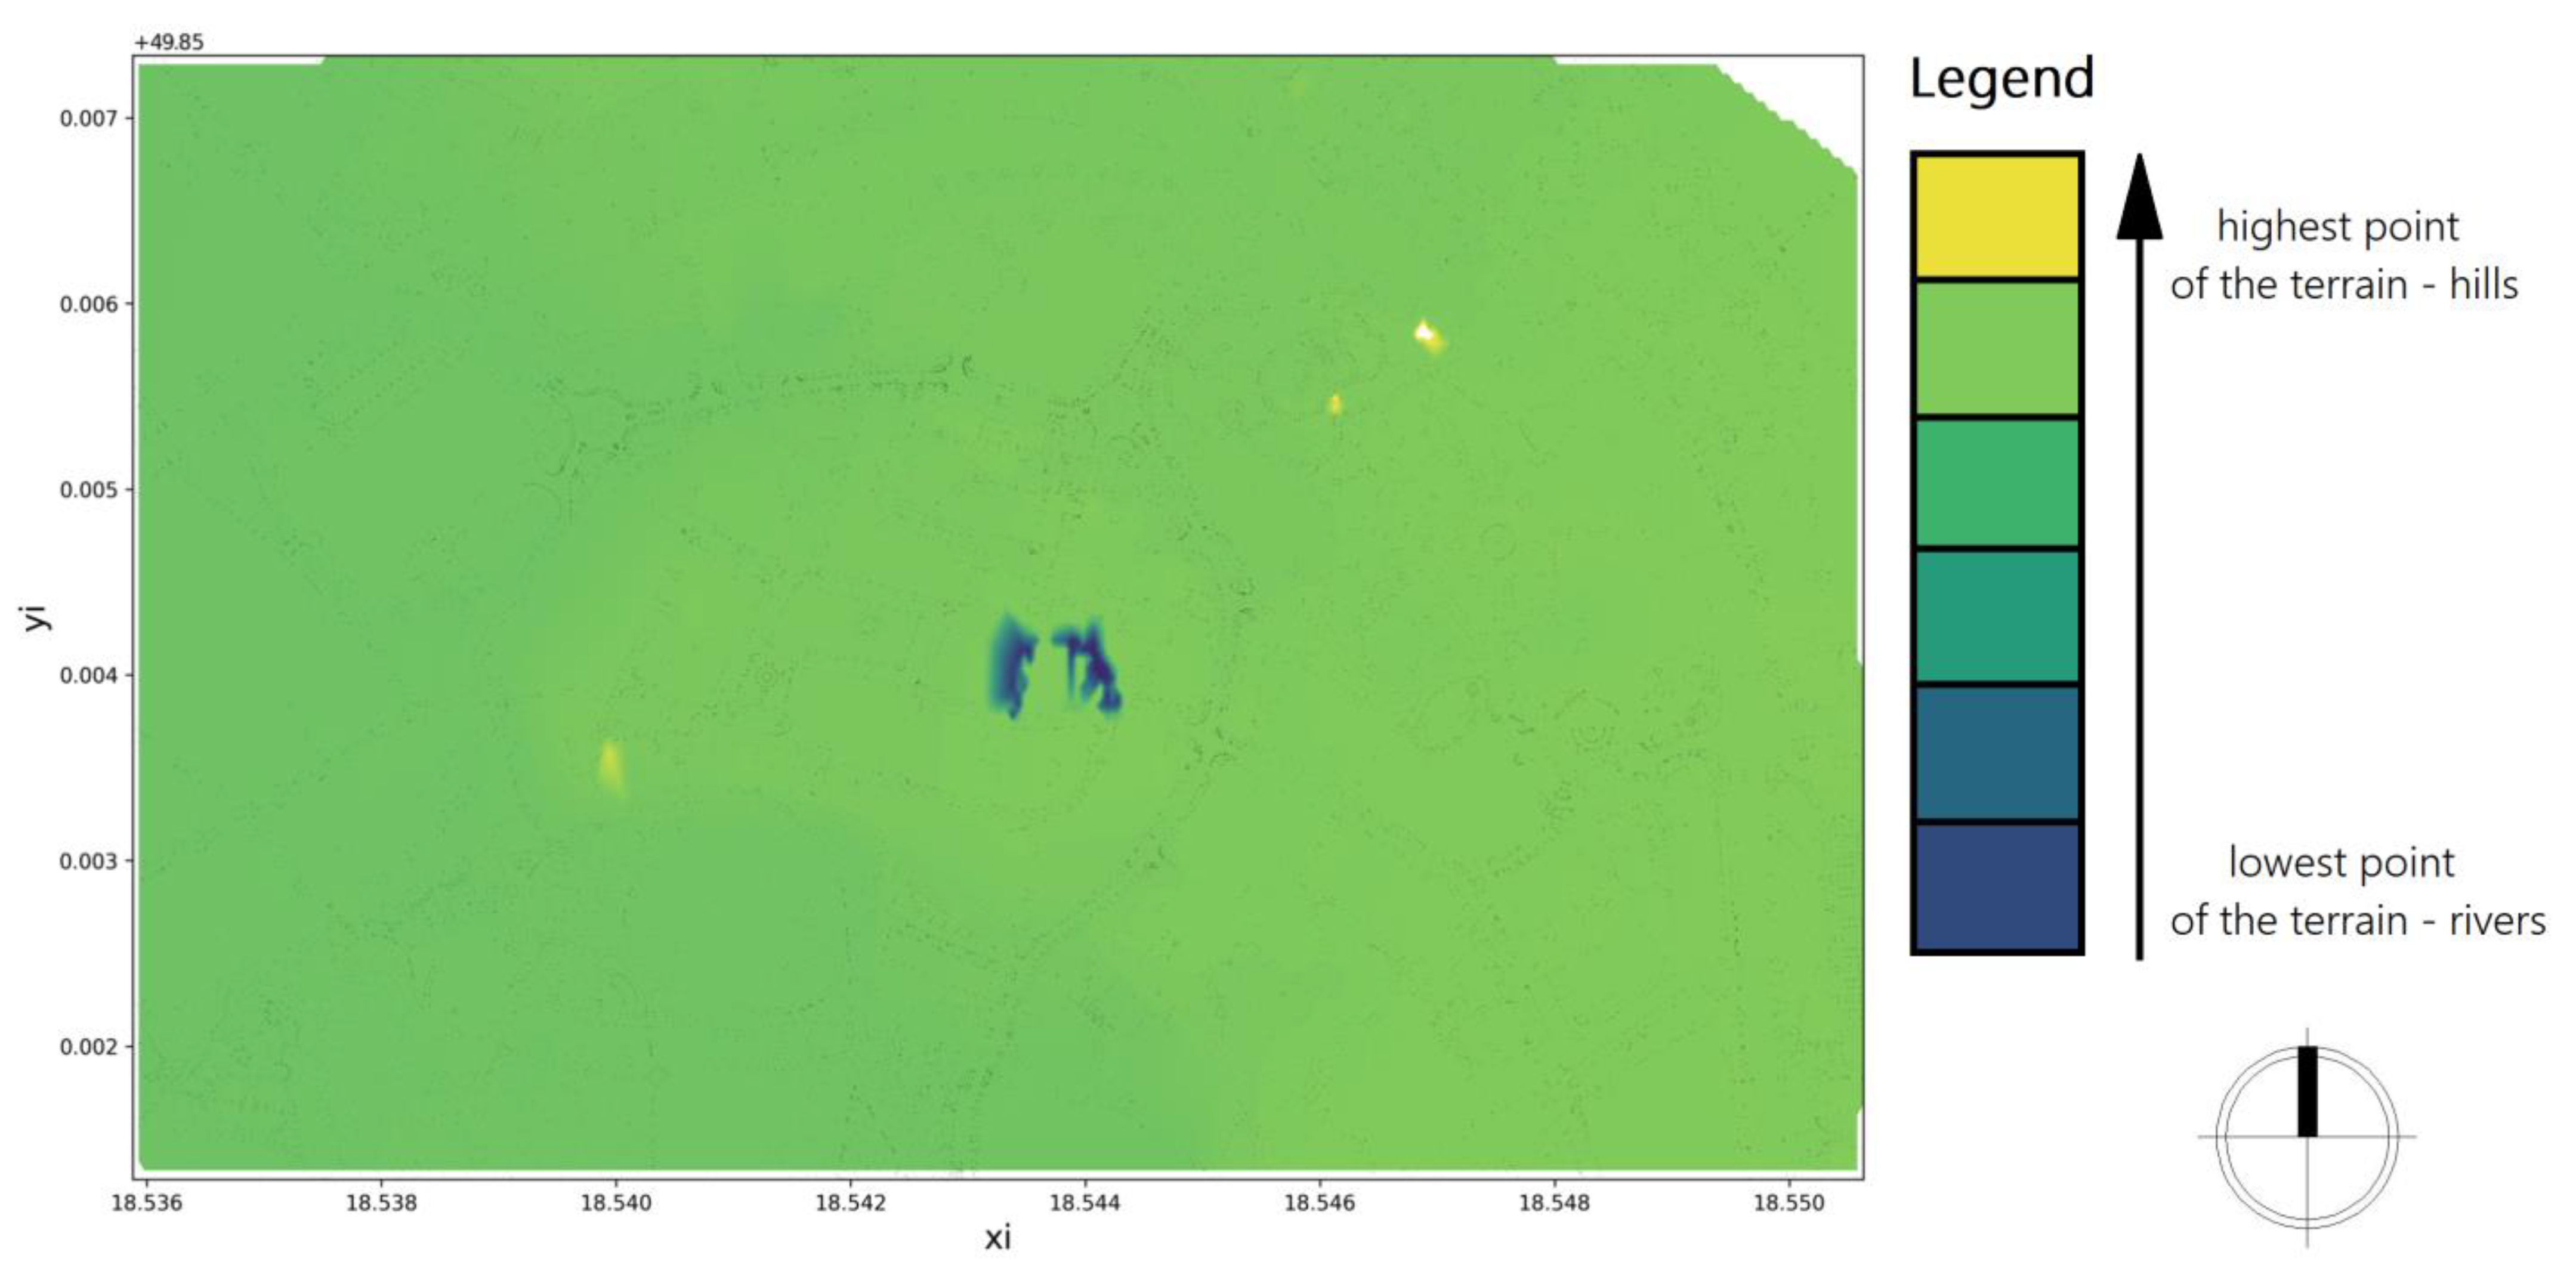
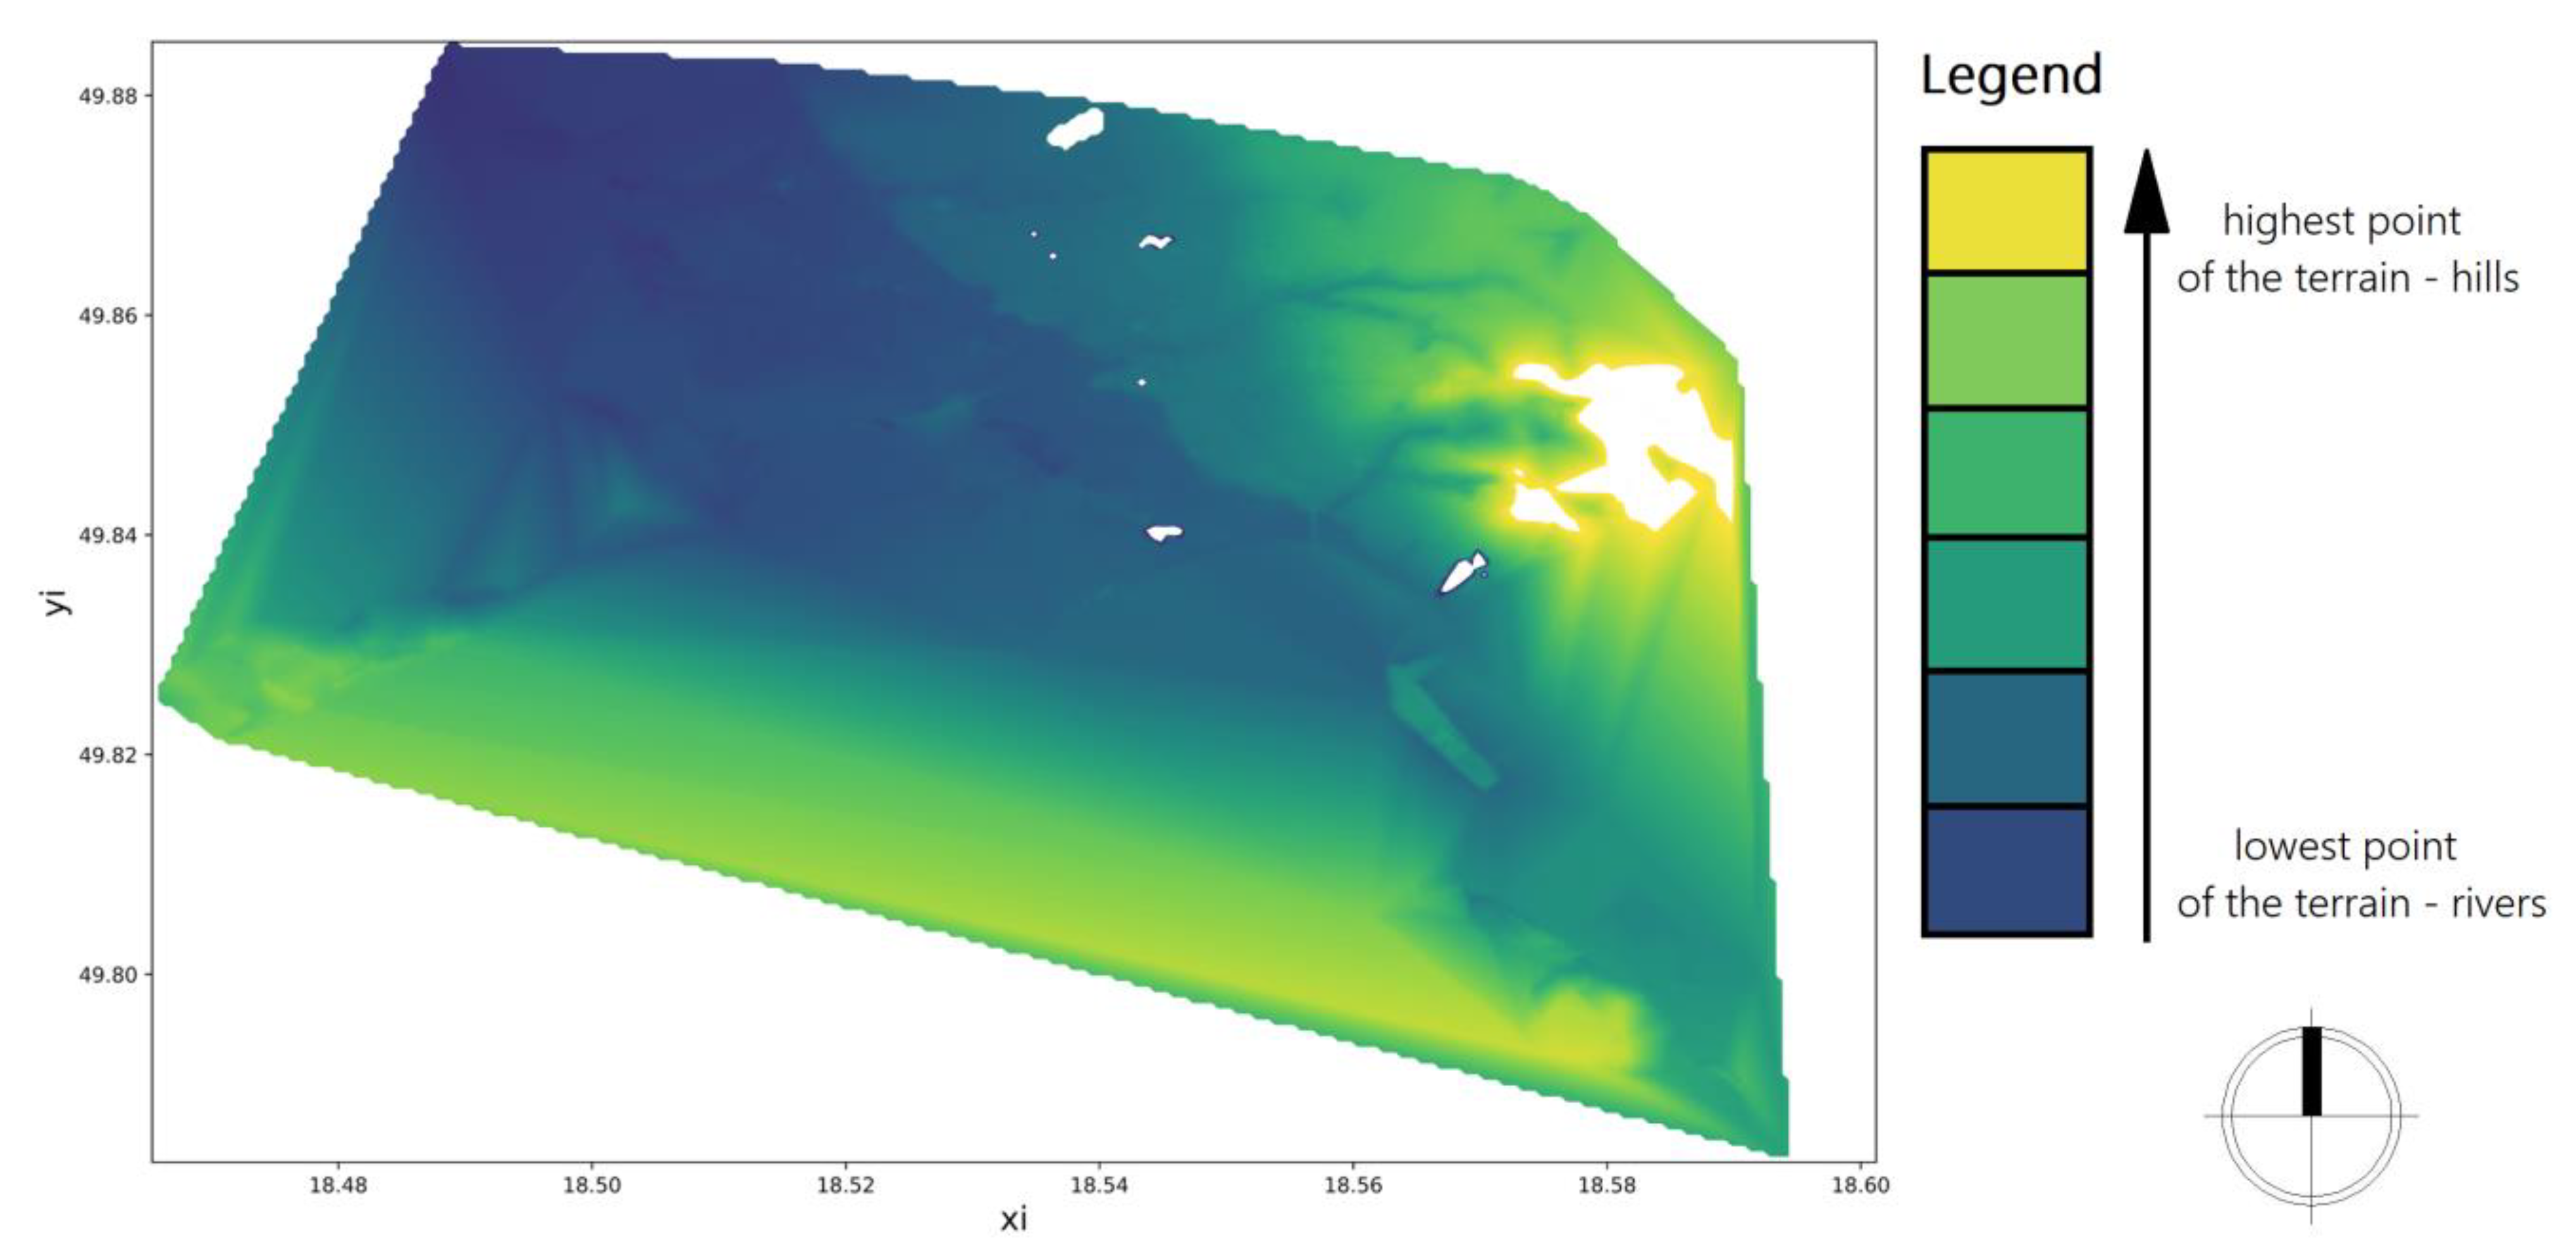
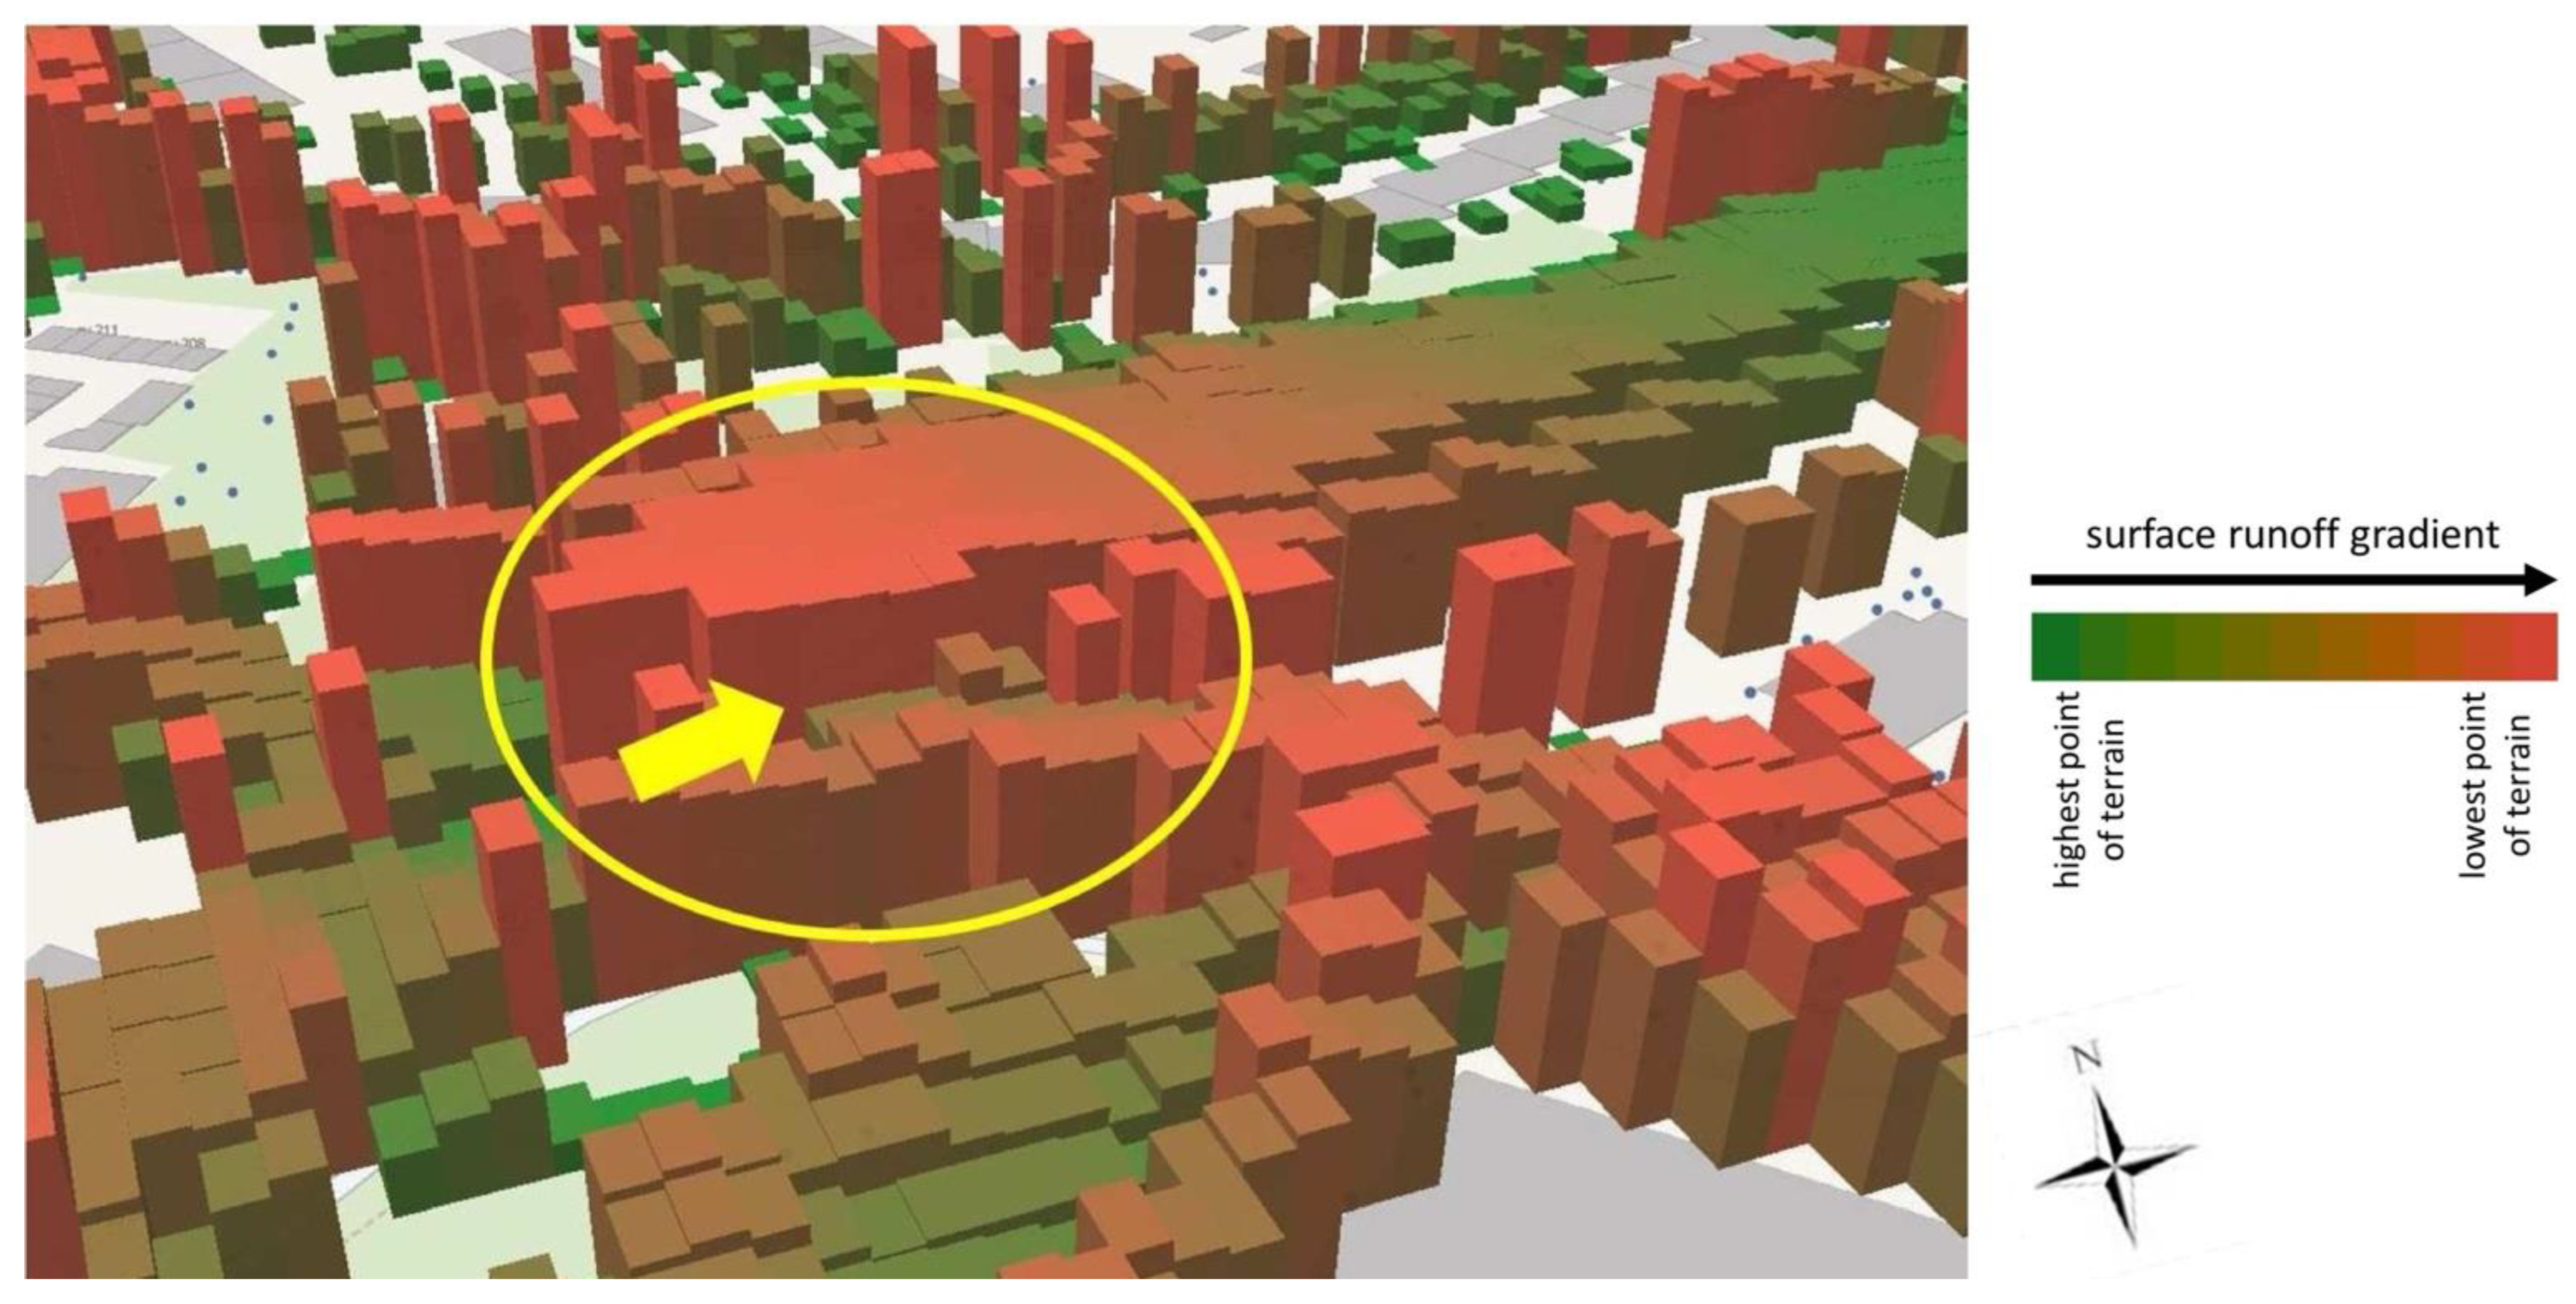
- Terrain—an extrapolated 3D terrain model of the given area. A map showing a 3D model of the urbanized surface of the given municipality, which was created based on the processing of available datasets. Individual heights are extrapolated ×10 for clarity (i.e., lowest point on the map ×0, mean value ×5, maximum value ×10).
- Water column—mathematical model of critical points. Map showing in 3D the direction of the surface runoff of rainwater to the points of accumulation of this water (maxima of columns). The calculation was performed using an inverse function applied to the terrain map in an algorithmic combination with a 3D precipitation visualization map. The result is a graphic representation of the places where rainwater accumulates from the surface runoff.
5. Results
Resulting Replies to Set Research Questions
- Can the provided and detected data be used for implementation into the proposed application?
- Will it be possible to run the map application on a regular desktop computer?
- Is the application really set up correctly?
- Will the usability of the application be ensured by municipalities in practice?
- Were any disadvantages of the model identified?
6. Discussion
7. Conclusions
Author Contributions
Funding
Data Availability Statement
Conflicts of Interest
Appendix A
- Left button—turns on the controls;
- Right button—if you hold it down, the map can be rotated horizontally and vertically.

 | Search—is used to search for a place by address; |
 | Map layers—satellite and cadastral maps can be turned on here; |
 | Map compositions—control of all parts of the WIM map:
|
- The 2D/3D button switches between the display of 2D and 3D buildings (see Figure A2).
 | Zooming in and out of the map with the + and – buttons North Arrow—if you rotate the map outside the default position, this button reorient the map with north at the top |
 | Location—moves the map view to your current location |
 | Zoom in—maximizes the map view to full screen |
 | Draw—you can use the “star button” to draw a polygon on the map that you want to calculate for the 3D Precipitation Visualization display. Use the “recycle bin button” to delete the polygon |
 | Roller—used to select the year and relevant dates of total precipitation. |
 | Average—turns on 3D columns for the areas of interest according to the average daily rainfall for the selected year. |
 | Maximum—turns on 3D columns for the areas of interest according to the maximum precipitation for one day in the selected year. |
- Name—the name of the map element, or areas on the map. Information taken from the passportized data of the given municipality, or parcel number taken from the Land Registry.
- Surface type—functional use of the given surface in the map. Information transferred from passportized data of the given municipality, or information on the functional use of land from the Land Registry.
- Area—surface area of the given area in m2.
- Status—information about the construction and technical status of the given map area. Information taken from passport data of the given municipality.
- Note—additional/clarifying information about the use of the given map area. Information taken from passport data of the given municipality.
- Runoff coefficient—a dimensionless numerical data in the range of 0 to 1, indicating the runoff coefficient of precipitation surface water ψ (according to CSN 75 9010). Information dependent on the material of the given surface and its slope.
- Material—information about the kind/type of material of the surface of the given map area. Information taken from the passportized data of the given municipality, supplemented on the basis of functional use according to data from the Land Registry


References
- Castellano-Román, M.; Garcia-Martinez, A.; Pérez López, M.L. Social Housing Life Cycle Management: Workflow for the Enhancement of Digital Management Based on Building Information Modelling (BIM). Sustainability 2022, 14, 7488. [Google Scholar] [CrossRef]
- Chung, S.; Cho, C.-S.; Song, J.; Lee, K.; Lee, S.; Kwon, S. Smart Facility Management System Based on Open BIM and Augmented Reality Technology. Appl. Sci. 2021, 11, 10283. [Google Scholar] [CrossRef]
- Peng, F.L.; Dong, Y.H.; Wang, W.X.; Ma, C.X. The next frontier: Data-driven urban underground space planning orienting multiple development concepts. Smart Constr. Sustain. Cities 2023, 1, 3. [Google Scholar] [CrossRef]
- Bruaset, S.; Sægrov, S. An Analysis of the Potential Impact of Climate Change on the Structural Reliability of Drinking Water Pipes in Cold Climate Regions. Water 2018, 10, 411. [Google Scholar] [CrossRef]
- Muis, S.; Güneralp, B.; Jongman, B.; Aerts, J.C.; Ward, P.J. Flood risk and adaptation strategies under climate change and urban expansion: A probabilistic analysis using global data. Sci. Total Environ. 2015, 538, 445–457. [Google Scholar] [CrossRef]
- Chai, J.; Wu, H.Z. Prevention/mitigation of natural disasters in urban areas. Smart Constr. Sustain. Cities 2023, 1, 4. [Google Scholar] [CrossRef]
- Yasa, I.W.; Setiawan, A.; Sulistiyono, H.; Negara, I.D.G.J.; Pracoyo, A.; Saidah, H.; Gusari, L. The Effect of Grass Block Paving on Runoff Coefficient. Civ. Eng. Archit. 2023, 11, 1688–1694. [Google Scholar] [CrossRef]
- Yokota, S.; Watanabe, Y. Evaluation on the stormwater runoff and the effect of bioswale creation along the road in urban block using high-resolution dem (digital elevation model). AIJ J. Technol. Des. 2023, 29, 904–909. [Google Scholar] [CrossRef]
- Ahmad, N.; Hassan, Q. Enhancing Blue-Green Infrastructures for Flood and Water Stress Management: A Case Study of Chennai. In Recent Developments in Water Resources and Transportation Engineering; Springer: Singapore, 2022; Volume 353. [Google Scholar] [CrossRef]
- Raumer, H.G.S.V.; Jaworski, T.; Schenk, R.; Vennemann, K. Integration of Urban Green and Blue Infrastructure by Means of an Interactive and Geo-spatial Webmap-Tool. J. Digit. Landsc. Archit. 2023, 8, 48–56. [Google Scholar] [CrossRef]
- Badach, J.; Szczepański, J.; Bonenberg, W.; Gębicki, J.; Nyka, L. Developing the Urban Blue-Green Infrastructure as a Tool for Urban Air Quality Management. Sustainability 2022, 14, 9688. [Google Scholar] [CrossRef]
- Shahid, S.; Nath, S.; Roy, J. Groundwater potential modelling in a soft rock area using a GIS. Int. J. Remote Sens. 2010, 21, 1919–1924. [Google Scholar] [CrossRef]
- Asare, E.N.; Affam, M.; Ziggah, Y.Y. A stacked generalization methodology for estimating the uniaxial compressive strength of rocks. Smart Constr. Sustain. Cities 2023, 1, 8. [Google Scholar] [CrossRef]
- Zhou, X.H.; Zhou, A.; Shen, S.L. How to mitigate the impact of climate change on modern cities: Lessons from extreme rainfall. Smart Constr. Sustain. Cities 2023, 1, 7. [Google Scholar] [CrossRef]
- De Oliveira Sousa, B.J.; Mattos, T.S.; Taffarelo, D.; Mendiondo, E.M.; Vasconcelos, J.G.; Oliveira, P.T.S. Low-Impact Development Scenarios in Terms of Construction Costs and Runoff Reduction. J. Hydrol. Eng. 2024, 29, 05023025. [Google Scholar] [CrossRef]
- Arnell, N.W.; Gosling, S.N. The impacts of climate change on river flood risk at the global scale. Clim. Chang. 2016, 134, 387–401. [Google Scholar] [CrossRef]
- Raczkova, A.; Wittmanova, R.; Hrudka, J.; Skultetyova, I. Preventing extreme events in the urban environment using blue-Green infrastructure. Pollack Period. 2023, 18, 66–71. [Google Scholar] [CrossRef]
- Zhang, S.; Yang, J.; Wan, Z.; Yi, Y. Multi-Water Source Joint Scheduling Model Using a Refined Water Supply Network: Case Study of Tianjin. Water 2018, 10, 1580. [Google Scholar] [CrossRef]
- Zheng, Q.; Shen, S.-L.; Zhou, A.; Lyu, H.-M. Inundation risk assessment based on G-DEMATEL-AHP and its application to Zhengzhou flooding disaster. Sustain. Cities Soc. 2022, 86, 104138. [Google Scholar] [CrossRef]
- Senes, G.; Ferrario, P.S.; Cirone, G.; Fumagalli, N.; Frattini, P.; Sacchi, G.; Valè, G. Nature-Based Solutions for Storm Water Management—Creation of a Green Infrastructure Suitability Map as a Tool for Land-Use Planning at the Municipal Level in the Province of Monza-Brianza (Italy). Sustainability 2021, 13, 6124. [Google Scholar] [CrossRef]
- Faqe Ibrahim, G.R.; Khzr, B.O.; Rasul, A.; Saied, P.A.; Hamid, A.A.; Galalaey, A.M.K.; Ail, S.A.; Sulaiman, C.S. A GIS-Based Method for Identifying Rainwater Harvesting: A Case Study of Sulaimanyah Governorate, Iraq. J. Water Resour. Plan. Manag. 2024, 150, 05023021. [Google Scholar] [CrossRef]
- Waseem, M.; Mutahir Ullah Ghazi, S.; Ahmed, N.; Ayaan, M.; Kebede Leta, M. Rainwater Harvesting as Sustainable Solution to Cope with Drinking Water Scarcity and Urban Flooding: A Case Study of Public Institutions in Lahore, Pakistan. CivilEng 2023, 4, 638–656. [Google Scholar] [CrossRef]
- Teichmann, M.; Kuta, D.; Endel, S.; Szeligova, N. Modeling and Optimization of the Drinking Water Supply Network—A System Case Study from the Czech Republic. Sustainability 2020, 12, 9984. [Google Scholar] [CrossRef]
- Forging a Climate-Resilient Europe—The New EU Strategy on Adaptation to Climate Change. Available online: https://eur-lex.europa.eu/legal-content/EN/TXT/?uri=COM:2021:82:FIN (accessed on 15 November 2023).
- Strategy for Adapting to Climate Change in the Conditions of the Czech Republic. Available online: https://www.mzp.cz/C1257458002F0DC7/cz/zmena_klimatu_adaptacni_strategie/$FILE/OEOK_Narodni_adaptacni_strategie-aktualizace_20212610.pdf (accessed on 15 November 2023).
- Climate Change Adaptation Strategy of the Statutory City of Opava. Available online: https://www.opava-city.cz/files/sity/rozvojove-dokumenty/adaptacni-strategie/adaptacni_strategie_opava-analyticka_cast.pdf (accessed on 15 November 2023).
- Adaptation Strategy of the Statutory City of Ostrava for the Impacts and Risks Resulting from Climate Change. Available online: https://zdravaova.cz/wp-content/uploads/2017/10/AS-Ostrava-Návrhová-část-minimal.pdf (accessed on 1 November 2023).
- Adaptation Strategy of the Statutory City Frydek-Mistek. Available online: https://www.frydekmistek.cz/magistrat/strategicky-plan/adaptacni-strategie-mesta-f≈m/ (accessed on 15 November 2023).
- Climate Change Adaptation Strategy of the Statutory City of Karvina. Available online: https://www.karvina.cz/deje-se/adaptacni-strategii-na-zmenu-klimatu-statutarniho-mesta (accessed on 1 November 2023).
- Climate Change Adaptation Strategy of the City of Havirov. Available online: https://www.havirov-city.cz/sites/default/files/files/article-attachments/adaptacni-strategie-text_0.pdf (accessed on 15 November 2023).
- Mahmoud, H.M.; Fayad, A.A.; Nassar, A.H. Investigating the Impact of Changing the Usage Type of Existing Structure Using BIM. Civ. Eng. J. 2022, 8, 1606–1621. [Google Scholar] [CrossRef]
- Albasri, N.A.H.; Al-Jawari, S.M.; Al-Mosherefawi, O.J. Prediction of Urban Spatial Changes Pattern Using Markov Chain. Civ. Eng. J. 2022, 8, 710–722. [Google Scholar] [CrossRef]
- Darabi, H.; Choubin, B.; Rahmati, O.; Torabi Haghighi, A.; Pradhan, B.; Kløve, B. Urban flood risk mapping using the GARP and QUEST models: A comparative study of machine learning techniques. J. Hydrol. 2019, 569, 142–154. [Google Scholar] [CrossRef]
- Szeligova, N.; Faltejsek, M.; Teichmann, M.; Kuda, F.; Endel, S. Potential of Computed Aided Facility Management for Urban Water Infrastructure with the Focus on Rainwater Management. Water 2023, 15, 104. [Google Scholar] [CrossRef]
- Czech Hydrometeorological Institute. Statistical Data. Available online: https://www.chmi.cz/ (accessed on 15 November 2023).
- Spatial Plan of Karvina City. Available online: https://www.karvina.cz/magistrat/novy-uzemni-plan (accessed on 7 November 2023).
- He, Y.T.; Atangana Njock, P.G. An analysis approach for building collapse accident using system thinking approach and SEA model. Smart Constr. Sustain. Cities 2023, 1, 11. [Google Scholar] [CrossRef]
- García-Ávila, F.; Guanoquiza-Suárez, M.; Guzmán-Galarza, J.; Cabello-Torres, R.; Valdiviezo-Gonzales, L. Rainwater harvesting and storage systems for domestic supply: An overview of research for water scarcity management in rural areas. Results Eng. 2023, 18, 101153. [Google Scholar] [CrossRef]
- Li, B.; Li, X.; Xiao, W.; Cheng, Q.; Bao, T. Quantitative characterization method of 3D roughness of rock mass structural surface considering size effect. Smart Constr. Sustain. Cities 2023, 1, 9. [Google Scholar] [CrossRef]
- Coupry, C.; Noblecourt, S.; Richard, P.; Baudry, D.; Bigaud, D. BIM-Based Digital Twin and XR Devices to Improve Maintenance Procedures in Smart Buildings: A Literature Review. Appl. Sci. 2021, 11, 6810. [Google Scholar] [CrossRef]
- Nsiah, R.A.; Mantey, S.; Ziggah, Y.Y. Building segmentation from UAV orthomosaics using unet-resnet-34 optimised with grey wolf optimisation algorithm. Smart Constr. Sustain. Cities 2023, 1, 21. [Google Scholar] [CrossRef]
- Czech Republic. Act No. 183/2006 Coll., on Territorial Planning and Building Code (Building Act), as Amended. Available online: https://www.zakonyprolidi.cz/cs/2006-183 (accessed on 7 November 2023).
- Blanchet, C.; Castaing, C.; Beaufils, M.; Emmanuel, D. GeoBIM (MINnD) Use Case on an Infrastructure Acoustic Study: Feedback on the Use of CityGML and InfraGML. 2017. Available online: https://portal.opengeospatial.org/files/?artifact_id=75554 (accessed on 28 March 2019).
- Rogelj, V.; Bogataj, D. Social infrastructure of Silver Economy: Literature review and Research agenda. IFAC-PapersOnLine 2019, 52, 2680–2685. [Google Scholar] [CrossRef]
- Broz, J.; Tichy, T.; Angelakis, V.; Belinova, Z. Usage of V2X Applications in Road Tunnels. Appl. Sci. 2022, 12, 4624. [Google Scholar] [CrossRef]
- Lee, S.; Lee, S.; Lee, M.-J.; Jung, H.-S. Spatial Assessment of Urban Flood Susceptibility Using Data Mining and Geographic Information System (GIS) Tools. Sustainability 2018, 10, 648. [Google Scholar] [CrossRef]
- Tichy, T.; Svorc, D.; Ruzicka, M.; Belinova, Z. Thermal Feature Detection of Vehicle Categories in the Urban Area. Sustainability 2021, 13, 6873. [Google Scholar] [CrossRef]
- Tichy, T.; Broz, J.; Smerda, T.; Lokaj, Z. Application of Cybersecurity Approaches within Smart Cities and ITS. In Proceedings of the 2022 Smart City Symposium Prague (SCSP), Prague, Czech Republic, 26–27 May 2022; pp. 1–7. [Google Scholar] [CrossRef]
- CSN 75 9010 (759010); Stormwater Soakways. Czech Office for Standards, Metrology and Testing: Prague, Czech Republic, 2012.
- Leal Sobral, V.A.; Nelson, J.; Asmare, L.; Mahmood, A.; Mitchell, G.; Tenkorang, K.; Todd, C.; Campbell, B.; Goodall, J.L. A Cloud-Based Data Storage and Visualization Tool for Smart City IoT: Flood Warning as an Example Application. Smart Cities 2023, 6, 1416–1434. [Google Scholar] [CrossRef]
- Go, H.; Kim, S.W.; Lee, Y. Design and Implementation of a Programming Automatic Assessment System in Jupyter Notebook. Int. J. Adv. Sci. Eng. Inf. Technol. 2023, 13, 1080–1086. [Google Scholar] [CrossRef]
- Acharya, A.; Raje, M. MAPbox: Using parameterized behavior classes to confine untrusted applications. In Proceedings of the 9th USENIX Security Symposium, Denver, CO, USA, 14–17 August 2000. [Google Scholar]
- Jung, K.; Nguyen, V.T.; Lee, J. BlocklyXR: An Interactive Extended Reality Toolkit for Digital Storytelling. Appl. Sci. 2021, 11, 1073. [Google Scholar] [CrossRef]
- Sehra, S.S.; Singh, J.; Rai, H.S. Assessing OpenStreetMap Data Using Intrinsic Quality Indicators: An Extension to the QGIS Processing Toolbox. Future Internet 2017, 9, 15. [Google Scholar] [CrossRef]
- Park, S.; Nielsen, A.; Bailey, R.T.; Trolle, D.; Bieger, K. A QGIS-based graphical user interface for application and evaluation of SWAT-MODFLOW models. Environ. Model. Softw. 2019, 111, 493–497. [Google Scholar] [CrossRef]
- Jun, S.; Yao, J.-l.; Liu, K.-l. Study on the method of GPS height interpolation in the linear measurement projects. In Proceedings of the 2011 International Conference on Electric Technology and Civil Engineering (ICETCE), Lushan, China, 22–24 April 2011; pp. 3553–3555. [Google Scholar] [CrossRef]
- Wang, P.; Liu, H.; Wen, J.; Zhou, B.; Qian, C.; Zhang, Y. Improvement Analysis of a Height-Deviation Compensation-Based Linear Interpolation Method for Multi-Station Regional Troposphere. Earth Space Sci. 2023, 10, e2023EA002946. [Google Scholar] [CrossRef]
- Rubasinghe, K.; Yao, G.; Niu, J.; Tsogtgerel, G. Polyharmonic splines interpolation on scattered data in 2D and 3D with applications. Eng. Anal. Bound. Elem. 2023, 156, 240–250. [Google Scholar] [CrossRef]
- Wan, D.; Lu, R.; Xu, T.; Shen, S.; Lang, X.; Ren, Z. Random Interpolation Resize: A free image data augmentation method for object detection in industry. Expert Syst. Appl. 2023, 228, 120355. [Google Scholar] [CrossRef]
- Wilkinson, L.; Friendly, M. The History of the Cluster Heat Map. Am. Stat. 2009, 63, 179–184. [Google Scholar] [CrossRef]
- Ivanisevic, J.; Benton, H.P.; Rinehart, D.; Epstein, A.; Kurczy, M.E.; Boska, M.D.; Gendelman, H.E.; Siuzdak, G. An interactive cluster heat map to visualize and explore multidimensional metabolomic data. Metabolomics 2015, 11, 1029–1034. [Google Scholar] [CrossRef]
- Ruzicka, J.; Tichy, T.; Hajciarova, E. Big Data Application for Urban Transport Solutions. In Proceedings of the 2022 Smart City Symposium Prague (SCSP), Prague, Czech Republic, 26–27 May 2022; pp. 1–7. [Google Scholar] [CrossRef]


| City/Measurement Station | January | February | March | April | May | June | July | August | September | October | November | December |
|---|---|---|---|---|---|---|---|---|---|---|---|---|
| Karvina | 44.7 | 40.3 | 37.4 | 47.9 | 91.9 | 91.0 | 82.3 | 87.5 | 82.0 | 69.5 | 42.9 | 34.8 |
| Karvina- Stare Město | 44.7 | 40.33 | 37.4 | 47.91 | 91.89 | 90.97 | 82.34 | 87.48 | 82 | 69.5 | 42.9 | 34.82 |
| Frydek-Mistek | 31.6 | 39.9 | 33.7 | 57.5 | 112.6 | 94.1 | 95.5 | 103.4 | 90.2 | 76.4 | 38.0 | 34.8 |
| Havirov | 46.7 | 44.5 | 36.0 | 46.2 | 88.9 | 85.8 | 70.2 | 80.6 | 81.6 | 62.0 | 39.9 | 35.4 |
| Opava | 21.5 | 24.5 | 24.5 | 34.1 | 73.7 | 81.1 | 59.6 | 69.2 | 68.0 | 53.8 | 24.8 | 15.5 |
| Ostrava— Slezska Ostrava | 39.2 | 34.5 | 28.9 | 40.3 | 82.4 | 74.4 | 69.4 | 84.8 | 76.5 | 60.6 | 35.5 | 28.5 |
| Ostrava-Poruba | 38.3 | 35.3 | 30.3 | 40.2 | 89.5 | 84.7 | 71.2 | 85.4 | 77.3 | 65.0 | 33.2 | 25.5 |
| Data/Passports | Karvina | Havirov | Opava | Frydek-Mistek | Ostrava |
|---|---|---|---|---|---|
| terrain model | X | X 2 | X | X 2 | X |
| terrain slope | X 1 | - | X 1 | - | X 1 |
| contour line | X | X | X | X | X |
| ownership | X | X | X | X | X |
| paved areas | X | X 3 | X | X 3 | X |
| unpaved areas | X | - | X | - | X |
| roads | X | X | X | X | X |
| pavements | X | X 3 | X | X 3 | X |
| greenery | X | X 3 | X | X 3 | X |
| inlet position | X | - | X | - | X |
| inlet altitude | X | - | X | - | X |
| storm sewer | X | - 4 | X | - 4 | X |
| data code | X | X | X | X | X |
| parking spots | X | - | X | - | X |
| Karvina | Havirov | Opava | Frydek-Mistek | Ostrava | ||||||
|---|---|---|---|---|---|---|---|---|---|---|
| Land Type | m2 | %* | m2 | %* | m2 | %* | m2 | %* | m2 | %* |
| arable land | 8,407,053 | 14.62 | 26,020,763 | 29.69 | 53,671,490 | 64.08 | 13,416,132 | 26.03 | 48,256,599 | 23.09 |
| gardens | 3,725,448 | 6.48 | 9,057,252 | 10.57 | 4,016,803 | 4.79 | 5,113,483 | 9.94 | 18,623,818 | 8.91 |
| water area | 6,103,715 | 10.61 | 4,932,285 | 5.59 | 11,731,526 | 1.78 | 1835781 | 3.56 | 9,440,361 | 4.31 |
| forest land | 9,751,946 | 16.95 | 15,264,808 | 17.33 | 4,898,197 | 5.91 | 11,625,325 | 22.55 | 23,764,905 | 11.37 |
| grassland | 1,985,809 | 3.45 | 9,523,074 | 10.79 | 1,490,416 | 3.51 | 5,520,489 | 10.76 | 12,553,499 | 6.01 |
| orchard | 51,913 | 0.09 | 753,057 | 0.85 | 4,955,286 | 0.06 | 72,714 | 0.18 | 493,457 | 0.22 |
| greenery | 3,253,698 | 5.66 | 3,299,822 | 3.82 | 1,082,194 | 1.29 | 2,568,827 | 4.98 | 9,928,018 | 4.59 |
| traffic areas | 4,372,522 | 7.60 | 6,802,109 | 7.75 | 5,390,782 | 6.44 | 3,993,009 | 7.76 | 29,361,137 | 14.05 |
| built up area | 2,821,766 | 4.91 | 4,058,922 | 4.72 | 4,898,197 | 5.85 | 2,963,941 | 5.75 | 18,567,406 | 8.56 |
| others | 17,047,414 | 29.63 | 7,818,932 | 8.89 | 5,258,550 | 6.29 | 4,378,412 | 8.49 | 40,434,685 | 18.89 |
| Parameter, Object of Calculation | Calculation |
|---|---|
| Amount of precipitation on the surface: green belts, fields, meadows with a slope of up to 1%: | Qtot = 0.05 × 157 × 10,573 = 83,000 l/s |
| Amount of precipitation on the surface: green belts, fields, meadows with a slope 1 to 5%: | Qtot = 0.1 × 157 × 500.85 = 7863 l/s |
| Amount of precipitation on the surface: green belts, fields, meadows with a slope over 5%: | Qtot = 0.15 × 157 × 55.65 = 1311 l/s |
| Total withdrawn from this area: | 92.174 l/s |
| Amount of precipitation on the surface: paved roads with a slope of up to 1%: | Qtot = 0.7 × 157 × 4129,78 = 453,863 l/s |
| Amount of precipitation on the surface: paved roads with a slope of 1% to 5%: | Qtot = 0.8 × 157 × 195.62 = 24,570 l/s |
| Amount of precipitation on the surface: paved roads with a slope above 5%: | Qtot = 0.9 × 157 × 21.735 = 3071 l/s |
| Total withdrawn from this area: | 481,505 l/s |
| Amount of precipitation on the surface: forests with a slope of up to 1%: | Qtot =0 × 157 × 2351.25 = 0 l/s |
| Amount of precipitation on the surface: forests with a slope of 1 to 5%: | Qtot = 0.05 × 157 × 111.375 = 874 l/s |
| Amount of precipitation on the surface: forests with a slope above 5%: | Qtot = 0.1 × 157 × 12.375 = 194 l/s |
| Total withdrawn from this area: | 1068 l/s |
| Amount of precipitation on the surface: cemeteries, orchards, playgrounds with a slope of up to 1%: | Qtot = 0.1 × 157 × 219.45 = 3438 l/s |
| Amount of precipitation on the surface: cemeteries, orchards, playgrounds with a slope of 1 to 5%: | Qtot = 0.15 × 157 × 10.395 = 244 l/s |
| Amount of precipitation on the surface: cemeteries, orchards, playgrounds with a slope above 5%: | Qtot = 0.2 × 157 × 1.155 = 36 l/s |
| Total withdrawn from this area: | 3718 l/s |
| Amount of precipitation on the surface: buildings with a slope of up to 1%: | Qtot = 0.7 × 157 × 2186.9 = 240,363 l/s |
| Amount of precipitation on the surface: buildings with a slope of 1 to 5%: | Qtot = 0.8 × 157 × 103.59 = 13,012 l/s |
| Amount of precipitation on the surface: buildings with a slope above 5%: | Qtot = 0.9 × 157 × 11.51 = 1.27 l/s |
| Total withdrawn from this area: | 255,002 l/s |
| The total impact of the amount of rainfall for the territory—Ostrava | Qtot = 1 × 157 × 2.142 = 3,363,393 l/s |
Disclaimer/Publisher’s Note: The statements, opinions and data contained in all publications are solely those of the individual author(s) and contributor(s) and not of MDPI and/or the editor(s). MDPI and/or the editor(s) disclaim responsibility for any injury to people or property resulting from any ideas, methods, instructions or products referred to in the content. |
© 2024 by the authors. Licensee MDPI, Basel, Switzerland. This article is an open access article distributed under the terms and conditions of the Creative Commons Attribution (CC BY) license (https://creativecommons.org/licenses/by/4.0/).
Share and Cite
Teichmann, M.; Szeligova, N.; Faltejsek, M.; Chvatik, S. A Tool for Identifying Suitable Places for the Placement of Blue-Green Infrastructure Elements, a Case Study on the Cities of the Moravian-Silesian Region, Czech Republic. Water 2024, 16, 424. https://doi.org/10.3390/w16030424
Teichmann M, Szeligova N, Faltejsek M, Chvatik S. A Tool for Identifying Suitable Places for the Placement of Blue-Green Infrastructure Elements, a Case Study on the Cities of the Moravian-Silesian Region, Czech Republic. Water. 2024; 16(3):424. https://doi.org/10.3390/w16030424
Chicago/Turabian StyleTeichmann, Marek, Natalie Szeligova, Michal Faltejsek, and Stepan Chvatik. 2024. "A Tool for Identifying Suitable Places for the Placement of Blue-Green Infrastructure Elements, a Case Study on the Cities of the Moravian-Silesian Region, Czech Republic" Water 16, no. 3: 424. https://doi.org/10.3390/w16030424
APA StyleTeichmann, M., Szeligova, N., Faltejsek, M., & Chvatik, S. (2024). A Tool for Identifying Suitable Places for the Placement of Blue-Green Infrastructure Elements, a Case Study on the Cities of the Moravian-Silesian Region, Czech Republic. Water, 16(3), 424. https://doi.org/10.3390/w16030424