Article

Impact of Diverse Rainfall Patterns and Their Interaction on Soil and Water Loss in a Small Watershed within a Typical Low Hilly Region

1
College of Agricultural Science and Engineering, Hohai University, Nanjing 211100, China
2
Planning Office of Department of Water Resources of Jiangsu Province, Nanjing 210029, China
*
Author to whom correspondence should be addressed.
Water 2024, 16(3), 372; https://doi.org/10.3390/w16030372
Submission received: 26 December 2023 / Revised: 18 January 2024 / Accepted: 19 January 2024 / Published: 23 January 2024
(This article belongs to the Special Issue Study on Soil Hydrological Process, Mechanisms and Effects)

Abstract

:
Assessing the impact of varied rainfall patterns on soil and water loss within a hilly watershed over an extended temporal scope holds paramount importance in comprehending regional runoff and sediment traits. This study utilized continuous rainfall and sediment data spanning from 2013 to 2021, and the K-means clustering method was employed to analyze rainfall types. Subsequently, the rain-type characteristics underwent further analysis through LSD, and a multiple linear regression equation was formulated. The result showed that: within the Qiaotou small basin, rainfall, maximum rainfall intensity within 30 min (I30), and rainfall erosivity exhibited notable effects on sediment yield and loss. The water-sediment attributes of 305 rainfall events were characterized by rainfall below 100 mm, I30 of less than 35 mm/h, a runoff coefficient below 0.5, and sediment content under 0.6 g/L. According to the characteristics of different rainfall types and the degree of influence on water and sediment in small watersheds, 305 rainfall events in the basin were divided into three types by the K-means clustering analysis method: A (heavy rainfall, moderate rain), B (small rainfall, light rain), and C (medium rainfall, heavy rain). The most frequent rain type observed was B, followed by C, while A had the lowest frequency. Despite the lower intensity of B-type rainfall, it holds significant regional importance. Conversely, C-type rainfall, although intense and short, serves as the primary source of sediment production. The multiple regression equation effectively models both sediment yield modulus and flood peak discharge, exhibiting an R2 coefficient exceeding 0.80, signifying significance. This equation enables the quantitative calculation of pertinent indicators. Sediment yield modulus primarily relies on sediment concentration, runoff depth, and rainfall, while peak discharge is significantly influenced by runoff depth, sediment concentration, and I30. Furthermore, the efficacy of various soil and water conservation measures for flow and sediment reduction correlates with I30. Overall, the impact of different measures on reducing flow and sediment increases with a higher I30, accompanied by a reduced fluctuation range.

1. Introduction

Rainfall constitutes the primary factor for soil erosion [1,2,3,4]. As rainfall increases, slope runoff intensifies, perpetually heightening the soil’s erosion potential [5,6,7,8,9]. Erosive rainfall is a critical factor driving soil erosion in small watersheds, significantly influenced by rainfall amount, duration, and intensity. Its profound impact is crucial for monitoring, evaluating, and managing soil and water loss in various regions [10,11,12,13]. Wischmeier et al. characterized erosive rainfall in the United States as events with daily rainfall exceeding 12.7 mm [14,15,16], while Xie Yun et al. defined it on the Loess Plateau as events surpassing 12 mm daily [17,18,19]. In our study, we examined 305 rainfall events, selected based on a threshold of over 12 mm, to analyze regional rainfall characteristics. Within the confines of a small watershed, where topography and soil properties remain relatively stable over short periods, soil erosion predominantly occurs during erosive rainfall events [20,21]. These events’ varying patterns significantly influence the runoff process and soil erosion [22]. Recent research, both nationally and internationally, has extensively explored the relationship between rainfall characteristics and regional sediment yield. Fubiao [23] studied erosive rainfall and sediment yield traits in the Puxiang River Basin in western Yunnan Province, unveiling distinct impacts of rainfall factors on runoff depth and sediment yield across varied land use types. Wanghe [24] investigated sediment production regularities on exposed slopes in red soil regions under diverse rainfall types, revealing a linearly positive correlation between runoff depth, soil erosion, and rainfall metrics such as precipitation (P), maximum 30 min rainfall intensity (I30), and rainfall kinetic energy (E). Zhao Y [25] conducted various lab experiments examining rainfall effects on runoff and soil erosion, noting significant differences in the hydrograph, sediment graph, soil water content, and infiltration depth. Deng L [26] compared the characteristics of runoff and sediment yield under different slope gradients and rainfall intensities for two kinds of different hillslopes with weathered granite and with exposed soils, respectively, from the laterite layer and sand layer, demonstrating the effects of rainfall intensity and slope gradient on sloping runoff and sediment yield. Puntenney-Desmond K C [27] utilized rainfall simulations to investigate surface and shallow subsurface runoff alongside sediment transport in a steep watershed within the Rocky Mountains during intense precipitation events, delineating distinctive runoff and sediment patterns among the harvesting area, harvested riparian edge, and riparian buffer zone. Meng Zekun [28] probed sediment yield and loss specifics in the Fort Cobb Basin, Oklahoma, USA, discerning notable differences in secondary rainfall movement’s impact on sediment yield loss during analogous rainfall processes. These findings underscore discrepancies between rainfall characteristics and sediment yield across disparate regions [29,30,31,32]. However, the preceding regional analyses primarily focused on correlation studies, lacking in-depth exploration of diverse measures’ characteristics for runoff and sediment reduction in subsequent rainfall. This study statistically analyzed rainfall data from small watersheds in Nanjing City’s low hills and hilly regions, scientifically categorizing rain patterns based on distinct rainfall characteristics. It systematically analyzed and discussed production and cessation points under various rain patterns and deeply scrutinized the impact of diverse soil and water conservation measures on mitigating runoff and sediment in subsequent rainfall [33,34,35]. These comprehensive investigations aim to furnish a scientific foundation for holistic soil and water conservation management. They provide pivotal insights into comprehending soil erosion mechanisms and formulating efficacious strategies for soil and water conservation [36,37,38].

2. Data and Methods

2.1. Study Area Overview

The Qiaotou small watershed is located in Fushan Community, Baima Street, Lishui District, Nanjing, Jiangsu Province, spanning a total area of 3.1 km2. Positioned at 119°10’05” east longitude and 31°40’28” north latitude, this area epitomizes a typical southern hilly terrain, ranging in elevation from 115 to 273 m above sea level. Embracing a subtropical monsoon climate, it receives an average annual precipitation of 1107.3 mm and maintains an average temperature of 15.5 °C. Sunshine graces the region for an average of 2146 h annually, accompanied by a frost-free period lasting 237 days, while the average annual evaporation stands at 1038 mm. Predominantly comprising yellow-brown soil prone to water erosion, the soil layer spans 0–50 cm in thickness and is characterized by poor erosion resistance. The Qiaotou Watershed is situated at the heart of the red-soil hilly region in southern China, serving as a quintessential representative of Jiangsu Province and the broader red-soil hilly areas in the southern part of the country. In 2013, the Qiaotou Small Watershed Soil and Water Conservation Comprehensive Observation Station became part of the China Soil and Water Conservation Dynamic Monitoring and Announcement Project. The precise location of the Qiaotou small watershed is illustrated in Figure 1.

2.2. Data Sources and Research Methods

The Qiaotou small watershed station stands upstream of the inlet river at Fushan Bridge, adjacent to the Convenient Reservoir (Sijiawa River). Monitoring at this station encompasses various parameters such as precipitation, water level, velocity, and sediment content. Meteorological elements, such as rainfall, are tracked via multi-functional meteorological stations, while water level and velocity are monitored using current meters. Sediment content assessment involves a combination of automatic sampling and manual measurements. Runoff and sediment discharge data are derived using established flow calculation formulas. The basin’s runoff district, initiated in 2011 under the monitoring site number FA3220614140, chiefly oversees soil and water loss in the eastern hilly and mountainous areas of Lishui District, functioning as a standard water erosion monitoring zone. The runoff plot, pivotal for observing soil erosion’s impacts on sloping lands and assessing soil and water conservation measures [39,40,41], features a rectangular flow collection trough with dimensions of 0.25 m width, 0.20 m depth, and a 1% slope. Additionally, two sand sinks measuring 1.2 m in length, 1.0 m in width, and 1.0 m in depth are present. The first runoff pond comprises nine holes, one of which diverts flow to the second sand sink. This study focuses on the continuous analysis of meteorological, hydrological, and sediment data gathered over the past 11 years. Table 1 and Figure 2 present a detailed breakdown of Nanjing Qiaotou small watershed’s annual runoff, sediment transport, and total rainfall data from 2013 to 2021.
Rainfall data were transmitted wirelessly to the telemetry platform in the Qiaotou small watershed station. Daily rainfall records were retrieved from the platform on a daily basis, while rainfall process data were acquired monthly. Rainfall, rainfall intensity, I30, and rainfall erosion were computed using EXCEL 2020 software with the assistance of the Soil and Water Assessment Tool (SWAT) model. For water level and flow velocity measurements, three vertical lines were designated on the section, and subsequent flow rate computations were performed. According to the “Code for measurement of suspended load in open channels” [42], the sediment samples were processed using the drying method. The collected samples were precipitated, concentrated, poured into a baking cup to dry, cooled, and weighed, and the average sediment content on the vertical line was calculated.
The investigation into rainfall and sediment yield characteristics in the Qiaotou small watershed involves an array of statistical analyses. These encompass descriptive statistical analysis, Pearson correlation analysis, K-means cluster analysis, LSD analysis of variance, and multiple linear regression analysis. K-means cluster analysis is a popular unsupervised machine learning algorithm used for partitioning a dataset into distinct groups or clusters based on similarities among data points [43,44]. LSD stands for Least Significant Difference, and when associated with Analysis of Variance (ANOVA), it refers to a statistical method used to make pairwise comparisons between group means [45]. Multiple Linear Regression (MLR) is a statistical technique used to model the relationship between a dependent variable and two or more independent variables by fitting a linear equation to the observed data [46]. The hydrological and sediment data utilized in this study originated from monitoring conducted at the Fushan Bridge section within the Baykou Station. The dataset encompasses nine variables: precipitation (P, mm); rainfall duration (T, min); maximum 30-min rainfall intensity (I30, mm/h); rainfall erosivity (R, MJ·mm/(hm2·h·a)); peak discharge (Qmax, m3/s); runoff depth (H, mm); runoff coefficient (Rc); sediment concentration (C, g/L); and sediment production modulus (Ms, t/hm2).

3. Results

3.1. Rainfall Types

Precipitation, rainfall intensity, and I30 significantly influence sediment yield and loss within the basin [47,48,49]. Adhering to Perruchet’s 1983 classification criteria [50], an analysis was conducted to discern the impact of various rainfall types on water and sediment within small catchments. Employing the K-means clustering analysis method, the 305 rainfall events within the catchment were categorized into three types, as detailed in Table 2. The Qiaotou small watershed’s rainfall types are classified as A, B, and C, with their respective central values (A, C, B) and I30 (C, A, B) ranked from highest to lowest. Rainfall type A exhibited the highest central value at 78.54 mm, representing the most substantial rainfall among all types, coupled with a moderate rainstorm intensity with a central I30 value of 6.91 mm/h. Type B showcased a precipitation central value of 3.88 mm and an I30 central value of 2.18 mm/h, characterized by light and minimal rainfall intensity. Type C featured a precipitation central value of 28.19 mm and an I30 central value of 46.56 mm/h, signifying medium-to-heavy precipitation. Within the small watershed, type B occurred most frequently (197 times, constituting 64.59%), characterized by low rainfall and mild intensity. Type C, predominantly featuring moderate to heavy rainfall, occurred 69 times, accounting for 22.63% of the total. Type A was the least frequent, observed 39 times (12.78%), representing relatively strong precipitation with moderate intensity.

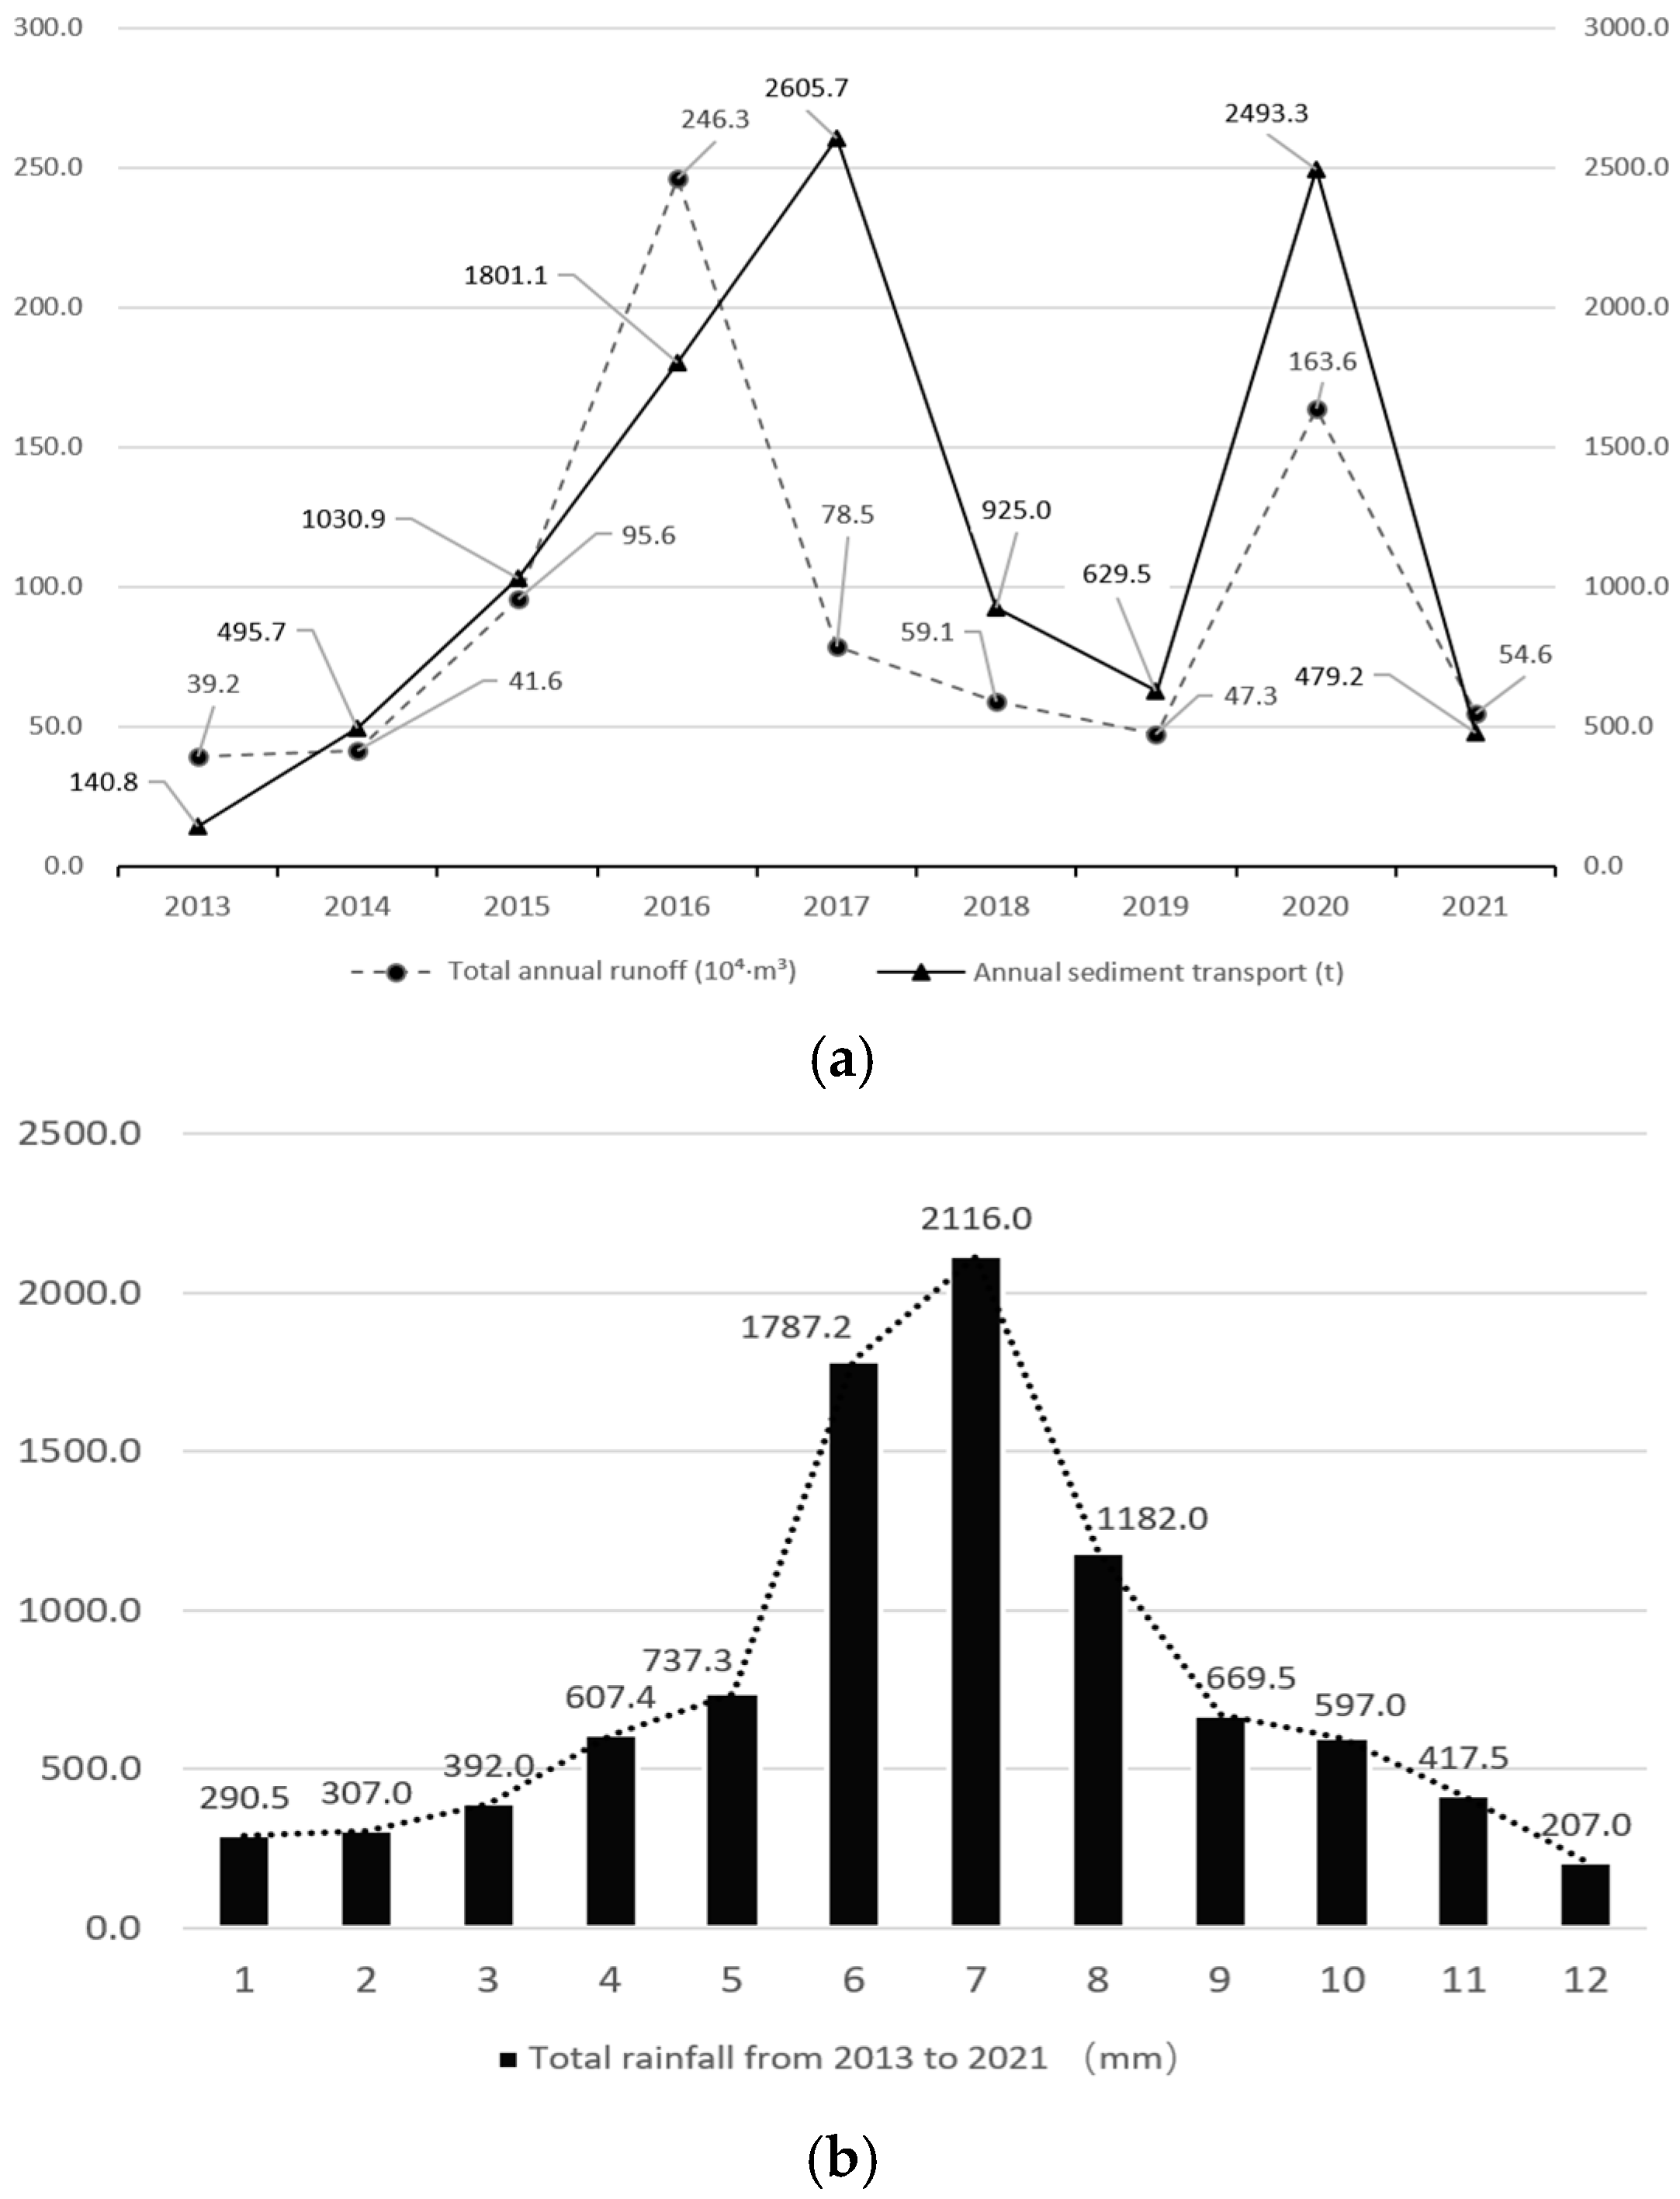
3.2. Variation Characteristics of River Water and Sediment

Soil erosion predominantly arises from intense rainfall [51,52]. Our analysis predominantly focuses on the patterns inherent in erosive rainfall events. Between 2013 and 2021, Nanjing’s Qiaotou small watershed experienced 305 erosional rainfall events, scrutinized across nine variables through descriptive statistics, as presented in Table 3. The recorded minimum rainfall in the Qiaotou small basin registered at 0.5 mm, occurring 13 times in distinct years—specifically, three times in 2013, once in 2015, twice in 2016, and seven times in 2018. Conversely, the maximum rainfall occurred on 4 July 2016, surged to 286 mm, and averaged 30.5 mm. Notably, 108 events surpassed this average, encompassing 35.4% of all recorded rainfall events. I30 ranged from 0.5 mm/h (noted on October 30 2016, with 6.0 mm over 750 min) to 100.7 mm/h (recorded on 15 June 2020, with 146.5 mm over 575 min). Runoff depth spanned between 0.02 and 398.4 mm, with an average of 11.7 mm, breaching 5 mm on 79 occasions, accounting for 25.9% of erosive rainfall events. The variability in runoff coefficients ranged from 0.01 to 6.85, averaging 0.2, with 104 events surpassing 0.1, constituting 34.1% of erosive rainfall occurrences. Sediment concentration oscillated between 0.01 g/L (minimum) and 7.7 g/L (maximum), averaging at 0.4 g/L, with 68 events surpassing this mean, comprising 22.3% of erosive rainfall incidents. The annual average sand modulus stood at 4.78 t/hm2 from 2013 to 2021. Moreover, the sediment yield modulus, averaging 0.1 t/hm2 across the 305 erosive rainfall events, exceeded this average in 54 events, constituting 17.7% of all erosive rainfall occurrences. The highest recorded sediment yield modulus, noted on 7 August 2017, peaked at 5.1 t/hm2.
Table 4 displays the Pearson correlation analysis involving nine variables across 305 rainfall events. At the p < 0.01 significance level, rainfall exhibited significant correlations with rainfall duration, I30, rainfall erosivity, peak discharge, runoff depth, runoff coefficient, sediment content, and sediment yield modulus, which meant that rainfall emerged as a pivotal factor influencing sediment production within the Qiaotou small basin. At the p < 0.01 significance level, I30 exhibited significant correlations with rainfall erosivity, peak discharge, runoff depth, runoff coefficient, sediment concentration, and sediment yield modulus, signifying its substantial impact on sediment yield in this basin. Moreover, rainfall erosivity demonstrated significant correlations (p < 0.01) with peak discharge, runoff depth, runoff coefficient, sediment concentration, and sediment yield modulus. Importantly, the correlation coefficient between rainfall erosivity and peak discharge, as well as runoff coefficient, exceeded 0.5, indicating a significant influence of rainfall erosivity on regional sediment yield [53].
The variability in rainfall and rainfall intensity significantly impacted sediment yield and erosion processes [54,55]. Exploring the relationship among rainfall, I30, sediment concentration, and runoff coefficient during rainfall events enables an analysis of their influence on the Qiaotou small watershed. Illustrated in Figure 3, the maximum runoff coefficient recorded was 1.74, coinciding with a rainfall of 286.0 mm, an I30 of 36.3 mm/h, and a volumetric soil water content of 51.8% (at a soil depth of 30 cm). This signifies that ample rainfall coupled with heightened soil moisture in the initial stages resulted in runoff during heavy precipitation [56,57]. When the maximum sediment concentration hit 7.7 g/L, the associated rainfall measured 43 mm, I30 stood at 42.3 mm/h, and the rainfall duration persisted for 265 min. These conditions suggest that moist soils foster conducive environments for hydraulic erosion activities [58]. Specific thresholds emerge when rainfall is less than 100 mm and I30 is below 35 mm/h, the runoff coefficient remains under 0.5, and sediment concentration stays below 0.6 g/L. When rainfall is in the range of 100 to 150 mm and I30 is in the range of 35 to 40 mm/h, the runoff coefficient varies from 0.5 to 1.1, and sediment concentration ranges between 0.6 and 2.0 g/L. For rainfall spanning 150 to 300 mm and I30 from 40 to 100 mm/h, the runoff coefficient extends from 1.1 to 2.2, accompanied by sediment concentrations ranging between 2 and 4.5 g/L.

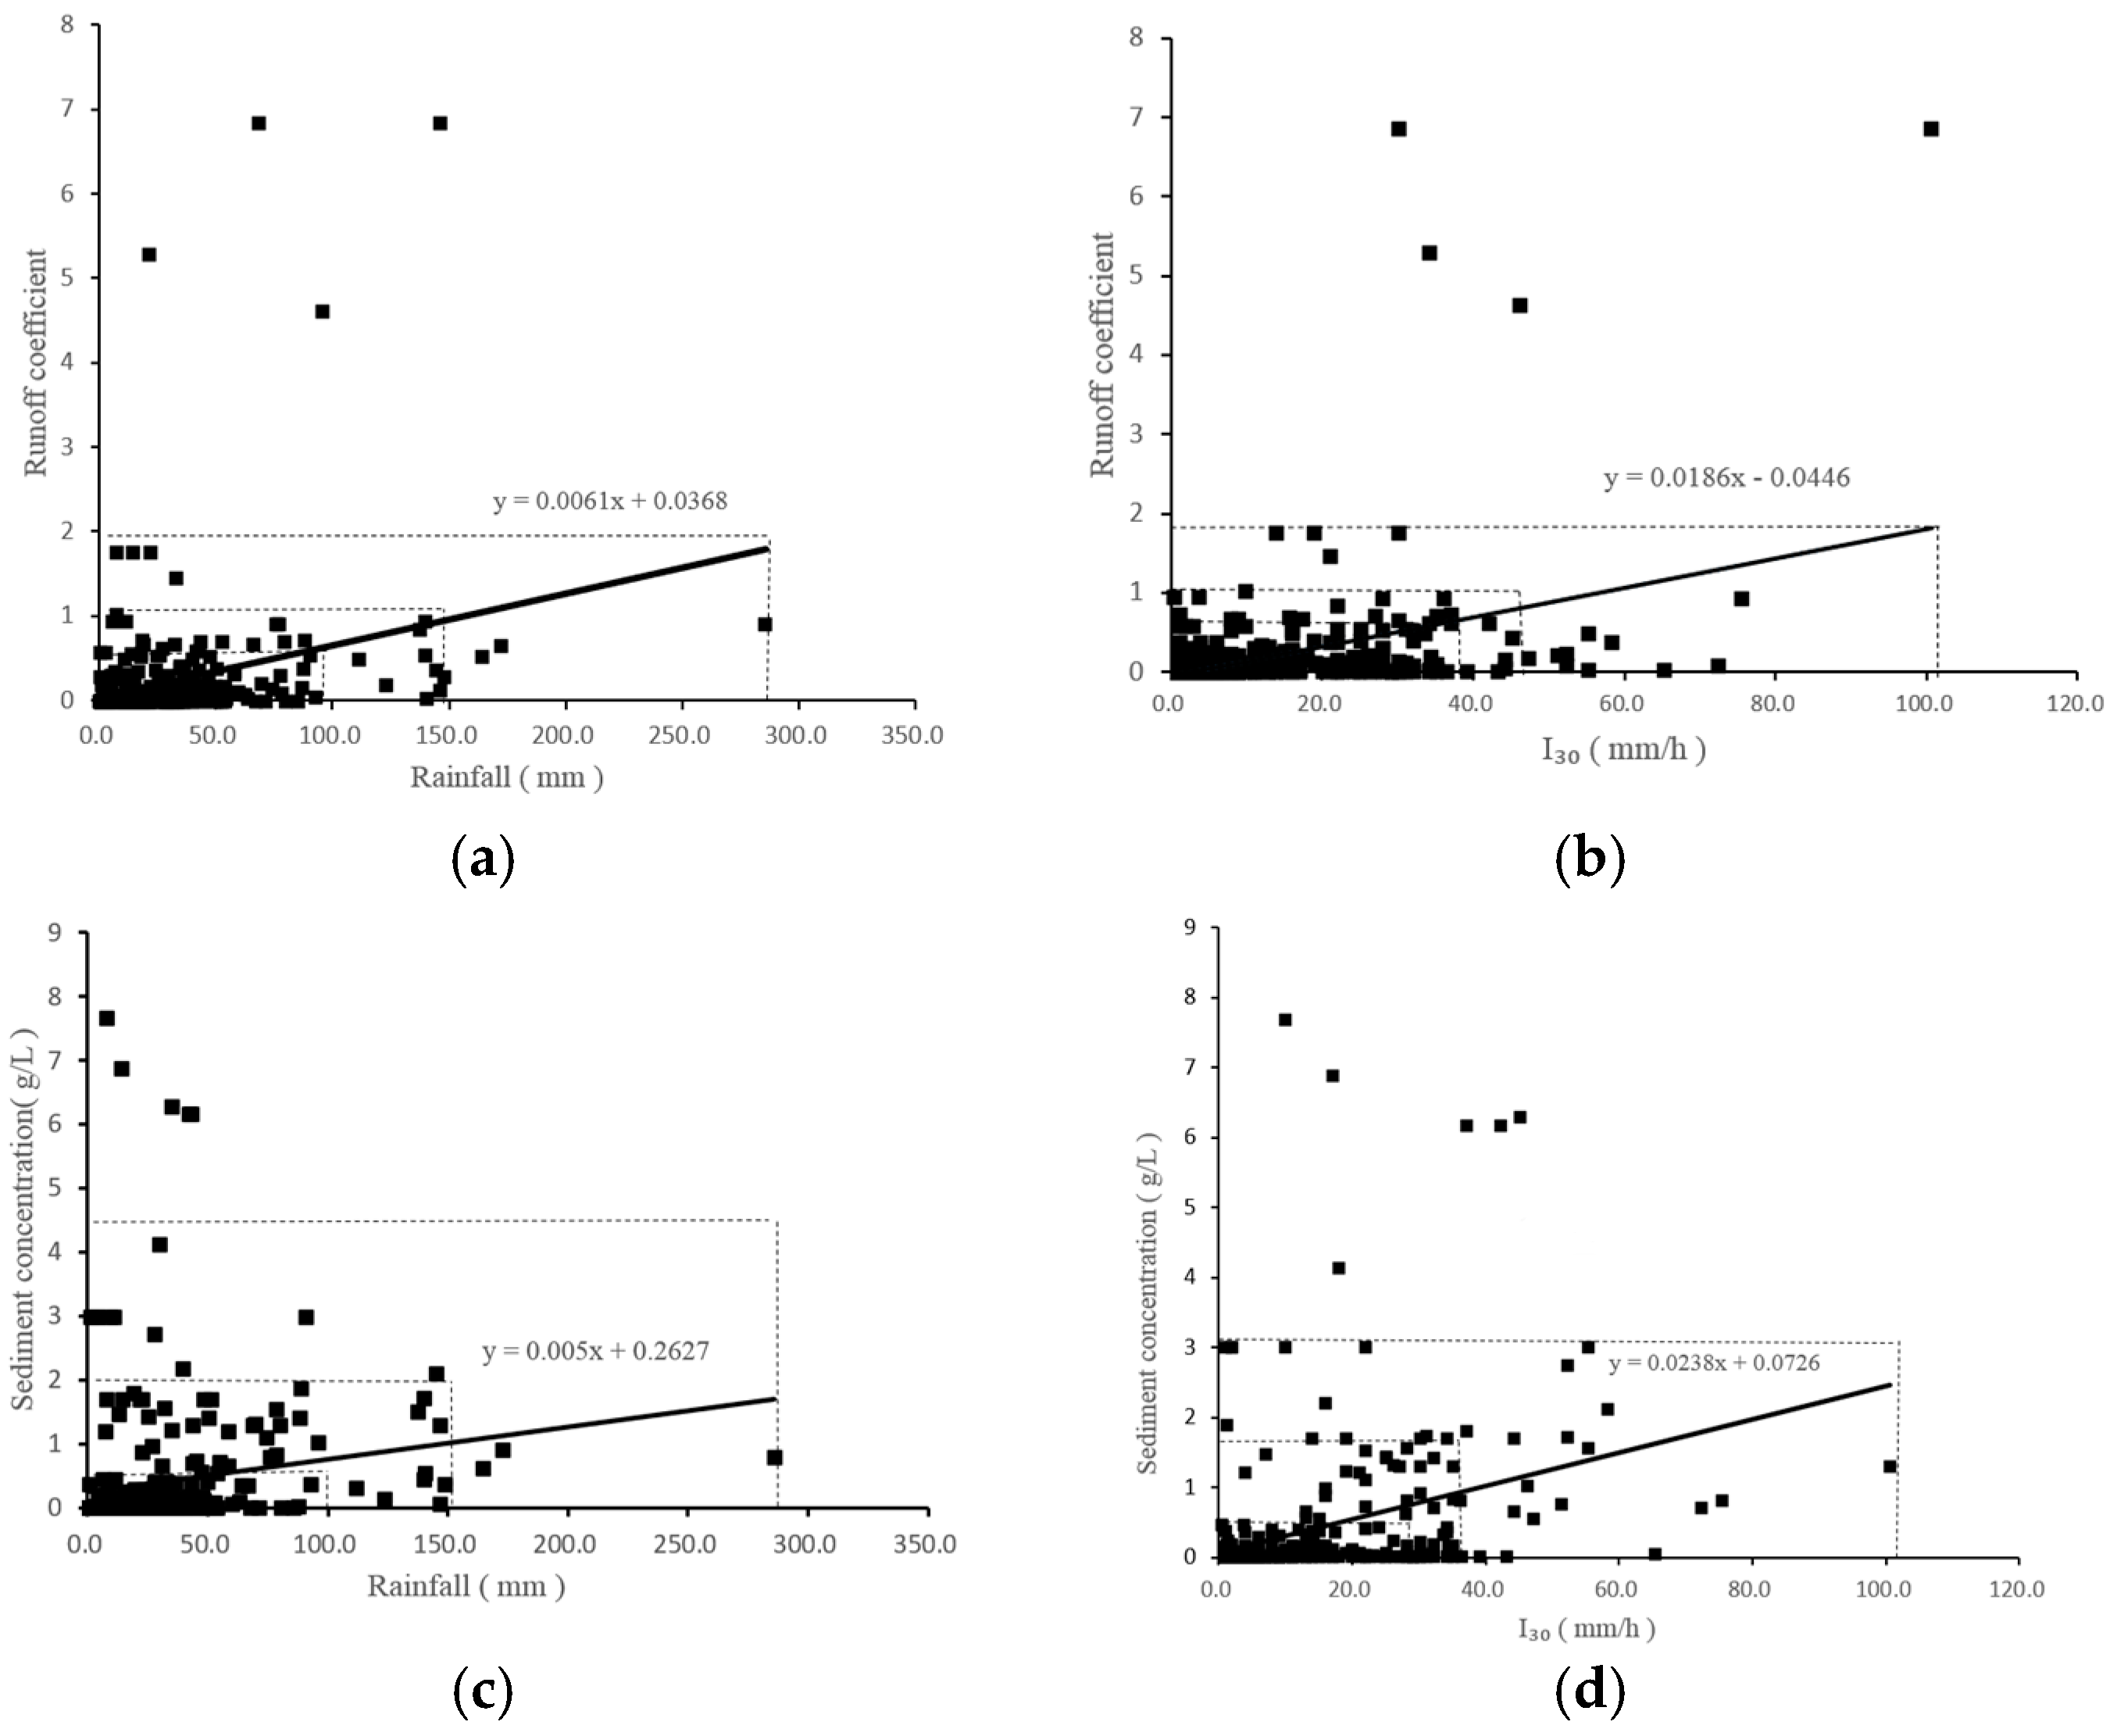
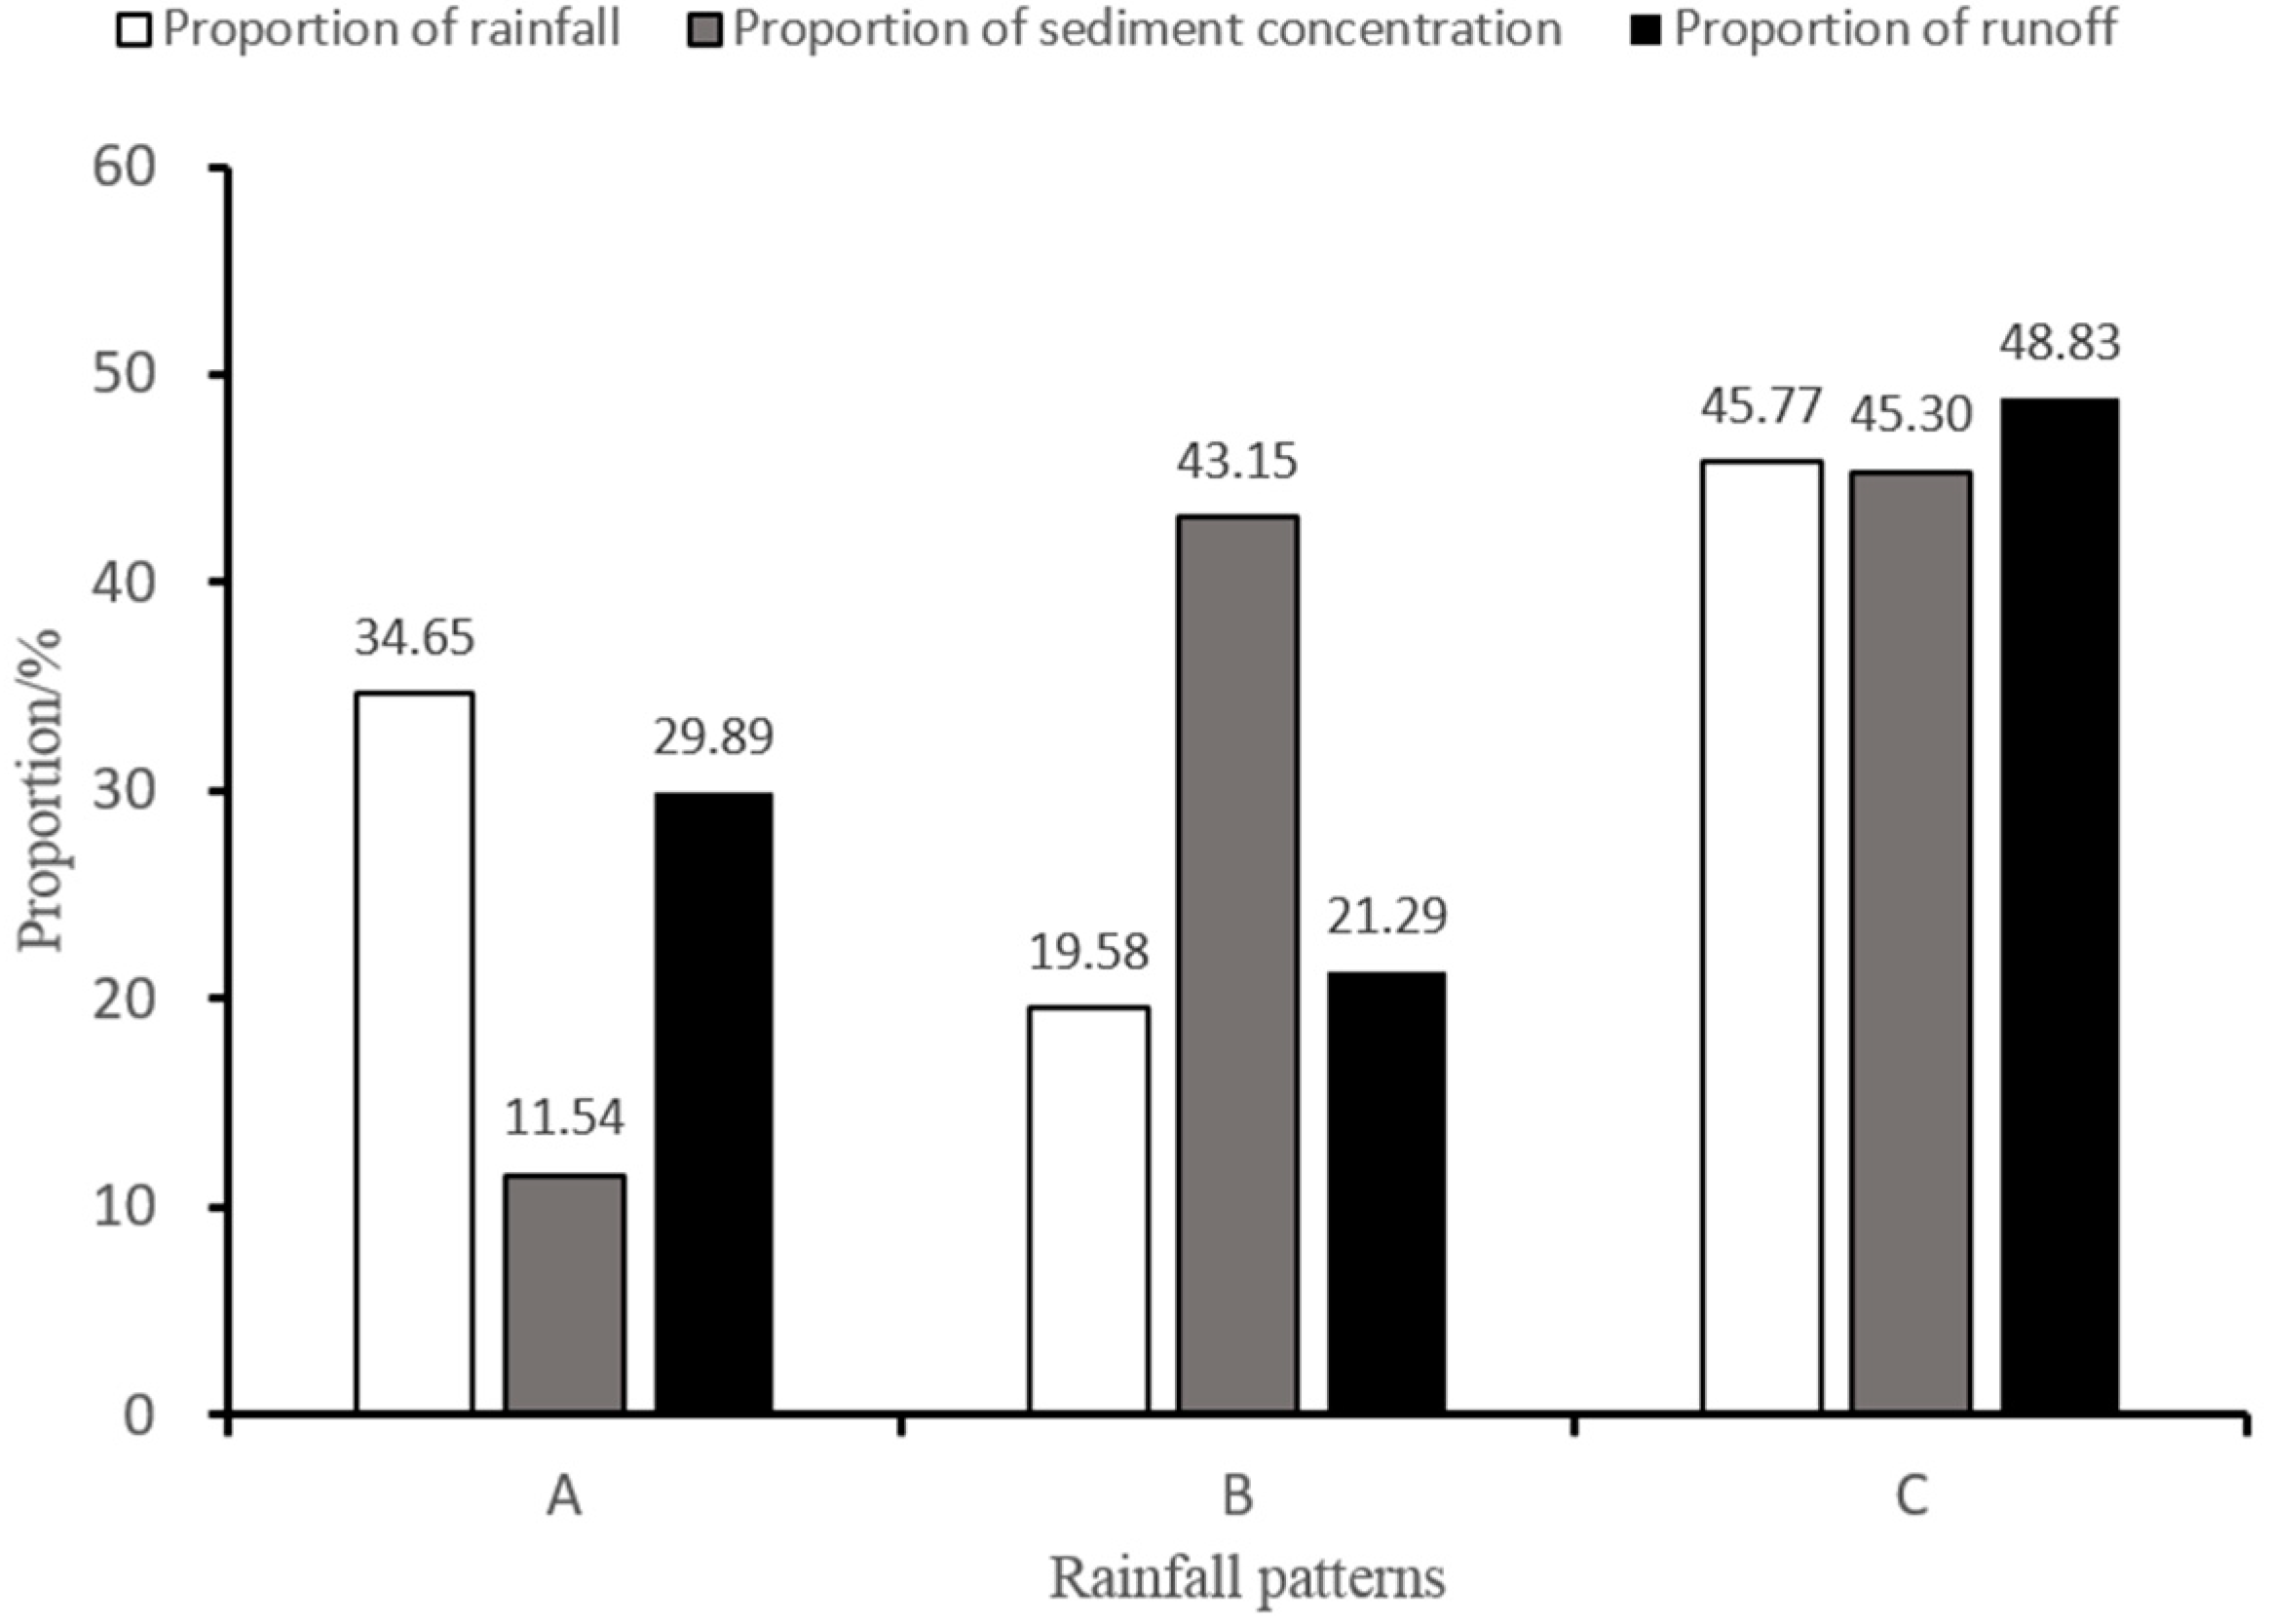
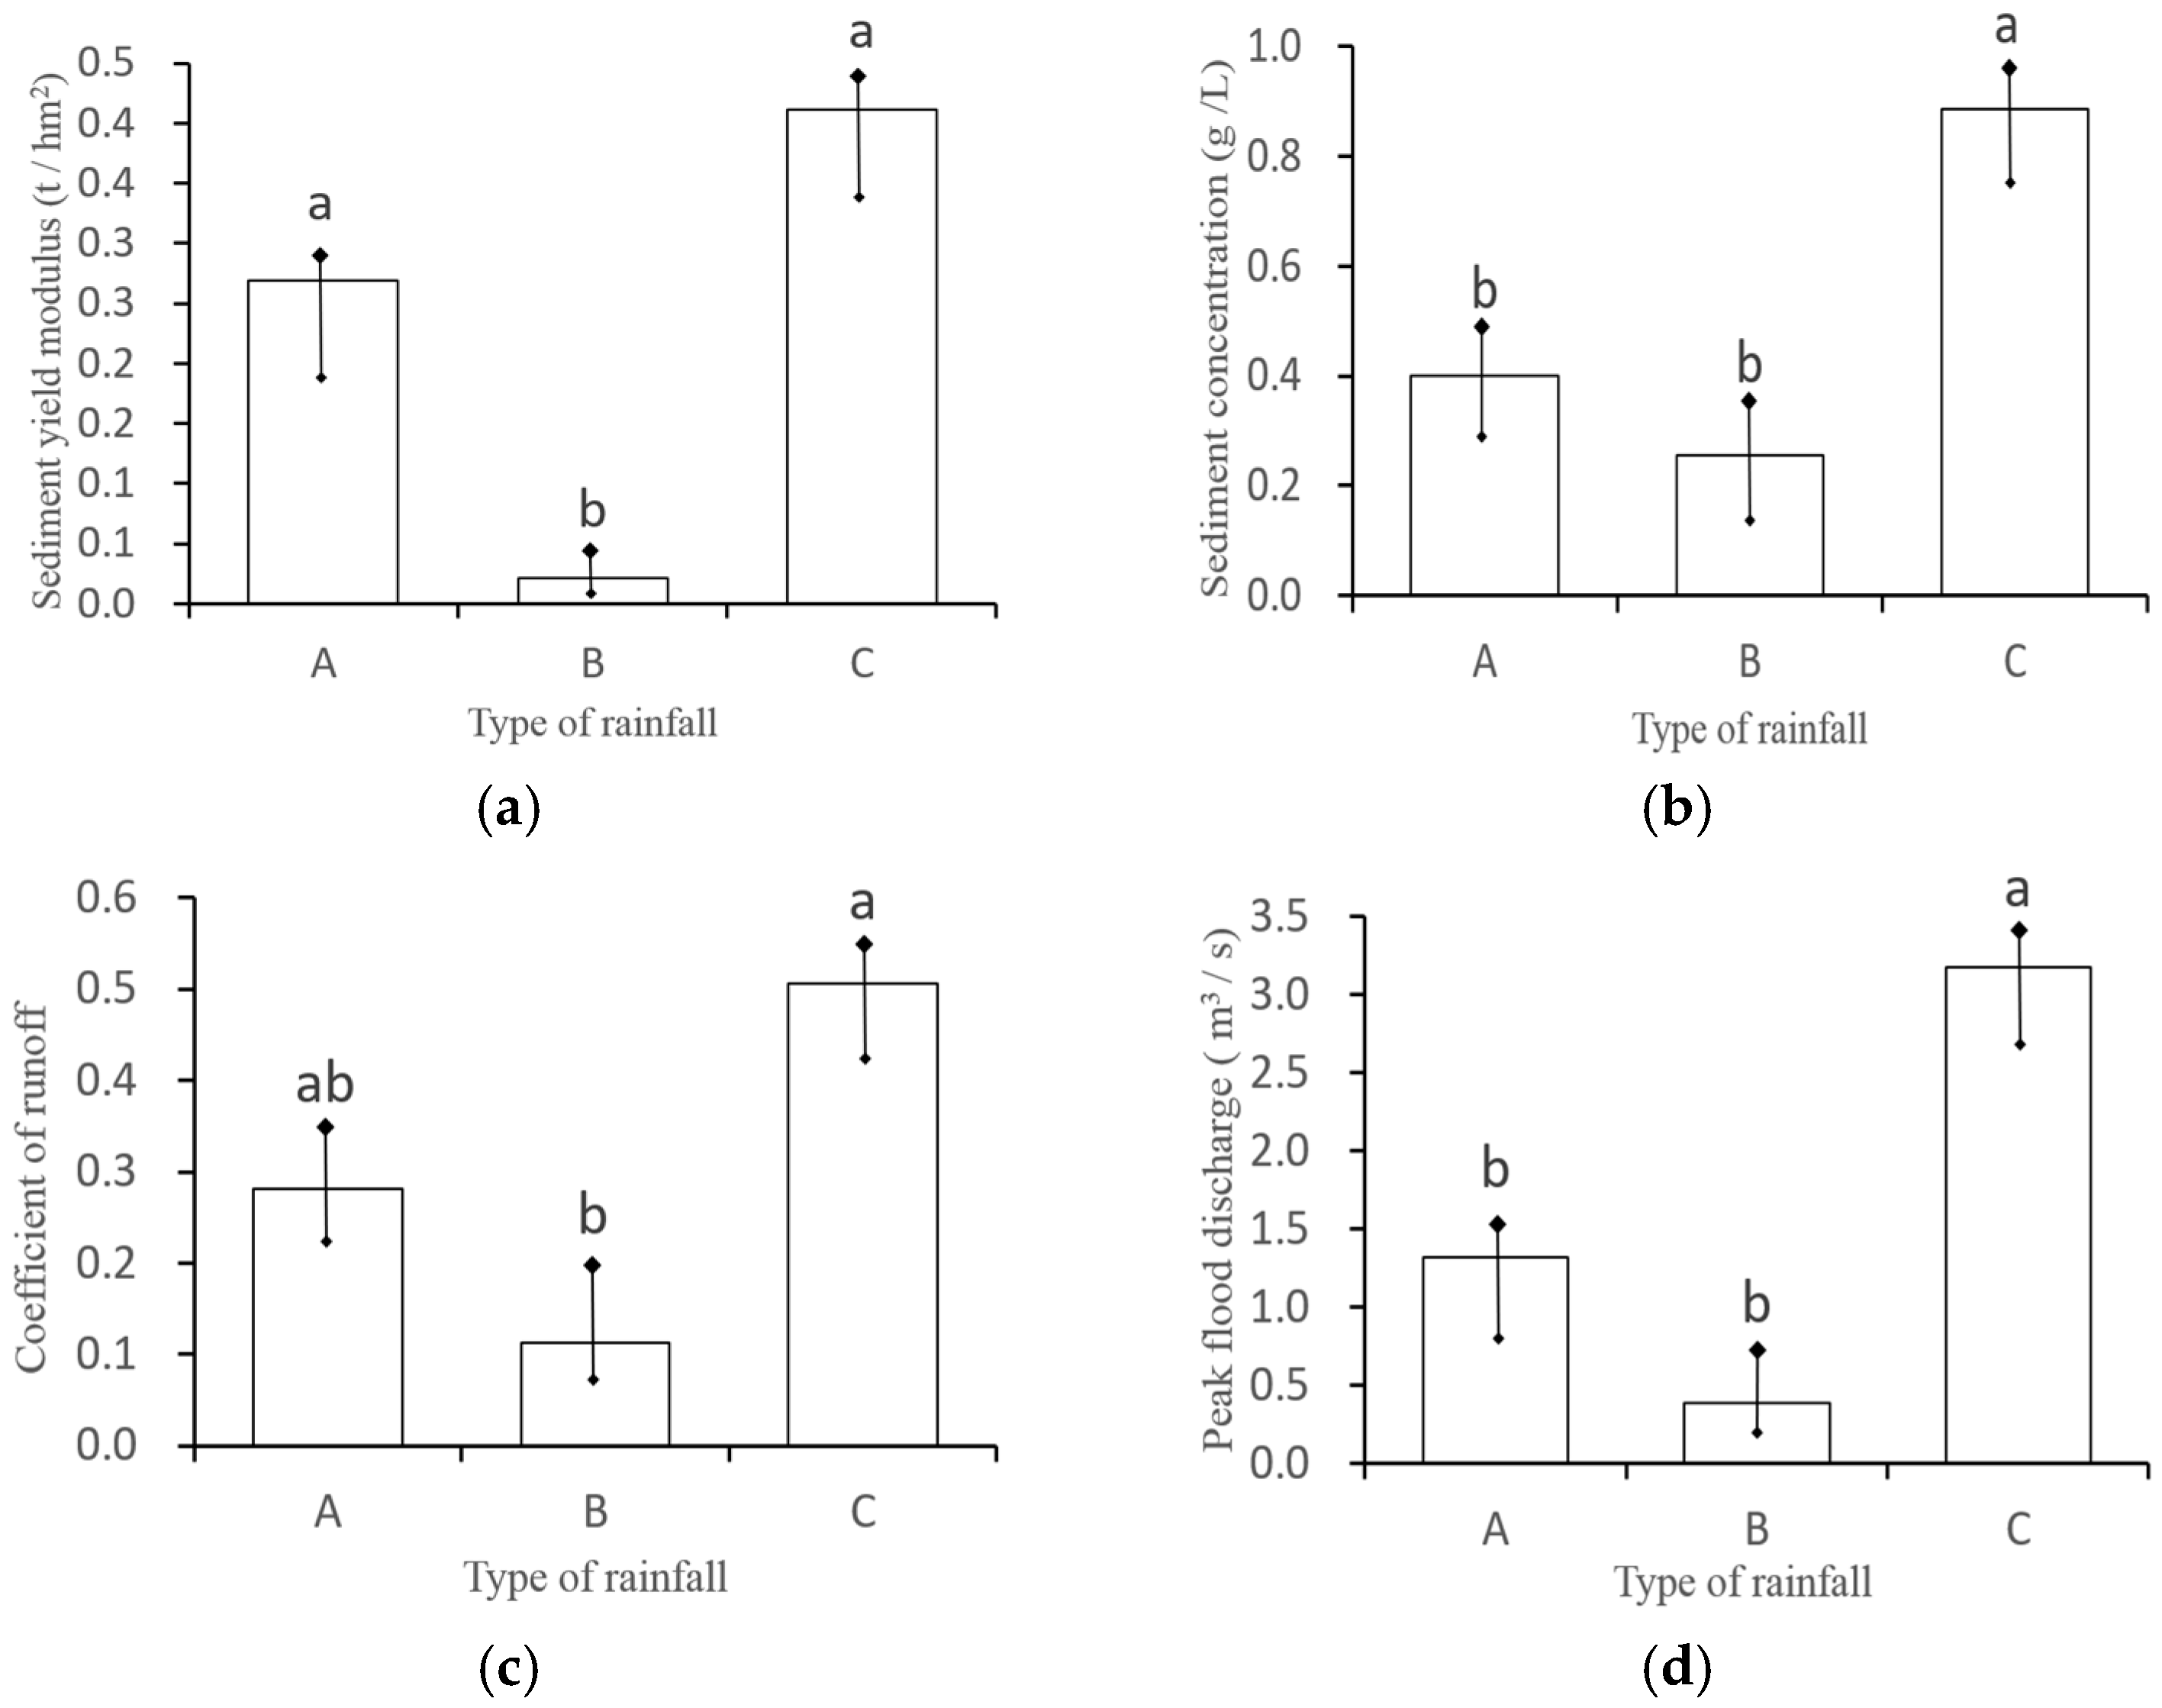
3.3. Impact of Various Rainfall Types on Water and Sediment in the Watershed

The calculation of cumulative rainfall, sediment content, and runoff in the Qiaotou Watershed under three distinct rainfall patterns was performed using SPSS 20.0 software, which is shown in Figure 4. Subsequently, the proportions of these variables in the total amount were determined. The statistical outcomes are visually presented in Figure 3. Among these types, Type C exhibited the highest cumulative values for rainfall (45.77%), sediment concentration (45.30%), and runoff (48.83%). Conversely, Type B showcased a sediment concentration of 43.15% but recorded the lowest cumulative runoff at 21.29%. Rainfall Type A demonstrated the lowest cumulative sediment concentration (11.54%), while its proportions for cumulative rainfall (34.65%) and runoff (29.89%) fell in the medium range.
To discern the runoff and sediment yield patterns across varied rainfall types in the Qiaotou small watershed, the Least Significant Difference (LSD) method was employed to statistically assess the sediment yield modulus, sediment concentration, runoff coefficient, and flood peak discharge. The research findings, illustrated in Figure 5, revealed distinctive trends among the three rainfall types. Specifically, the sediment yield modulus of rain type B exhibited a statistically significant variance compared to types A and C, while the contrast between rain types A and C was found to be insignificant. Notably, rain types A and C showcased higher sediment yield moduli at 0.41 and 0.27 t/hm2, respectively, surpassing the 0.03 t/hm2 observed for rain type B. The sediment concentration across rain types C, A, and B exhibited statistically significant differences, with type C registering the highest concentration at 0.89 g/L, followed by type A at 0.41 g/L and type B at 0.26 g/L. This substantiates the considerable influence of rain type C on the water–sediment relationship within the Qiaotou small watershed, establishing it as the primary contributor to sediment yield. Regarding the runoff coefficient, rain type C significantly differed from rain type B, while no notable contrast was found between rain types A and C. Type C rain exhibited the highest runoff coefficient at 0.51, signifying robust runoff production, followed by type A rain at 0.28 and type B rain at 0.11, indicating relatively weaker runoff production. In terms of peak flow, type C rain demonstrated a significant difference compared to types A and B, while no substantial difference emerged between types A and B. Type C rain recorded the highest peak flow at 3.18 m3/s, followed by type A rain at 1.32 m3/s.
Multiple linear regression analysis was conducted in the study focusing on two pivotal indicators, sediment yield modulus and peak flood discharge. Highly correlated indicators were meticulously chosen for fitting, and the resulting regression outcomes are presented in Table 5. The goodness-of-fit parameters (R2) surpassed 0.80 across the board, signifying a robust model fit and validity. The data variance which reflected the significance of the regression equation, was noted as F > FINV (k, n − k − 1) =1.98, indicating substantial significance of the explanatory variables on the dependent variable. Simultaneously, the significance level of F corresponded to sig. < 0.01 and underscores the value of the regression equation. Precipitation, sediment concentration, and runoff depth exhibited the strongest correlations with sediment yield modulus, showcasing standardized regression coefficients of 0.499, 0.07, and 0.001, respectively. These coefficients delineate the descending order of influence, highlighting sediment concentration, runoff depth, and rainfall impact in that order. In the regression analysis of peak flow, runoff depth, sediment concentration, and I30 emerged with the strongest correlations, bearing standardized regression coefficients of 0.586, 0.028, and 0.01, respectively. This hierarchy underscores the impact order from the highest to the lowest: runoff depth, sediment concentration, and I30.

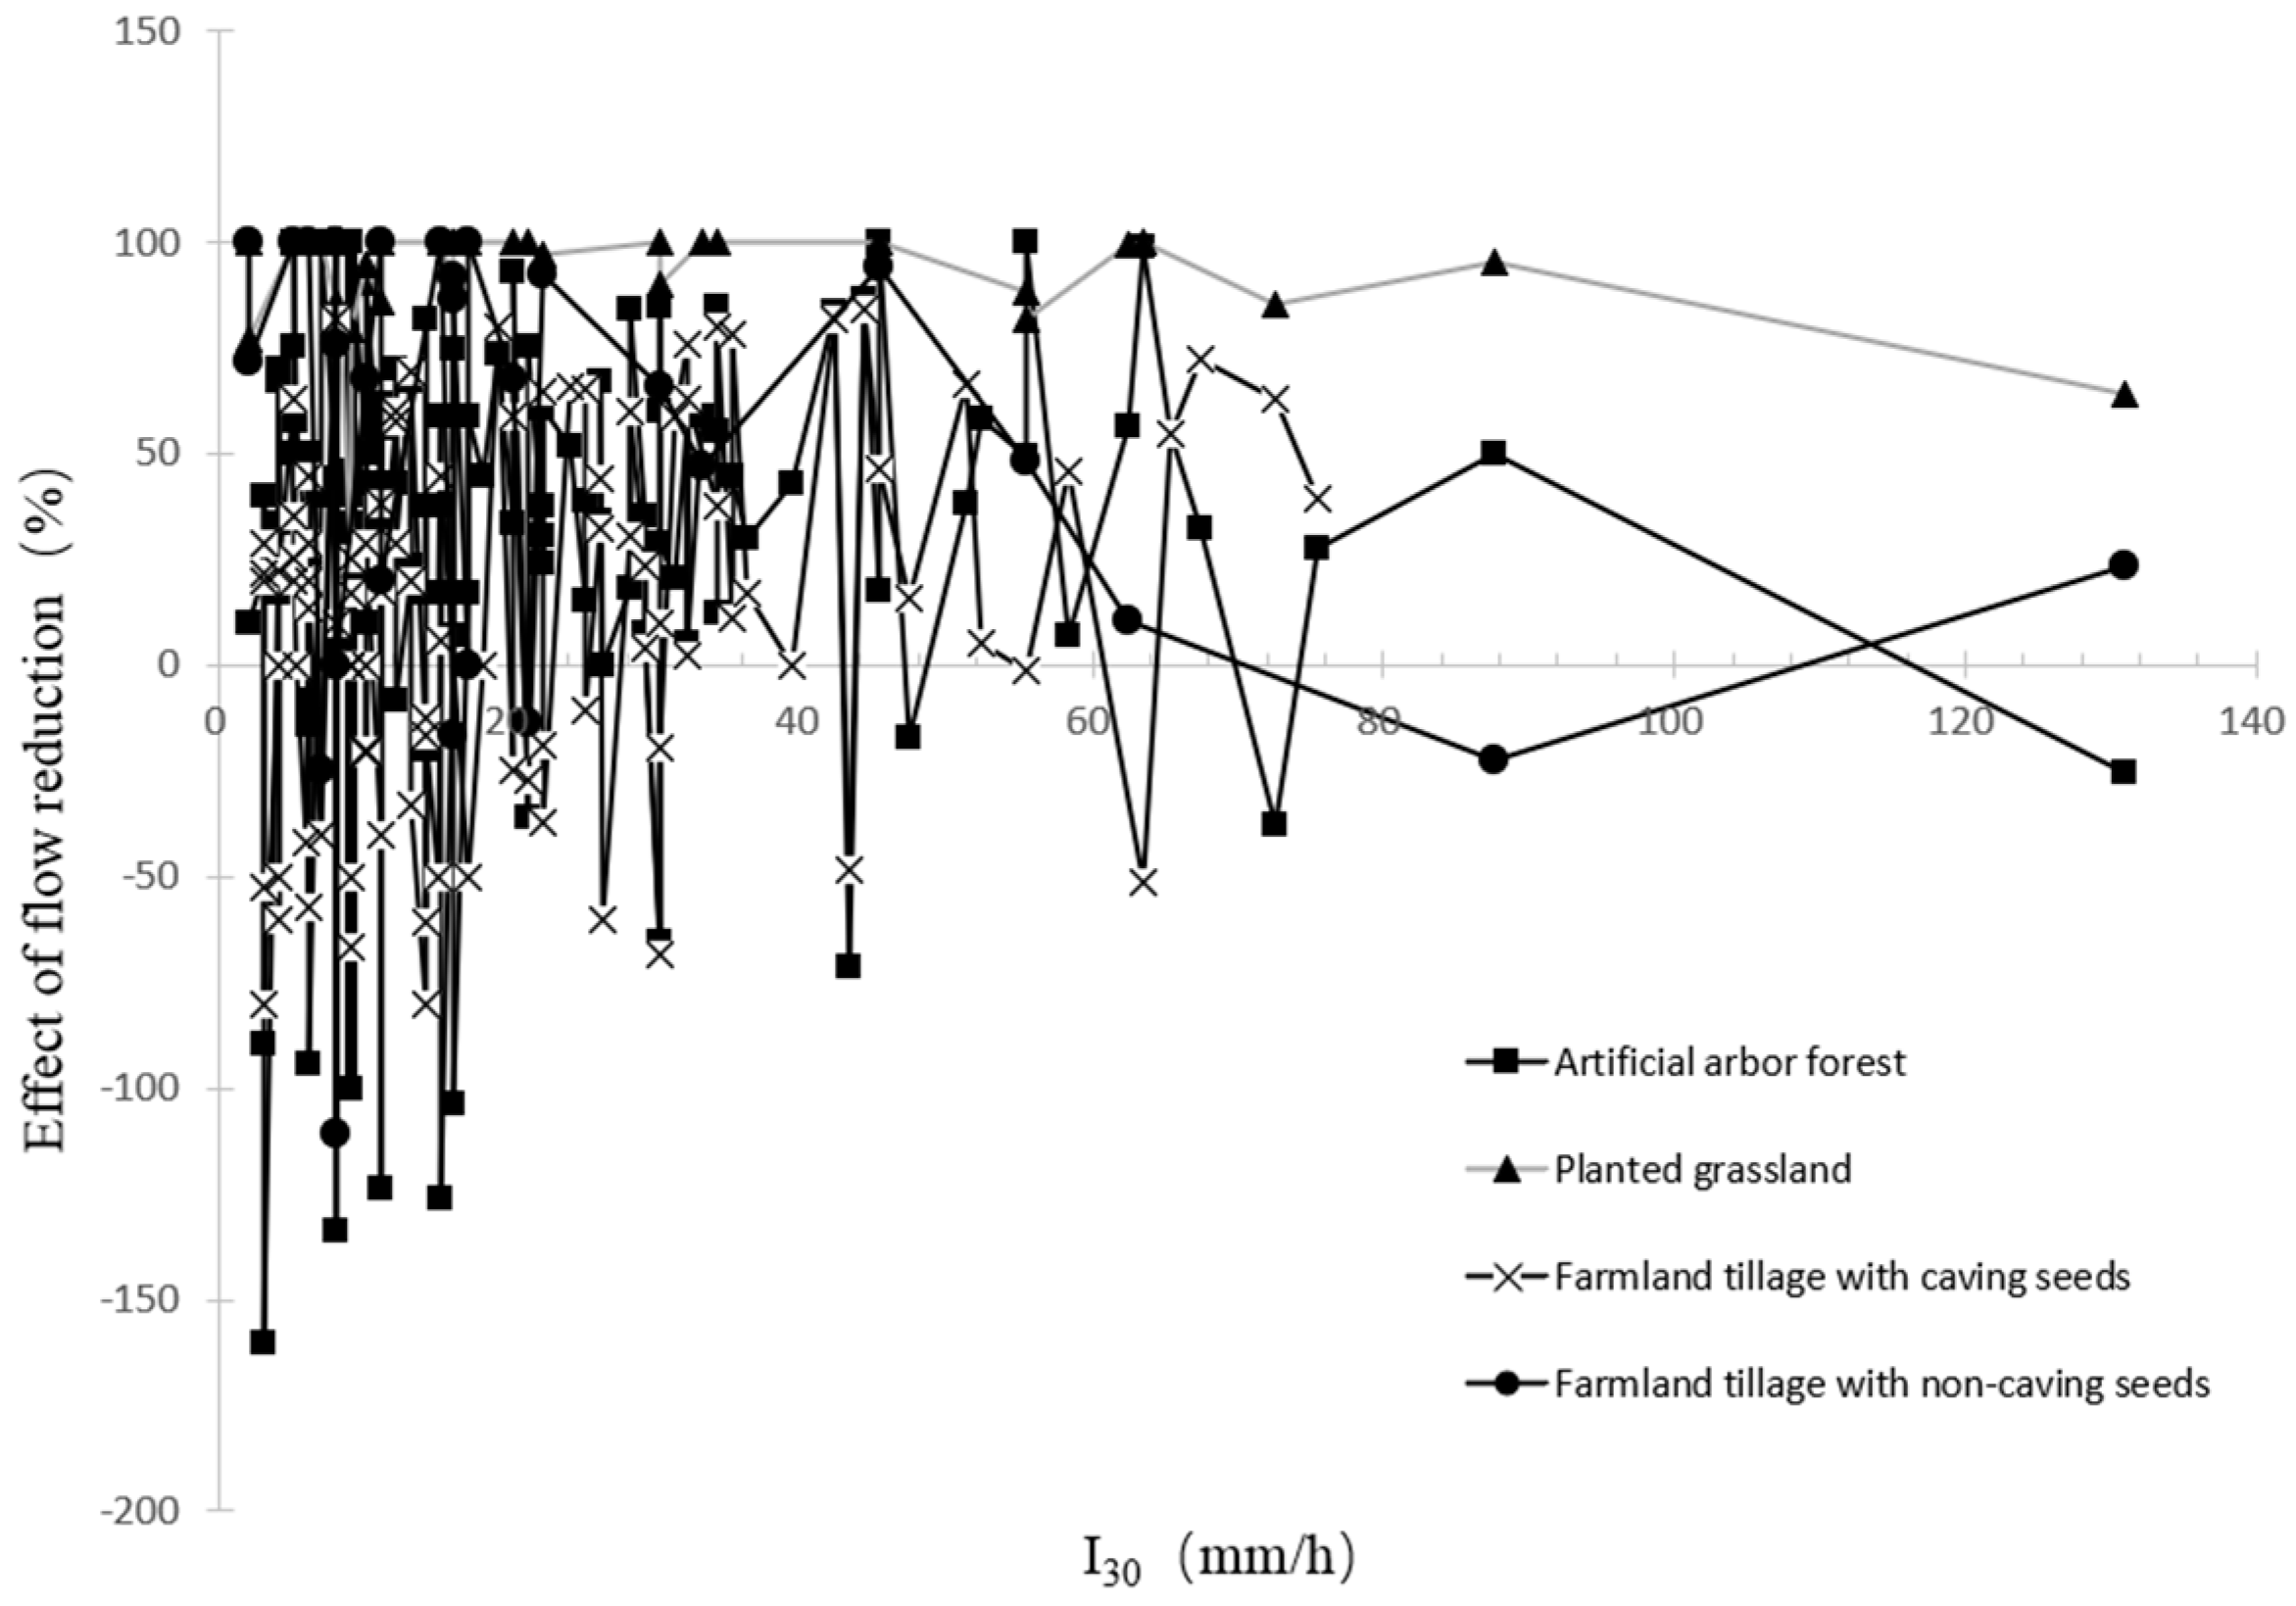
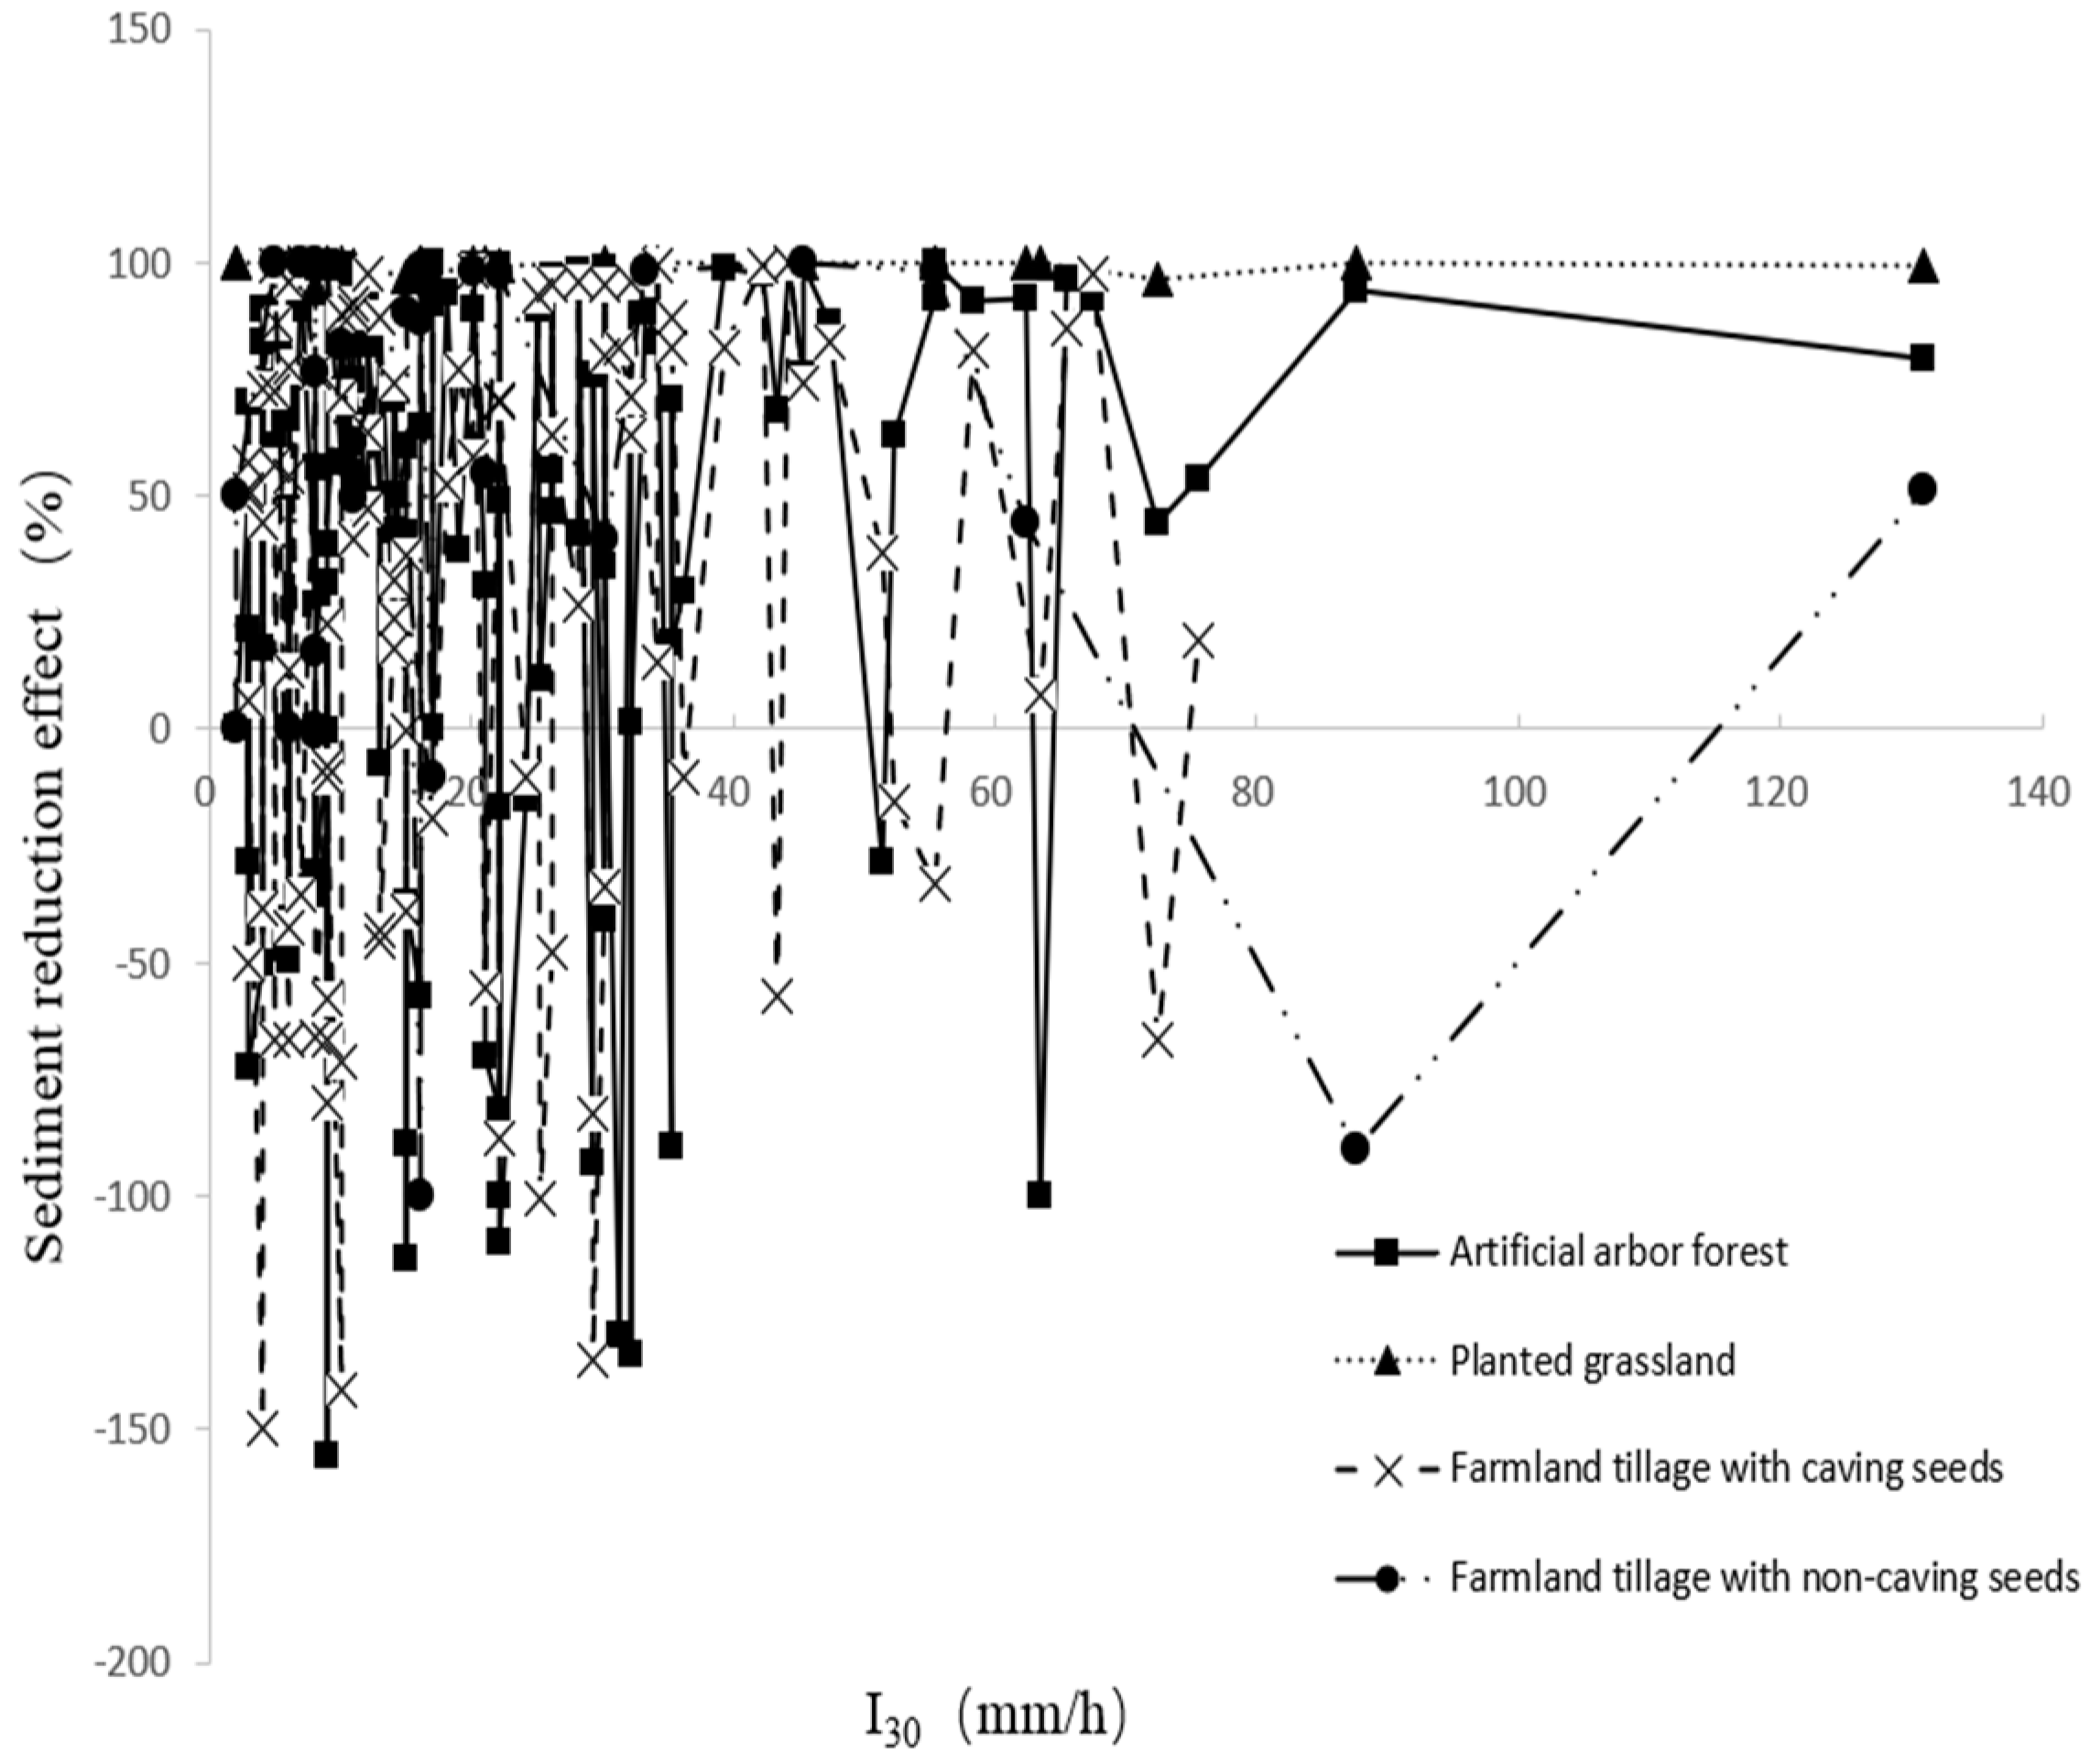
3.4. Impact of Soil and Water Conservation Measures on Rainfall and Sediment Reduction

Soil and water conservation measures play a crucial role in mitigating the impact of raindrops on soil. These measures effectively intercept raindrops, thereby minimizing their direct impact and fostering increased soil infiltration. Consequently, the implementation of these measures contributes to a reduction in slope runoff yield. Concurrently, soil and water conservation measures strategically reduce slope length, diminish runoff kinetic energy, and mitigate runoff transport capacity. As a result, the overall effect is a notable reduction in slope erosion and sediment yield. To empirically assess the impact of soil and water conservation measures, the runoff and sediment generated by individual rainfall events were analyzed in a slope runoff plot equipped with four distinct measures: artificial arbor forest, paved grassland, farmland tillage with hole planting, and farmland tillage without hole planting. The investigation covered the period from 2014 to 2021, allowing for a comprehensive understanding of the efficacy of these measures in reducing both rainfall-induced runoff and sediment yield.
The effectiveness of soil and water conservation measures in mitigating flow and sediment is quantified by the percentage reduction in runoff and sediment yield relative to the control conditions. This reduction is observed after implementing soil and water conservation measures [59]. In the context of slope surface flow during the last rain control, the sediment yield is denoted as H1 (mm) and W1 (t/km2). Subsequently, following the implementation of soil and water conservation measures, the corresponding slope surface flow sediment yield is represented by H2 (mm) and W2 (t/km2). The computation formulae for the reduction in flow ( η H ) and sediment reduction effect ( η W ) are as follows:
η H = H 1 H 2 H 2 × 100 %
η W = W 1 W 2 W 2 × 100 %
Figure 6 illustrates the impact of various land cover strategies on sediment reduction in a slope runoff plot spanning from 2014 to 2021. These strategies encompass artificial arbor forests, planted grasslands, farmland tillage with caving seeds, and non-caving seeds practices. Overall, the reduction effect of different measures was positively correlated with I30, and the fluctuation range showed a decreasing trend with the increase in I30. At I30 levels of 30 mm/h or below, most methods exhibit adverse effects on flow reduction, indicating localized runoff rather than comprehensive slope drainage. Specifically, artificial arbor forests average 29.80%, while planted grasslands excel notably at 92.23%. The flow reduction effect of farmland tillage with seeds ranges from −80.00% to 83.75%, averaging 11.83%, and farmland tillage with non-caving seeds ranges from −110.71% to 100%, averaging 50.75%. Between 30 mm/h and 60 mm/h of I30, only a couple of techniques, mainly artificial arbor forests and farmland tillage with caving seeds, demonstrate negative values. Planted grasslands consistently maintain a high effectiveness of 94.14%. Beyond 60 mm/h of I30, the flow reduction efficacy of artificial arbor forests and farmland tillage with non-caving seeds registers negatively. However, planted grasslands continue to exhibit significant effectiveness at 88.59%.
For I30 values less than or equal to 30 mm/h, the coefficients of variation for the flow reduction effect were as follows: artificial arbor forest (1.97), planted grassland (0.18), farmland tillage with caving seeding (9.37), and farmland tillage with non-caving seeding (1.07). Between 30 mm/h and 60 mm/h, coefficients of variation for the flow reduction effect were observed: artificial arbor forest (1.20), planted grassland (0.08), farmland tillage with caving seeds (1.48), and farmland tillage with non-caving seeds (0.35). As for I30 greater than 60 mm/h, the coefficients of variation were noted: artificial arbor forest (1.41), planted grassland (0.17), farmland tillage with caving seeds (1.41), and farmland tillage with non-caving seeds (0.67).
When considering the variation coefficients within identical intensity ranges, a consistent decline was observed across various land uses: farmland tillage with caving seeds, artificial arbor forest, farmland tillage with non-caving seeds, and planted grassland. Additionally, an overall decrease in the variation coefficients occurred across diverse measures with the escalation of rainfall intensity.
The analysis presented in Figure 7 delineates the impact of various land management practices—artificial arbor forest, planted grassland, farmland tillage with caving seeds, and farmland tillage with non-caving seeds—observed between 2014 and 2021 in slope runoff plots. A discernible trend emerged: as rainfall intensity (I30) increases, the overall sediment reduction effect of these measures rises while the variability decreases. When I30 remained at or below 30 mm/h, all measures demonstrated negative sediment reduction effects. Specifically, the artificial arbor forest varied between −155.46% and 100.00%, averaging 36.39%, whereas planted grassland ranged from 84.80% to 100%, with an average of 98.70%. Farmland tillage with caving seeds spanned from −150.00% to 99.59%, averaging 4.53%, and non-caving seeds ranged from −90.00% to 99.80%, averaging 54.80%. Within the 30 mm/h to 60 mm/h I30 range, only the artificial arbor forest and farmland tillage with caving seeds displayed negative effects, while other measures indicated positive trends. Specifically, the sediment reduction effect of the artificial arbor forest ranged from −134.07% to 100% with an average of 39.99%, and that of planted grassland from 95.00% to 100.00% with an average of 94.14%. Farmland tillage with caving seeds ranged from −57.14% to 99.70%, averaging 29.03%, and non-caving seeds from 40.96% to 99.80%, with an average of 84.31%. Beyond an I30 exceeding 60 mm/h, only the sediment reduction effect of planted grassland stayed positive. The impact of the artificial arbor forest ranged from −100% to 96.30%, with an average of 56.43%, and that of planted grassland ranged from 96.67% to 100.00%, averaging 99.27%. Farmland tillage with caving seeds ranged from −66.67% to 97.40%, averaging 35.49%, and non-caving seeds from −90.05% to 51.02%, averaging 1.68%. During low-intensity rain, certain slopes experience local runoff rather than complete drainage. Additionally, farmland tillage practices, irrespective of cave planting, facilitate controlled flow along slopes, furrows, and ridges. Conversely, early rainfall in artificial arbor forests can heighten soil erosion, leading to adverse sediment reduction effects. The adoption of planted grasslands has proven effective for water and soil conservation.
When I30 was 30 mm/h or lower, the coefficient of variation for the sediment reduction effect among various elements—artificial arbor forest, planted grassland, farmland tillage with caving seeds, and farmland tillage with non-caving seeds—was 1.71, 0.02, 1.09, and 1.01, respectively. In the same rain intensity range, the coefficient of variation of the sediment reduction effect of artificial arbor forest, farmland tillage with caving seeds, farmland tillage with non-caving seeds, and planted grassland gradually decreased, and the coefficient of variation of the sediment reduction effect of planted grassland was the smallest, which suggests that the measures of planting grassland can effectively conserve water and soil [60]. With the increase in rainfall intensity, the variation coefficient of the sediment reduction effect of different measures decreased. For I30 values ranging between 30 mm/h and 60 mm/h, the coefficient of variation changed to 1.80, 0.02, 0.95, and 0.34 for the same measures. When I30 exceeded 60 mm/h, the coefficient of variation shifted, resulting in values of 1.17, 0.01, 2.33, and 4.76 for the same measures.
Among consistent rainfall intensities, there was a gradual reduction in the coefficient of variation for sediment reduction effects across artificial arbor forest, farmland tillage with and without caving seeds, and planted grassland. Remarkably, the smallest coefficient of variation for sediment reduction effects was observed in planted grassland. With increased rainfall intensity, the variation coefficient consistently diminished for sediment reduction effects across the different measures.

4. Discussion

4.1. Key Findings and Reflections

Our comprehensive investigation into the Qiaotou small watershed has provided crucial insights into the impact of diverse rainfall patterns on soil and water loss. Analyzing 305 regional precipitation events revealed that characteristics such as I30, rainfall erosivity, and other indicators significantly affect sediment and flow yield, with statistical significance at p < 0.01. Key observations include rainfall amounts below 100 mm, I30 values under 35 mm/h, runoff coefficients less than 0.5, and sediment concentrations below 0.6 g/L. In categorizing regional rainfall into three types—Type A (heavy rainfall with moderate intensity), Type B (light rainfall with light intensity), and Type C (medium rainfall with heavy intensity)—we found Type B to be the most prevalent. However, Type C exhibited the most substantial cumulative impact on rainfall, sediment concentration, and runoff, emphasizing the intricate relationship between varied rainfall patterns and soil erosion processes.
Our innovative approach involved leveraging long-term field data from the red-soil region to analyze these rainfall patterns and their effects. We identified Type C rain, characterized by short duration, low volume, but high intensity, as the primary erosive force in this region. This insight clarified the influence of different soil and water conservation measures under varied rainfall scenarios, leading to the identification of the most effective strategies for reducing flow, sediment, and peak runoff. The development and application of a multiple regression equation for the sediment yield model and peak flood discharge yielded significant outcomes. The model exhibited an effective fit with an R2 value exceeding 0.80, affirming its suitability for quantitatively assessing relevant hydrological indicators.
Lastly, our findings elucidate the intricate relationship between the effectiveness of diverse rainfall mitigation measures on runoff and sediment and the I30 index. This effectiveness generally exhibits a positive correlation with I30, although the variability diminishes at higher I30 values. Notably, when I30 conditions are below 30 mm/h, these measures tend to detrimentally impact runoff and sediment reduction. Conversely, for I30 ranging between 30 and 60 mm/h, certain practices such as artificial arbor forests and cropland tillage with hole planting yield unfavorable outcomes, while others prove advantageous. Importantly, at I30 levels exceeding 60 mm/h, practices such as grassland planting stand out for their positive influence, ensuring the most effective reduction in runoff and sediment.

4.2. Implications for Practice

The present study bears practical significance in advancing soil and water conservation strategies, especially in small watersheds within red soil areas. The categorization of rainfall patterns, coupled with an understanding of their distinct impacts on runoff and sediment yield, establishes a solid groundwork for targeted conservation approaches. Land managers and policymakers can employ this knowledge to tailor interventions effectively.
In particular, the findings highlight the importance of recognizing the erosive potential linked with Type C rainfall. This awareness facilitates the prioritization of mitigation measures, fostering a proactive approach to address potential soil and water losses in vulnerable regions.
Furthermore, the present study underscores the necessity of implementing site-specific soil and water conservation measures based on rainfall intensity. The observed adverse effects under lower I30 conditions (<30 mm/h) underscore the need for refined management approaches that accommodate variations in rainfall intensity. This nuanced understanding is pivotal for optimizing conservation efforts and mitigating erosion risks across diverse hydrological conditions.

4.3. Limitations and Future Prospects

While our research offers valuable insights, it also reveals areas needing further exploration. One limitation is the need for a deeper investigation into the relationship between runoff yield and sediment yield processes under varying rainfall patterns. Implementing automatic sediment monitoring on slope runoff plots could facilitate more detailed sediment production studies during rainfall events.
Additionally, the impact of slope surface microtopography evolution on runoff, sediment, and erosion resistance indexes warrants further study. Regular monitoring and soil sample testing could elucidate the effects of different conservation measures on these factors, enhancing our understanding of their influence on annual runoff and sediment dynamics.

5. Conclusions

The present study collected continuous rainfall and sediment data spanning from 2013 to 2021, analyzed rainfall types using the K-means clustering method, and formulated a multiple linear regression equation through LSD. In addition, we analyzed the effects of soil and water conservation measures on rainfall flow and sediment reduction in a slope runoff plot covered by four measures: artificial arbor forests, planted grasslands, farmland tillage with caving seeds, and non-caving seeds practices. The key findings are as follows. In the Qiaotou small watershed, the rainfall characteristics, including intensity (I30), rainfall erosivity, and other indicators, significantly affect sediment and flow yield with a strong statistical significance (p < 0.01). Analysis of 305 precipitation events revealed that most events featured rainfall less than 100 mm, I30 less than 35 mm/h, a runoff coefficient below 0.5, and sediment concentration under 0.6 g/L. We classified regional rainfall into three categories: heavy rainfall with moderate intensity (Type A), light rainfall with light intensity (Type B), and medium rainfall with heavy intensity (Type C). Type B was the most frequent, constituting 64.59% of events, but Type C contributed the highest to cumulative rainfall, sediment concentration, and runoff. The multiple regression models developed for sediment yield modulus and peak flow exhibited a high predictive capacity (R2 > 0.80) and passed significance tests, offering a robust tool for quantifying these hydrological parameters. The study further established that sediment yield modulus is predominantly influenced by sediment concentration, runoff depth, and rainfall, while peak flood discharge is closely associated with runoff depth, sediment concentration, and I30. Lastly, the study highlighted that the effectiveness of various runoff and sediment reduction measures was closely linked with I30, showing varying degrees of effectiveness based on the intensity range, with notable negative effects at I30 less than 30 mm/h and positive impacts at higher intensities. In conclusion, the present study opened avenues for further research and underscores the importance of adapting conservation strategies to the specific rainfall patterns prevalent in red-soil regions, offering practical guidance for sustainable land and water management practices.

Author Contributions

Y.Z.: methodology, formal analysis, validation, writing—original draft, writing—review and editing. G.S.: conceptualization, writing—review and editing. Y.J.: conceptualization, supervision. All authors have read and agreed to the published version of the manuscript.

Funding

This research received no external funding.

Data Availability Statement

The datasets used and/or analyzed during the current study are available from the corresponding author on reasonable request.

Conflicts of Interest

The authors declare no conflicts of interest.

References

  1. Wang, L.H.; Li, Y.C.; Gan, Y.S.; Zhao, L.; Qin, W.; Ding, L. Rainfall erosivity index for monitoring global soil erosion. Catena 2024, 234, 273–281. [Google Scholar] [CrossRef]
  2. Chen, H.; Zhang, X.; Abla, M.; Lü, D.; Yan, R.; Ren, Q.; Ren, Z.; Yang, Y.; Zhao, W.; Lin, P.; et al. Effects of vegetation and rainfall types on surface runoff and soil erosion on steep slopes on the Loess Plateau, China. Catena 2018, 170, 141–149. [Google Scholar] [CrossRef]
  3. Zhao, L.; Fang, Q.; Hou, R.; Wu, F. Effect of rainfall intensity and duration on soil erosion on slopes with different microrelief patterns. Geoderma 2021, 396, 115085. [Google Scholar] [CrossRef]
  4. Piacentini, T.; Galli, A.; Marsala, V.; Miccadei, E. Analysis of soil erosion induced by heavy rainfall: A case study from the NE Abruzzo Hills Area in Central Italy. Water 2018, 10, 1314. [Google Scholar] [CrossRef]
  5. Ghosh, S.; Guchhait, S.K.; Illahi, R.A.; Bera, S.; Roy, S. Geomorphic character and dynamics of gully morphology, erosion and management in laterite Terrain: Few observations from Dwarka–Brahmani Interfluve, Eastern India. Geol. Ecol. Landsc. 2022, 6, 188–216. [Google Scholar] [CrossRef]
  6. Li, Y.; Shen, M.; Sun, R.; Hu, Y.; Zhao, J.C.; Tang, P.; Zhang, J. Rill Erosion Processes and Morphological Characteristics: Simulated Scouring Experiments of Exposed Slope in Loess Region. Available at SSRN 4635071. Available online: https://papers.ssrn.com/sol3/papers.cfm?abstract_id=4635071 (accessed on 16 December 2023).
  7. Ghosh, S.; Roy, S. Morphological Dynamics, Erosion Potential and Morphogenesis of Badlands in Laterites of the Bengal Basin, India. In Drainage Basin Dynamics: An Introduction to Morphology, Landscape and Modelling; Springer Nature: Delhi, India, 2022; pp. 11–62. [Google Scholar]
  8. Alavinia, M.; Saleh, F.N.; Asadi, H. Effects of rainfall patterns on runoff and rainfall-induced erosion. Int. J. Sediment Res. 2019, 34, 270–278. [Google Scholar] [CrossRef]
  9. Pei, Y.; Yuan, X.; Wei, Z.; Yang, Z.; Xu, C.; Chen, S. The subtropical forest soil organic carbon under different forest management pattern loss difference. J. Subtrop. Resour. Environ. 2023, 18, 33–40. [Google Scholar] [CrossRef]
  10. Ziadat, F.M.; Taimeh, A.Y. Effect of rainfall intensity, slope, land use and antecedent soil moisture on soil erosion in an arid environment. Land Degrad. Dev. 2013, 24, 582–590. [Google Scholar] [CrossRef]
  11. Yue, L.; Juying, J.; Bingzhe, T.; Binting, C.; Hang, L. Response of runoff and soil erosion to erosive rainstorm events and vegetation restoration on abandoned slope farmland in the Loess Plateau region, China. J. Hydrol. 2020, 584, 124694. [Google Scholar] [CrossRef]
  12. Zhao, B.; Zhang, L.; Xia, Z.; Xu, W.; Xia, L.; Liang, Y.; Xia, D. Effects of rainfall intensity and vegetation cover on erosion characteristics of a soil containing rock fragments slope. Adv. Civ. Eng. 2019, 2019, 7043428. [Google Scholar] [CrossRef]
  13. Wolka, K.; Birhanu, B.; Vegard, M.; Jan, M. Soil and water conservation management on hill slopes in Southwest Ethiopia. I. Effects of soil bunds on surface runoff, erosion and loss of nutrients. Sci. Total Environ. 2021, 757, 142877. [Google Scholar] [CrossRef] [PubMed]
  14. Yin, S.; Nearing, M.A.; Borrelli, P.; Xue, X. Rainfall erosivity: An overview of methodologies and applications. Vadose Zone J. 2017, 16, 1–16. [Google Scholar] [CrossRef]
  15. Ma, X.; He, Y.; Xu, J.; van Noordwijk, M.; Lu, X. Spatial and temporal variation in rainfall erosivity in a Himalayan watershed. CATENA 2014, 121, 248–259. [Google Scholar] [CrossRef]
  16. Beguería, S.; Serrano-Notivoli, R.; Tomas-Burguera, M. Computation of rainfall erosivity from daily precipitation amounts. Sci. Total. Environ. 2018, 637–638, 359–373. [Google Scholar] [CrossRef]
  17. Yin, S.; Xie, Y.; Liu, B.; Nearing, M.A. Rainfall erosivity estimation based on rainfall data collected over a range of temporal resolutions. Hydrol. Earth Syst. Sci. 2015, 19, 4113–4126. [Google Scholar] [CrossRef]
  18. Nearing, M.A.; Yin, S.-Q.; Borrelli, P.; Polyakov, V.O. Rainfall erosivity: An historical review. CATENA 2017, 157, 357–362. [Google Scholar] [CrossRef]
  19. Xie, Y.; Yin, S.-Q.; Liu, B.-Y.; Nearing, M.A.; Zhao, Y. Models for estimating daily rainfall erosivity in China. J. Hydrol. 2016, 535, 547–558. [Google Scholar] [CrossRef]
  20. Jun, W.; Lina, Z.; Wenwu, Z.; Lingxiao, Y. The Influence of Rainfall and Land Use Patterns on Soil Erosion in Multi-Scale Watersheds: A Case Study in the Hilly and Gully Area on the Loess Plateau, China. J. Geogr. Sci. 2018, 28, 1415–1426. [Google Scholar]
  21. Sobral, A.C.; Peixoto, A.S.P.; Nascimento, V.F.; Rodgers, J.; Da Silva, A.M. Natural and anthropogenic influence on soil erosion in a rural watershed in the Brazilian southeastern region. Reg. Environ. Chang. 2015, 15, 709–720. [Google Scholar] [CrossRef]
  22. Mohamadi, M.A.; Kavian, A. Effects of rainfall patterns on runoff and soil erosion in field plots. Int. Soil Water Conserv. Res. 2015, 3, 273–281. [Google Scholar] [CrossRef]
  23. Fu, B.; Liang, Q.; Ma, J.; Pan, Y. Pupiao river basin, western yunnan erosive rainfall and characteristics of the runoff and sediment yield research J/OL. J. Southwest For. Univ. Nat. Sci. 2023, 44, 1–9. Available online: http://kns.cnki.net/kcms/detail/53.1218.S.20231102.1028.004.html (accessed on 2 November 2023).
  24. Wang, H.; Yang, S.; Yue, X.; Jiang, F.; Zhang, Y.; Huang, Y.; Lin, J. Runoff and Sediment of Different Rainfall Types on Bare Slop in the Red Soil Region. J. Soil Water Conserv. 2023, 5, 61–68. [Google Scholar] [CrossRef]
  25. Zhao, Y.; Cao, W.; Hu, C.; Wang, Y.; Wang, Z.; Zhang, X.; Zhu, B.; Cheng, C.; Yin, X.; Liu, B.; et al. Analysis of changes in characteristics of flood and sediment yield in typical basins of the Yellow River under extreme rainfall events. Catena 2019, 177, 31–40. [Google Scholar] [CrossRef]
  26. Deng, L.; Zhang, L.; Fan, X.; Sun, T.; Fei, K.; Ni, L. Effects of rainfall intensity and slope gradient on runoff and sediment yield from hillslopes with weathered granite. Environ. Sci. Pollut. Res. 2019, 26, 32559–32573. [Google Scholar] [CrossRef] [PubMed]
  27. Puntenney-Desmond, K.C.; Bladon, K.D.; Silins, U. Runoff and sediment production from harvested hillslopes and the riparian area during high intensity rainfall events. J. Hydrol. 2020, 582, 124452. [Google Scholar] [CrossRef]
  28. Meng, Z.K.; Wang, B.; Daniel, M. Effects of temporal and spatial distribution of rainfall on sediment yield and runoff in a watershed. China Soil Water Conserv. Sci. 2023, 21, 69–78. [Google Scholar]
  29. Wu, L.; Peng, M.; Qiao, S.; Ma, X. Effects of rainfall intensity and slope gradient on runoff and sediment yield characteristics of bare loess soil. Environ. Sci. Pollut. Res. 2018, 25, 3480–3487. [Google Scholar] [CrossRef]
  30. Yan, Y.; Dai, Q.; Yuan, Y.; Peng, X.; Zhao, L.; Yang, J. Effects of rainfall intensity on runoff and sediment yields on bare slopes in a karst area, SW China. Geoderma 2018, 330, 30–40. [Google Scholar] [CrossRef]
  31. Tuset, J.; Vericat, D.; Batalla, R.J. Rainfall, runoff and sediment transport in a Mediterranean mountainous catchment. Sci. Total Environ. 2016, 540, 114–132. [Google Scholar] [CrossRef]
  32. da Silva, R.M.; Santos, C.A.G.; dos Santos, J.Y.G. Evaluation and modeling of runoff and sediment yield for different land covers under simulated rain in a semiarid region of Brazil. Int. J. Sediment Res. 2018, 33, 117–125. [Google Scholar] [CrossRef]
  33. Berihun, M.L.; Tsunekawa, A.; Haregeweyn, N.; Dile, Y.T.; Tsubo, M.; Fenta, A.A.; Meshesha, D.T.; Ebabu, K.; Sultan, D.; Srinivasan, R. Evaluating runoff and sediment responses to soil and water conservation practices by employing alternative modeling approaches. Sci. Total Environ. 2020, 747, 141118. [Google Scholar] [CrossRef] [PubMed]
  34. Chen, J.; Xiao, H.; Li, Z.; Liu, C.; Lin, K.; Tang, C. How effective are soil and water conservation measures (SWCMs) in reducing soil and water losses in the red soil hilly region of China? A meta-analysis of field plot data. Sci. Total Environ. 2020, 735, 139517. [Google Scholar] [CrossRef] [PubMed]
  35. Diyabalanage, S.; Samarakoon, K.K.; Adikari, S.B.; Hewawasam, T. Impact of soil and water conservation measures on soil erosion rate and sediment yields in a tropical watershed in the Central Highlands of Sri Lanka. Appl. Geogr. 2017, 79, 103–114. [Google Scholar] [CrossRef]
  36. Cai, M.; An, C.; Guy, C.; Lu, C. Assessment of soil and water conservation practices in the loess hilly region using a coupled rainfall-runoff-erosion model. Sustainability 2020, 12, 934. [Google Scholar] [CrossRef]
  37. Xu, Y.; Yang, X.; Xu, G.; Fu, J.; Cai, S.; Mu, X.; Zhou, T.; Zhang, W.; Chen, J.; Li, L.; et al. Assessment of Integrated Soil and Water Conservation Practices on Soil Erosion Risk in a Typical Red-Beds Watershed in South China. Water 2023, 15, 2613. [Google Scholar] [CrossRef]
  38. Girma, R.; Gebre, E. Spatial modeling of erosion hotspots using GIS-RUSLE interface in Omo-Gibe river basin, Southern Ethiopia: Implication for soil and water conservation planning. Environ. Syst. Res. 2020, 9, 19. [Google Scholar] [CrossRef]
  39. Anache, J.A.A.; Wendland, E.C.; Oliveira, P.T.S.; Flanagan, D.C.; Nearing, M.A. Runoff and soil erosion plot-scale studies under natural rainfall: A meta-analysis of the Brazilian experience. Catena 2017, 152, 29–39. [Google Scholar] [CrossRef]
  40. Kinnell, P.I.A. A review of the design and operation of runoff and soil loss plots. Catena 2016, 145, 257–265. [Google Scholar] [CrossRef]
  41. Fang, N.F.; Wang, L.; Shi, Z.H. Runoff and soil erosion of field plots in a subtropical mountainous region of China. J. Hydrol. 2017, 552, 387–395. [Google Scholar] [CrossRef]
  42. GB/T 50159-2015; Code for Measurement of Suspended Load in Open Channels. China Planning Press: Beijing, China, 2015.
  43. Ahmed, M.; Seraj, R.; Islam, S.M.S. The k-means algorithm: A comprehensive survey and performance evaluation. Electronics 2020, 9, 1295. [Google Scholar] [CrossRef]
  44. Sinaga, K.P.; Yang, M.-S. Unsupervised K-Means Clustering Algorithm. IEEE Access 2020, 8, 80716–80727. [Google Scholar] [CrossRef]
  45. Sahu, P.K.; Pradip, K.S. Analysis of Variance. In Applied Statistics for Agriculture, Veterinary, Fishery, Dairy and Allied Fields; Springer: New Delhi, India, 2016; pp. 277–318. [Google Scholar]
  46. Maulud, D.; Abdulazeez, A.M. A Review on Linear Regression Comprehensive in Machine Learning. J. Appl. Sci. Technol. Trends 2020, 1, 140–147. [Google Scholar] [CrossRef]
  47. Wu, X.; Wei, Y.; Wang, J.; Xia, J.; Cai, C.; Wei, Z. Effects of soil type and rainfall intensity on sheet erosion processes and sediment characteristics along the climatic gradient in central-south China. Sci. Total Environ. 2018, 621, 54–66. [Google Scholar] [CrossRef] [PubMed]
  48. Liang, Y.; Jiao, J.; Dang, W.; Cao, W. The Thresholds of Sediment-Generating Rainfall from Hillslope to Watershed Scales in the Loess Plateau, China. Water 2019, 11, 2392. [Google Scholar] [CrossRef]
  49. de Almeida, W.S.; Seitz, S.; de Oliveira, L.F.C.; de Carvalho, D.F. Duration and intensity of rainfall events with the same erosivity change sediment yield and runoff rates. Int. Soil Water Conserv. Res. 2021, 9, 69–75. [Google Scholar] [CrossRef]
  50. Perruchet, C. Constrained agglomerative hierarchical classification. Pattern Recognit. 1983, 16, 213–217. [Google Scholar] [CrossRef]
  51. Duan, J.; Liu, Y.J.; Yang, J.; Tang, C.J.; Shi, Z.H. Role of groundcover management in controlling soil erosion under extreme rainfall in citrus orchards of southern China. J. Hydrol. 2020, 582, 124290. [Google Scholar] [CrossRef]
  52. Han, J.; Ge, W.; Hei, Z.; Cong, C.; Ma, C.; Xie, M.; Liu, B.; Feng, W.; Wang, F.; Jiao, J. Agricultural land use and management weaken the soil erosion induced by extreme rainstorms. Agric. Ecosyst. Environ. 2020, 301, 107047. [Google Scholar] [CrossRef]
  53. Jia, L.; Yu, K.; Li, Z.; Li, P.; Zhang, J.; Wang, A.; Ma, L.; Xu, G.; Zhang, X. Temporal and spatial variation of rainfall erosivity in the Loess Plateau of China and its impact on sediment load. Catena 2022, 210, 105931. [Google Scholar] [CrossRef]
  54. Chen, X.; Liang, Z.; Zhang, Z.; Zhang, L. Effects of soil and water conservation measures on runoff and sediment yield in red soil slope farmland under natural rainfall. Sustainability 2020, 12, 3417. [Google Scholar] [CrossRef]
  55. Xu, Z.; Zhang, S.; Yang, X. Water and sediment yield response to extreme rainfall events in a complex large river basin: A case study of the Yellow River Basin, China. J. Hydrol. 2021, 597, 126183. [Google Scholar] [CrossRef]
  56. Damtie, B.B.; Mengistu, D.A.; Waktola, D.K.; Meshesha, D.T. Impacts of soil and water conservation practice on soil moisture in Debre Mewi and Sholit Watersheds, Abbay Basin, Ethiopia. Agriculture 2022, 12, 417. [Google Scholar] [CrossRef]
  57. Tian, L.; Zhang, B.; Chen, S.; Wang, X.; Ma, X.; Pan, B. Large-scale afforestation enhances precipitation by intensifying the atmospheric water cycle over the Chinese Loess Plateau. J. Geophys. Res. Atmos. 2022, 127, e2022JD036738. [Google Scholar] [CrossRef]
  58. Zambon, N.; Johannsen, L.L.; Strauss, P.; Dostal, T.; Zumr, D.; Cochrane, T.A.; Klik, A. Splash erosion affected by initial soil moisture and surface conditions under simulated rainfall. Catena 2021, 196, 104827. [Google Scholar] [CrossRef]
  59. Yaekob, T.; Tamene, L.; Gebrehiwot, S.G.; Demissie, S.S.; Adimassu, Z.; Woldearegay, K.; Mekonnen, K.; Amede, T.; Abera, W.; Recha, J.W.; et al. Assessing the impacts of different land uses and soil and water conservation interventions on runoff and sediment yield at different scales in the central highlands of Ethiopia. Renew. Agric. Food Syst. 2022, 37, S73–S87. [Google Scholar] [CrossRef]
  60. Li, Z.; Ning, K.; Chen, J.; Liu, C.; Wang, D.; Nie, X.; Hu, X.; Wang, L.; Wang, T. Soil and water conservation effects driven by the implementation of ecological restoration projects: Evidence from the red soil hilly region of China in the last three decades. J. Clean. Prod. 2020, 260, 121109. [Google Scholar] [CrossRef]
Figure 1. Location of the study area (The Qiaotou Watershed).
Water 16 00372 g001
Figure 2. Basic hydrological situation of the Qiaotou small watershed in Nanjing from 2013 to 2021: (a) Continuous sequence diagram of annual runoff and sediment flux; (b) Distribution of total rainfall from January to December.
Water 16 00372 g002
Figure 3. Corresponding relationship between rainfall, maximum 30 min rain intensity (I30), sediment concentration, and runoff coefficient: (a) Relationship between rainfall and runoff coefficient; (b) Relationship between I30 and runoff coefficient; (c) Relationship between rainfall and sediment concentration; (d) Relationship between I30 and sediment concentration.
Water 16 00372 g003
Figure 4. Proportions of cumulative rainfall, cumulative sediment concentration, and cumulative runoff under different rainfall types.
Water 16 00372 g004
Figure 5. Characteristics of sediment production and abortion in a small watershed under different rainfall types (Different lowercase letters in the figure indicate that different rainfall types are significantly different at the p < 0.05 level): (a) Statistical differences of sediment yield modes; (b) Statistical differences of sediment concentration; (c) Statistical differences of runoff coefficient; (d) Statistical differences of flood peak discharge.
Water 16 00372 g005
Figure 6. Correlation between rainfall reduction effects and I30 among different measures.
Water 16 00372 g006
Figure 7. Correlation between sediment reduction effects and I30 among different measures.
Water 16 00372 g007
Table 1. Annual runoff and sediment transport in the Qiaotou small Basin, Nanjing from 2013 to 2021.
YearFrequency of Erosive RainfallTotal Annual Runoff/104·m3Sediment Transport/t
20132939.2140.8
20143141.6495.7
20153395.61030.9
201642246.31801.1
20173478.52605.7
20184859.1925.0
20192047.3629.5
202053163.62493.3
20211554.6479.2
Note: The data for 2013 refer to the monitoring data from September to December, and the data spanning from May to September 2019 were calculated through the RUSLE model due to device malfunctions.
Table 2. Statistical characteristics of rainfall types.
Rainfall TypeCenter ValueRadiusCentral Value of I30RadiusFrequencyProportion
A78.5413–2866.911–463912.78%
B3.881–642.181–2519764.59%
C28.191–16546.5618–1006922.63%
Table 3. Descriptive statistical characteristics of rainfall events.
ParameterMinimumMaximumAverageStandard Deviation
P0.50286.0030.5334.05
T5.004565.00835.90806.12
I300.50100.7014.4514.71
R0.084149.82172.65377.34
Qmax0.0061.991.134.61
H0.00398.4511.6843.91
Rc0.006.850.220.72
C0.007.670.421.04
Ms0.005.070.140.56
Notes: P is rainfall (mm); T is the duration of rainfall (min); I30 is the maximum 30 min rain intensity (mm/h); R is rainfall erosivity [MJ·mm/(hm2·h)]. Qmax is the peak flow (m3/s). H is runoff depth (mm); Rc is the runoff coefficient; C is sediment content (g/L); Ms is the sediment yield modulus (t/hm2).
Table 4. Pearson correlation coefficient matrix.
ParameterPTI30RQmaxHRcCMs
P1
T0.55 **1
I300.482 **−0.0831
R0.746 **0.157 **0.742 **1
Qmax0.322 **0.120.439 **0.645 **1
H0.511 **0.208 **0.294 **0.481 **0.353 **1
Rc0.289 **0.023 **0.378 **0.501 **0.833 **0.270 **1
C0.165 **−0.0490.337 **0.235 **0.237 **0.192 **0.258 **1
Ms0.406 **0.121 *0.338 **0.398 **0.317 **0.722 **0.252 **0.513 **1
Notes: ** indicates significant correlation at the 0.01 level (two-sided); * indicates significant correlation at the 0.05 level (two-sided).
Table 5. Fitted regression equations for the main indicators.
Fit the Regression EquationR2FSig.
Ms = 0.499C + 0.07H + 0.001P − 0.040.828346.840.001
Q = 0.586C + 0.028H + 0.01I30 + 0.1640.810307.100.0001
Disclaimer/Publisher’s Note: The statements, opinions and data contained in all publications are solely those of the individual author(s) and contributor(s) and not of MDPI and/or the editor(s). MDPI and/or the editor(s) disclaim responsibility for any injury to people or property resulting from any ideas, methods, instructions or products referred to in the content.

