
Study on the Cavitation Performance in the Impeller Region of a Mixed-Flow Pump Under Different Flow Rates


 and
and 
Abstract
1. Introduction
2. Numerical Model and Settings
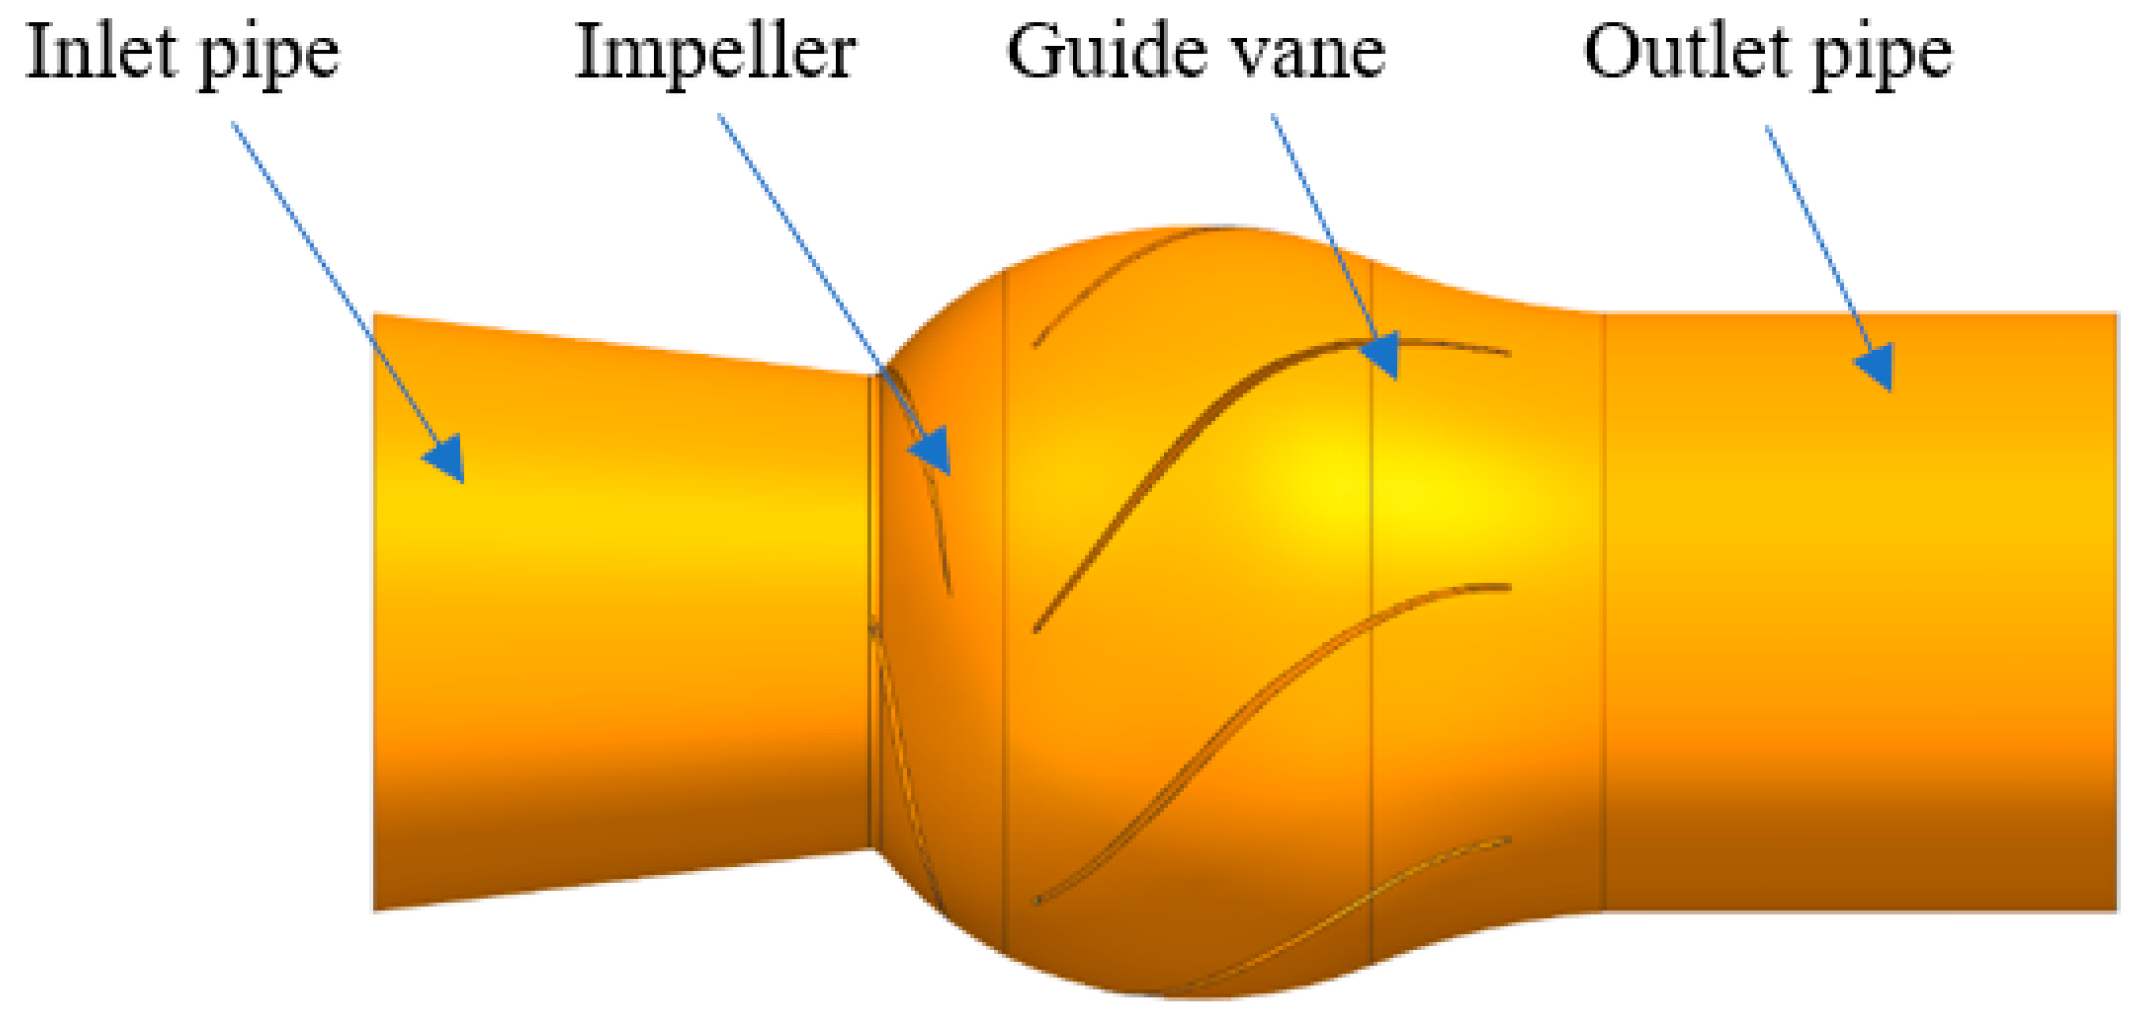
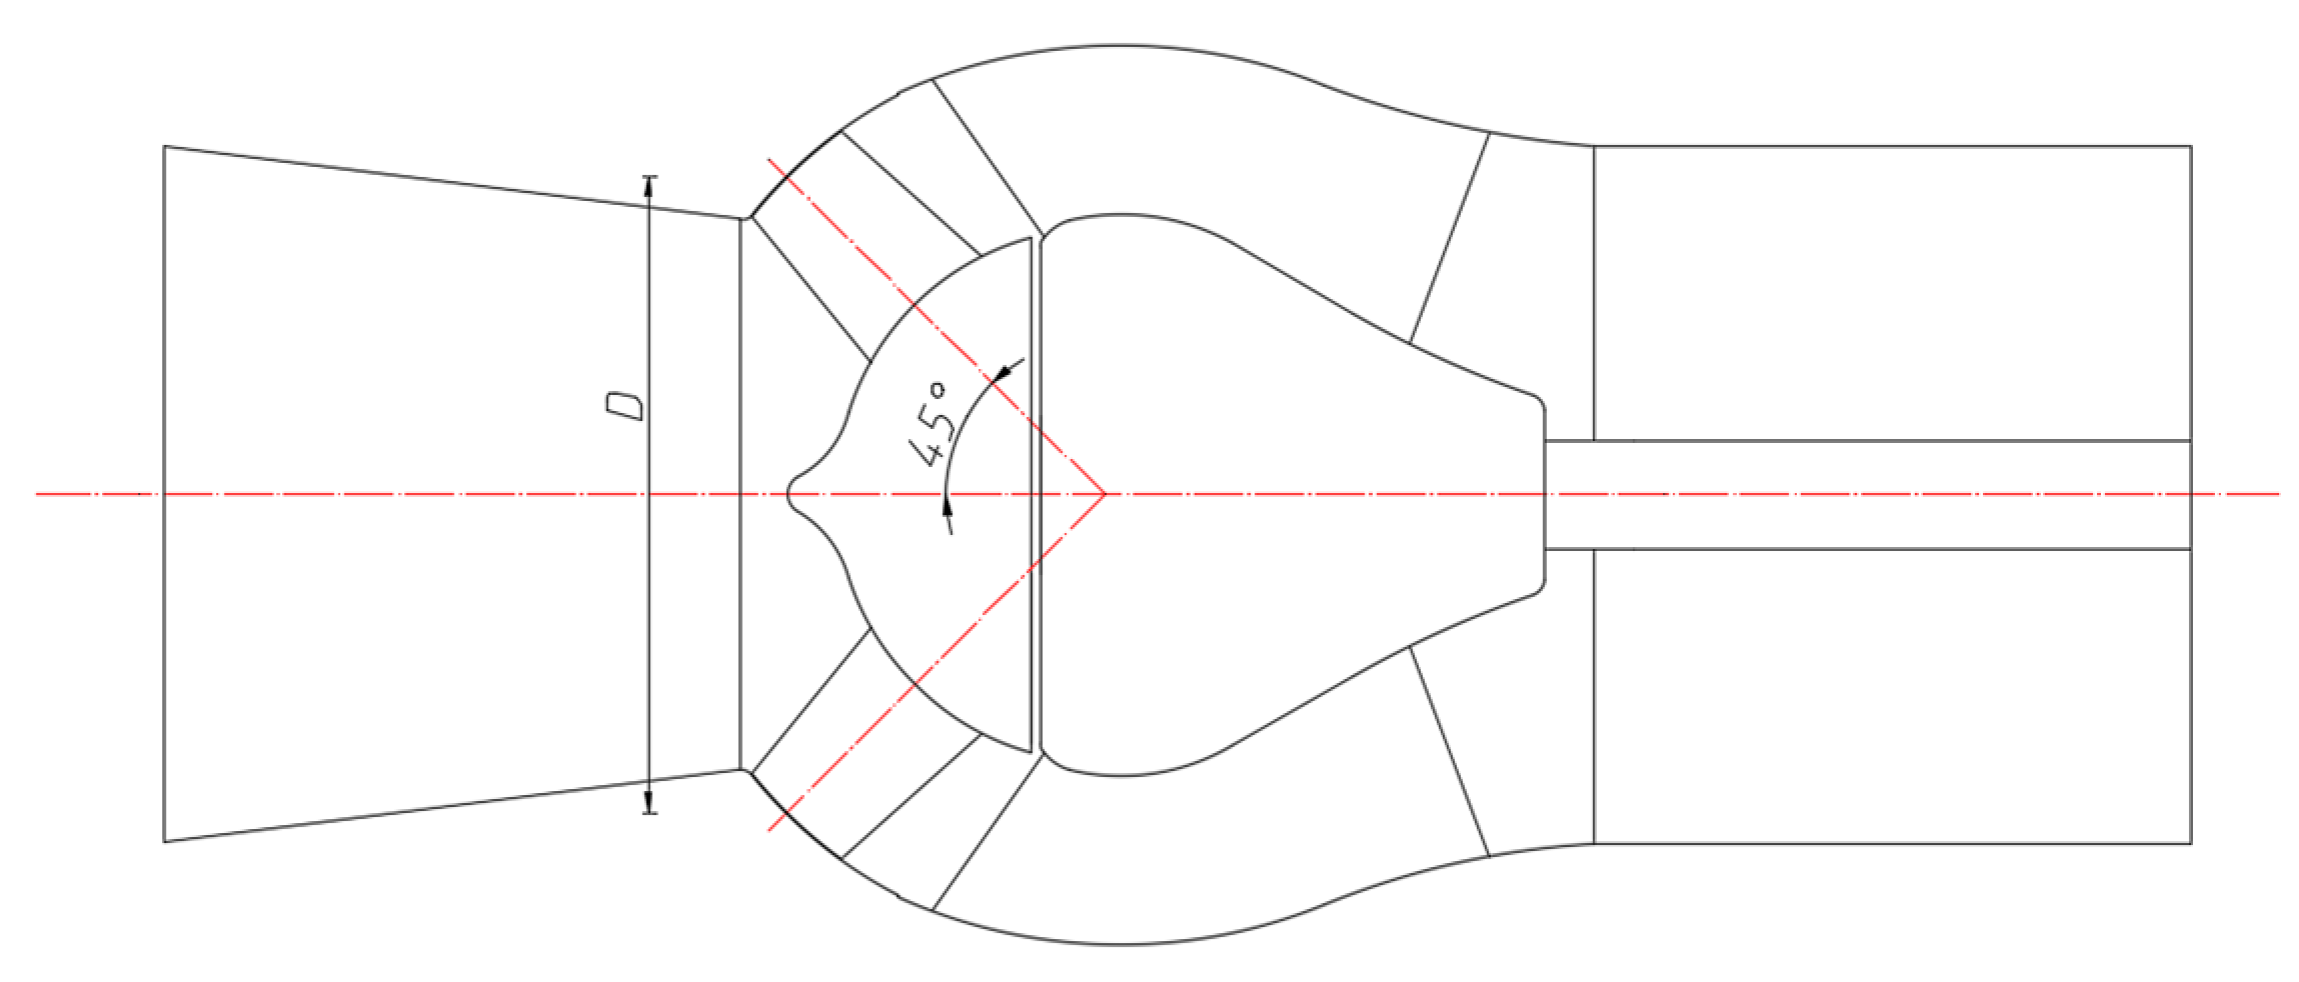
2.1. Physical Model and Meshing
2.2. Numerical Method
2.2.1. Turbulence Model
2.2.2. Cavitation Model
2.2.3. Boundary Conditions
3. Results and Discussion
3.1. Study on Cavitation Performance Under Steady Calculation
3.1.1. External Characteristic Analysis
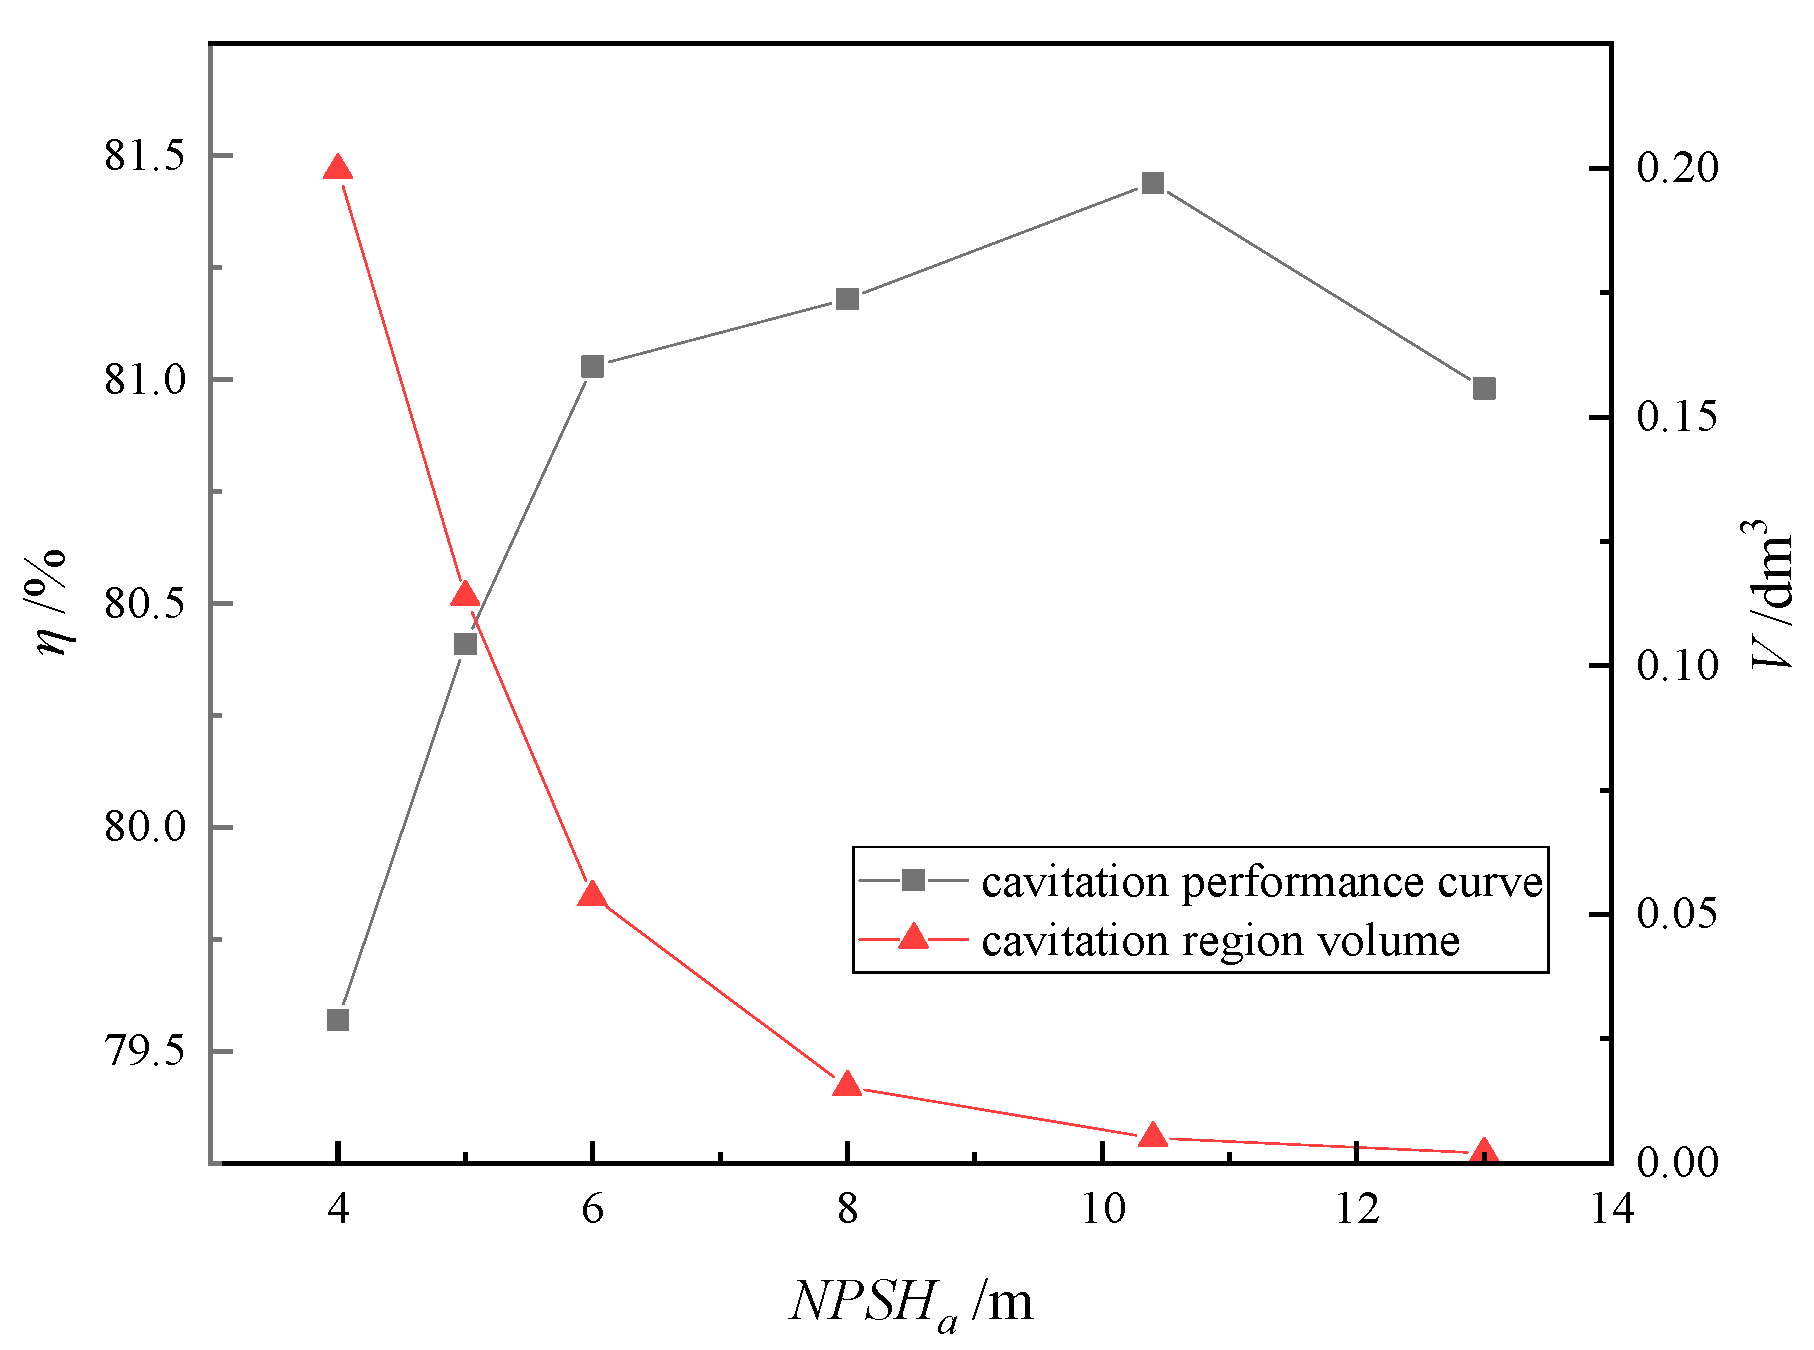
3.1.2. Cavitation Performance Analysis
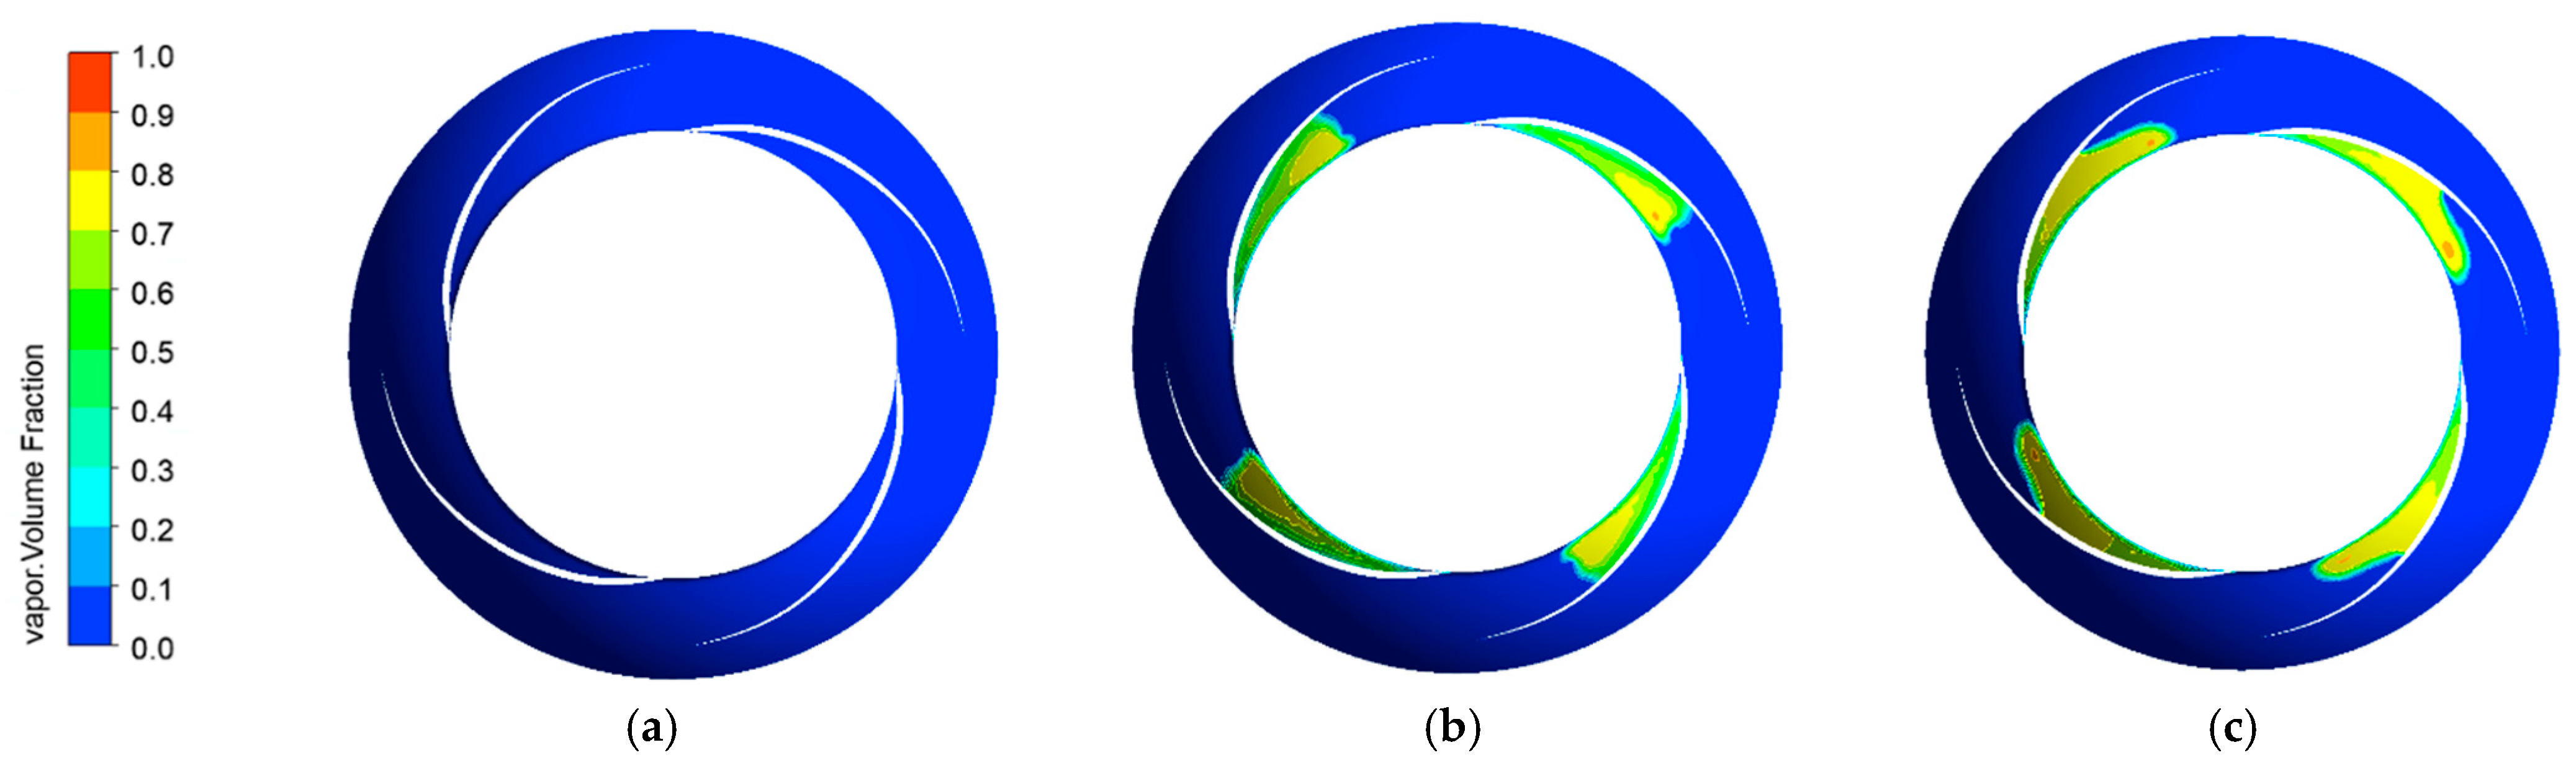
3.1.3. Study on Cavitation Bubbles in the Impeller
- Cavitation Bubbles at 0.9 Qd
- 2.
- Cavitation Bubbles at 1.0 Qd
- 3.
- Cavitation Bubbles at 1.1 Qd
3.2. Analysis of Unsteady Cavitation Flow Field
3.2.1. Unsteady Computation Settings
3.2.2. Study on Pressure Pulsation Characteristics of Impeller Under Cavitation Conditions
- Pressure Pulsation Characteristics of 0.9 Qd
- (1)
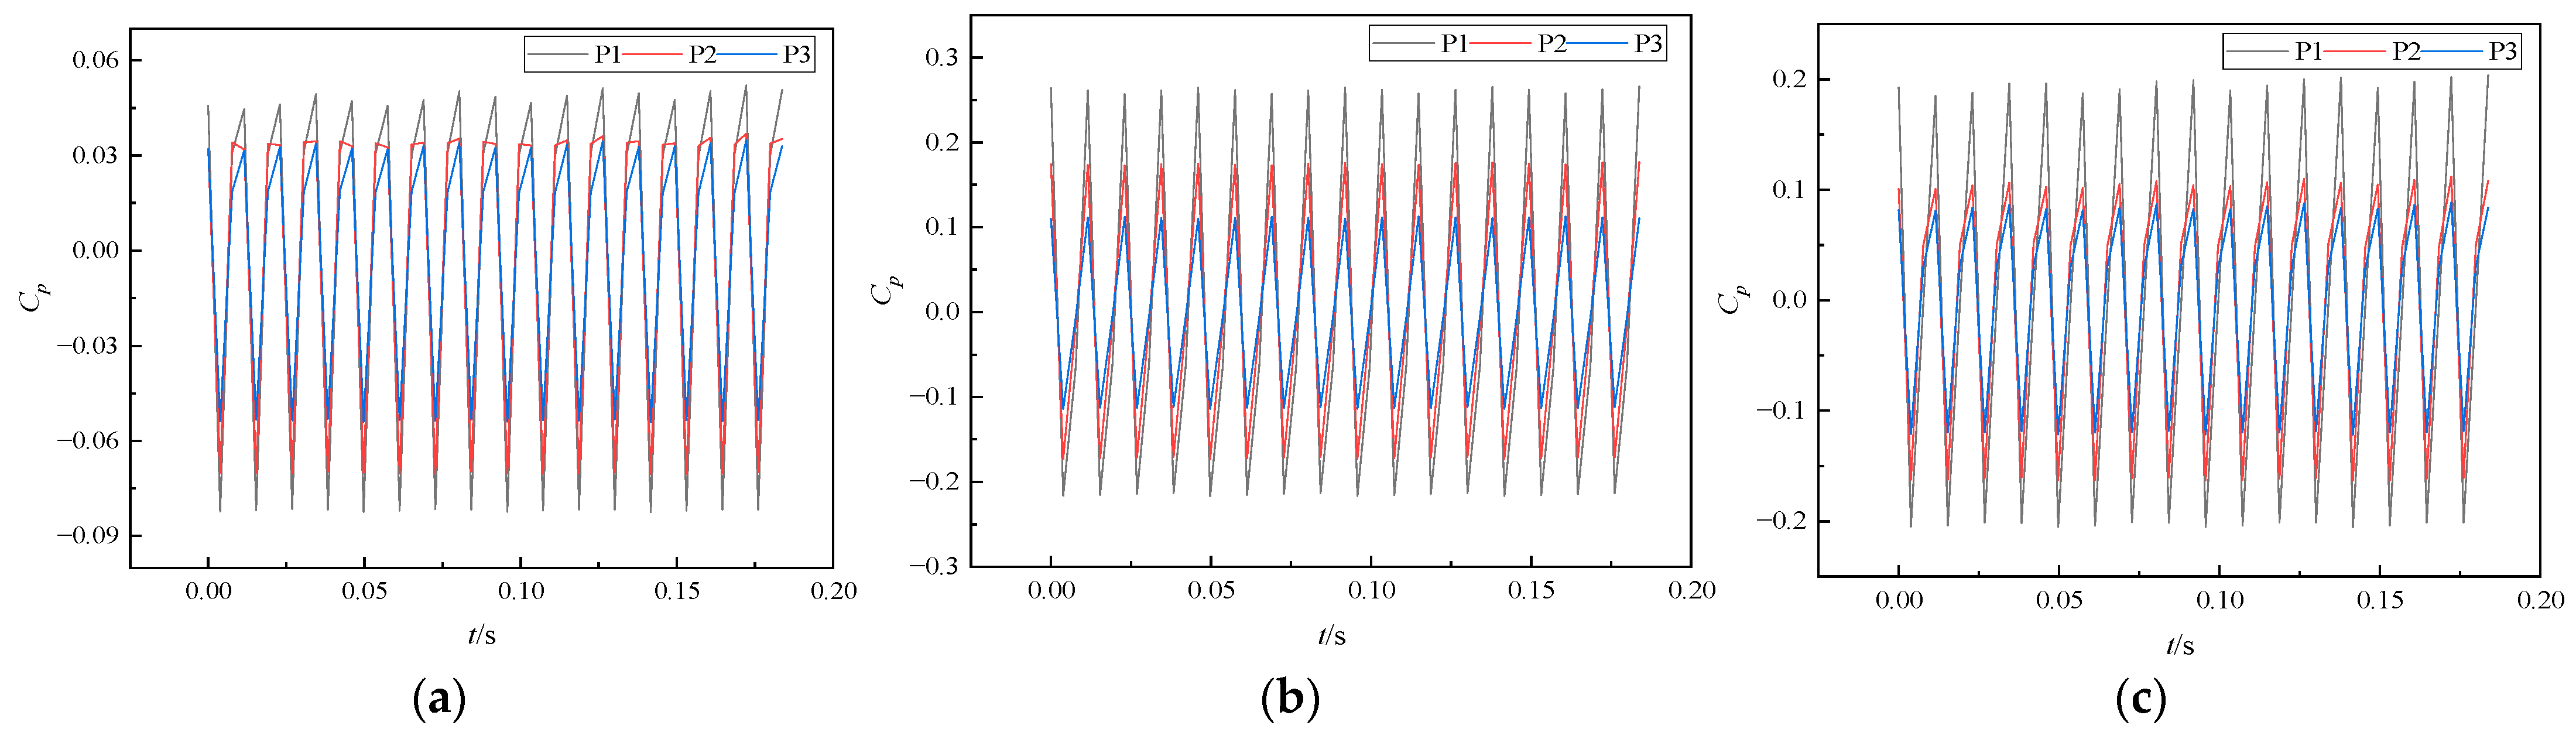
- Pressure Pulsation at Impeller Inlet
- (2)
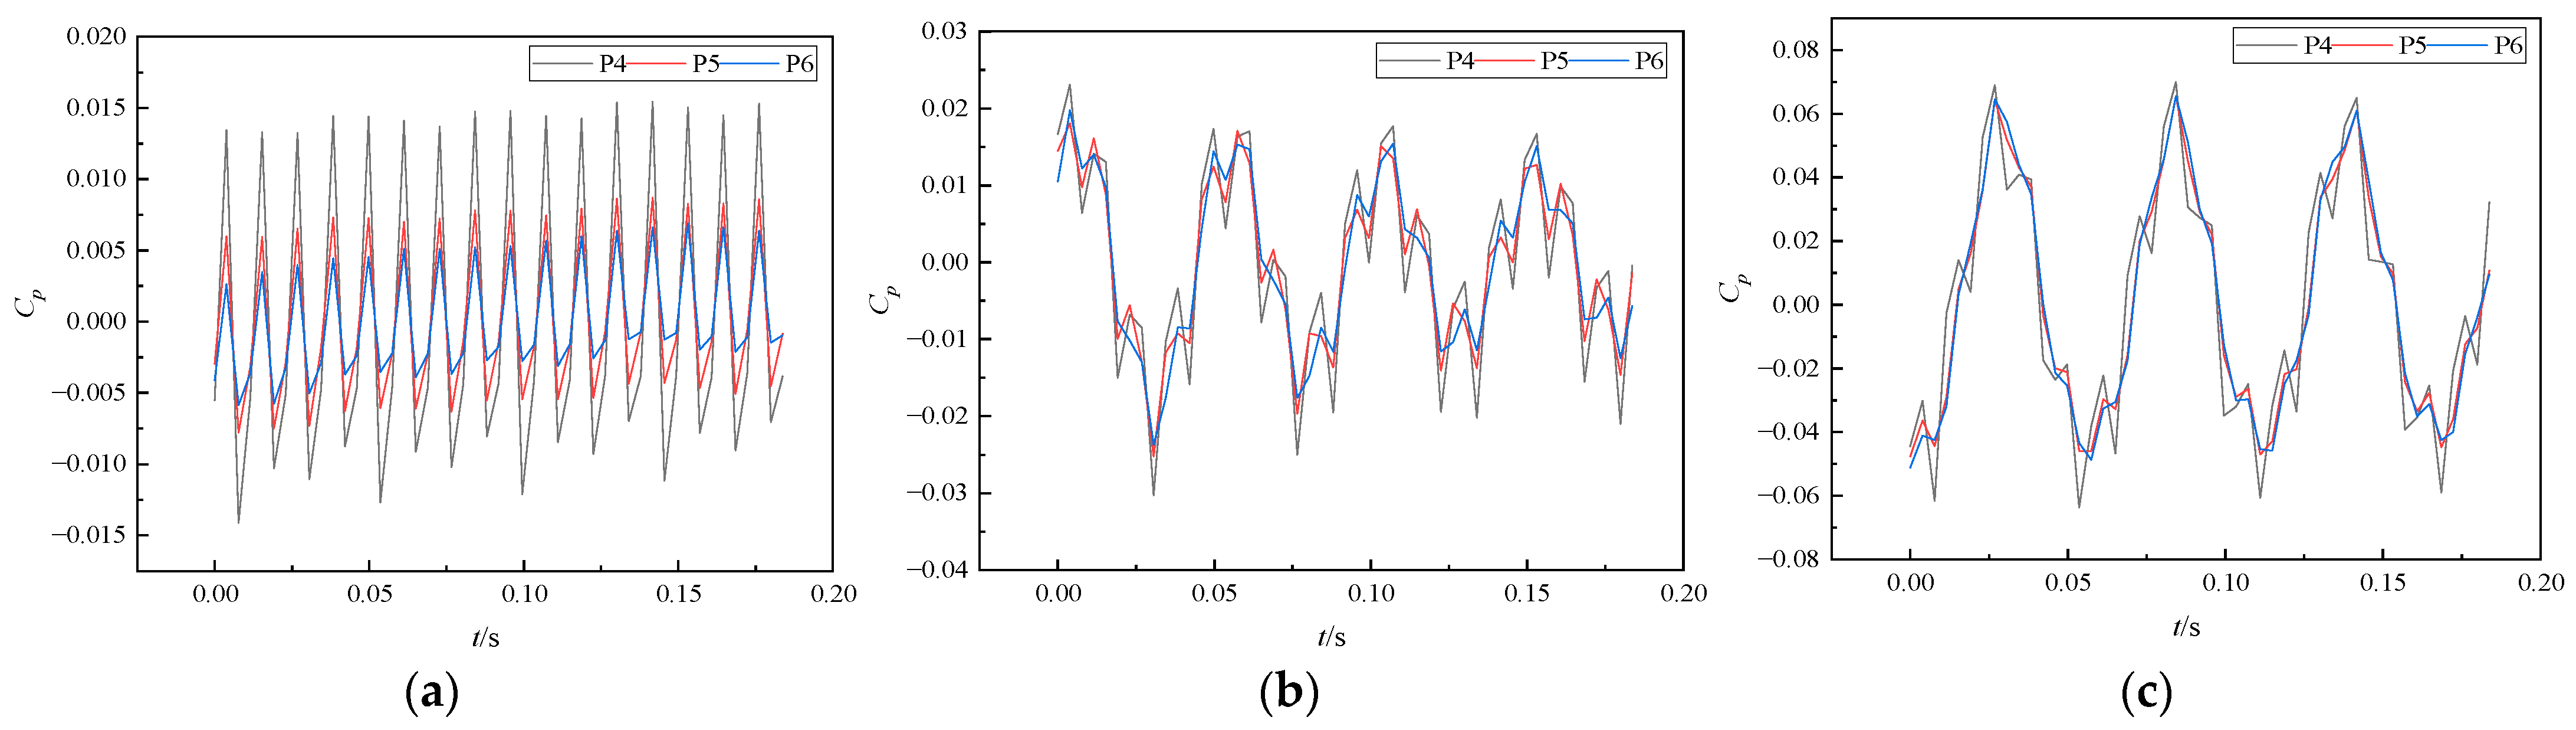
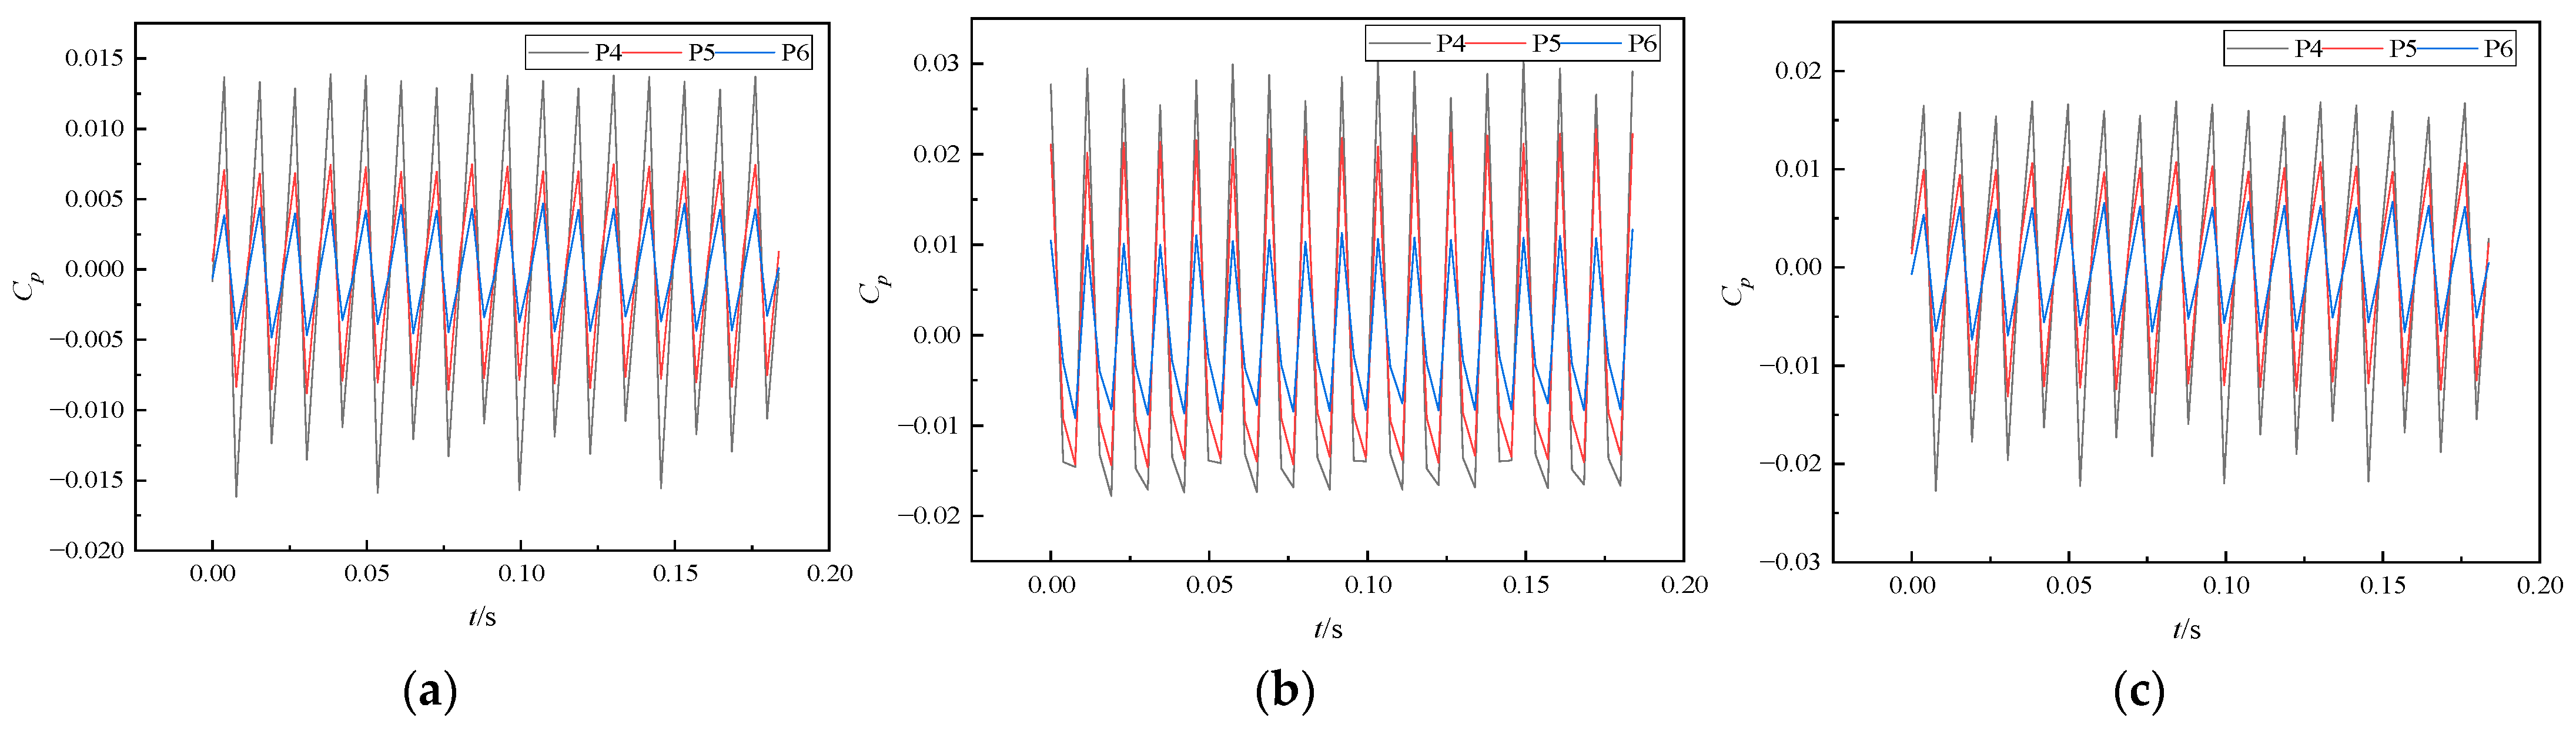
- Pressure Pulsation at Impeller Outlet
- 2.
- Pressure Pulsation Characteristics of 1.0 Qd
- (1)
- Pressure Pulsation at Impeller Inlet
- (2)
- Pressure Pulsation at Impeller Outlet
- 3.
- Pressure Pulsation Characteristics of 1.1 Qd
- (1)
- Pressure Pulsation at Impeller Inlet
- (2)
- Pressure Pulsation at Impeller Outlet
4. Conclusions
- (1)
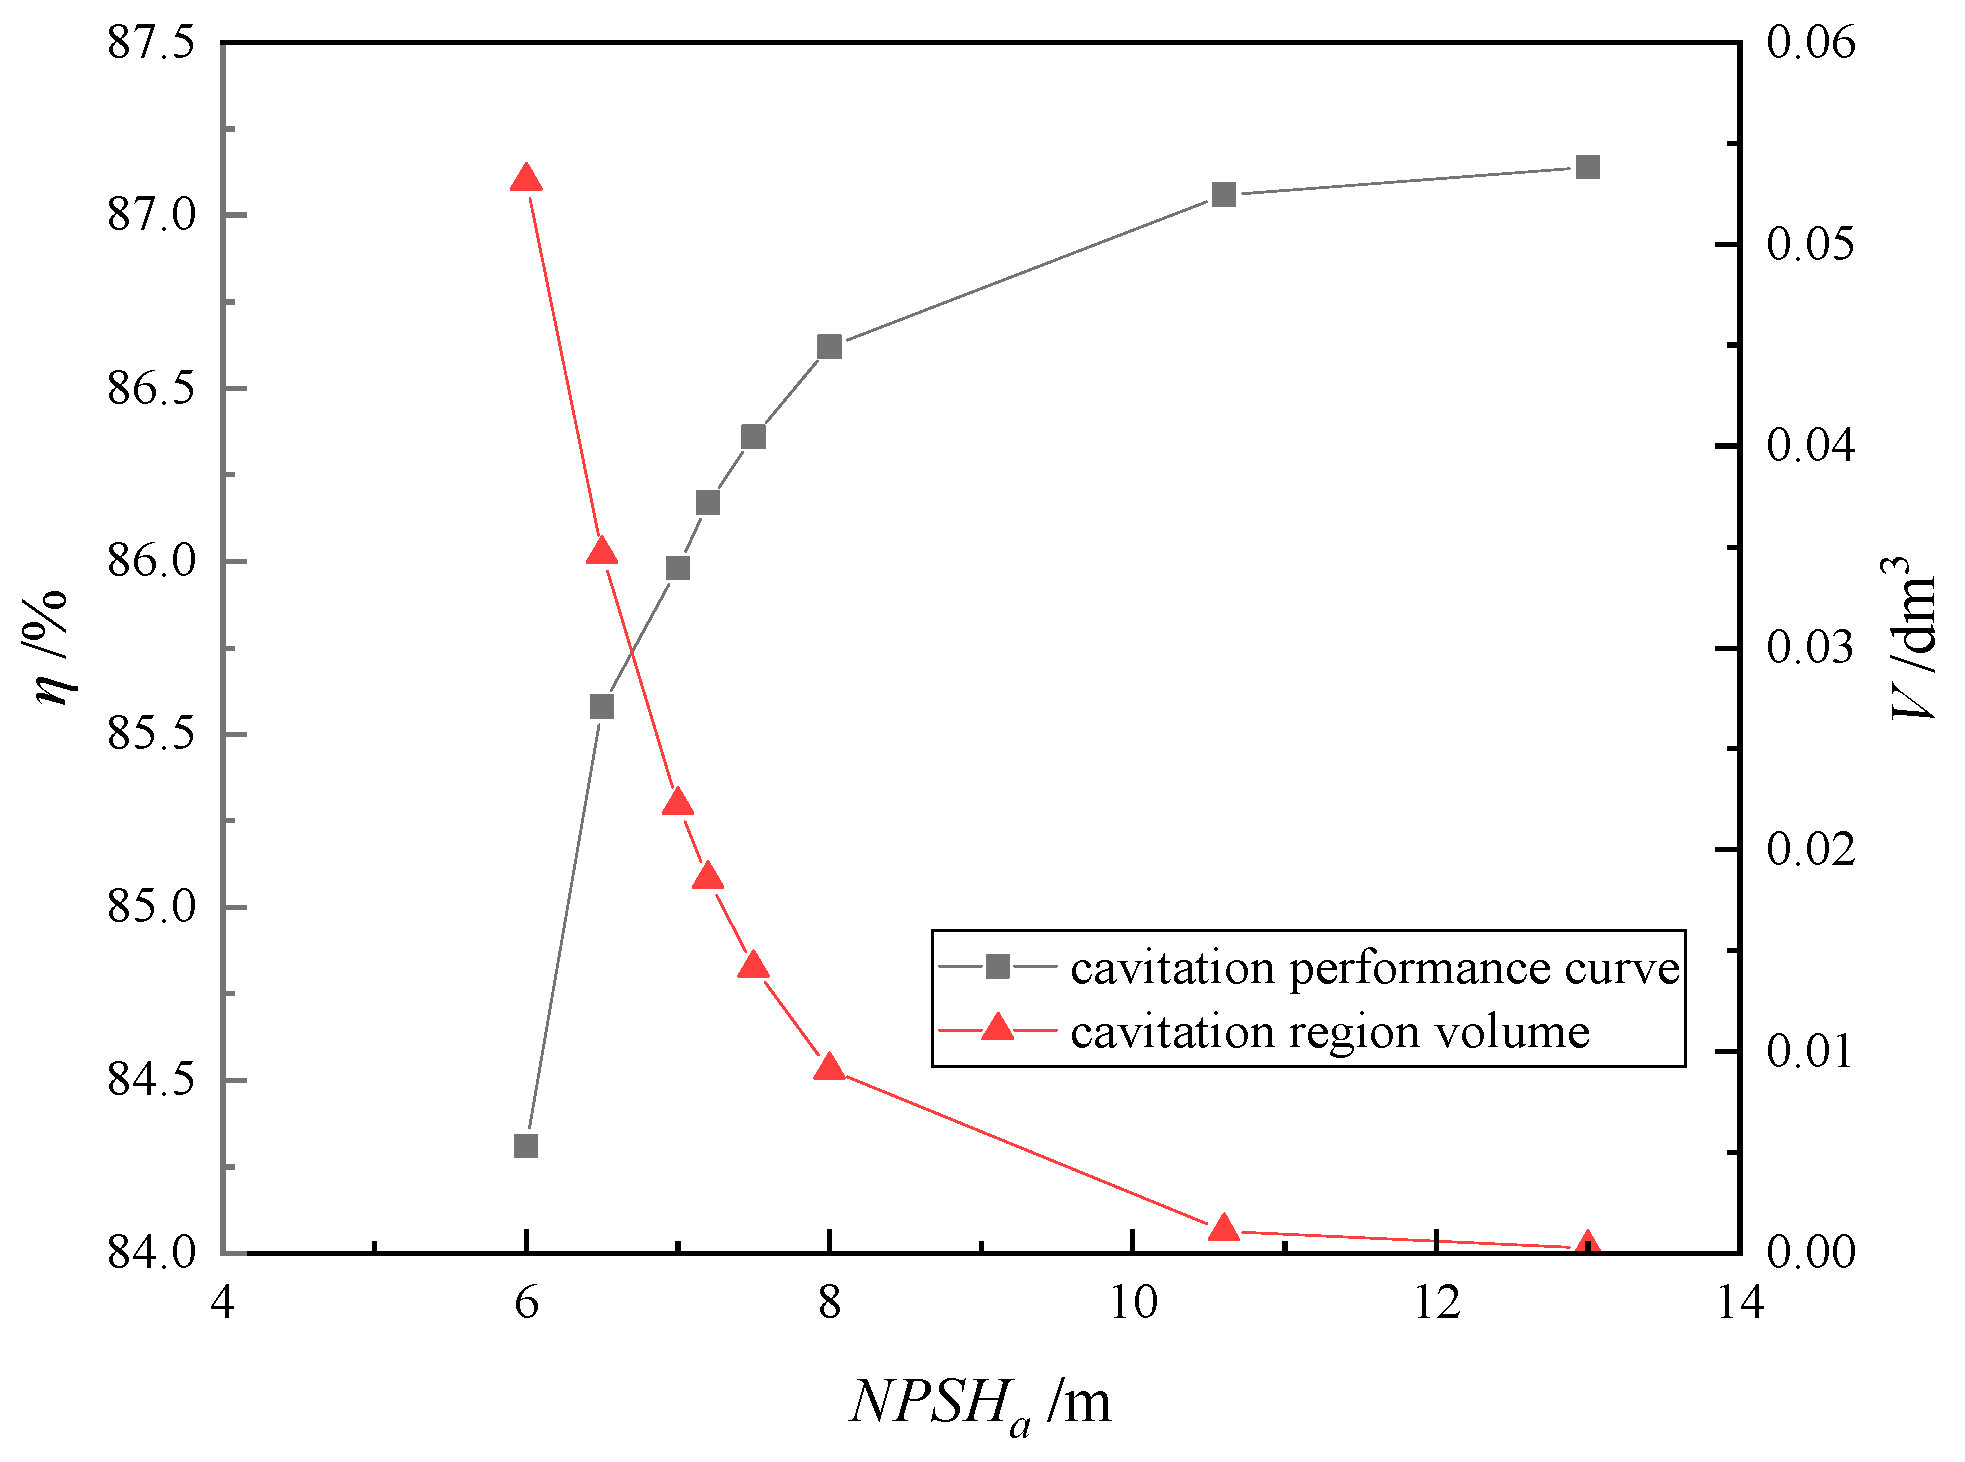
- The volume of the cavitation zone progressively enlarges and the bubble growth rate accelerates with the decline in NPSHa, leading to a continuous decline in efficiency. When NPSHa falls below NPSHc, efficiency declines sharply. Overall, the NPSHc decreases under various operating conditions as the flow rate reduces.
- (2)
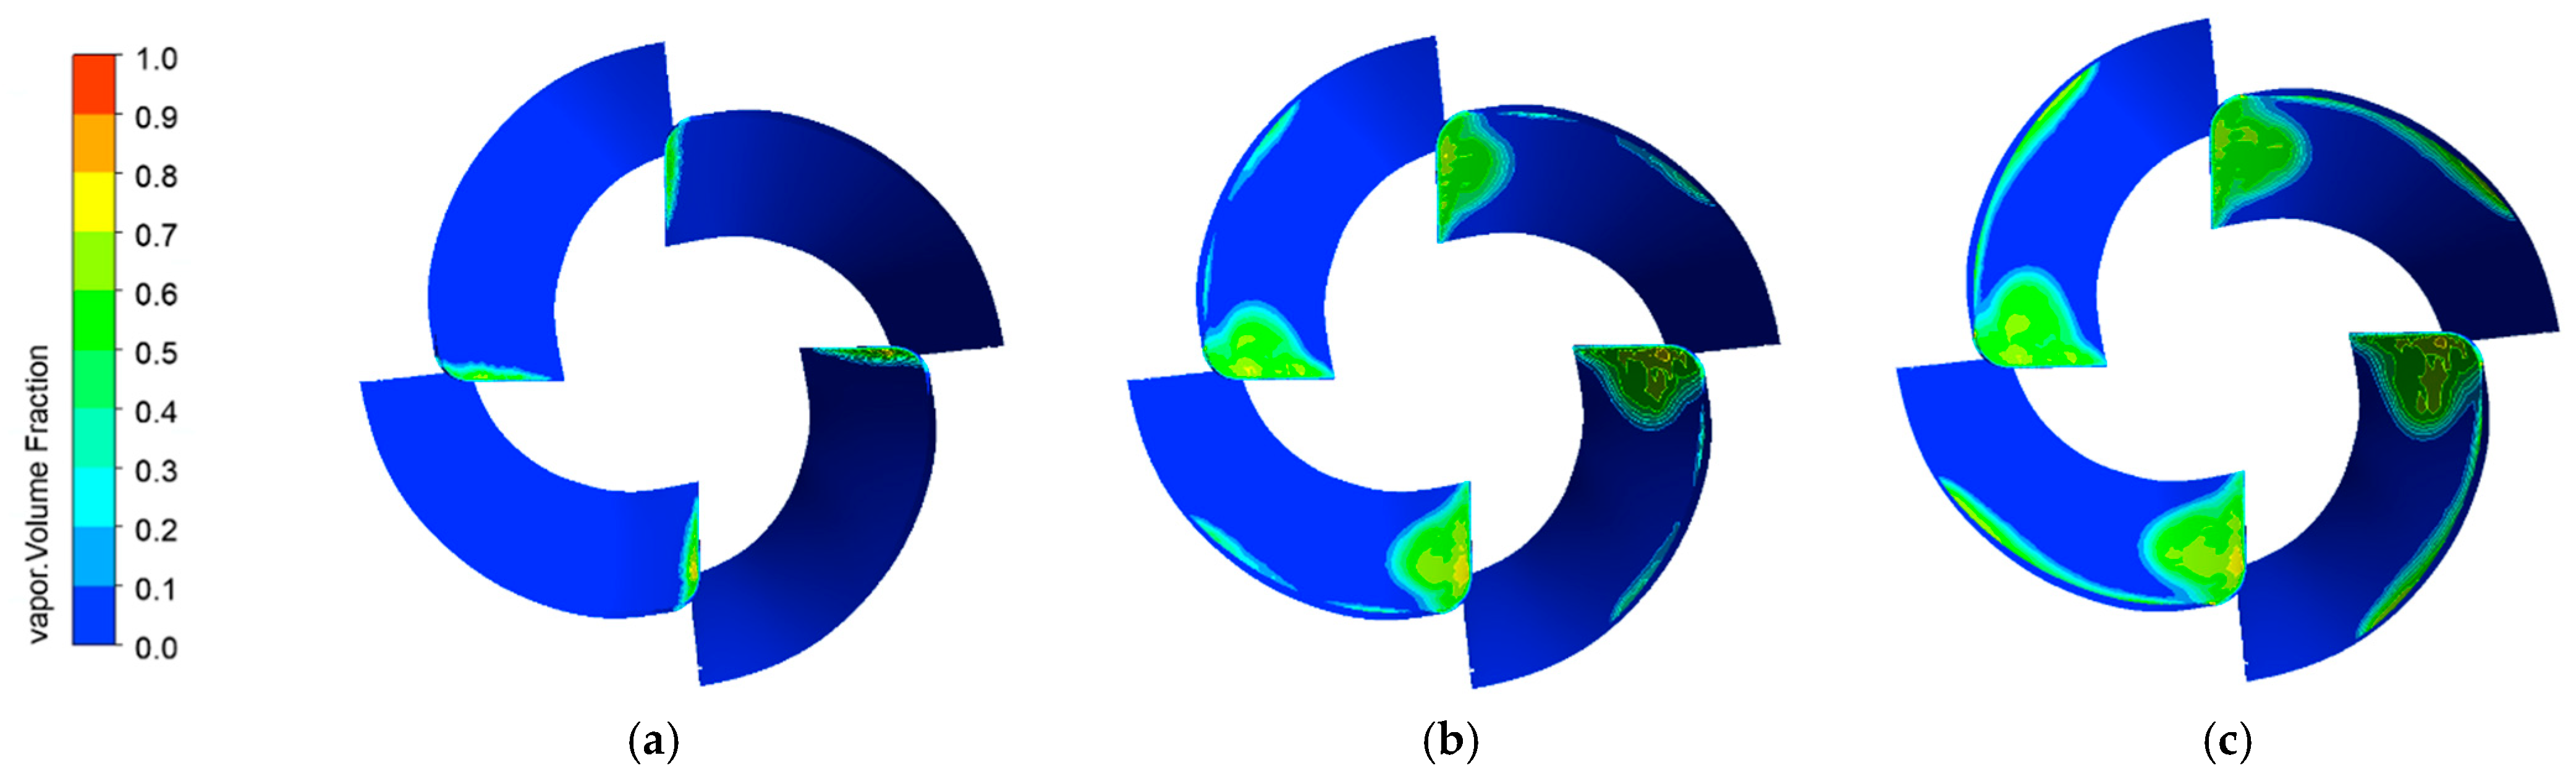
- Cavitation bubbles are initially distributed at the blade leading edge at the growth stage of cavitation. As NPSHa decreases, the bubble area gradually increases. Meanwhile, a substantial amount of bubbles appear in the impeller shroud and extend to the blade rim. This seriously affects the smooth flow through the channel, contributing to a decrease in pump efficiency. Under the working condition of a large flow rate (1.1 Qd), the impeller shroud below the blade is the main distribution area of cavitation.
- (3)
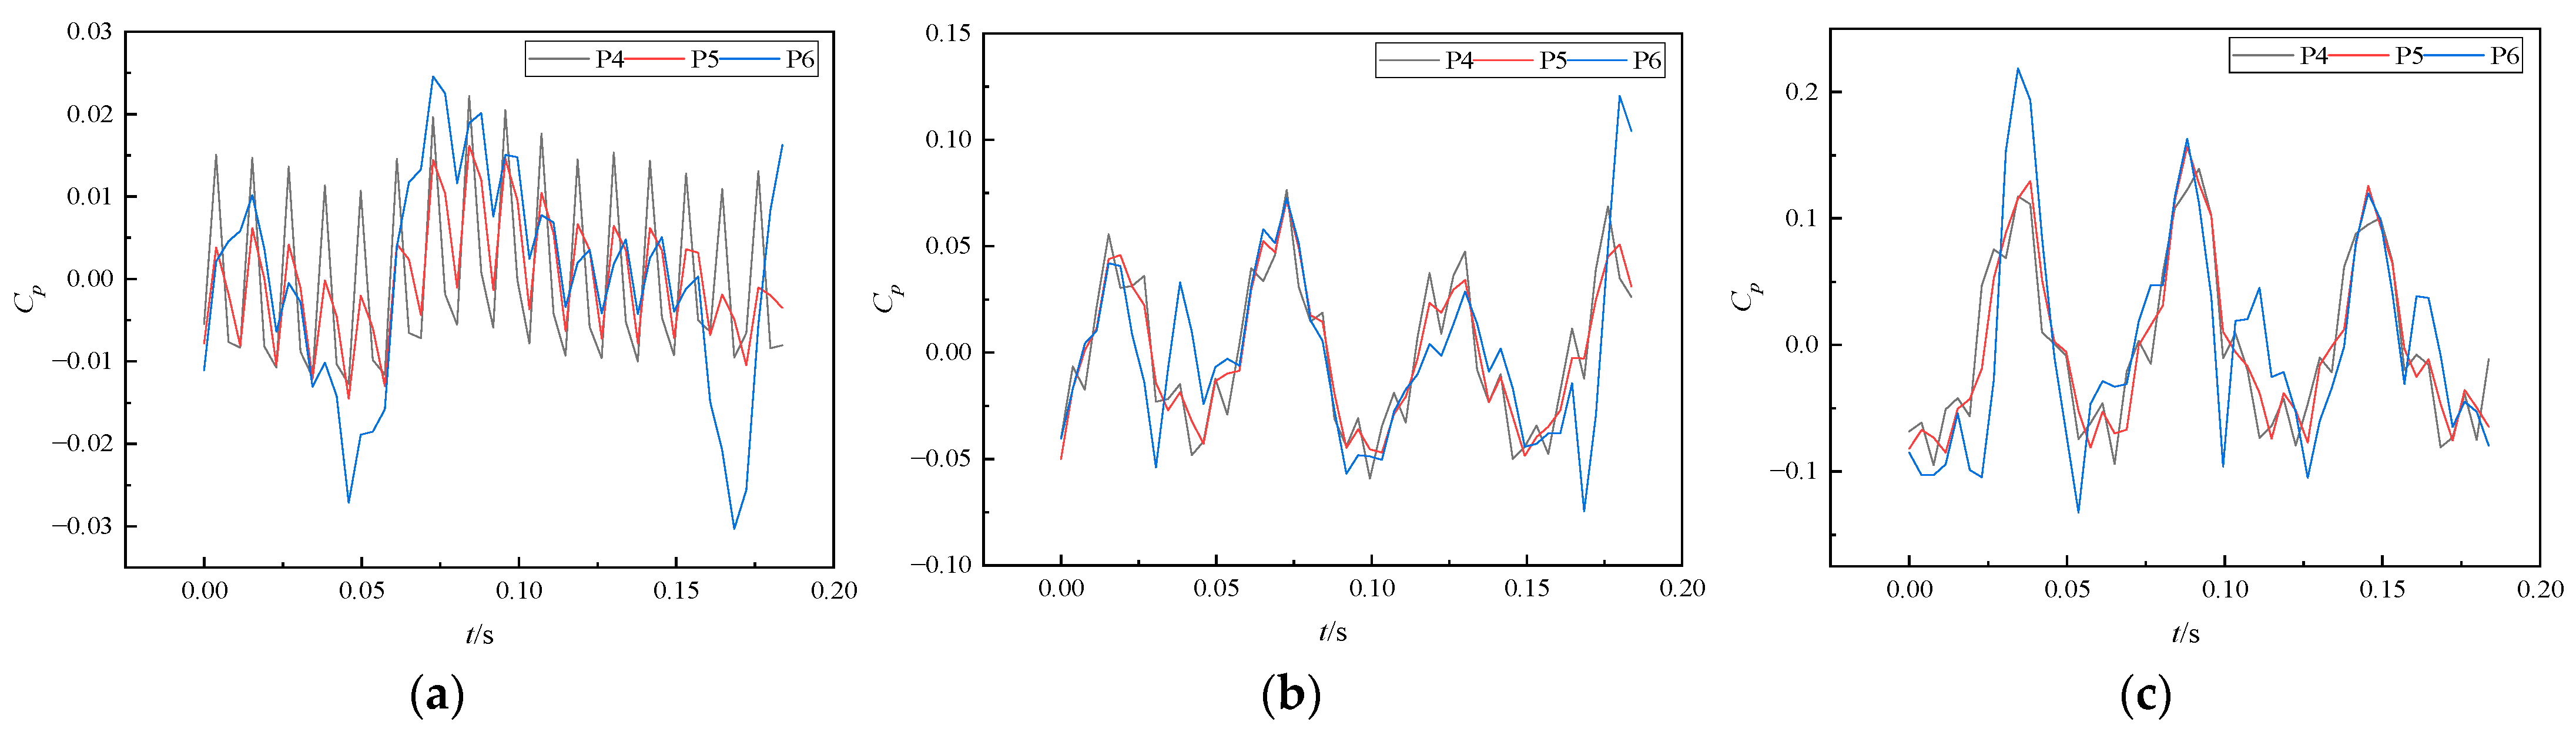
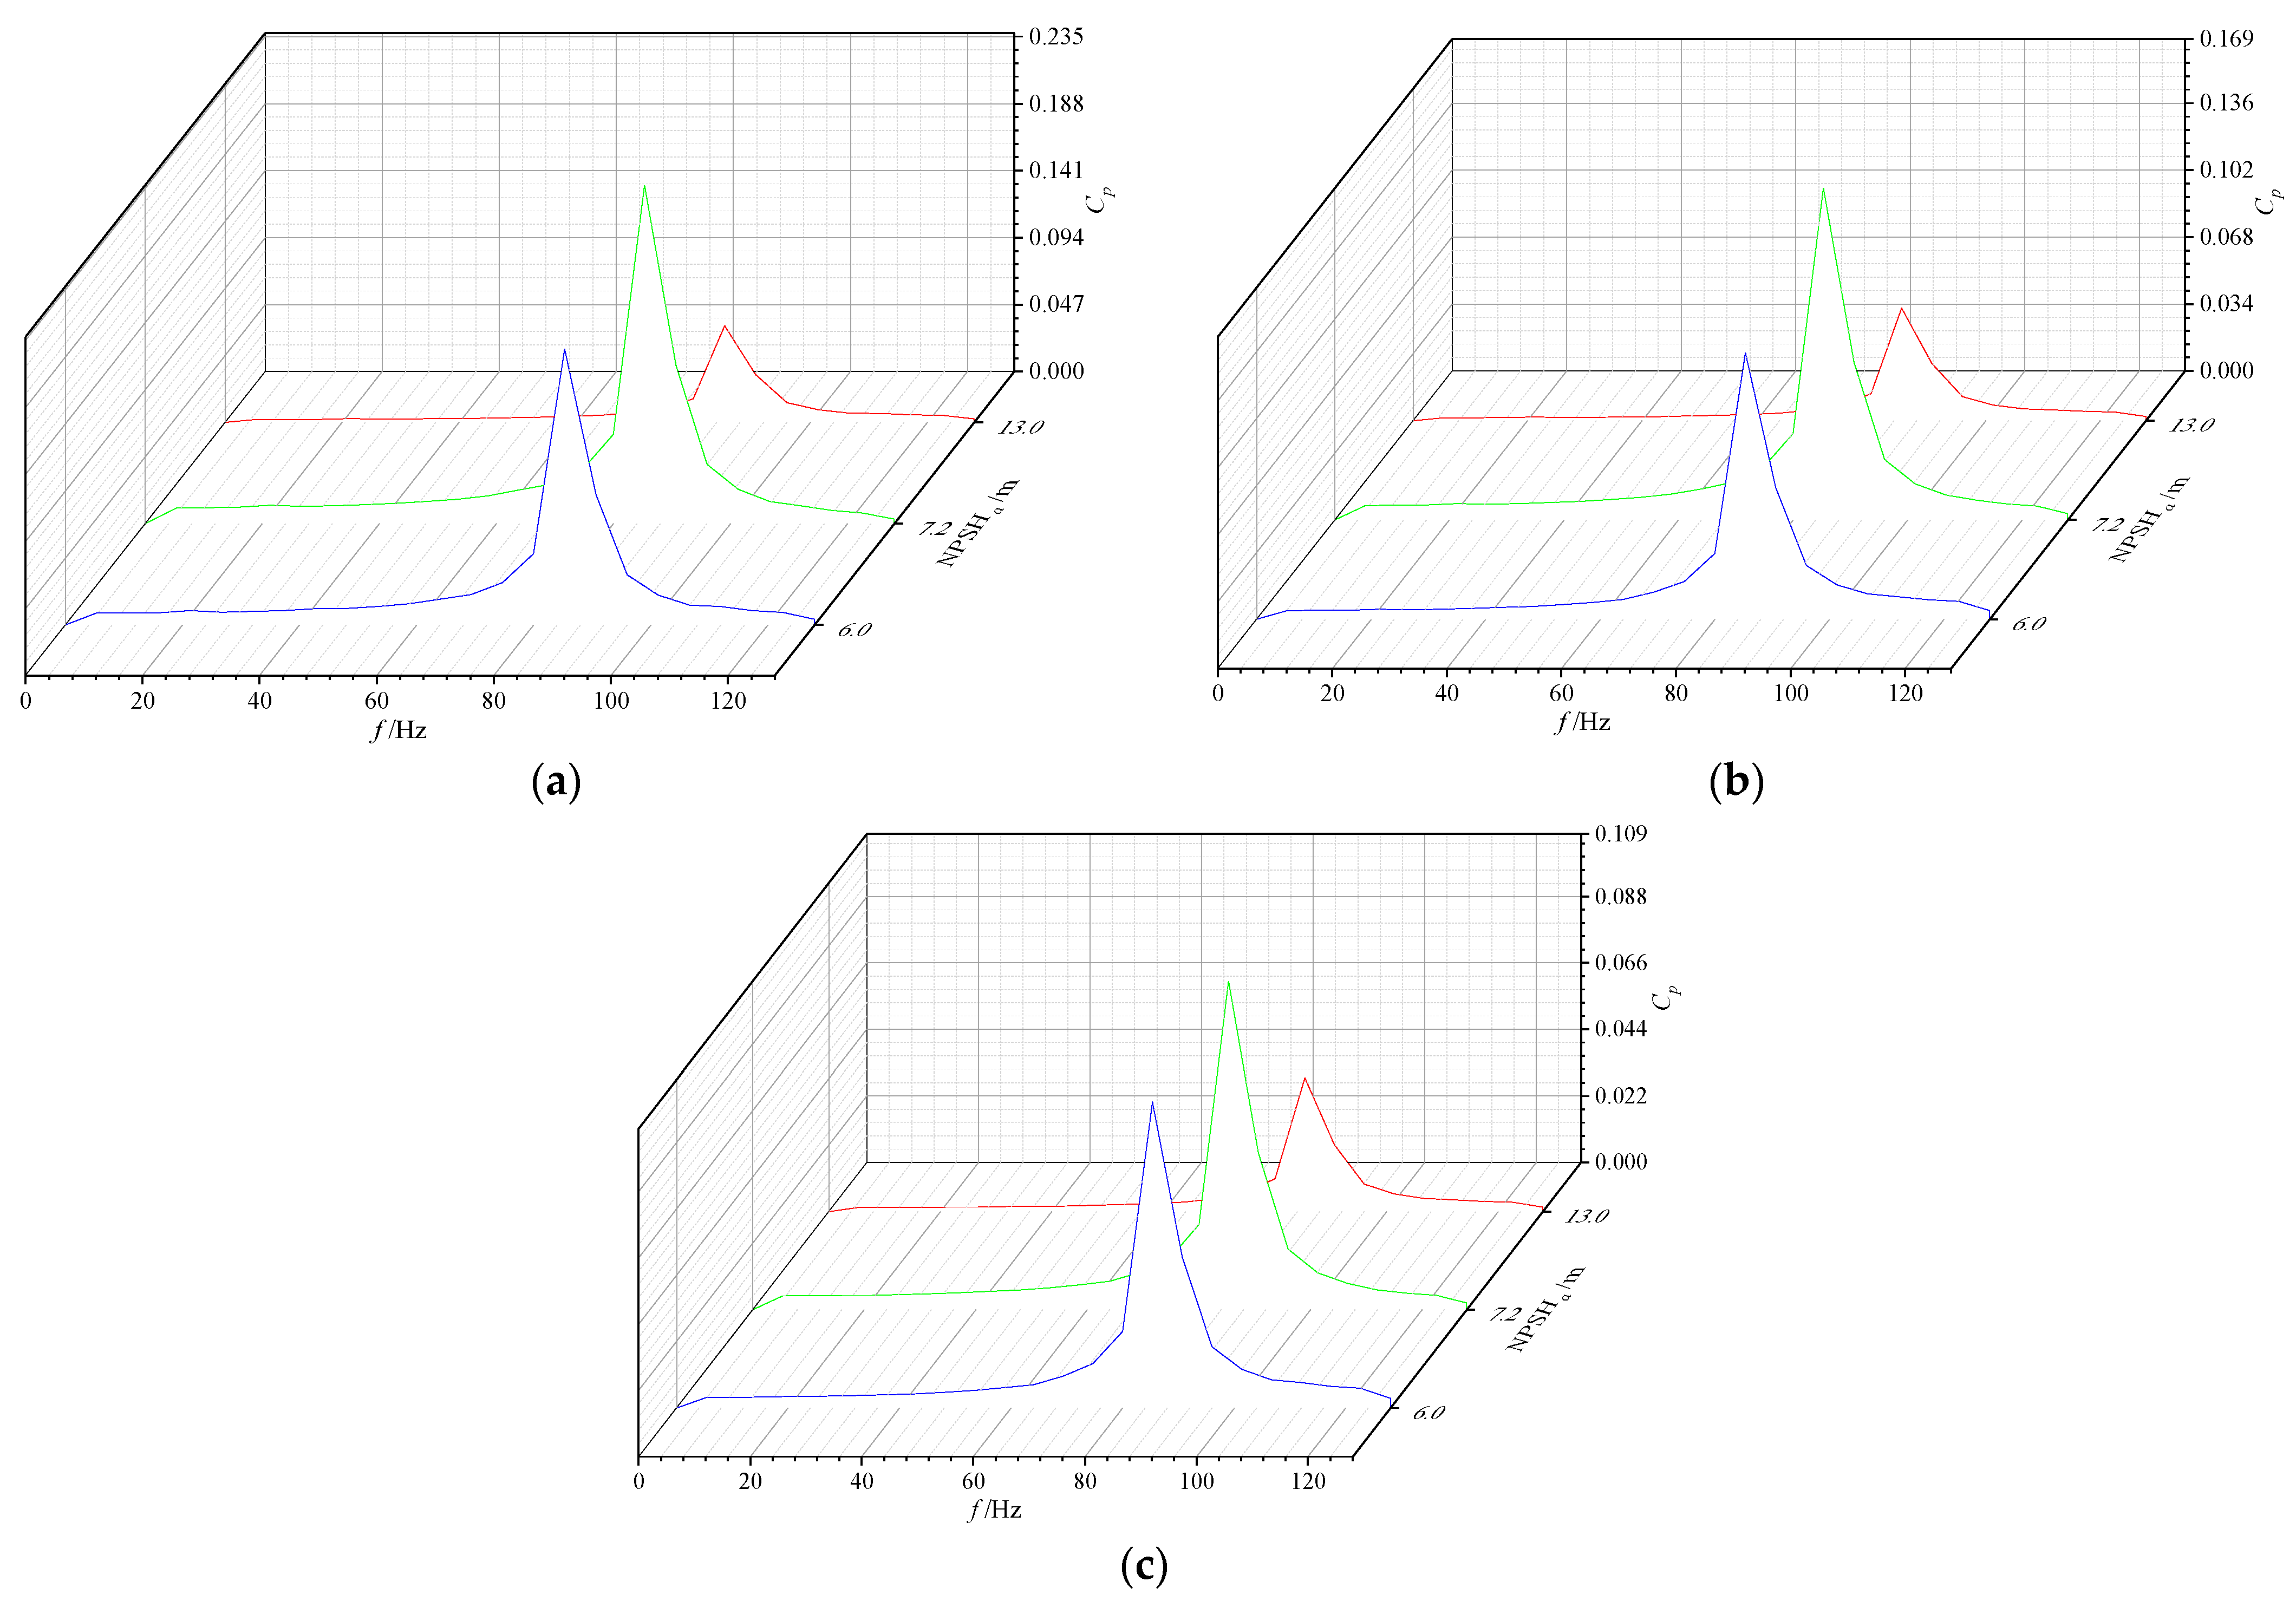
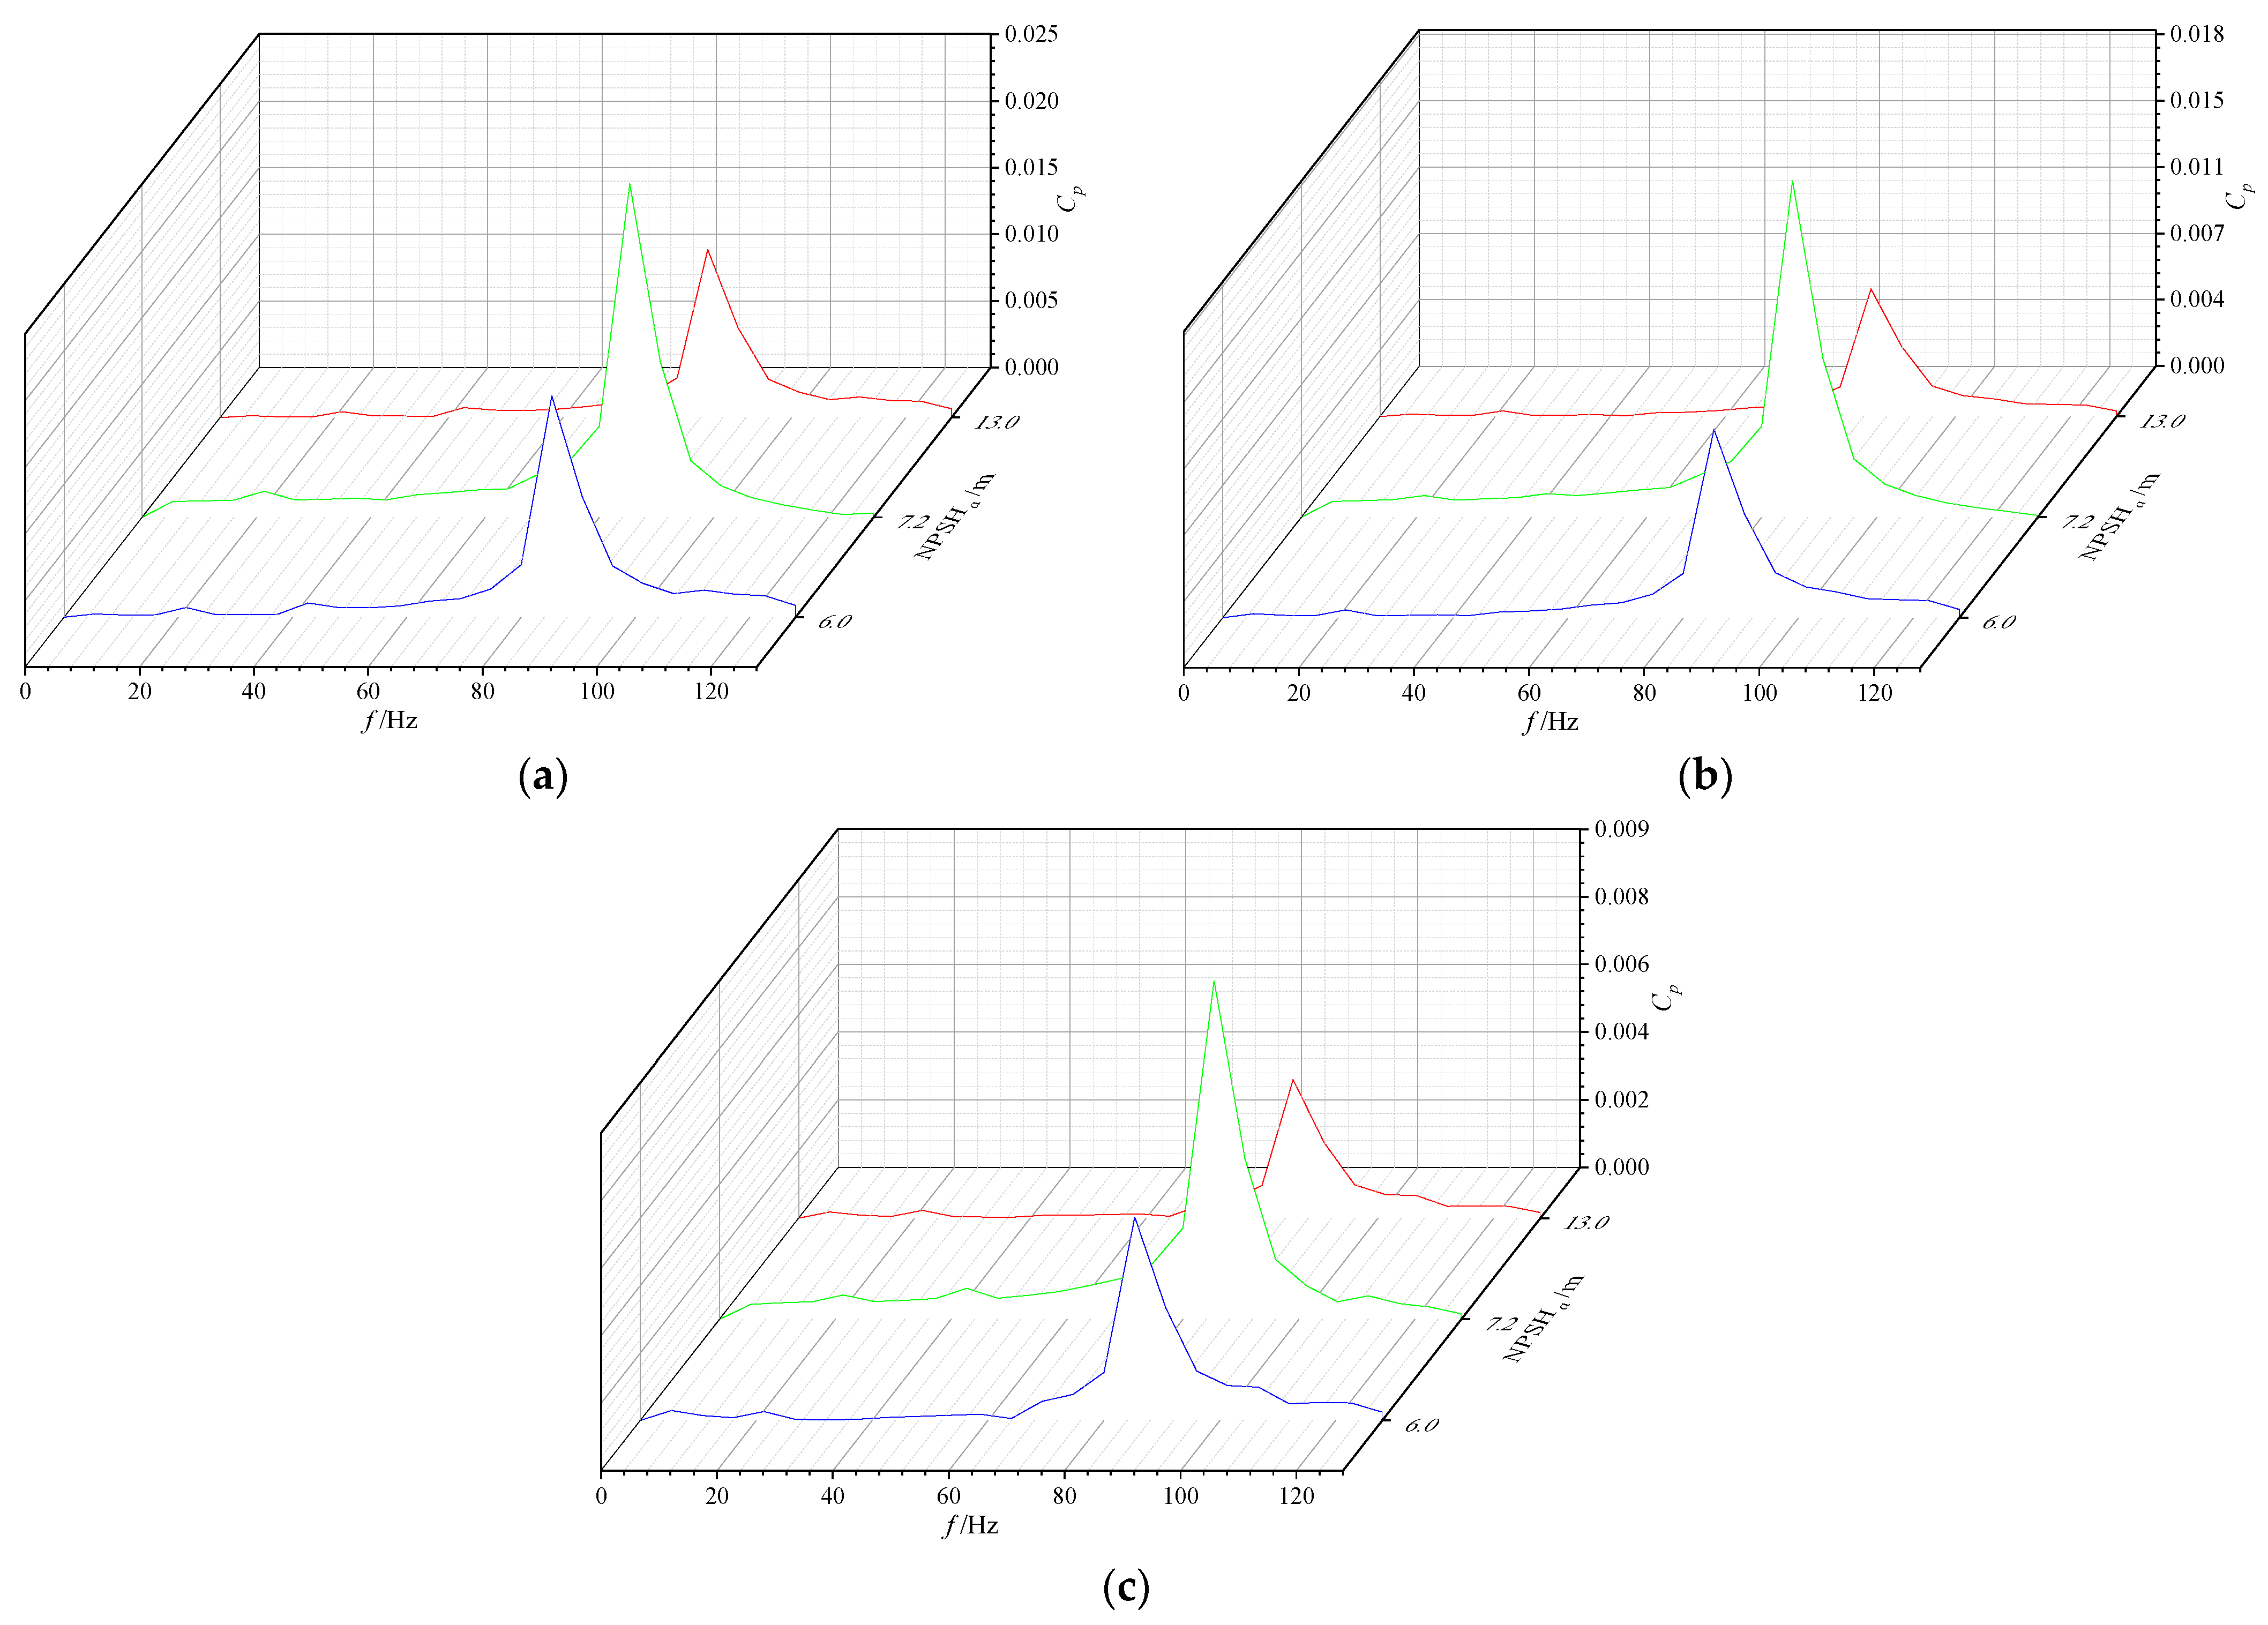
- During the cavitation process at different flow rates, P3 near the hub exhibits the smallest pressure pulsation amplitude, while the amplitude at P1 near the shroud is the largest among the impeller inlet monitoring points, revealing that the vibration at the impeller shroud inlet is more severe. The dominant frequency at the impeller inlet is the blade passing frequency. As the degree of cavitation gradually intensifies, the pulsation amplitude corresponding to the impeller rotation frequency keeps growing under conditions of 0.9 Qd and 1.0 Qd.
- (4)
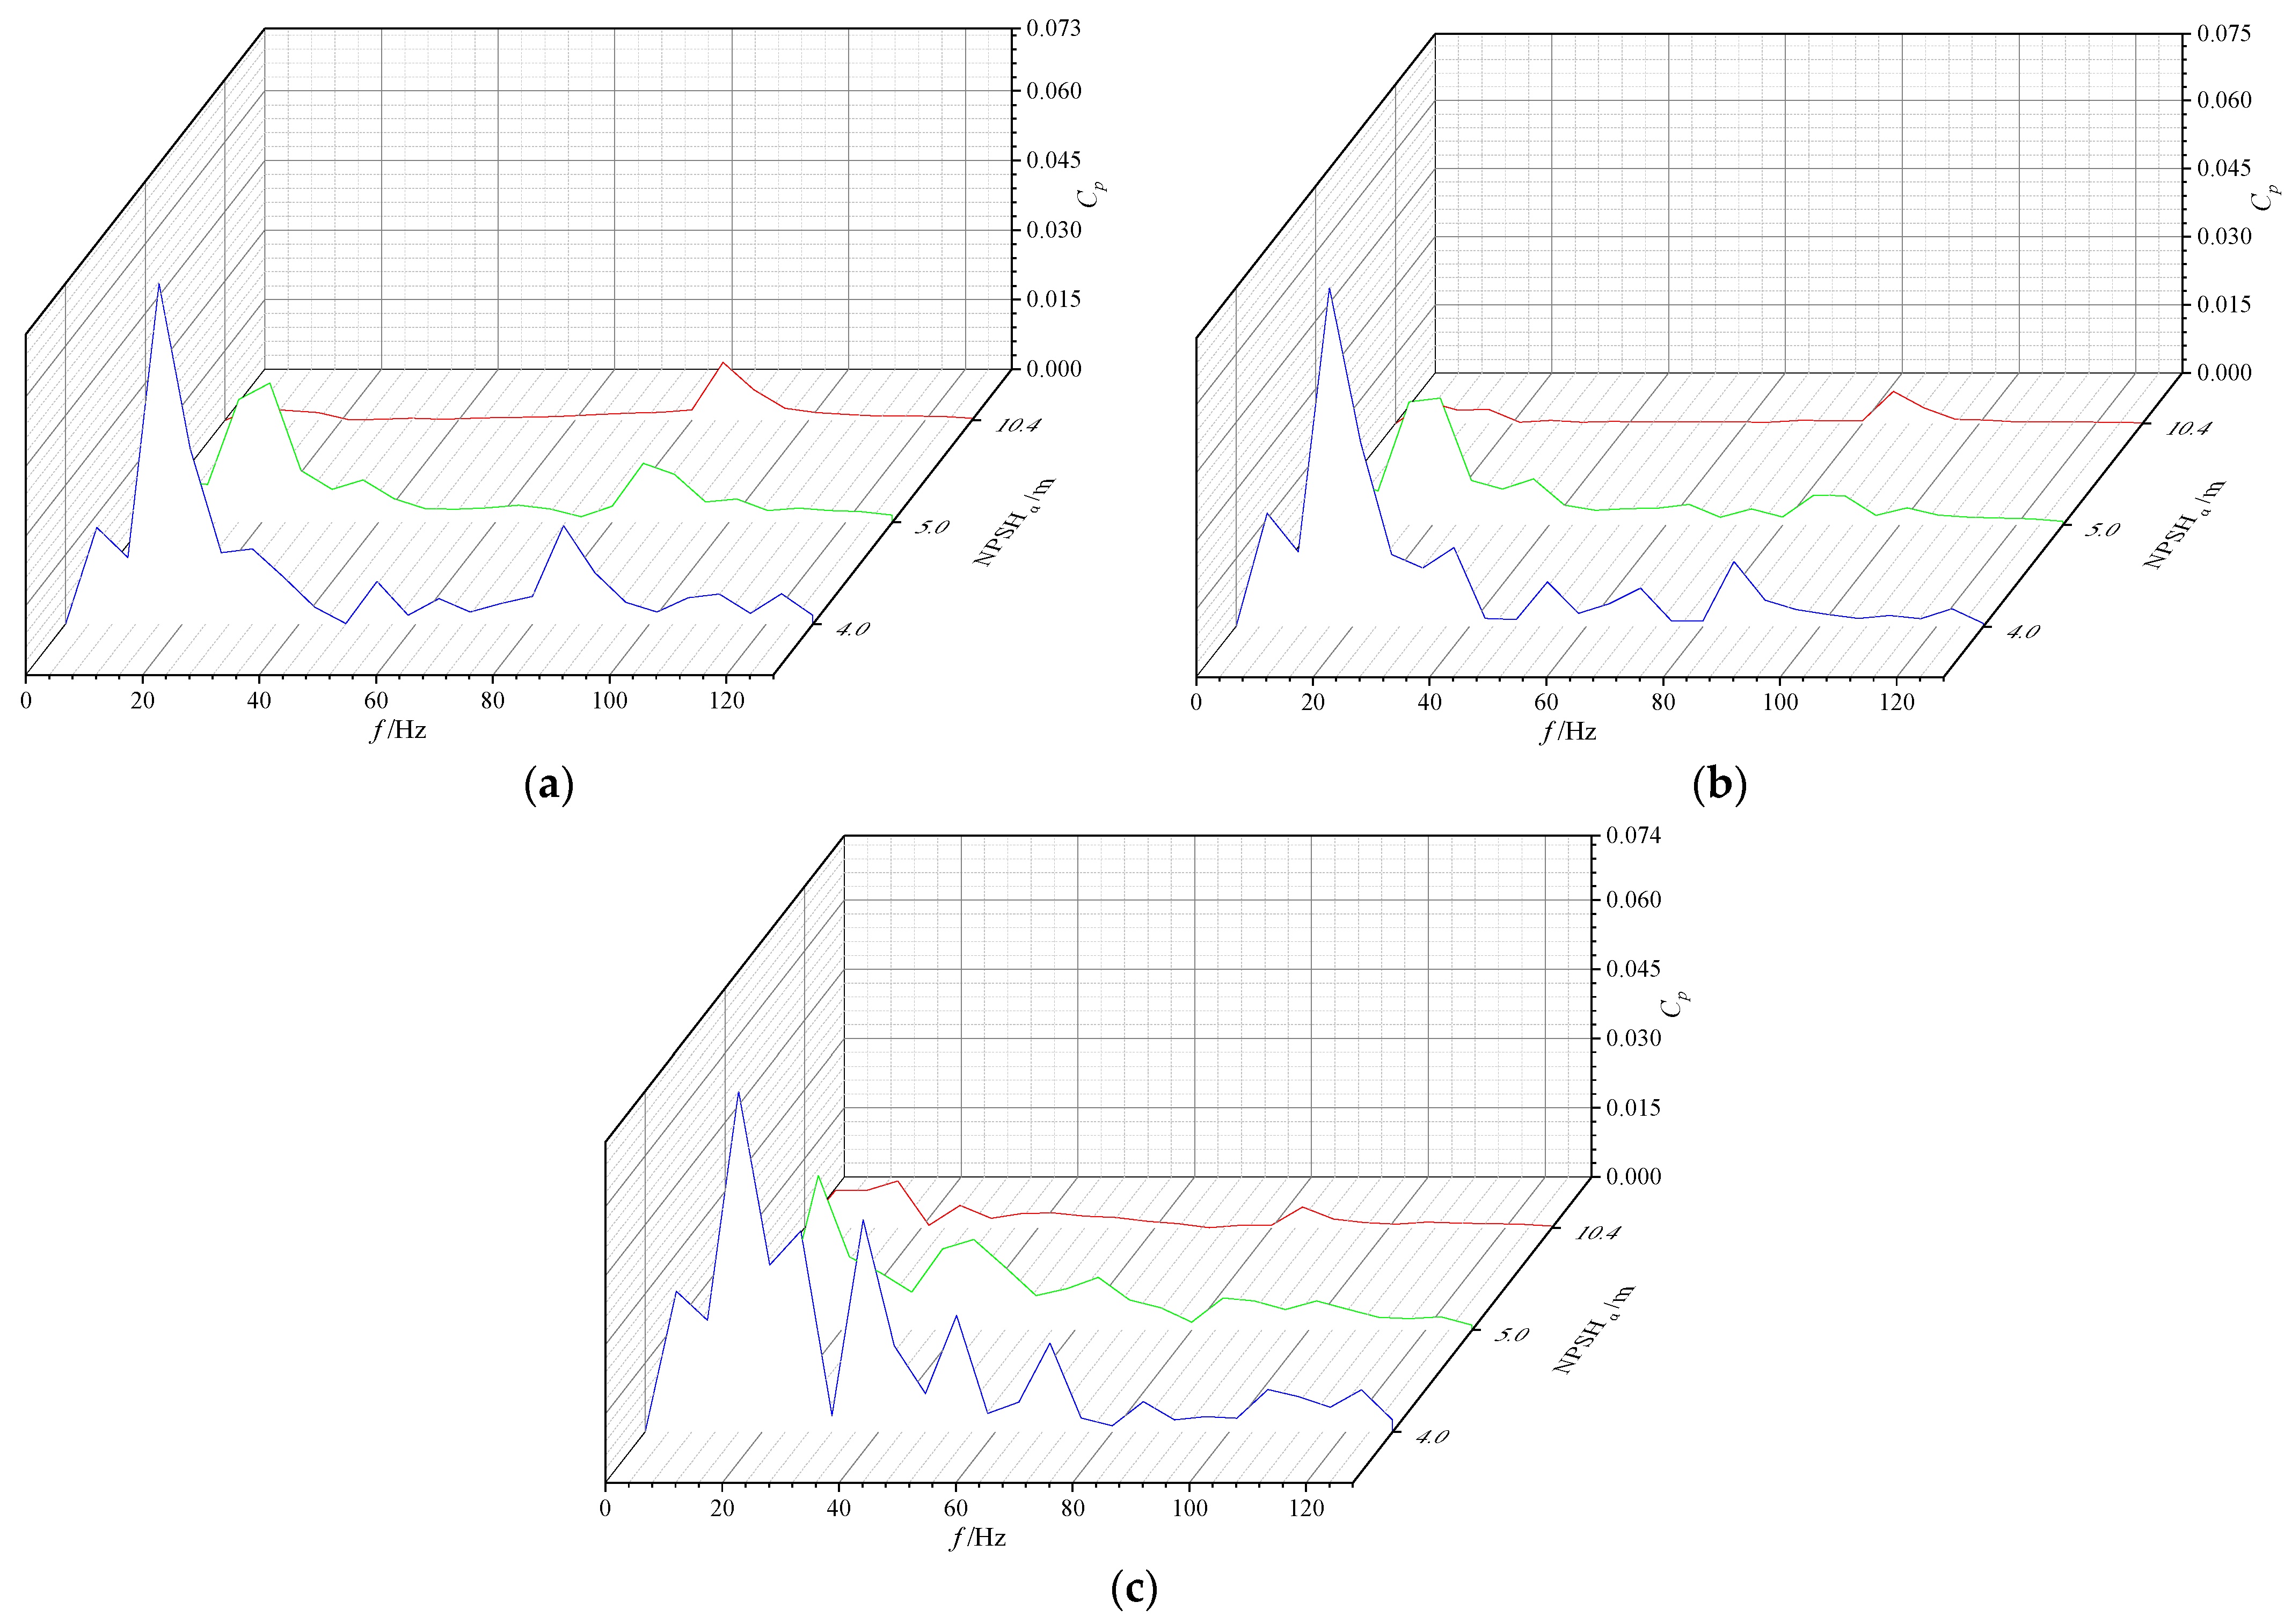
- At the growth stage of cavitation under conditions of 0.9 Qd and 1.0 Qd, the dominant frequency at the impeller outlet is primarily the blade passing frequency. As the severity of cavitation increases, the dominant frequency transforms into the impeller rotation frequency, accompanied by a sharp increase in amplitude. However, for the blade passing frequency, the increase is minimal, implying that the impeller blade has a relatively small influence on pressure pulsations at the outlet at this period. Under the operating condition of 1.1 Qd, the dominant frequency of pressure pulsation remains the blade passing frequency, unaffected by the intensification of cavitation.
Author Contributions
Funding
Data Availability Statement
Conflicts of Interest
Nomenclature
| Qd | Rated flow rate, L/s |
| n | Rated rotational speed, r/min |
| D | Impeller diameter, mm |
| Zi | The number of impeller blades |
| θ | The blade angle, ° |
| Zg | The number of guide vane blades |
| H | Head, m |
| η | Hydraulic efficiency, % |
| NPSHa | The available net positive suction head, m |
| NPSHc | The critical net positive suction head, m |
| Cp | Pressure coefficient |
References
- Wasinarom, K.; Boonchauy, D.; Noosomton, J.; Charoensuk, J. Improvement of Discharge Flow Structure by Bluff-Body Insert and Size Reduction of a Mixed-Flow Irrigation Pump. J. Irrig. Drainage Eng. 2022, 148, 04021072. [Google Scholar] [CrossRef]
- Zindani, D.; Roy, A.K.; Kumar, K. Design of mixed flow pump impeller blade using mean streamline theory and its analysis. Sci. Iran. 2020, 27, 350–360. [Google Scholar] [CrossRef]
- Ye, W.X.; Ikuta, A.; Chen, Y.N.; Miyagawa, K.; Luo, X.W. Investigation on the effect of forward skew angle blade on the hump characteristic in a mixed flow pump using modified partially averaged Navier-Stokes model. Renew. Energy 2021, 170, 118–132. [Google Scholar] [CrossRef]
- Heo, M.W.; Kim, K.Y.; Kim, J.H.; Choi, Y.S. High-efficiency design of a mixed-flow pump using a surrogate model. J. Mech. Sci. Technol. 2016, 30, 541–547. [Google Scholar] [CrossRef]
- Srivastava, S.; Roy, A.K.; Kumar, K. Design validation & stress analysis of mixed flow pump impeller blades under applied uniformly distributed and uniformly varying loads. In Proceedings of the 7th International Conference of Materials Processing and Characterization (ICMPC), Hyderabad, India, 17–19 March 2017; pp. 4646–4652. [Google Scholar]
- Guan, X.F. Modern Pumps Theory and Design; Aerospace Press: Beijing, China, 2011; ISBN 978-780-218-942-3. [Google Scholar]
- Al-Obaidi, A.R. Investigation of effect of pump rotational speed on performance and detection of cavitation within a centrifugal pump using vibration analysis. Heliyon 2019, 5, e01910. [Google Scholar] [CrossRef] [PubMed]
- Dönmez, A.H.; Yumurtaci, Z.; Kavurmacioglu, L. The Effect of Inlet Blade Angle Variation on Cavitation Performance of a Centrifugal Pump: A Parametric Study. J. Fluids Eng. Trans. ASME 2019, 141, 021101. [Google Scholar] [CrossRef]
- Jaiswal, A.K.; Rehman, A.U.; Paul, A.R.; Jain, A. Detection of Cavitation through Acoustic Generation in Centrifugal Pump Impeller. J. Appl. Fluid Mech. 2019, 12, 1103–1113. [Google Scholar] [CrossRef]
- Murovec, J.; Curovic, L.; Novakovic, T.; Prezelj, J. Psychoacoustic approach for cavitation detection in centrifugal pumps. Appl. Acoust. 2020, 165, 107323. [Google Scholar] [CrossRef]
- Mousmoulis, G.; Kassanos, I.; Aggidis, G.; Anagnostopoulos, I. Numerical simulation of the performance of a centrifugal pump with a semi-open impeller under normal and cavitating conditions. Appl. Math. Model. 2021, 89, 1814–1834. [Google Scholar] [CrossRef]
- Zhang, H.Y.; Meng, F.; Zheng, Y.H.; Li, Y.J. The Cavitation-Induced Pressure Fluctuations in a Mixed-Flow Pump under Impeller Inflow Distortion. Machines 2021, 9, 326. [Google Scholar] [CrossRef]
- Wu, Y.Z.; Guan, X.; Tao, R.; Xiao, R.F. Neural Network-Based Analysis on the Unusual Peak of Cavitation Performance of a Mixed Flow Pipeline Pump. Iran. J. Sci. Technol.-Trans. Mech. Eng. 2023, 47, 1515–1533. [Google Scholar] [CrossRef]
- Gong, B.; Feng, C.; Chen, W.G.; Li, N.; Ouyang, X.P.; Yin, J.L.; Wang, D.Z. Experimental on spatial-temporal evolution characteristics of the blade cavitation in a mixed flow waterjet pump. Appl. Ocean Res. 2024, 149, 103993. [Google Scholar] [CrossRef]
- Oh, H.W. Design parameter to improve the suction performance of mixed-flow pump impeller. Proc. Inst. Mech. Eng. Part A J. Power Energy 2010, 224, 881–887. [Google Scholar] [CrossRef]
- Xu, Y.; Tan, L.; Liu, Y.B.; Cao, S.L. Pressure fluctuation and flow pattern of a mixed-flow pump with different blade tip clearances under cavitation condition. Adv. Mech. Eng. 2017, 9, 1687814017696227. [Google Scholar] [CrossRef]
- Kim, Y.I.; Kim, S.; Yang, H.M.; Lee, K.Y.; Choi, Y.S. Analysis of internal flow and cavitation characteristics for a mixed-flow pump with various blade thickness effects. J. Mech. Sci. Technol. 2019, 33, 3333–3344. [Google Scholar] [CrossRef]
- Zhang, D.S.; Zhou, Q.; Gu, Q.; Zhang, G.J.; Xu, B.; Geng, L.L.; van Esch, B. Experimental and Numerical Investigation on the Transient Cavitating Flows in a Mixed Flow Pump with Different Number of Blades at Startup. J. Fluids Eng. Trans. ASME 2022, 144, 051204. [Google Scholar] [CrossRef]
- Kim, Y.I.; Yang, H.M.; Suh, J.W.; Kim, S.; Lee, K.Y.; Choi, Y.S. Numerical study on the cavitation phenomenon for the head drop and unsteady bubble patterns with a difference in the incidence angle of a mixed-flow pump. Adv. Mech. Eng. 2020, 12, 1687814020914790. [Google Scholar] [CrossRef]
- Kim, Y.I.; Kim, S.; Lee, K.Y.; Choi, Y.S. Effect of incidence angle on cavity blockage and flow stability in the net positive suction head drop of mixed-flow pumps. Proc. Inst. Mech. Eng. Part C J. Mech. Eng. Sci. 2021, 235, 3900–3922. [Google Scholar] [CrossRef]
- Kim, Y.I.; Yang, H.M.; Lee, K.Y.; Choi, Y.S. Numerical Investigation on Blockage-Related Cavitation Surge and Pressure Gain of a Mixed-Flow Pump with Influence of Blade Leading Edge Shape on Suction Performance. J. Fluids Eng. Trans. ASME 2022, 144, 091205. [Google Scholar] [CrossRef]
- Bonaiuti, D.; Zangeneh, M.; Aartojarvi, R.; Eriksson, J. Parametric Design of a Waterjet Pump by Means of Inverse Design, CFD Calculations and Experimental Analyses. J. Fluids Eng. Trans. ASME 2010, 132, 031104. [Google Scholar] [CrossRef]
- Suh, J.W.; Yang, H.M.; Kim, Y.I.; Lee, K.Y.; Kim, J.H.; Joo, W.G.; Choi, Y.S. Multi-objective optimization of a high efficiency and suction performance for mixed-flow pump impeller. Eng. Appl. Comp. Fluid Mech. 2019, 13, 744–762. [Google Scholar] [CrossRef]
- Ye, C.; Wang, C.; Yan, H.; Wang, F.; Zheng, Y.; van Esch, B.P.M. Investigation on transition characteristics of laminar separation bubble on a hydrofoil. Phys. Fluids 2023, 35, 105154. [Google Scholar] [CrossRef]
- Kim, S.; Kim, Y.I.; Kim, J.H.; Choi, Y.S. Three-objective optimization of a mixed-flow pump impeller for improved suction performance and efficiency. Adv. Mech. Eng. 2019, 11, 1687814019898969. [Google Scholar] [CrossRef]
- Kim, S.; Kim, Y.I.; Kim, J.Y.; Choi, Y.S.O. Design optimization for mixed-flow pump impeller by improved suction performance and efficiency with variables of specific speeds. J. Mech. Sci. Technol. 2020, 34, 2377–2389. [Google Scholar] [CrossRef]
- Huang, R.F.; Wang, Y.W.; Du, T.Z.; Luo, X.W.; Zhang, W.; Dai, Y.X. Mechanism analyses of the unsteady vortical cavitation behaviors for a waterjet pump in a non-uniform inflow. Ocean Eng. 2021, 233, 108798. [Google Scholar] [CrossRef]
- Huang, R.F.; Qiu, R.D.; Wang, Y.W.; Luo, X.W.; Zhang, W. Space-time frequency spectra analyses of the unsteady cavitating vortical flows inside a mixed-flow pump. Ocean Eng. 2021, 238, 109758. [Google Scholar] [CrossRef]
- Xu, W.T.; Cheng, L.; Lei, S.H.; Yu, L.; Jiao, W.X. Mixed-flow pump cavitation characteristics extraction based on power spectrum density through pressure pulsation signal analysis. Mech. Syst. Signal Proc. 2024, 208, 110904. [Google Scholar] [CrossRef]
- Han, Y.D.; Tan, L. Spatial-temporal evolution of tip leakage cavitation with double-hump in a mixed flow pump with tip clearance. Phys. Fluids 2023, 35, 045152. [Google Scholar] [CrossRef]
- Han, Y.D.; Tan, L. Experimental investigation on spatial-temporal evolution of tip leakage cavitation in a mixed flow pump with tip clearance. Int. J. Multiph. Flow 2023, 164, 104445. [Google Scholar] [CrossRef]
- Li, W.; Liu, M.; Ji, L.; Li, S.; Song, R.; Wang, C.; Cao, W.; Agarwal, R.K. Study on the trajectory of tip leakage vortex and energy characteristics of mixed-flow pump under cavitation conditions. Ocean Eng. 2023, 267, 113225. [Google Scholar] [CrossRef]
- Li, W.; Li, H.M.; Liu, M.J.; Ji, L.L.; Agarwal, R.K.; Jin, S.Y. Energy dissipation mechanism of tip-leakage cavitation in mixed-flow pump blades. Phys. Fluids 2024, 36, 015115. [Google Scholar] [CrossRef]
- Lu, Y.P.; Tan, L.; Han, Y.D.; Liu, M. Cavitation-vibration correlation of a mixed flow pump under steady state and fast start-up conditions by experiment. Ocean Eng. 2022, 251, 111158. [Google Scholar] [CrossRef]
- Hao, Y.; Tan, L. Symmetrical and unsymmetrical tip clearances on cavitation performance and radial force of a mixed flow pump as turbine at pump mode. Renew. Energy 2018, 127, 368–376. [Google Scholar] [CrossRef]
- Yang, H.M.; Lee, K.Y.; Kim, J.H.; Choi, Y.S. Analysis of performance variation with cavitation test for a mixed-flow pump. In Proceedings of the 2017 AWG-IAHR Symposium on Hydraulic Machinery and Systems, Beijing, China, 16–19 November 2017. [Google Scholar]
- Yang, H.M.; Lee, K.Y.; Kim, J.H.; Choi, Y.S. Vibration and flow characteristics near cavitation occurrence in mixed-flow pump. In Proceedings of the 29th IAHR Symposium on Hydraulic Machinery and Systems (IAHR), Kyoto, Japan, 16–21 September 2019. [Google Scholar]
- Liu, T.Y.; Zhu, J.S.; Wang, Z.L.; Geng, H.H.; Zhu, H.L. Experimental Study on Cavitation Noise Characteristics of a Hydraulic Model of Mixed-Flow Pump. IEEE Access 2023, 11, 111274–111280. [Google Scholar] [CrossRef]
- Ye, C.L.; An, D.S.; Huang, W.R.; Heng, Y.G.; Zheng, Y. Investigation on Stall Characteristics of Centrifugal Pump with Guide Vanes. Water 2023, 15, 21. [Google Scholar] [CrossRef]
- Menter, F.R. Two-equation eddy-viscosity turbulence models for engineering applications. AIAA J. 1994, 32, 1598–1605. [Google Scholar] [CrossRef]
- Bakir, F.; Rey, R.; Gerber, A.G.; Belamri, T.; Hutchinson, B. Numerical and Experimental Investigations of the Cavitating Behavior of an Inducer. Int. J. Rotating Mach. 2004, 10, 15–25. [Google Scholar] [CrossRef]
- Ye, C.L.; Xia, K.G.; Yan, H.Y.Y.; Cao, S.Y.; Wang, Z.Z.; Tian, Q.B.; van Esch, B.P.M.; Zheng, Y.; Yang, C.X. Study on the influence of volute structure on the performance of seawater-pumped storage hydropower plant unit. J. Energy Storage 2024, 90, 111848. [Google Scholar] [CrossRef]
- Kaya, M.; Ayder, E. Prediction of Cavitation Performance of Radial Flow Pumps. J. Appl. Fluid Mech. 2017, 10, 1397–1408. [Google Scholar] [CrossRef]
- Zhao, H.; Wang, F.; Wang, C.; Ye, C.; Yao, Z.; Zhong, Q. A modified VLES model for simulation of rotating separation flow in axial flow rotating machinery. J. Hydrodyn. 2022, 34, 570–584. [Google Scholar] [CrossRef]
- Li, G.Y.; Ding, X.H.; Wu, Y.B.; Wang, S.R.; Li, D.; Yu, W.J.; Wang, X.Z.; Zhu, Y.H.; Guo, Y.T. Liquid-vapor two-phase flow in centrifugal pump: Cavitation, mass transfer, and impeller structure optimization. Vacuum 2022, 201, 111102. [Google Scholar] [CrossRef]
- Cao, J.W.; Luo, Y.Y.; Presas, A.; Mao, Z.Y.; Wang, Z.W. Numerical analysis on the modal characteristics of a pumped storage unit runner in cavitating flow. J. Energy Storage 2022, 56, 105998. [Google Scholar] [CrossRef]
- Kan, K.; Zheng, Y.; Chen, Y.; Xie, Z.; Yang, G.; Yang, C. Numerical study on the internal flow characteristics of an axial-flow pump under stall conditions. J. Mech. Sci. Technol. 2018, 32, 4683–4695. [Google Scholar] [CrossRef]
- Yan, H.; Heng, Y.G.; Zheng, Y.; Tao, R.; Ye, C.L. Investigation on Pressure Fluctuation of the Impellers of a Double-Entry Two-Stage Double Suction Centrifugal Pump. Water 2022, 14, 4065. [Google Scholar] [CrossRef]
- Al-Obaidi, A.R. Detection of Cavitation Phenomenon within a Centrifugal Pump Based on Vibration Analysis Technique in both Time and Frequency Domains. Exp. Technol. 2020, 44, 329–347. [Google Scholar] [CrossRef]
- Sonawat, A.; Kim, S.; Ma, S.B.; Kim, S.J.; Lee, J.B.; Yu, M.S.; Kim, J.H. Investigation of unsteady pressure fluctuations and methods for its suppression for a double suction centrifugal pump. Energy 2022, 252, 124020. [Google Scholar] [CrossRef]


| Qd (L/s) | n (r/min) | D (mm) | Zi | θ (°) | Zg |
|---|---|---|---|---|---|
| 295.92 | 1306 | 320 | 4 | −2 | 7 |
| Scheme | 1 | 2 | 3 |
|---|---|---|---|
| grid elements (million) | 1.05 | 2.69 | 3.58 |
| H (m) | 10.64 | 10.71 | 10.73 |
| Item | Setting |
|---|---|
| inlet boundary condition | total pressure inlet |
| outlet boundary condition | mass flow outlet |
| the reference pressure | 0 Pa |
| the interfaces between rotating and stationary domains | frozen rotor interface |
| the solid walls | no slip wall |
| Variable | Measuring Instrument | Measurement Accuracy |
|---|---|---|
| flow rate (m3/s) | electromagnetic flowmeter | ±0.2% |
| pressure difference between the inlet and outlet of the pump (Pa) | differential pressure transmitter | ±0.1% |
| rotational speed (r/min) | torque and speed sensor | ±0.1% |
| torque (N∙m) | torque and speed sensor | ±0.1% |
Disclaimer/Publisher’s Note: The statements, opinions and data contained in all publications are solely those of the individual author(s) and contributor(s) and not of MDPI and/or the editor(s). MDPI and/or the editor(s) disclaim responsibility for any injury to people or property resulting from any ideas, methods, instructions or products referred to in the content. |
© 2024 by the authors. Licensee MDPI, Basel, Switzerland. This article is an open access article distributed under the terms and conditions of the Creative Commons Attribution (CC BY) license (https://creativecommons.org/licenses/by/4.0/).
Share and Cite
Yang, X.; Zhu, J.; Zhang, Y.; Chen, B.; Tang, Y.; Jiang, R.; Kan, K.; Ye, C.; Zheng, Y. Study on the Cavitation Performance in the Impeller Region of a Mixed-Flow Pump Under Different Flow Rates. Water 2024, 16, 3195. https://doi.org/10.3390/w16223195
Yang X, Zhu J, Zhang Y, Chen B, Tang Y, Jiang R, Kan K, Ye C, Zheng Y. Study on the Cavitation Performance in the Impeller Region of a Mixed-Flow Pump Under Different Flow Rates. Water. 2024; 16(22):3195. https://doi.org/10.3390/w16223195
Chicago/Turabian StyleYang, Xu, Jianzhong Zhu, Yi Zhang, Buqing Chen, Yiping Tang, Rui Jiang, Kan Kan, Changliang Ye, and Yuan Zheng. 2024. "Study on the Cavitation Performance in the Impeller Region of a Mixed-Flow Pump Under Different Flow Rates" Water 16, no. 22: 3195. https://doi.org/10.3390/w16223195
APA StyleYang, X., Zhu, J., Zhang, Y., Chen, B., Tang, Y., Jiang, R., Kan, K., Ye, C., & Zheng, Y. (2024). Study on the Cavitation Performance in the Impeller Region of a Mixed-Flow Pump Under Different Flow Rates. Water, 16(22), 3195. https://doi.org/10.3390/w16223195