Article

The Effect of Dam Break Speed on Flood Evolution in a Downstream Reservoir of a Cascade Reservoir System

1
State Key Laboratory of Hydraulics and Mountain River Engineering, Sichuan University, Chengdu 610065, China
2
Power China Huadong Engineering Corporation Limited, Hangzhou 311122, China
*
Author to whom correspondence should be addressed.
Water 2024, 16(20), 2993; https://doi.org/10.3390/w16202993
Submission received: 28 September 2024 / Revised: 15 October 2024 / Accepted: 17 October 2024 / Published: 20 October 2024

Abstract

:
The dam break flood is one of the potential causes of catastrophic events in cascade hydropower hub groups. Investigating the movement patterns of dam break flooding among reservoir groups under different dam break speeds is crucial for flood prevention and emergency response. In this study, the evolution characteristics of dam break floods were investigated in a cascading reservoir system, focusing on different break speeds of the upstream dam. The results indicate that the dam break speed determines the concavity or convexity of the water level curve changes in the upstream reservoir. Accordingly, dam breaks are classified into three modes: instant dam break, fast dam break, and slow dam break. An approximate critical speed has been identified to differentiate between the fast dam break and slow dam break. Further investigation into the evolution patterns of dam break floods in downstream reservoirs under different break modes was conducted. Correspondingly, the flood peak discharge and peak arrival time of the dam break floods vary differently with break speed under different break modes. Finally, a theoretical analysis for the flood peak discharge at the dam site during gradual dam break at a certain speed was established, which is able to predict the over-dam flood peak discharge in fast and slow dam break modes. This study is based on a combination of laboratory flume experiments and three-dimensional numerical simulations. This study has theoretical significance for the reinforcement of public infrastructure safety and the prevention of natural disasters.

1. Introduction

Catastrophic events in cascade hydropower hub groups may be triggered by extreme destruction from earthquakes, excessive floods, landslides, etc. Once a dam breaks, a large volume of water stored in the reservoir will rush downstream, causing flood waves to evolve rapidly and inflicting devastating disasters on downstream areas, impacting life, the economy, and the natural environment [1,2,3]. The characteristics of the outflow flood from the breach and its impact on downstream areas differ when the dam break speed varies. Based on this, this paper first designs an experimental system to simulate the gradual break of dams, enabling precise control of the break speed. Then, systematic experiments were conducted, in combination with three-dimensional numerical simulations, to examine the downstream evolution patterns of dam break floods when the upstream dam in a cascading reservoir system fails gradually at a specific speed.
Over the years, scholars from various countries have conducted extensive research on dam break floods. Ritter [4] first derived the analytical solution for flood depth and cross-sectional flow speed in a rectangular prismatic channel under instantaneous full break mode based on the characteristic line theory. Subsequent researchers have continuously improved and refined the Ritter solution by considering downstream water depth, riverbed slope, bed friction, cross-sectional shape, and other factors [5,6,7]. Hunt [8,9,10,11] approximated instantaneous break flood waves as kinematic waves under finite reservoir length conditions and derived solutions for dam break problems on dry and wet steep slopes using the kinematic wave approximation method. Wang et al. [12] obtained analytical solutions for one-dimensional instantaneous break flow on an inclined bottom under wet conditions using the characteristic line and cross-sectional shape parameter separation methods.
Physical model experiments are also a powerful tool for studying dam break floods, providing intuitive insights into the flow characteristics of dam break floods and validating analytical and numerical results [13,14,15,16]. Lauber et al. [17] conducted experimental studies on dam break flood evolution in dry rectangular prismatic channels under instantaneous break mode. Frazao et al. [18] investigated the flood flow of an instantaneous full break in 90° bend rectangular channels. LaRocque et al. [19] studied the velocity profile of dam break flow on a dry-bottomed riverbed using an ultrasonic Doppler velocimeter in a dam break test, and obtained spatiotemporal variation data of the flow field.
With the advancement of computer technology, numerical simulation has gradually become an important method for studying the evolution of dam break floods [20,21,22,23]. Elliot et al. [24] used the method of characteristics to numerically solve the evolution of dam break flood waves in bends. Wang et al. [25] employed the second-order TVD scheme and finite difference method to solve two-dimensional dam break flood problems. Peng et al. [26] applied the lattice Boltzmann model to dam break floods and ensured high accuracy. Additionally, numerical models have been widely used to simulate the evolution characteristics of instantaneous break floods in actual terrains, complex channels, and encounters with obstacles [27,28,29].
The above studies focus on the break of a single dam, without considering the effect of downstream dams in cascade reservoir systems on flood propagation. In recent years, researchers have also studied the cascade dam break problem, achieving some results [30,31]. Říha et al. [32] used three small earth dams on the Cižina River in the Czech Republic as case studies to investigate the flood evolution routes and peak discharge attenuation laws during cascade dam breaks. Xue et al. [33] conducted chain dam break experiments on cascade reservoirs, showing that flood evolution in cascade dam breaks exhibits significant amplification effects. Chen et al. [34] experimentally studied the movement patterns of dam break floods in downstream reservoirs following an instantaneous full break of an upstream dam, obtaining the maximum pressure load changes and pressure wave attenuation laws on the downstream dam surface. Zhang et al. [35] studied the blocking effect of unbroken dams in cascade reservoirs on upstream dam break floods. Additionally, Aureli et al. [36] provided a detailed review of cascade dam break studies, noting that many experiments assume that there are dry conditions downstream from the dam.
The literature review above reveals that existing studies on dam breaks predominantly focus on an idealized model where the dam break speed is assumed to be infinite, ignoring the actual dam break process. However, in real dam failures, especially for material dams like landslide dams, the break is more gradual [2]. Material dams typically require time to fail, and the gradual break process holds practical significance for the risk analysis of dam breaks in cascade reservoir systems.
Through this study, we aim to identify the evolution patterns, flow changes, and peak flood discharge of dam break floods in downstream reservoirs under different dam break speeds and analyze the trends in these parameters with respect to varying dam break speeds. The summarized patterns can serve as a theoretical foundation for predicting the damage potential of dam break floods and provide support for the formulation of effective flood control strategies to mitigate and reduce the losses caused by flood disasters, thereby minimizing the catastrophic impacts of dam break events.

2. Methodology

2.1. Experimental Setup

2.1.1. Experimental Model

The laboratory physical model experiments consist of a flume system and a measurement system. The experimental model is set up in the State Key Laboratory of Hydraulics and Mountain River Engineering at Sichuan University.
The flume system includes a water tank, a flume, a controllable moving rigid dam, and a return water system. The flume is designed with a total length of 20.0 m, a width of 0.5 m, and a height of 0.5 m. The walls are made of tempered glass. In this study, the bottom slope S0 = 0.0349.
Rigid dams with a height of 0.3 m, a width of 0.5 m, and a thickness of 6.5 cm are set at 7.80 m and 15.60 m downstream from the flume inlet (referred to as the upstream dam and downstream dam, respectively). The upstream dam is the breaking dam, simulating dam breaks at different speeds. It descends uniformly, assuming that the break includes the entire dam body and uniformly cuts down in the horizontal direction. The uniform descent of the dam structure is precisely controlled by components such as lifting platforms, motors, and controllers. In the experiment, the downstream dam does not collapse, and the initial water volume in the downstream reservoir is controlled by changing the water depth in front of the downstream dam (hd).
The study focuses on the water level time series of the dam break flood and the peak flood discharge in downstream reservoir. For this purpose, four water depth monitoring points (P1–P4) are set up in the upstream reservoir, and five discharge measurement sections (CS1–CS5) are set up in the downstream reservoir. The three-dimensional model of the experimental system and the locations of water level monitoring points and discharge measurement sections are shown in Figure 1.
During the experiments, the evolution and process of dam break floods throughout the entire flume are recorded using two GoPro11 cameras. The GoPro cameras are designed and engineered by GoPro Inc., an American company based in San Mateo, California. The GoPro11 cameras recorded at 30 frames per second with a resolution of 1920 × 1440. In order to capture clearer water flow patterns, white inorganic pigments (titanium dioxide mixture) were added to the experiment. This substance is fully dispersed in water and cannot easily precipitate, which will not affect the experimental results [21].
In the experiments, measuring the surface fluctuations of the dam break flood required careful consideration of the precision, range, and response frequency of the equipment. After comprehensive evaluation, the mic+100/IU/TC ultrasonic displacement sensor [37] is selected. This sensor has a range of 10 to 1000 mm, a response time of less than 70 × 10−4 s, and an accuracy within 0.18 mm, making it suitable for the requirements of this experiment. The sensor’s acquisition frequency is set to 100 Hz.

2.1.2. Experimental Design

Lauber et al. [38] proposed a time criterion for determining an instantaneous dam break. The critical judgment time top for an instantaneous break can be calculated using Equation (1). When the dam break time t is less than or equal to top, the dam can be considered to have broken instantaneously.
t op = 2 h u g
where top represents the critical judgment time for an instantaneous break; hu is the water depth in front of the upstream dam; g is the gravitational acceleration, which is taken as 9.81 m/s2 in this paper.
In this study, the dam break speed is expressed as u. However, to more intuitively measure the magnitude of the dam break speed, u is non-dimensionalized using Equation (2). The non-dimensionalized break speed is denoted as u*, which represents the ratio of the actual break speed of the dam to the critical speed of the theoretical instantaneous break mode.
u * = u H / t op
where u* is the non-dimensionalized dam break speed; u is the actual dam break speed; H is the height of the dam.
Overtopping is one of the most common causes of dam break [39,40]. Therefore, in this experiment, the upstream dam simulates overtopping failure. The dam begins to break downwards when the initial water depth in front of the dam, hu, reaches 0.30 m. In this experiment, four different downstream water depths (hd) were set, 0 m, 0.1 m, 0.2 m, and 0.3 m, corresponding to water depth ratios hd/hu of 0, 0.33, 0.67, and 1. Eight groups of upstream dam break speeds, u, are selected within the range of 0.3 cm/s to 3.0 cm/s. Thus, the total duration Tu for the complete break of the 0.30 m high dam in the experiment ranges from 10 to 100 s. Additionally, experiments with an instantaneous break of the upstream dam are conducted. The experimental conditions and non-dimensionalization of dam break speed are shown in Table 1.

2.2. Numerical Model Setup

2.2.1. Mathematical Model

Since the flow variation and flow field structure of dam break floods are not easily obtained through experiments, these data are derived using numerical simulation methods. This study uses Flow 3D (Version 11.2.0) for three-dimensional numerical simulations. In previous studies, this software has been widely used for simulating dam break floods [41,42,43,44]. In numerical simulation, the experimental flume is modeled and calculated at a 1:1 ratio. The dam break flood is considered to be a three-dimensional incompressible flow, described by the continuity equation (Equation (3)) and the momentum equation (Equation (4)) [45]. In the numerical calculations, the finite difference method is used to discretize the governing equations, and the GMRES implicit method is employed to solve for pressure and speed.
The continuity equation:
x ( u A x ) + y ( v A y ) + z ( w A z ) = 0
where (u, v, w) represent the speed components in the (x, y, z) directions, and (Ax, Ay, Az) are the fractional areas open to the flow in the (x, y, z) directions.
The momentum equation:
u t + 1 V F u A x u x + v A y u y + w A z u z = 1 ρ p x + g x + f x v t + 1 V F u A x v x + v A y v y + w A z v z = 1 ρ p x + g y + f y w t + 1 V F u A x w x + v A y w y + w A z w z = 1 ρ p x + g z + f z
where VF is the fractional volume open to flow; p is the pressure; ρ represents the density of the fluid; (gx, gy, gz) are the body accelerations; (fx, fy, fz) are the viscous accelerations.
Larocque et al. [19,46] used Large Eddy Simulation (LES) models and kε turbulence models to simulate the three-dimensional evolution of dam break floods. Upon comparing the results with experimental data, they found that the LES model better captured the details of the free surface and speed distribution of dam break floods. Therefore, this study employs the LES model for simulations. In the calculations, the sub-grid scale stresses in the LES model are computed using the Smagorinsky model.

2.2.2. Numerical Model

The computational domain includes the entire flume, and a hexahedral structured grid is used for discretization. The grid size in the x and y directions is uniformly set at 0.01 m to maintain a consistent aspect ratio. For the z direction, three grid sizes (0.0035 m, 0.005 m, and 0.01 m) are selected for grid sensitivity analysis. The water level along the reservoir after 2.0 s of an instantaneous break (u* ≈ ∞) of the upstream dam is shown in Figure 2. The relative error in the results using a grid size of 0.005 m is below 2%. Considering the balance between computational accuracy and time cost, the grid size of 0.005 m in the z direction is finally adopted for the numerical simulations, resulting in a total grid count close to 10 million.
In the numerical calculation model, boundary conditions need to be specified for six surfaces. The top surface and the outlet boundary are in contact with air, so they are set as pressure boundaries with the pressure value set to atmospheric pressure. The Tru-VOF method [45], an improved version of the VOF method proposed by Hirt and Nichols [47], is used to track the free surface. The upstream boundary is assumed to have no inflow and is treated as the reservoir boundary, hence it is specified as a no-slip solid wall boundary. The left, right, and bottom surfaces, representing the flume walls, are also set as no-slip solid wall boundaries, and the velocity distribution near the wall is determined using the standard wall function method.
Initially, the water in the reservoir is at rest. The initial time step for the calculation is 0.01 s, with a minimum time step of 10−10 s. The time step can be dynamically adjusted during the calculation to ensure convergence.
Currently, there are few simulation methods for dam break at a certain speed. However, the General Moving Objects module in Flow 3D [45] allows for the movement of solids at specified speeds and directions. In this study, the upstream dam is set as a moving module in the simulation, with a given speed and direction. After the calculation starts, the dam simulates breaking at the preset speed. Figure 3 shows the simulation results of the dam breaking at different times. The dam is represented in red. Figure 3a illustrates the dam’s position at time t1. After a time interval ∆t, part of the dam has broken downward (Figure 3b).

2.2.3. Numerical Model Validation

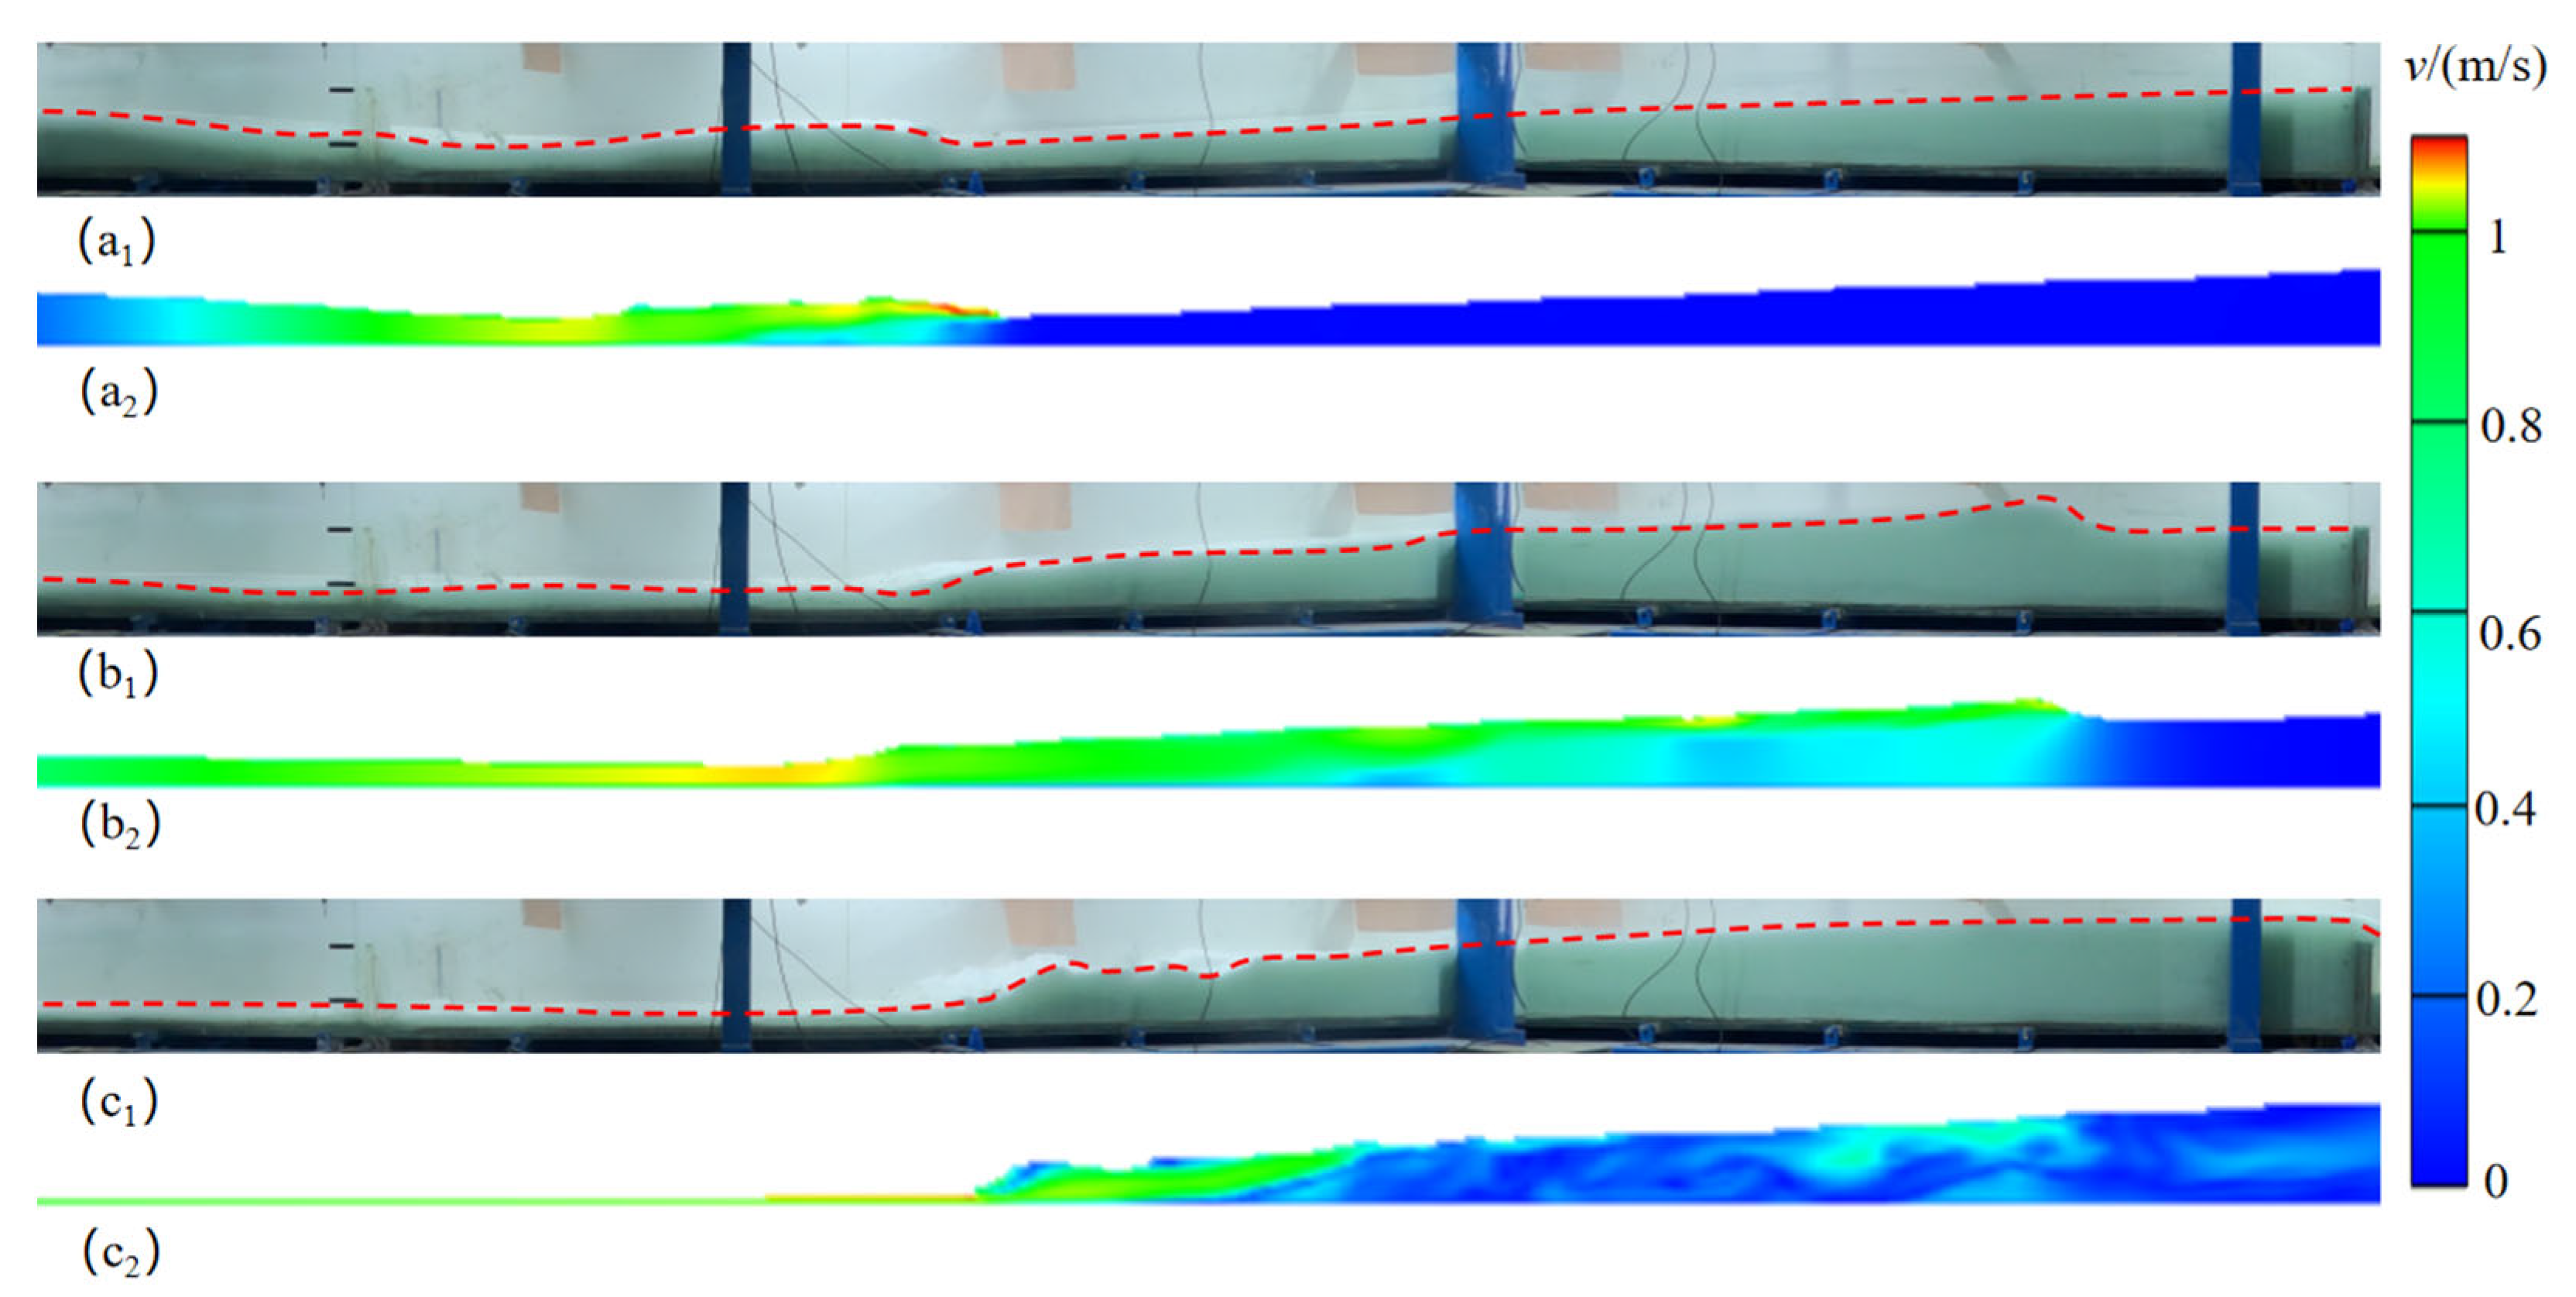
When the upstream dam breaks instantaneously (u* ≈ ∞), the dam break flood evolves most violently. Figure 4 compares the experimental and simulated patterns of dam break flood evolution at several time points under this condition. It can be seen that the numerical model successfully simulates the different patterns of the evolving dam break wave. The experimental and simulated patterns of the dam break flood evolution at different time points match well, indicating that the numerical model has a certain degree of accuracy.
To quantitatively validate the accuracy of the numerical model, the experimental water level data at point P4 are compared with the numerical model data for three speeds: u* ≈ ∞, u* = 0.0167, and u* = 0.0042. As shown in Figure 5, the experimental and numerical model values for the water level changes at point P4 under different water depth ratios match well overall, with consistent trends. The relative root mean square error (RRMSE) is used to assess the discrepancy between the experimental and simulated values. The calculation formula for RRMSE is given in Equation (5). After calculations, the RRMSE between the experimental and simulated water level changes at point P4 was found to be below 5%. This indicates that the parameters used in the numerical calculations are reasonable. This further proves the reliability of the three-dimensional numerical model, which can be used for dam break flood simulation in this study.
R R M S E = 1 n i = 1 n y i μ i μ i 2 × 100 %
where n represents the number of data points; yi is the simulated values; μi is the experimental values.

3. Definition of Slow Dam Break, Fast Dam Break and Instant Dam Break

Figure 6 shows the water level time series at points P1–P4 in the upstream reservoir for different dam break speeds. The experimental results indicate that there are three forms of water level variations in the upstream reservoir. When the dam break speed u* ≈ ∞, the water level variation curves at monitoring points in the upstream reservoir are “concave curves”, and there is a noticeable negative wave propagating towards the upstream reservoir. When the break speeds are u* = 0.0250 and u* = 0.0167, the water level variation curves initially form a convex curve followed by a concave curve, and there is also a negative wave propagating towards the upstream reservoir. When the break speeds are u* = 0.0083 and u* = 0.0042, the water level variation curve is generally a convex curve, with almost no negative wave generated, and the water level in the reservoir overall decreases.
The dam break speed determines the head of the overtopping water over the residual dam, which in turn determines the form of the water level process line in the upstream reservoir. The difference in the concavity and convexity of the water level process line is caused by the dam’s blocking effect. If the overtopping water head is small, there is a blocking effect, and the outflow is influenced by the residual dam body, resulting in a “convex curve” for the water depth process line at the dam site. If the overtopping water head is large, there is no blocking effect, and the water flow at the dam site is not influenced by the residual dam body, resulting in a “concave curve” for the water depth process line at the dam site.
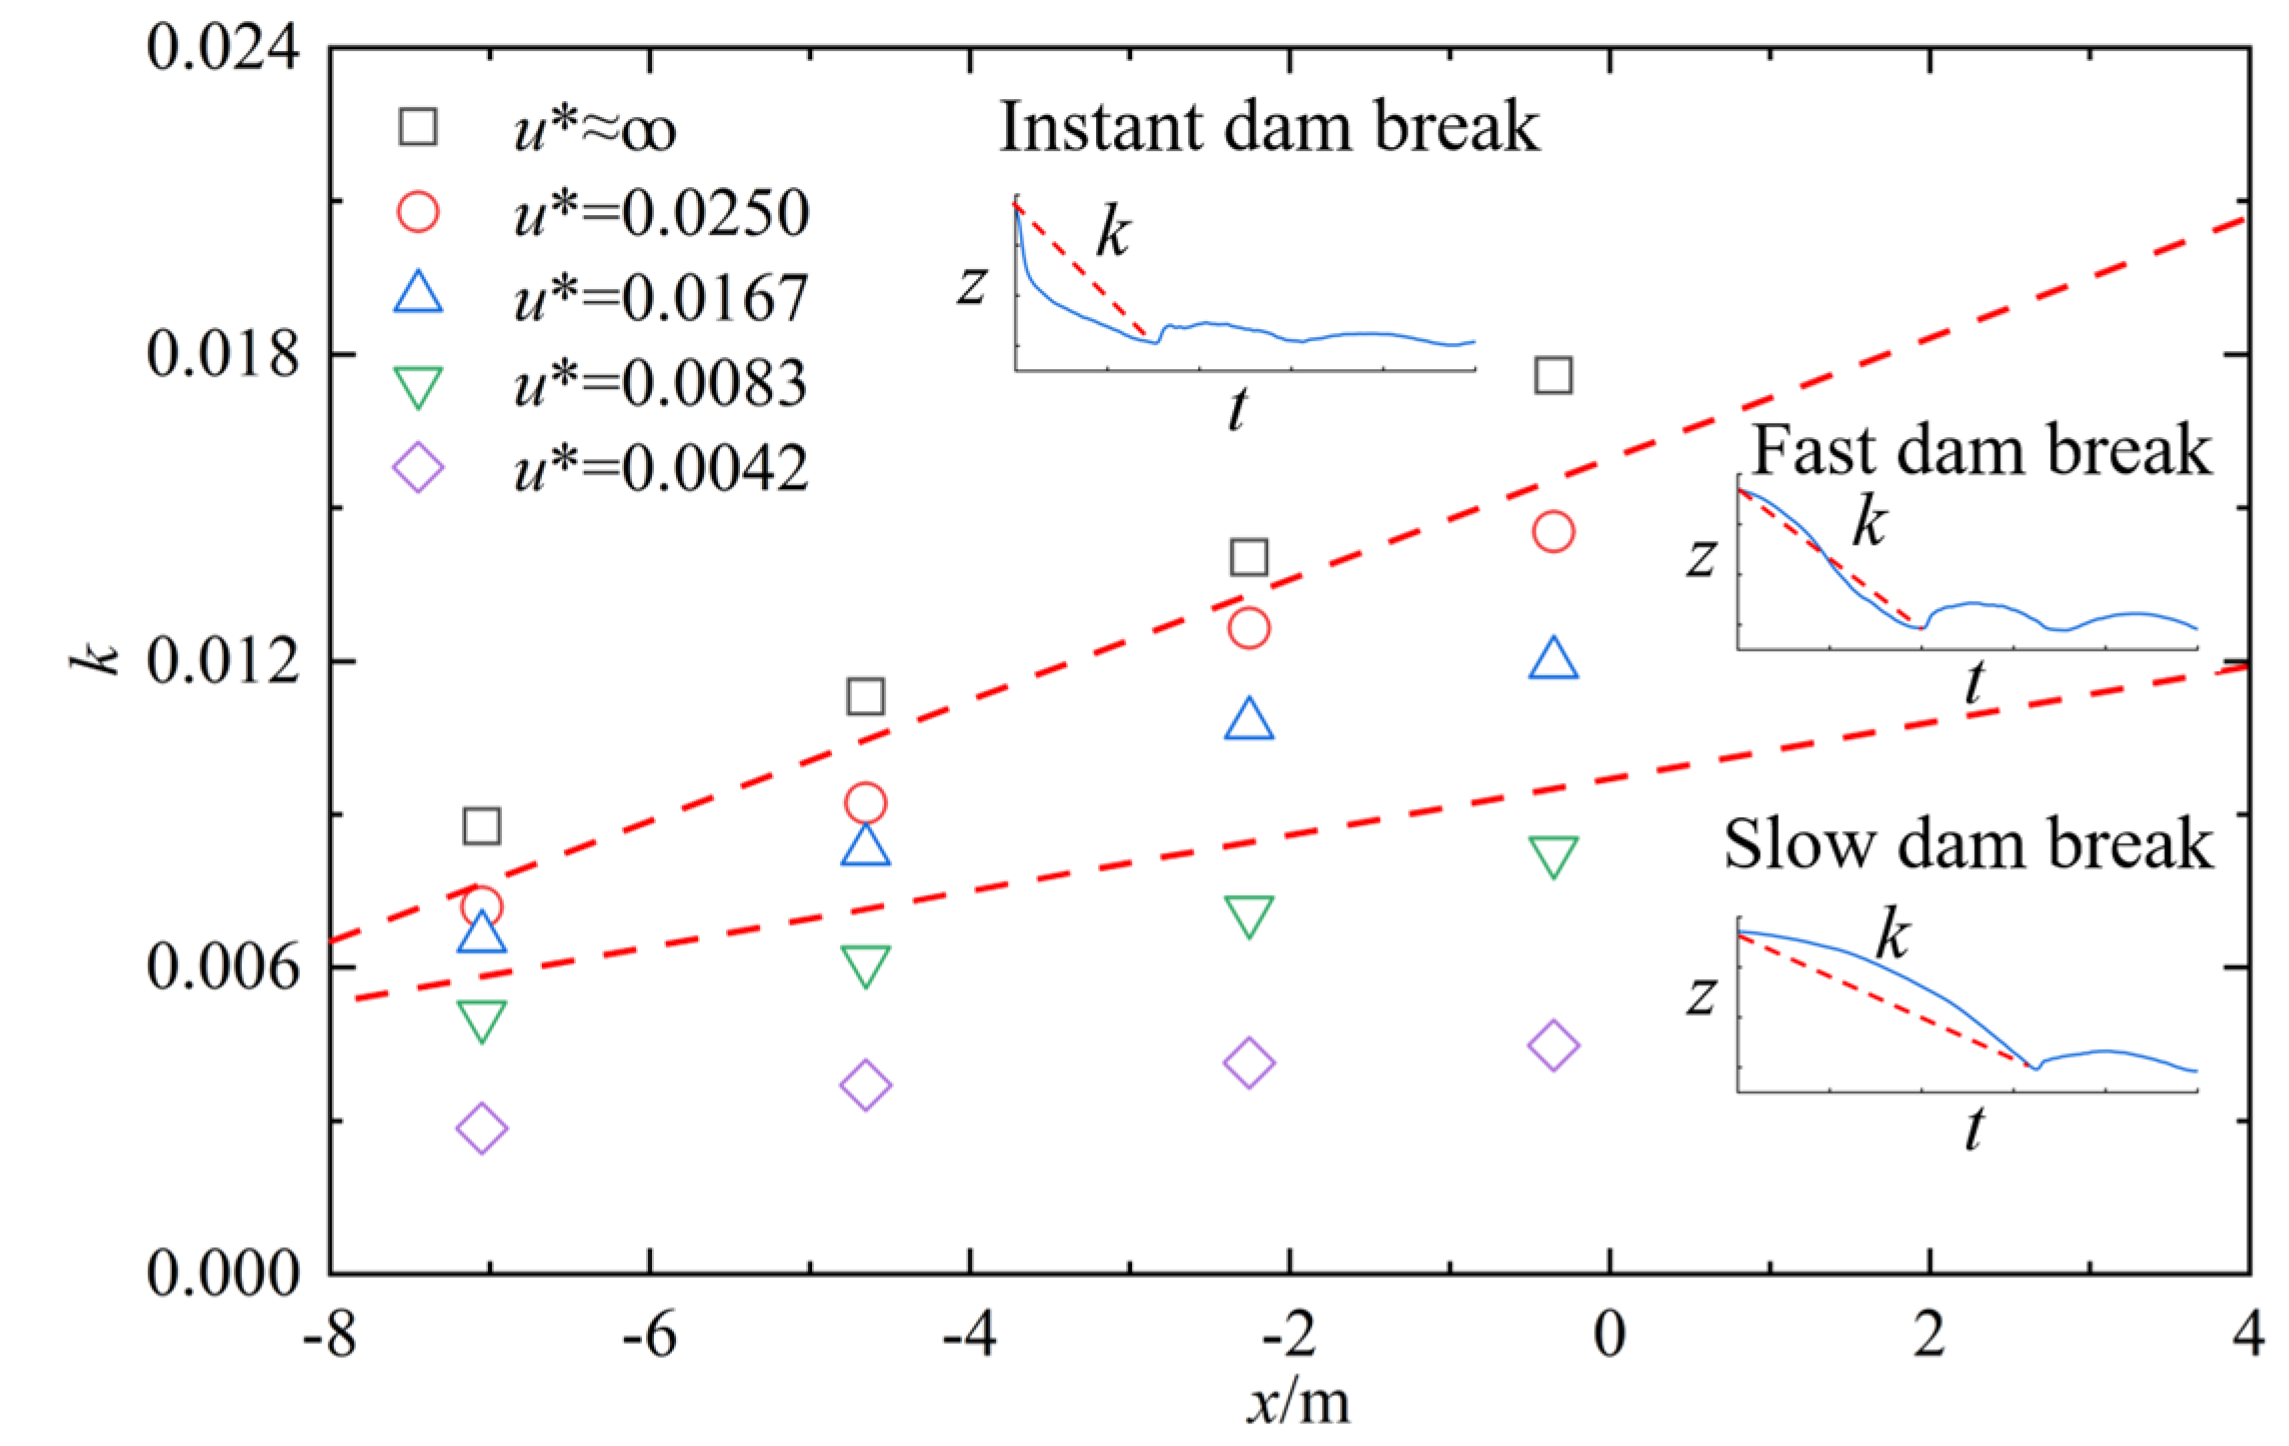
Based on the changes in the water level curves in the upstream reservoir, we classify the dam break into three modes. When the dam break speed u* ≈ ∞, it is commonly referred to as an “instant dam break”. In this study, it can be approximately considered that u* = 0.0083 is the critical value at which the water level changes in the upstream reservoir occur significantly. The conditions where u* > 0.0083 are defined as a “fast dam break”, and the conditions where u* < 0.0083 are defined as a “slow dam break”. Figure 7 shows the water level variation curves and the rates of water level decline (k) at various measurement points in the upstream reservoir under different upstream dam break speeds. The faster the dam break speed, the greater the rate of water level decline. The closer to the breaking dam, the greater the rate of water level decline.
During an instant dam break, the reservoir water level rapidly decreases under the influence of gravity, resulting in a “concave curve” for the water level change. During a fast dam break, the early stages of the break involve small overtopping flows with a blocking effect, resulting in a “convex curve”. As the break progresses and the dam descends significantly, the flow begins to be unaffected by the dam’s blocking effect. The water level curve transitions from convex to concave. During a slow dam break, the water flow is continuously influenced by the dam’s blocking effect throughout the break process, resulting in a consistently “convex curve”.

4. Effect of Dam Break Speed on Flood Evolution in Downstream Reservoirs

4.1. Evolution Patterns

This section explains the differences in the evolution patterns of dam break floods in a downstream reservoir under three different dam break modes.
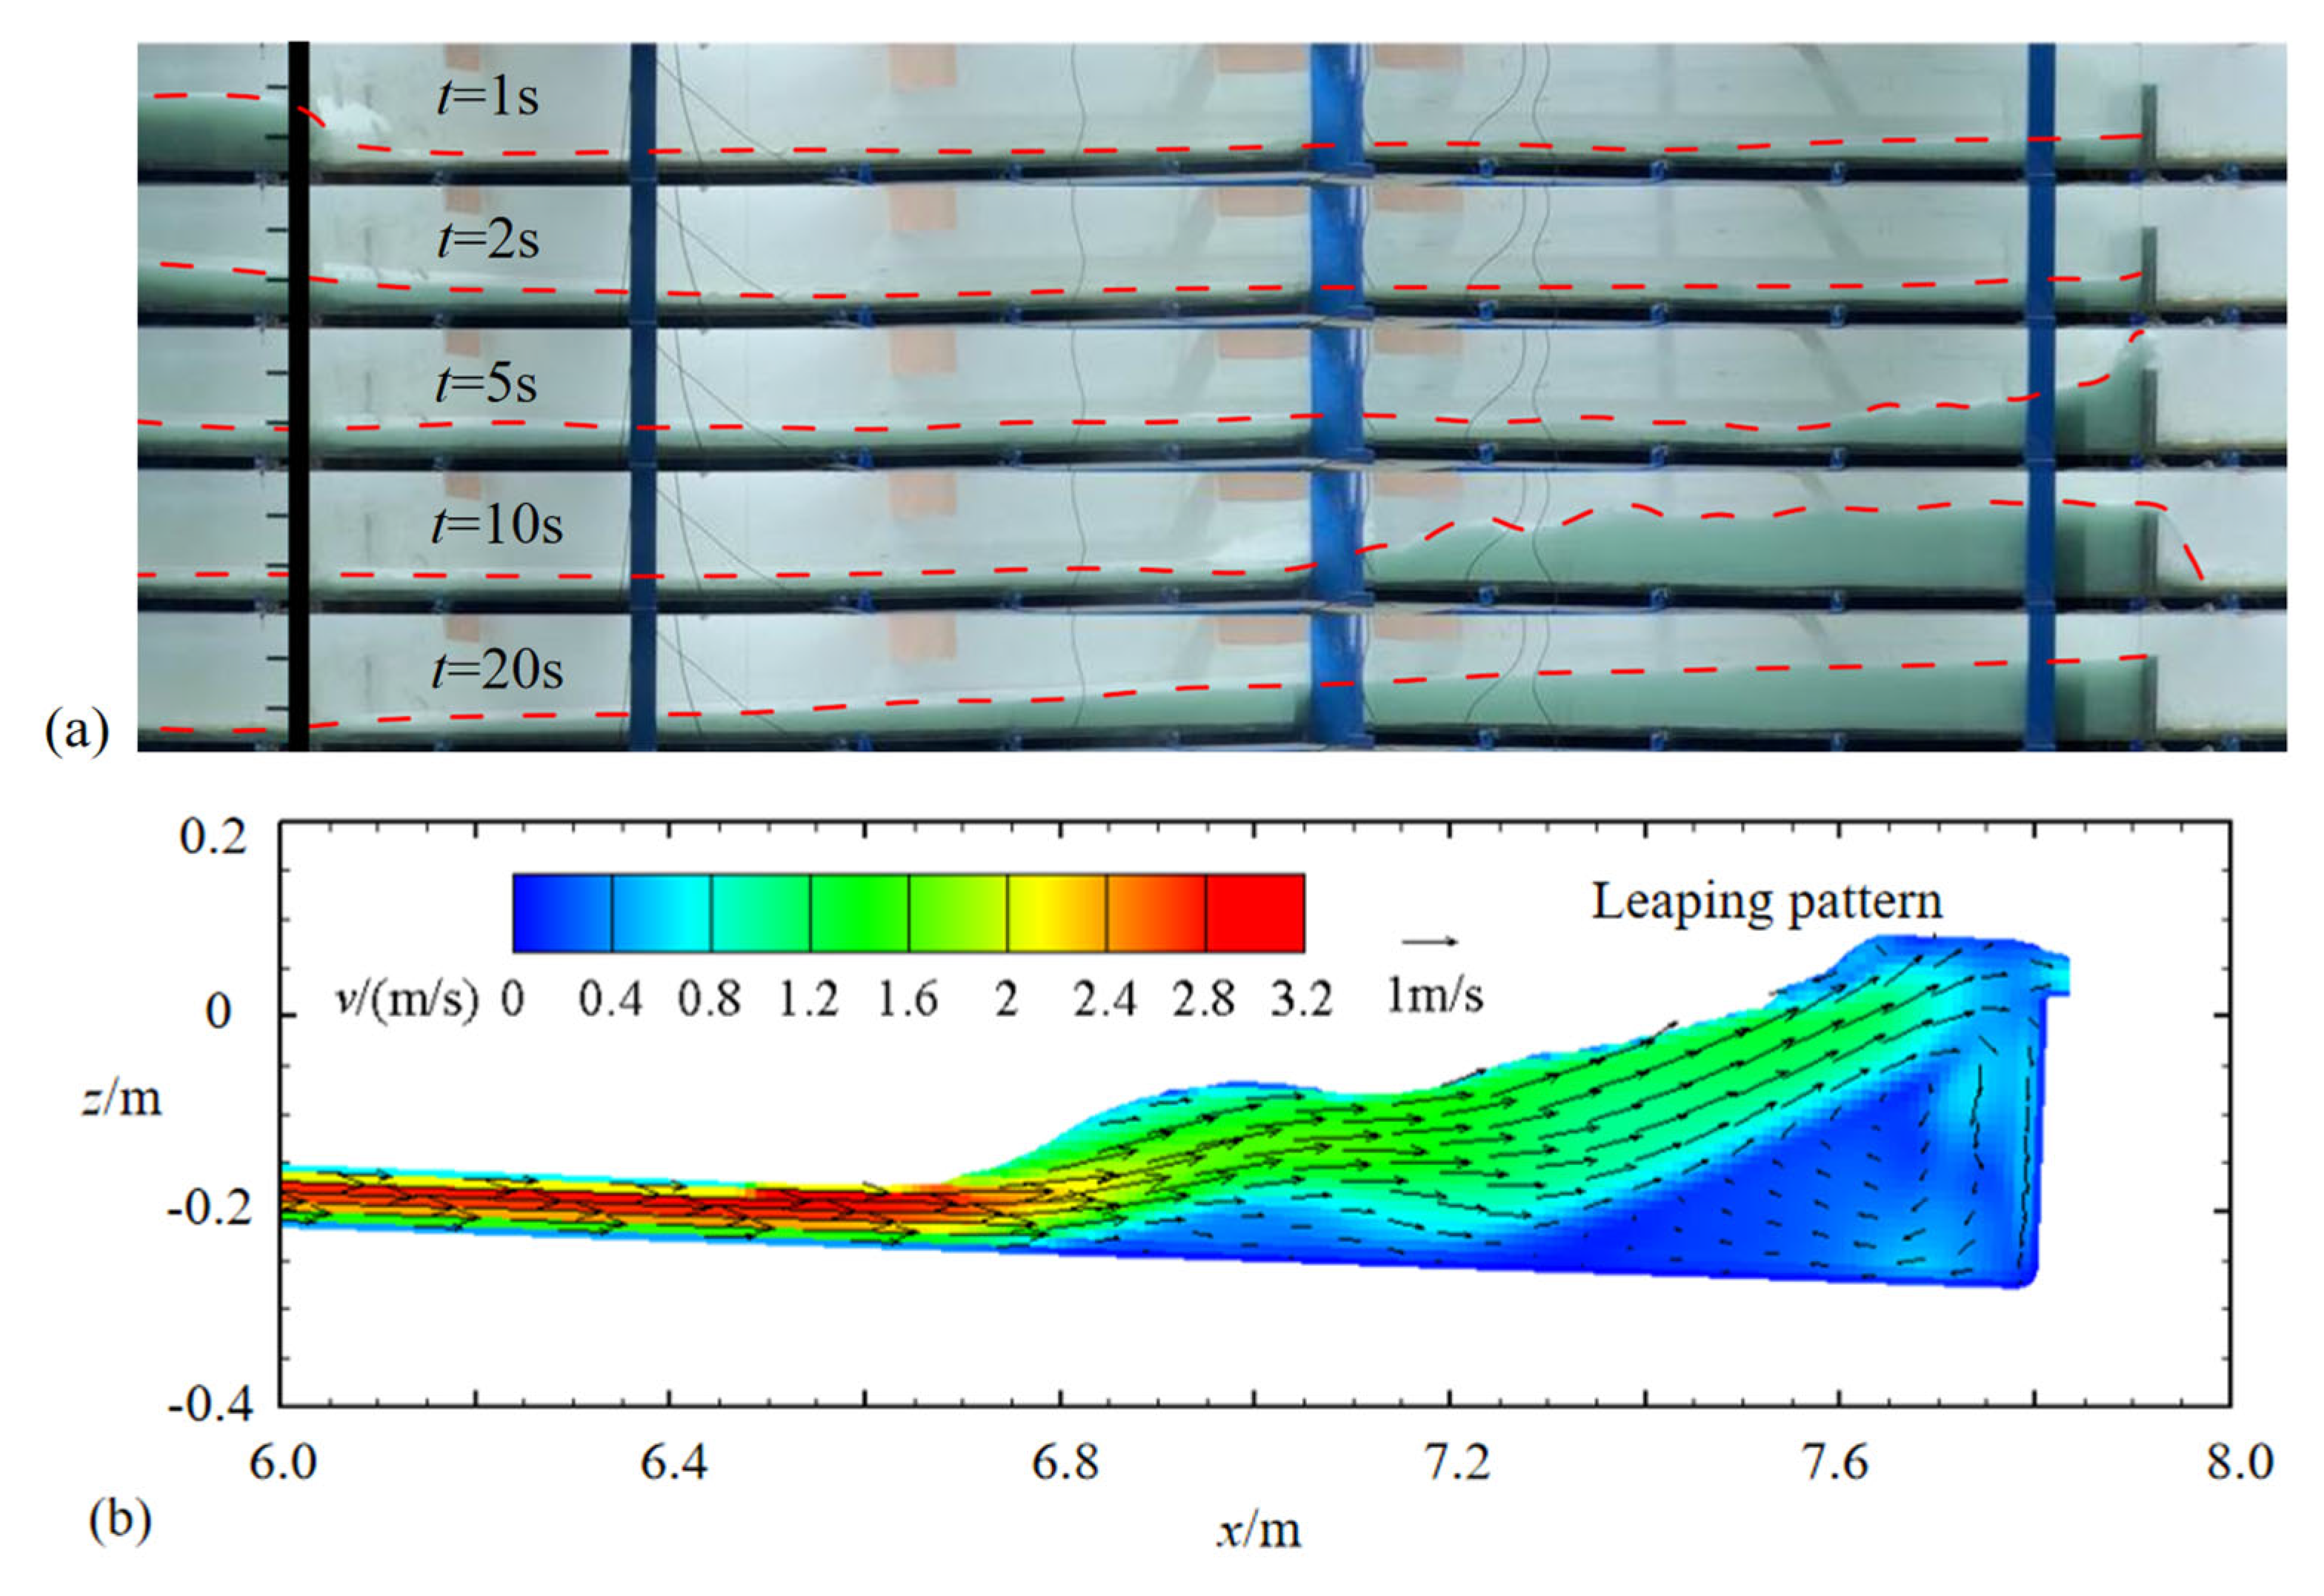
Figure 8 shows the evolution pattern of the dam break flood under the instant dam break mode (u* ≈ ∞) when the depth ratio hd/hu = 0.33. The upstream dam (indicated by the black line) breaks instantaneously. The water in the upstream reservoir rushes out under the influence of gravity (t = 1 s); at the downstream dry–wet boundary, the flood impacts the downstream stationary water body, causing a certain degree of water level rise in the wave front region (t = 2 s). As the flood wave continues to evolve, the main stream ascends, and when it reaches the downstream dam, it leaps up under the influence of enormous kinetic energy (t = 5 s). Subsequently, the flood wave flows back due to the obstruction of the downstream dam, and at the junction of the dam break flow and the downstream water body, there is mixing, rolling, shearing, and significant aeration (t = 10 s). As time progresses, the water volume in the upstream reservoir decreases, the flow rate of the weir flow at the downstream dam site reduces until the overflow ceases, and the backwater position in the reservoir moves upstream until it disappears, leading to stable flow with minor oscillations due to inertia (t = 20 s).
This evolution pattern of the dam break flood is defined as the “leaping pattern”. Figure 8b shows the flow field structure obtained from numerical simulations under the leap pattern. The typical feature is the ascent of the main flood stream and the leaping of the flood at the downstream dam front.
Figure 9 shows the evolution pattern of the dam break flood under the fast dam break mode (u* = 0.0250) when the depth ratio hd/hu = 0.33. In this mode, the flow at the upstream dam initially forms a weir-like falling jet (t = 2 s). As the dam gradually breaks, the dam break flood continuously progresses downstream, and the floodwater climbs upon impact at the front of the downstream dam (t = 7 s). Subsequently, the flood wave reflects upstream, generating a series of waves within the reservoir (t = 12 s). Finally, as time progresses (t = 24 s), the flow gradually stabilizes, with minor oscillations due to inertia.
This evolution pattern of the dam break flood is defined as the “climbing pattern”. Figure 9b shows the flow field structure obtained from numerical simulations under the climbing pattern. In this mode, the mainstream still ascends, but at the front of the downstream dam, the floodwater no longer leaps up but instead climbs along the dam face.
Figure 10 shows the evolution pattern of the dam break flood under the slow dam break mode (u* = 0.0042) when the depth ratio hd/hu = 0.33. In this mode, the dam break flood carries a relatively low amount of energy, resulting in significantly reduced surface wave fluctuations as it progresses through the downstream reservoir. The dam break flood behaves similarly to water being added to the downstream reservoir, causing a slow rise in the water surface.
This evolution pattern of the dam break flood is defined as the “lifting pattern”. Figure 10b shows the flow field structure obtained from numerical simulations under the lifting pattern. In this mode, the main flood stream does not ascend above the stationary water body in the reservoir. Instead, the floodwater creeps forward, mixing with the downstream stationary water body, and no significant rise in the water surface is observed in front of the downstream dam.
The different evolution patterns of dam break floods in the downstream reservoir under varying break speeds of the upstream dam are fundamentally due to the different rates of energy release from the upstream reservoir water body. Higher break speeds result in a more concentrated and explosive release of potential energy, which rapidly converts into kinetic energy, accelerating the dam break flood’s progression. Consequently, the flood can ascend above the still water in the downstream reservoir. In front of the downstream dam, the dam break flood, carrying a huge amount of energy, impacts the downstream dam and then leaps and climbs. During this process, the flood’s kinetic energy is converted back into potential energy. Conversely, at lower break speeds, the flood carries less kinetic energy while advancing in the downstream reservoir, preventing it from leaping and climbing, but the water level in the reservoir will slowly rise as the water volume increases.

4.2. Discharge Variation

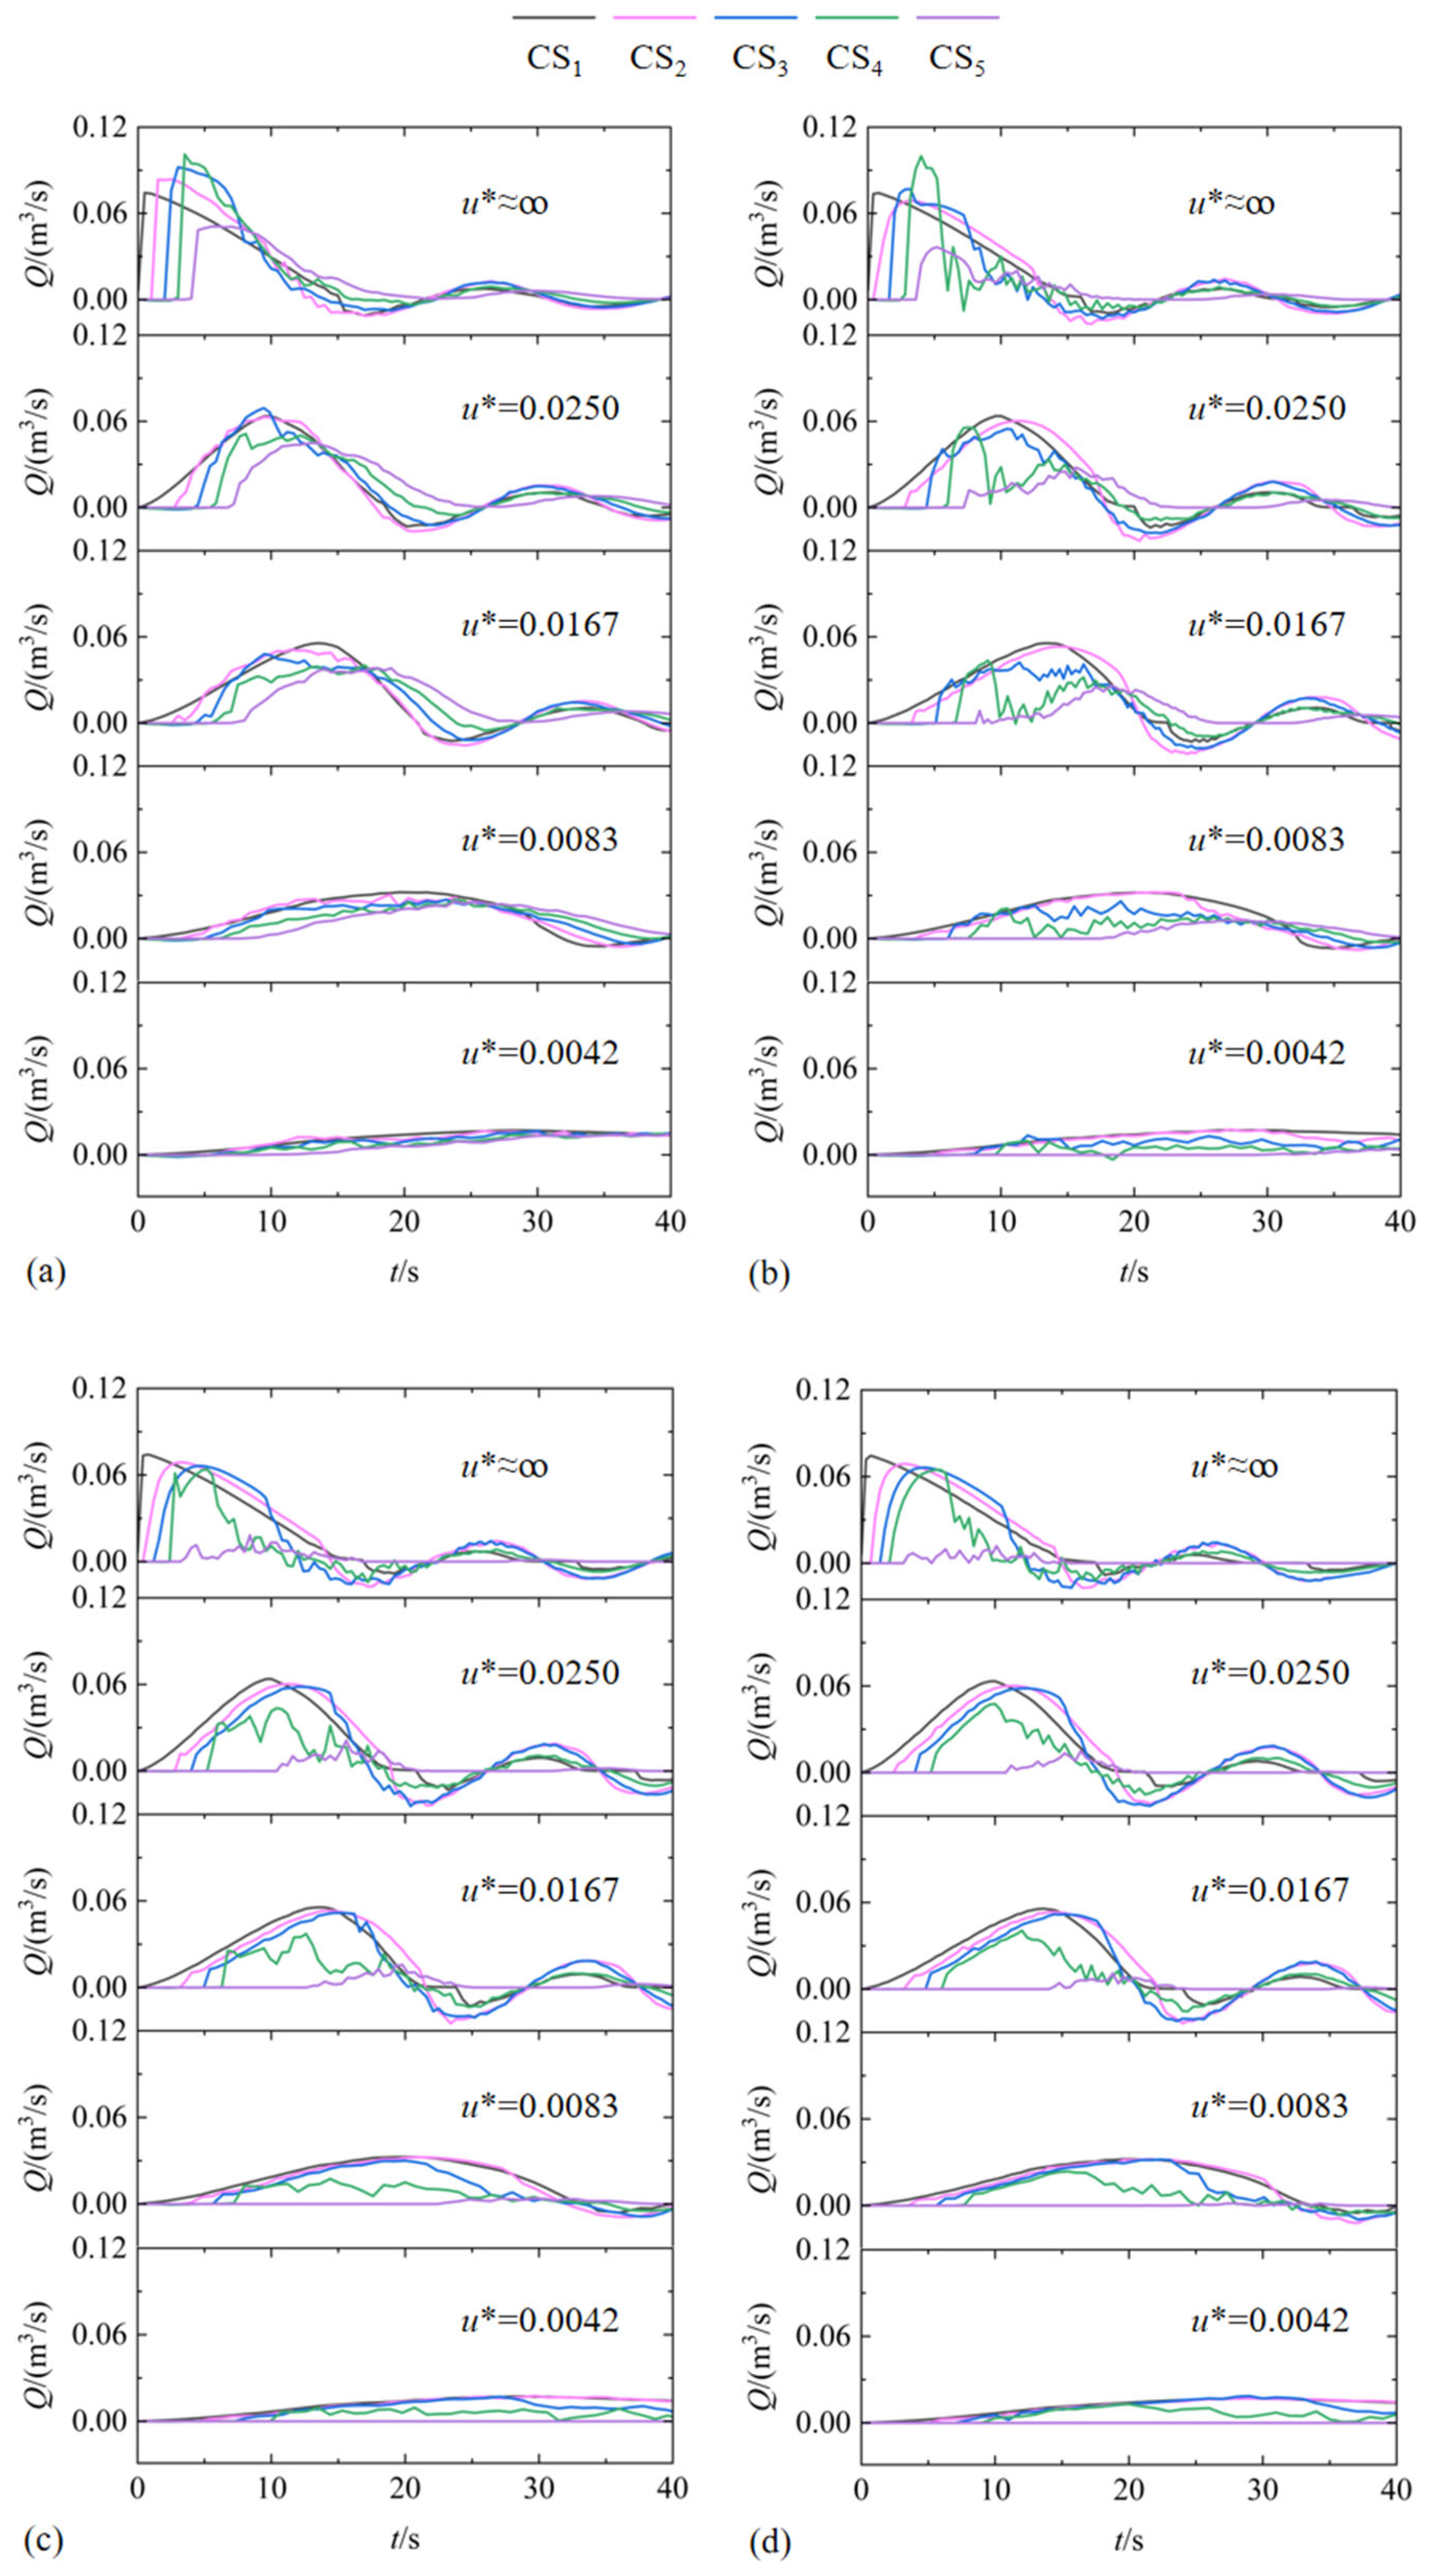
The break speed of a dam determines the evolution pattern of the dam break flood and, consequently, the flow rate changes in the dam break flood. Figure 11 shows the variation in flow rates over time at five sections: the upstream dam (CS1), the downstream reservoir (CS2–CS4), and the downstream dam front (CS5) under different break speeds and depth ratios.
From Figure 11, it can be observed that the break speed u* primarily affects the “thickness” of the flood peak shape in the downstream reservoir. The faster the break speed, the sharper the peak. When the dam breaks instantaneously, the flood flow at different sections surges from 0 to its peak value. In cases of a fast break (u* = 0.0250, u* = 0.0167), a distinct flood peak appears. As the break speed decreases, the increase in flow rate becomes more gradual. In cases of a slow break (u* = 0.0083, u* = 0.0042), there is no obvious flood peak in the downstream reservoir. After the dam break flood reaches its peak discharge, the flood discharge decreases. Due to the obstruction from the downstream dam, water flows back, causing the flood discharge to turn negative, and eventually, the fluctuations stabilize.
The water depth in front of the downstream dam (hd) determines the water volume and backwater length in the downstream reservoir. At the interface between the dam break flood and the downstream water body (the wet–dry boundary), the flow exhibits turbulent mixing, leading to noticeable fluctuations in the flow hydrograph. While the hd determines the location of these fluctuations, it does not affect the overall trend in flow variations across different sections as the dam break speed changes. In dry-bed conditions downstream, there is a slight but distinct increase in flow when the flood first reaches the corresponding location.
The flow hydrograph exhibits a lag effect as it progresses through the reservoir. The slower the dam break speed, the slower the dam break flood advances, and the more pronounced the lag effect. For example, when hd/hu = 1, the flow variation at cross-section CS5 lags by about 4.0 s compared to CS1 during the instant dam break, by about 7.2 s when u* = 0.0250, and by about 8.9 s when u* = 0.0083.

4.3. Peak Flood Discharge and Peak Arrival Time

In actual flood control and emergency management, peak flood discharge and peak arrival time are critical parameters that directly influence the formulation of emergency plans.
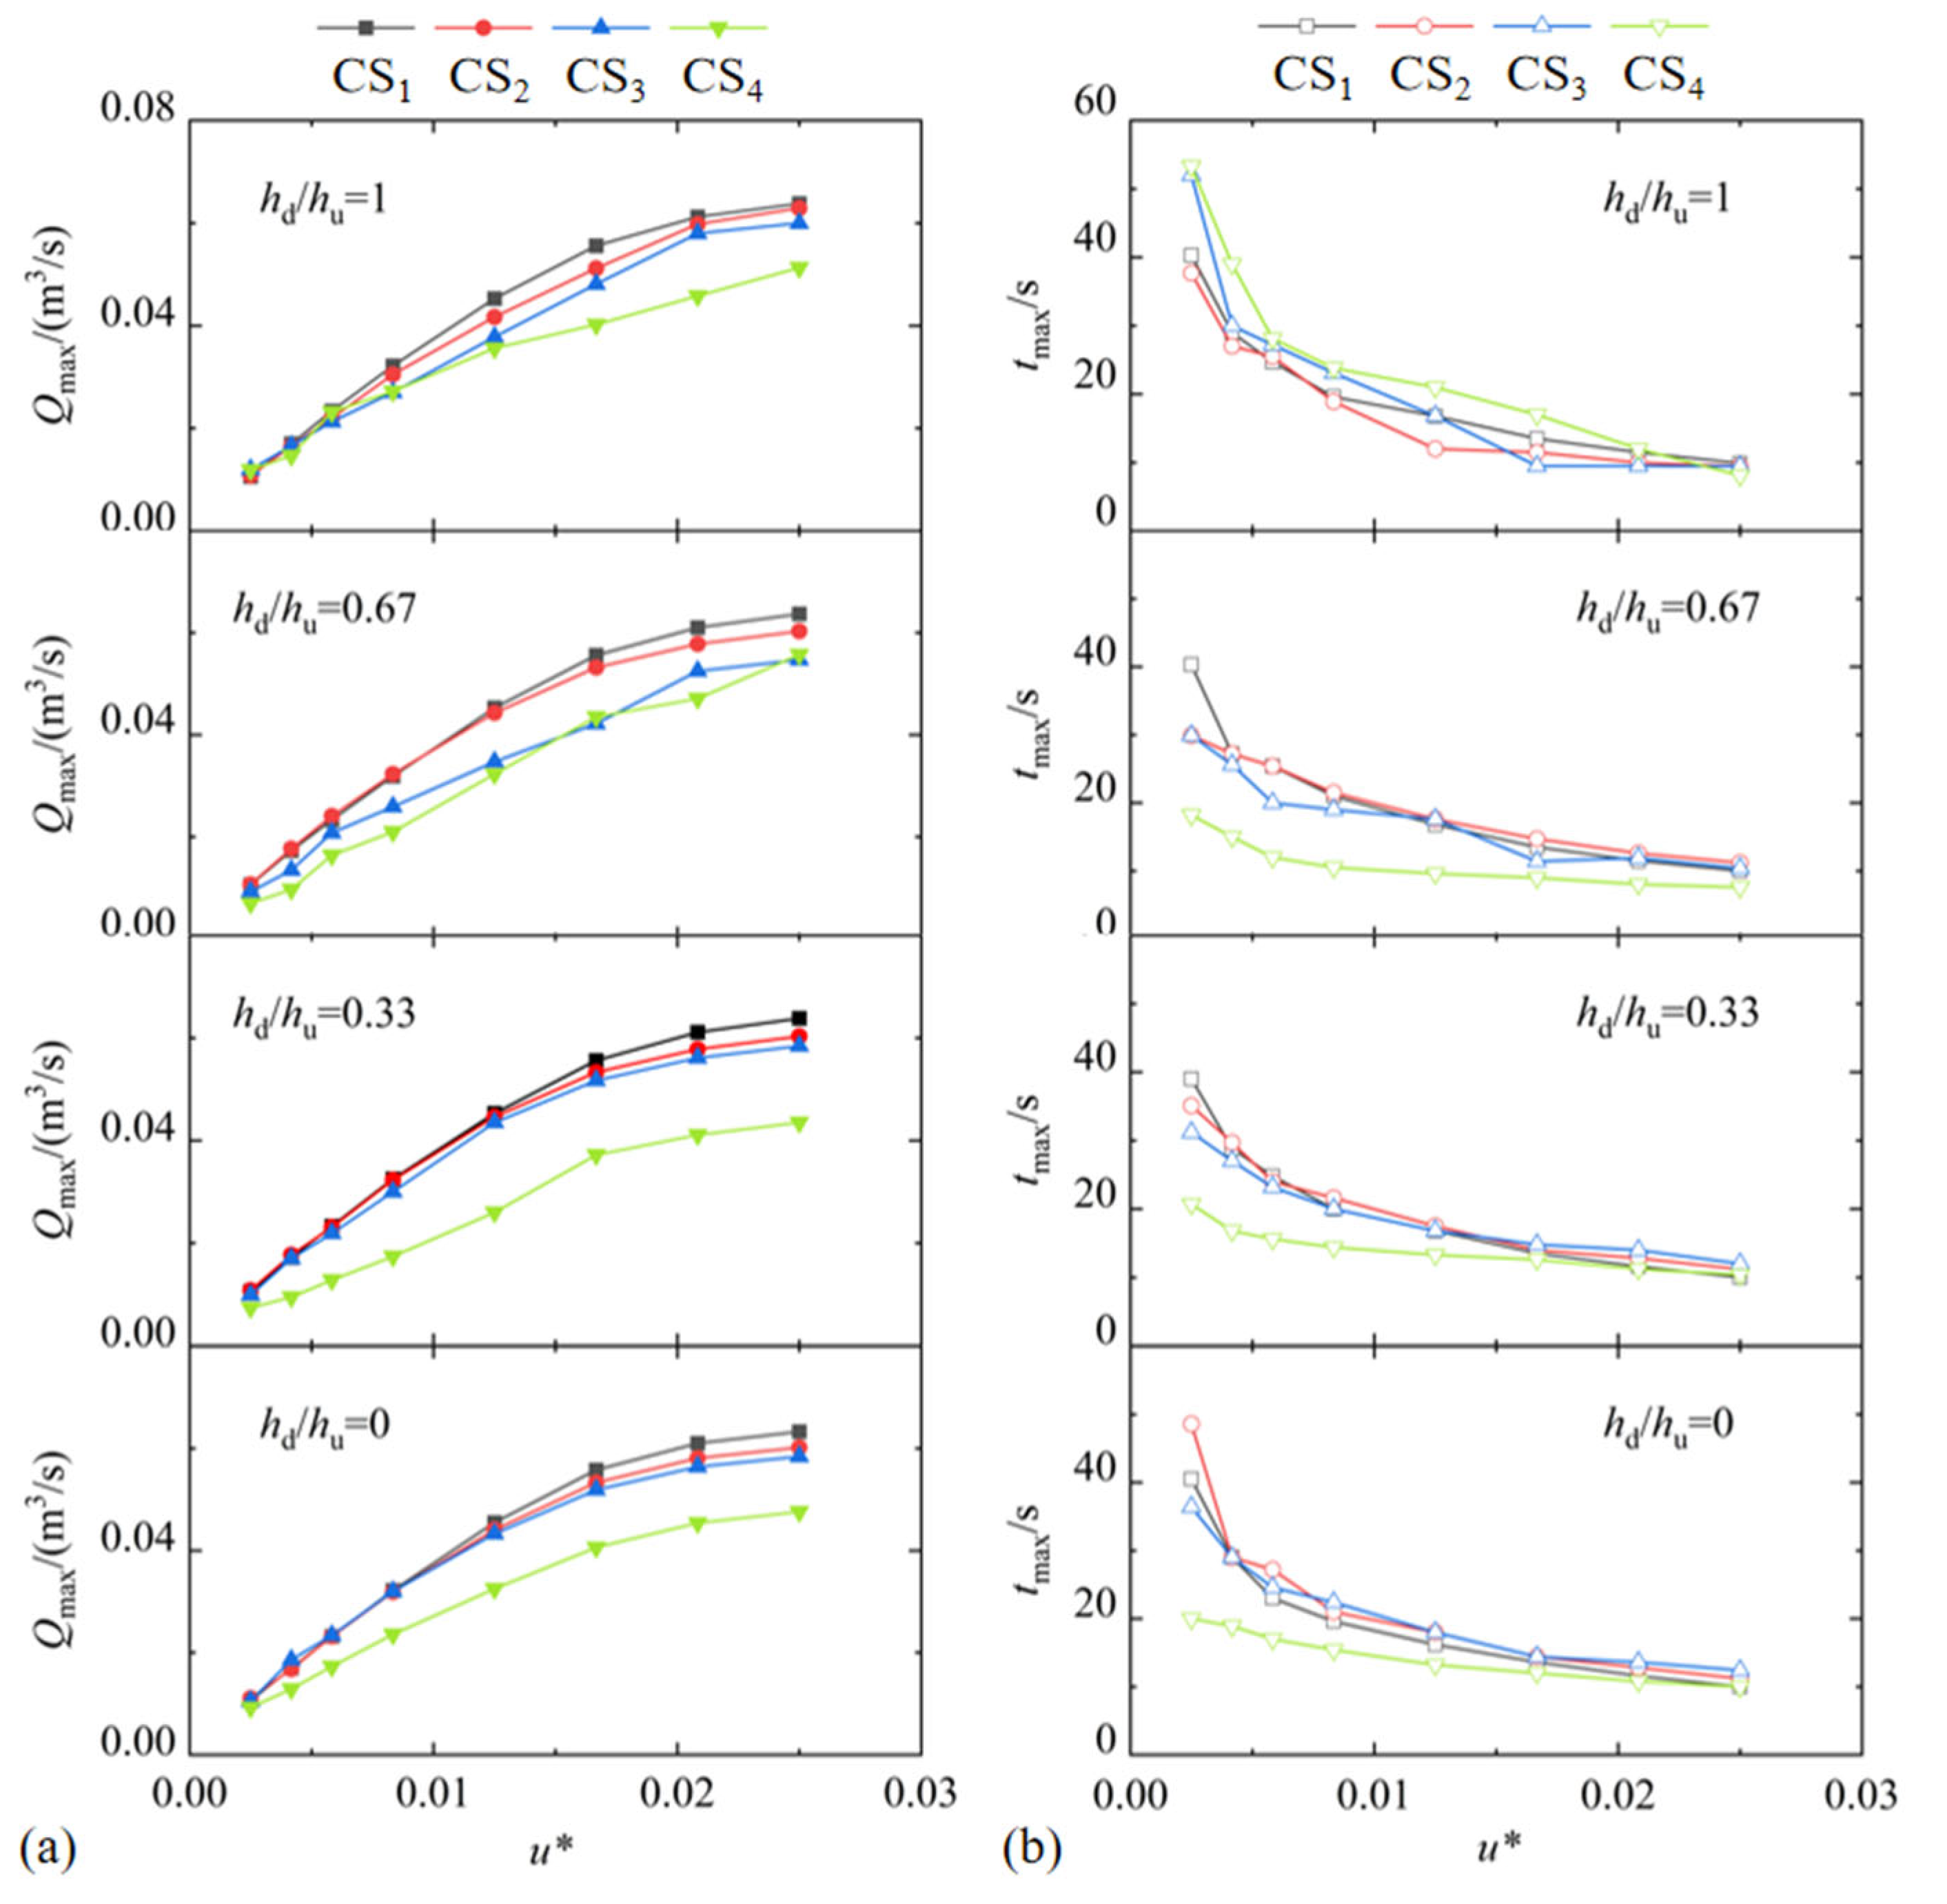
Figure 12 shows the variations of peak flood discharge Qmax and peak arrival time tmax with dam break speeds at different cross-sections. As the dam break speed increases, the peak flood discharge increases and the peak arrival time shortens. However, with the increase in the dam break speed, the increment in peak flood discharge and the decrement in peak arrival time both decrease. During the progression of the dam break flood, due to the frictional resistance of the flume, the peak flood discharge gradually decreases. The trends in peak flood discharge and peak arrival time variations with the upstream dam break speed are consistent across different cross-sections.
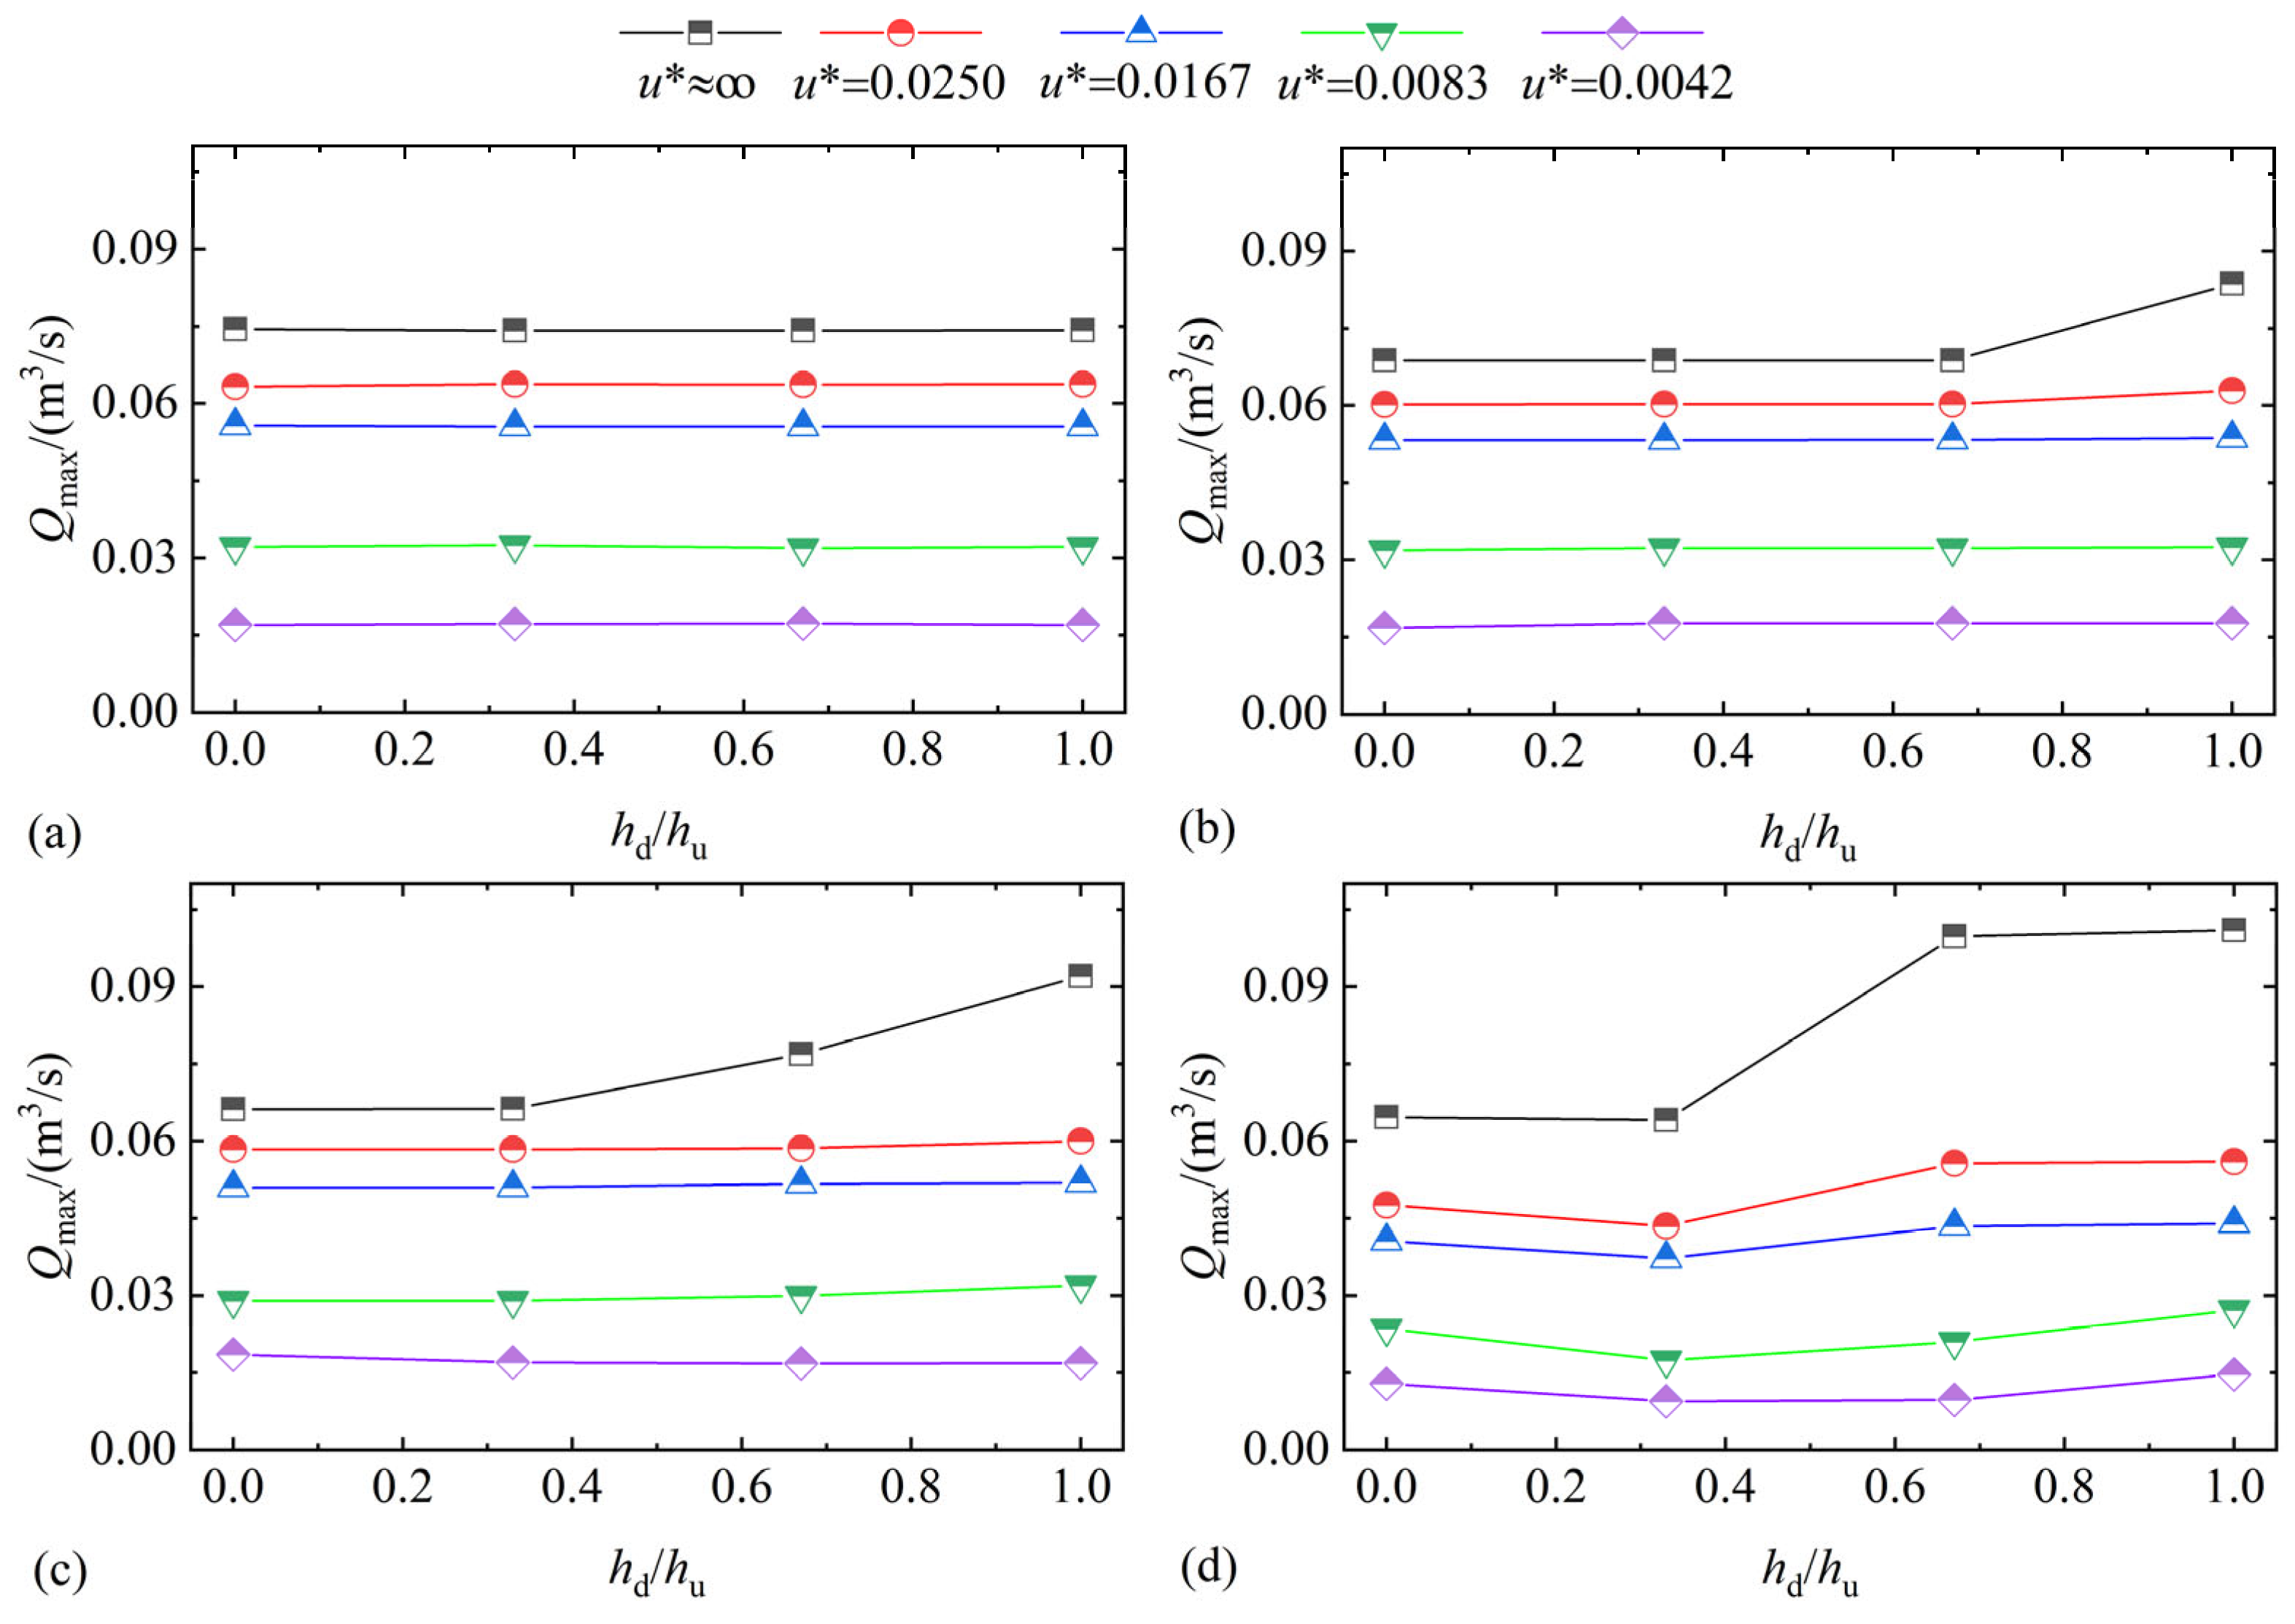
Figure 13 illustrates how peak flood discharge at different cross-sections in the downstream reservoir varies with the water depth ratio (hd/hu). The CS1 cross-section, located farther from the downstream dam, shows that peak flood discharge is not significantly affected by the water depth ratio. As the dam break speed increases, the effect of the water depth ratio on peak flow becomes more pronounced, as faster dam breaks carry greater energy, resulting in a stronger impact on the downstream water and consequently higher peak flood discharge.
During the instant dam break, the peak flood discharge at various cross-sections in the downstream reservoir increases with the water depth ratio. When the dam break speeds are u* = 0.0083 and u* = 0.0042, the water depth ratio has little to no effect on peak flow. This is because, in a slow dam break, the progression of the dam break flood in the downstream reservoir is very slow, resembling a controlled inflow into the reservoir, thereby minimizing the influence of the water depth ratio on peak flood discharge.
Equation (6) defines the dimensionless peak discharge coefficient q to analyze the relative relationship in peak flood discharge between the fast/slow dam break and the instant dam break.
q = Q u - max Q s - max
where Qu-max represents the peak flood discharge at a given location when the dam break speed is u*, and Qs-max represents the peak discharge rate at the same location during the instant dam break. Figure 14 shows the variations in the peak discharge coefficient q with dam break speed u* for different cross-sections.
From Figure 14, it can be observed that the peak discharge coefficient q increases with the dam break speed u*, but the growth trends in the peak discharge coefficient q differ between the fast dam break and the slow dam break. During the slow dam break (u* < 0.0083), the peak discharge coefficient increases rapidly, almost linearly with the increase in break speed. During the fast dam break (u* > 0.0083), the increment in the peak discharge coefficient significantly slows down. At the maximum break speed in this experiment (u* = 0.0250), q = 0.85 at the dam site (CS1). This indicates that when the dam break speed reaches 2.5% of the theoretical speed in the instant dam break, the peak flood discharge at the dam site already reaches 85% of that in the instant dam break. The further increase in dam break speed approaches the instant dam break, and the effect of dam break speed on the peak flood discharge becomes insignificant.
Equation (7) defines the peak arrival coefficient β to analyze the relationship between the peak arrival time at the dam site and the dam break total duration in the fast and the slow dam breaks.
β = t max T u
where tmax represents the peak arrival time, and Tu represents the total duration required for the dam to completely break at the break speed u.
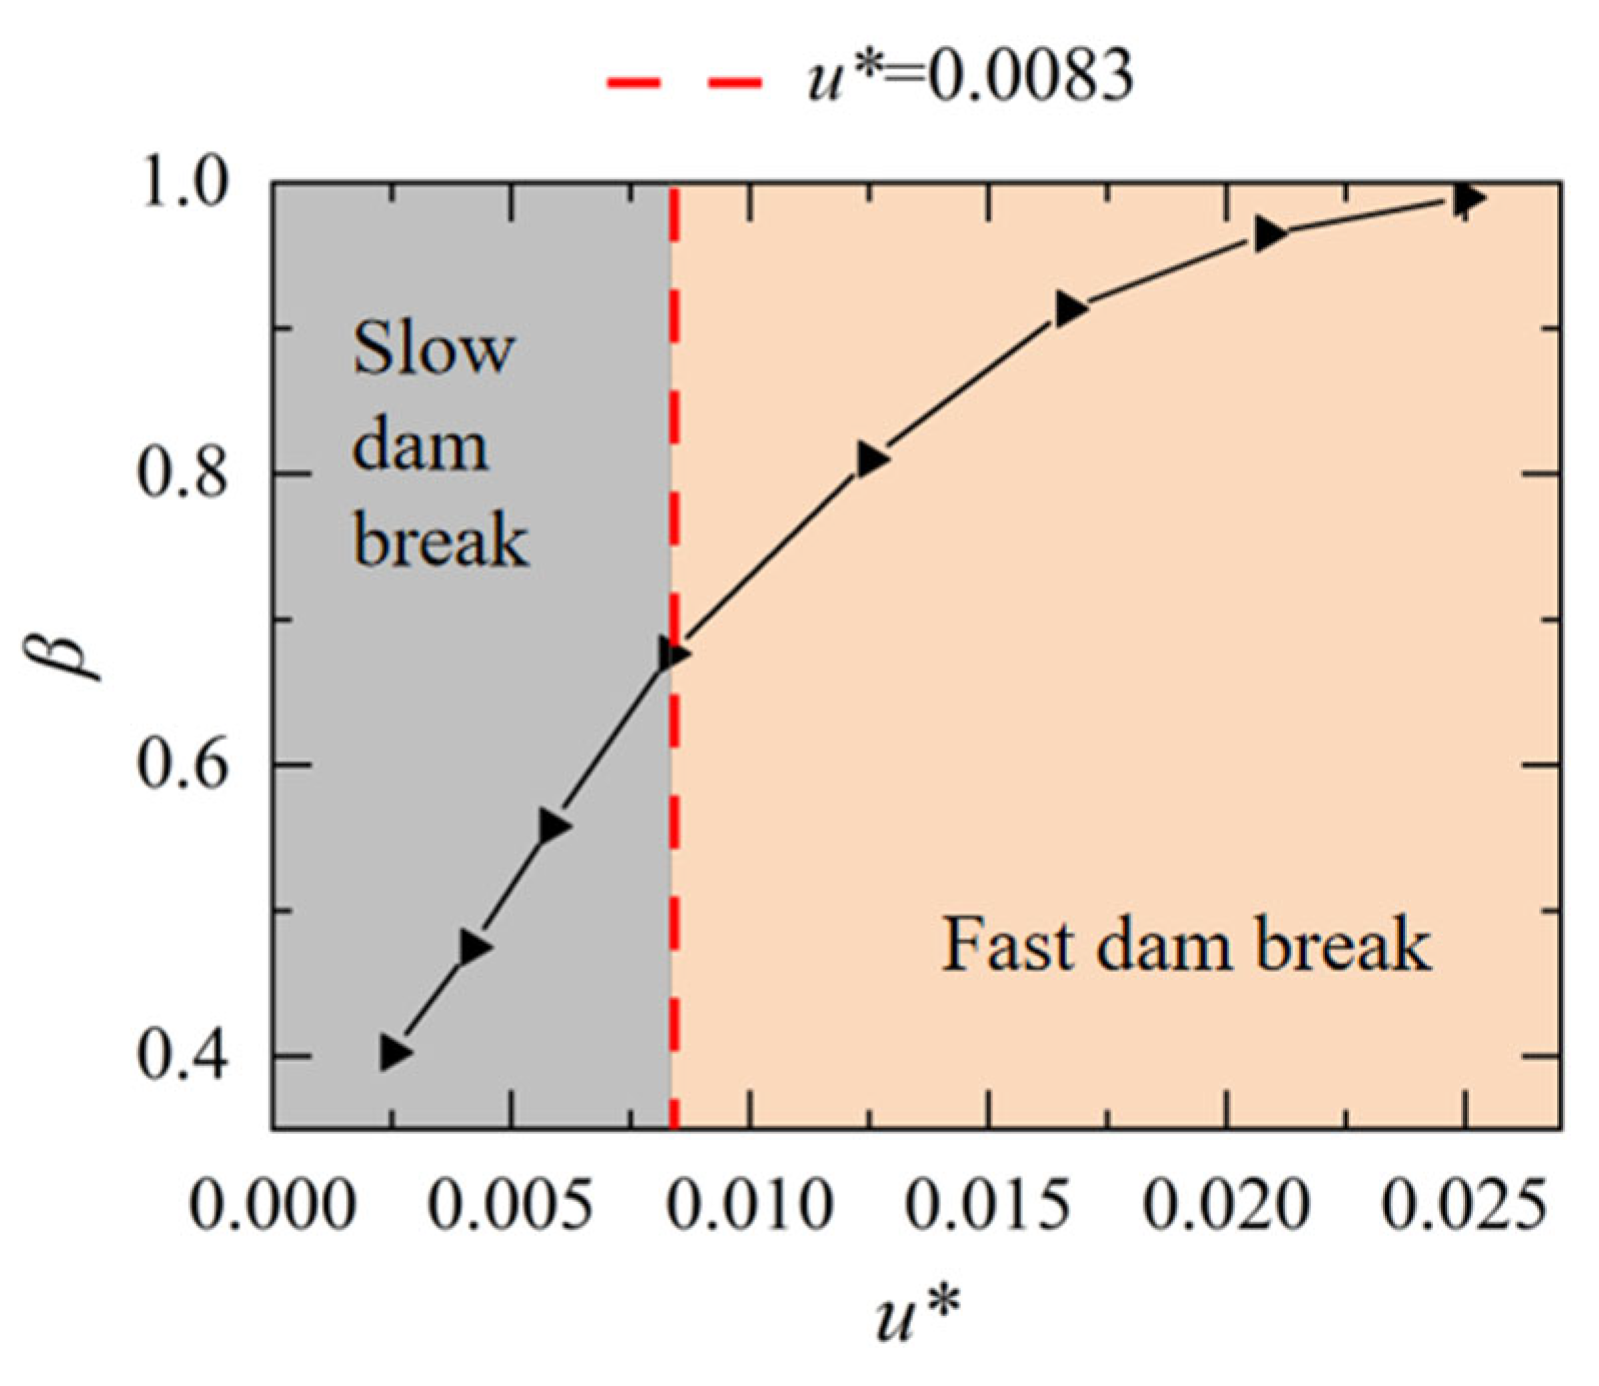
Figure 15 shows the variations in the peak arrival coefficient β with the dam break speed at the dam site on a dry downstream bed. The change pattern of the peak arrival coefficient β is similar to that of the peak discharge coefficient q. During the slow dam break (u* < 0.0083), the peak arrival coefficient β increases linearly with the break speed. During the fast dam break (u* > 0.0083), the increment in the peak arrival coefficient β significantly slows down. At the maximum break speed in this experiment (u* = 0.0250), β approaches 1, indicating that at this break speed, the energy release of the flood is close to that of an instant dam break.

5. Theoretical Analysis of the Effect of Dam Break Speed on Peak Flood Discharge

Peak flood discharge is one of the most critical parameters in dam break flood studies. Currently, there are many methods and analyses for calculating the peak flood discharge at the dam site during an instant dam break. However, there is relatively less research on the calculation methods for the peak flood discharge at the dam site when the dam gradually breaks (a fast dam break and a slow dam break) at a certain rate. We start from the water balance equation, the weir flow formula, and the relationship between reservoir volume and water depth to derive and analyze the calculation formula for the peak flood discharge at the dam site when the dam breaks gradually at a certain rate.
The calculation of peak flood discharge at the dam site uses the basic weir flow formula (Equation (8)).
Q max = μ B 2 g Δ h m 3 2
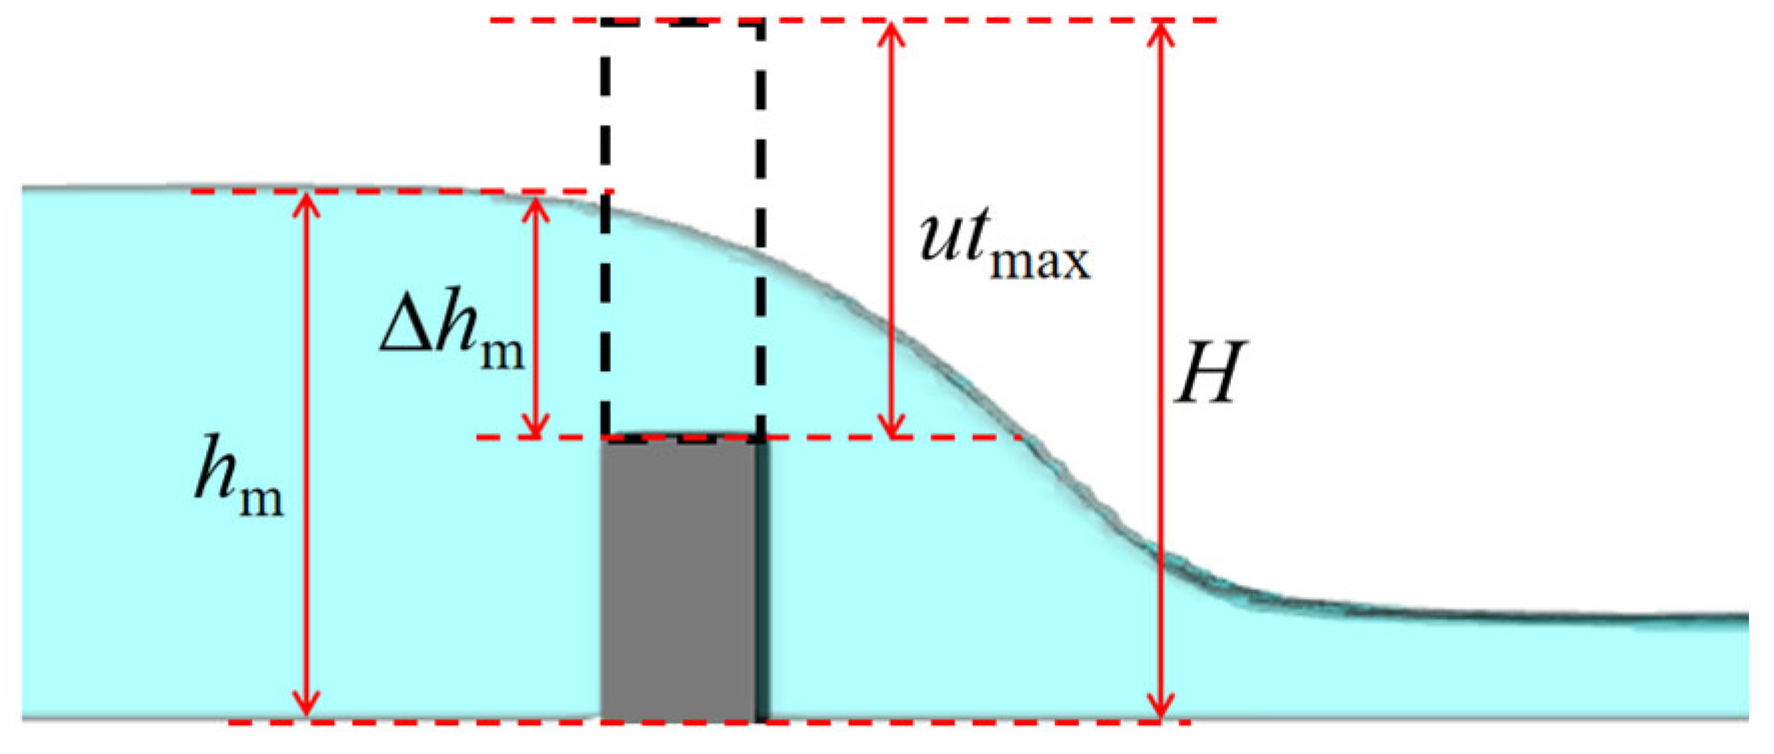
where Qmax is the peak flood discharge at the dam site; µ is the flow coefficient; B is the flume width; ∆hm is the head above the dam at the time of peak discharge (Figure 16), with ∆hm = hm + utmaxH, with hm being the water depth upstream of the dam at the time of peak flood discharge.
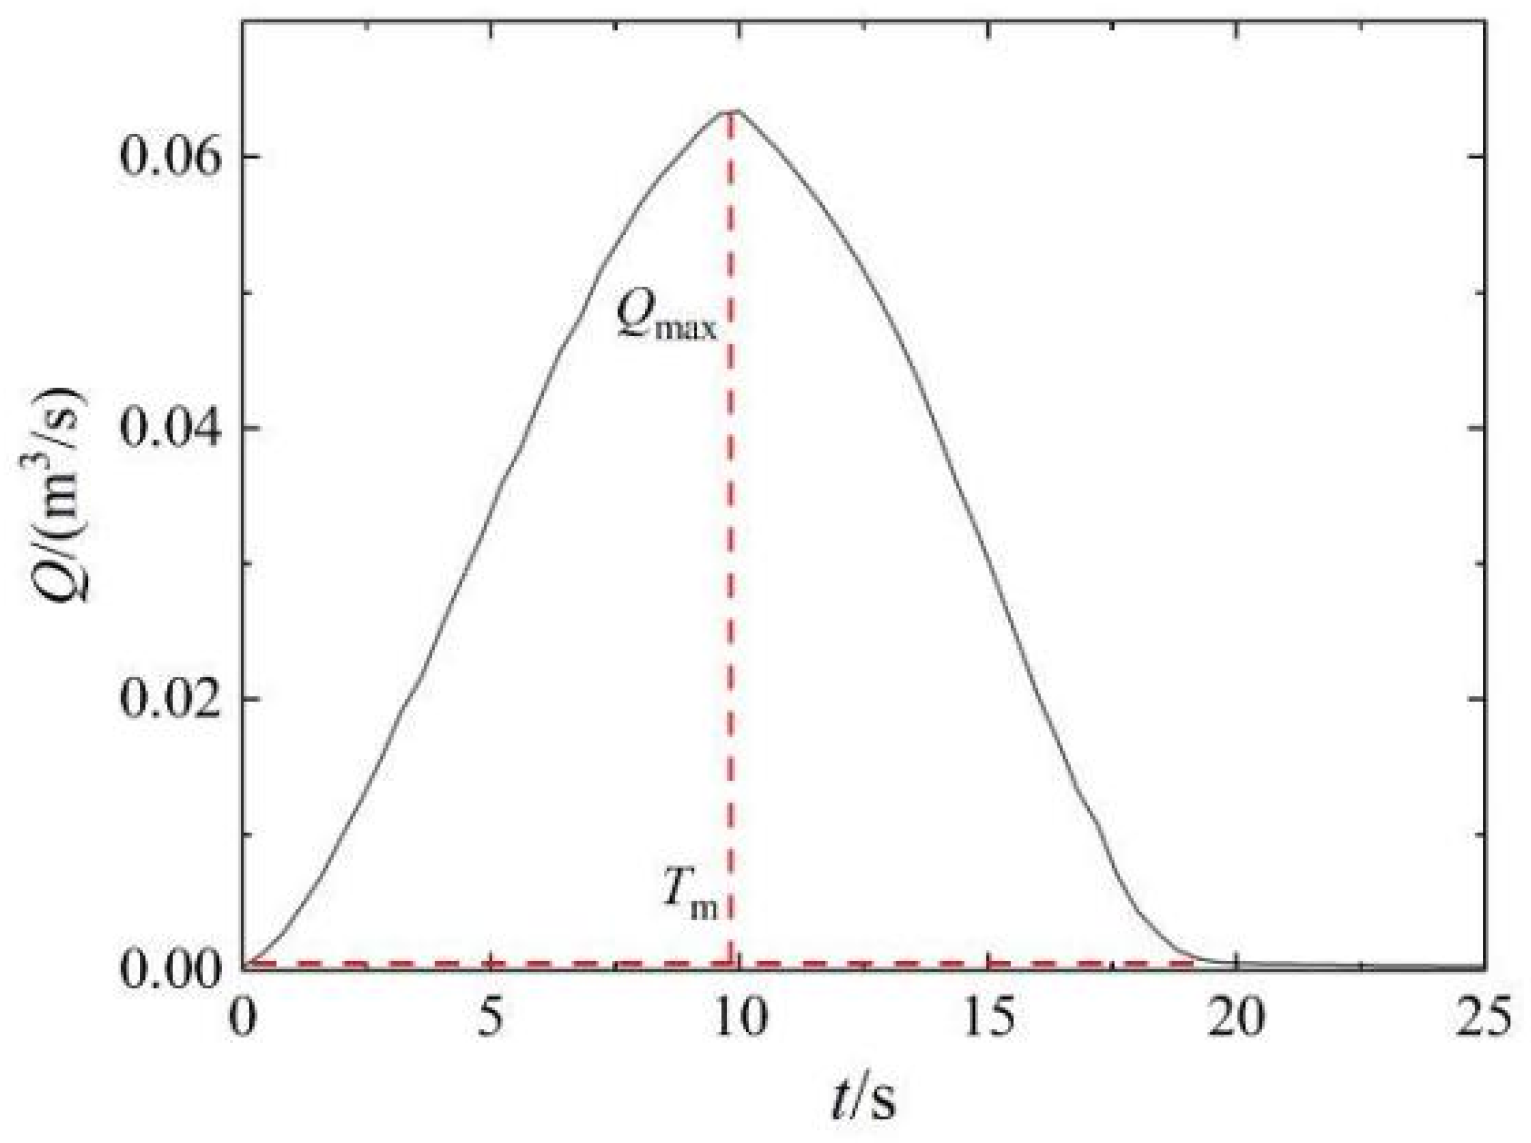
The main discharge occurs in the first flow process. As shown in Figure 17, the flow processes at different break speeds at the dam site are simplified into triangles. According to the water balance, there is Equation (9) for the entire flow process.
W z = 1 2 Q max T m
where Wz is the total reservoir volume; Tm is the total duration of the flow process.
Assume that the relationship between the upstream reservoir volume and the water depth in front of the dam is Equation (10):
W = a h n
where a and n are reservoir characteristic coefficients.
At the initial moment t0 before the dam break, there is Equation (11):
W z = a h 0 n
where h0 is the water depth in front of the dam at time t0.
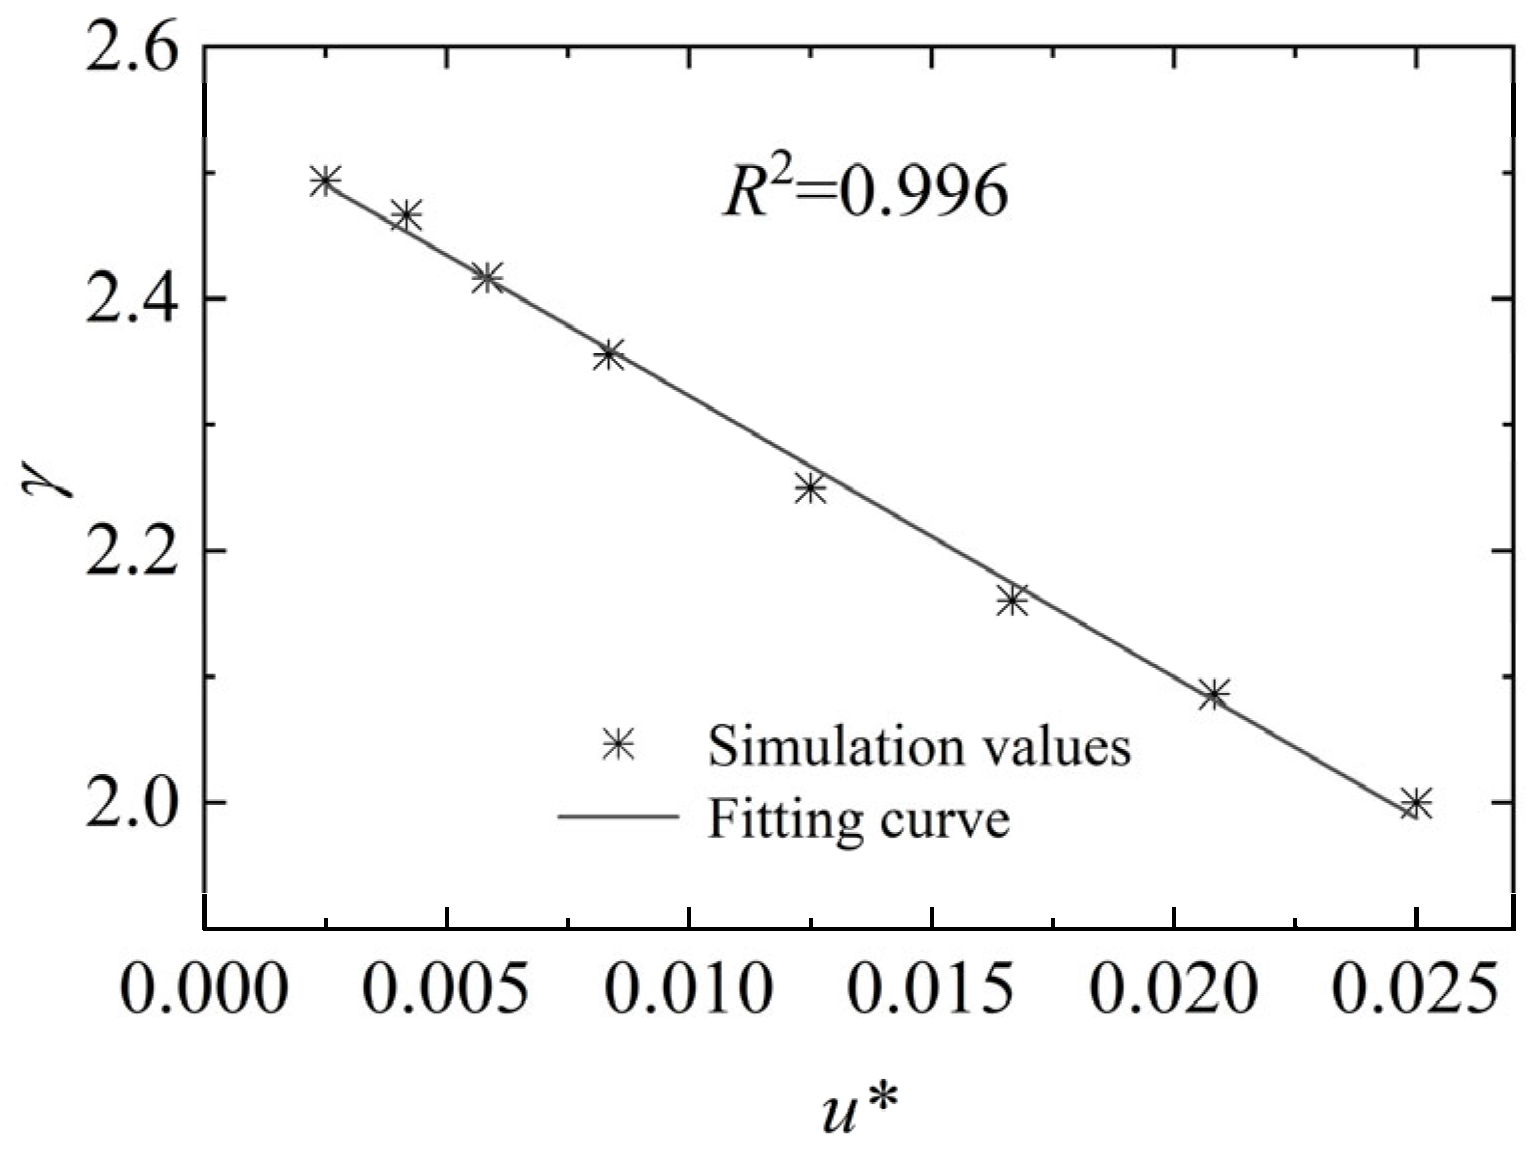
To describe the relative relationship between the peak arrival time tmax and the total duration Tm of the flow process, we define the peak process coefficient γ as Equation (12).
γ = T m t max
At the peak discharge time tmax, the volume of water discharged from the reservoir is W z γ . The remaining water volume in the upstream reservoir is γ 1 γ W z . Therefore, at the peak discharge time tmax, there is Equation (13).
γ 1 γ W z = a h m n
By combining Equations (11) and (13), the relationship between the water depth hm at the peak arrival time and the initial water depth h0 can be obtained (Equation (14)).
h m = γ 1 γ 1 n h 0
Substituting Equation (14) into Equation (8), we can derive the calculation formula (Equation (15)) for the peak flood discharge Qmax at the dam site.
Q max = μ B 2 g γ 1 γ 1 n h 0 H + u t max 3 2
Using the peak arrival coefficient β from Equation (7) in Equation (15), and eliminating the peak arrival time tmax with the peak coefficient β, there is Equation (16).
Q max = μ B 2 g γ 1 γ 1 n h 0 1 β H 3 2
In Equation (16), there are four coefficients: µ, n, γ, and β. The flow coefficient µ is taken as 0.296 based on the Ritter solution [4]. For each specific reservoir, the reservoir characteristic coefficient n is uniquely determined. In this paper, the relationship between water level and reservoir volume is given by Equation (17), where n is 2. As shown in Figure 18 and Figure 19, the fitting curves of the peak process coefficient γ and peak arrival coefficient β are obtained based on the numerical simulation results. The fitting formulas for these coefficients are given by Equations (18) and (19). Once the break speed u* is determined, the coefficients γ and β can be determined from the fitting formulas.
W = 14.32 h 2
γ = 2.55 22.32 u *
β = 1 0.98 exp 139.2 u *
Different break speeds (u*) of the dam lead to different peak process coefficients (γ) and peak coefficients (β). The break speed (u*) affects the peak arrival time (tmax), the total duration of the flow process (Tm), and the total duration of the dam break (Tu), thereby influencing the peak flood discharge (Qmax) at the dam site.
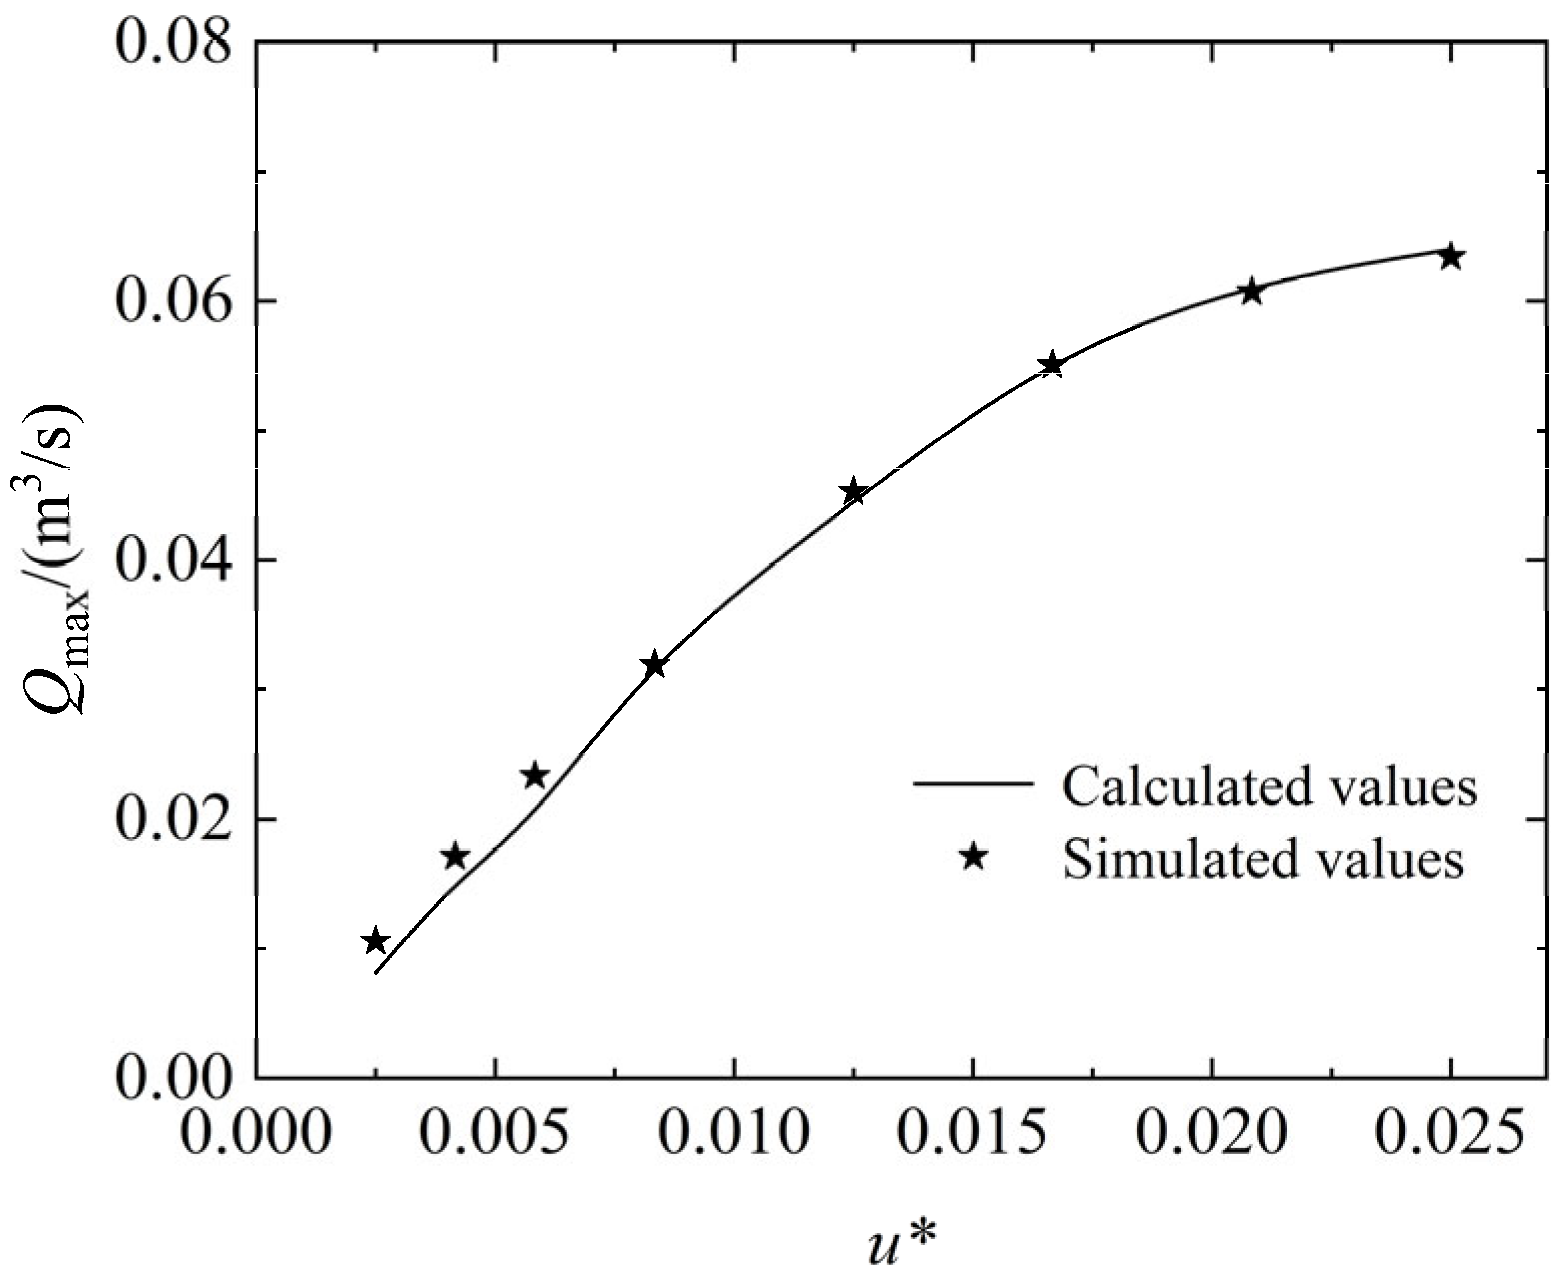
Based on the above analysis, when the dam break speed (u*), flume width (B), dam height (H), and initial water depth (h0) in front of the dam are known, the peak flood discharge at the dam site under different break speeds can be calculated using Equation (16). Figure 20 compares the calculated peak flood discharge values with the simulated values, showing good agreement and indicating that the calculation formula has a certain level of accuracy.

6. Conclusions

The cascade development of rivers allows for more efficient and rational use of water resources. Research on the flood propagation patterns in cascade reservoir systems is essential. Different dam break speeds result in varying characteristics of the outflow from the breach and their effects on downstream areas. Exploring the movement patterns of dam break floods between reservoirs under the effect of dam break speeds is crucial for flood prevention and emergency response. Based on laboratory flume experiments and a three-dimensional numerical model, this study analyzes the evolution patterns of dam break floods in downstream reservoirs under the influence of different dam break speeds. The main conclusions are as follows:
  • The dam break speeds determines the concavity and convexity of the water level curve changes in the upstream reservoir and the generation of negative waves. Accordingly, the dam break process is divided into three modes: an instant dam break, a fast dam break, and a slow dam break. In this study, it can be approximately considered that u* = 0.0083 is the critical speed between the fast and slow dam break modes. When the dam break speed tends to infinity, it is an instant dam break, and the water level changing curve of the upstream reservoir is a “concave curve,” with a significant negative wave propagating upstream. When the dam break speed u* > 0.0083, it is a fast dam break, and the water level process at the dam site initially shows a convex curve followed by a concave curve, with a negative wave propagating upstream. When the dam break speed u* < 0.0083, it is a slow dam break, and the water level process at the dam site is generally a convex curve, with no negative wave generated.
  • Different dam break speeds determine different evolution patterns of dam break floods in downstream reservoirs. During an instant dam break, the flood evolves in a leaping pattern; during a fast dam break, it evolves in a climbing pattern; and during a slow dam break, it evolves in a lifting pattern. Additionally, under the slow dam break mode, the peak flood discharge in the downstream reservoir increases linearly with the dam break speed. Under the fast dam break mode, the increase in peak flood discharge significantly slows down with the break speed. The study results show that when the dam break speed reaches 2.5% of the theoretical instantaneous break speed (u* = 0.0250), the peak flood discharge at the dam site reaches 85% of that in the instant dam break. Further increases in dam break speed have little effect on the peak flood discharge.
  • A calculation model for the peak flood discharge at the dam site during a gradual dam break at a certain speed is established. The dam break speed influences the peak arrival time, the total duration of the flow process, and the total duration of the dam break, thereby affecting the peak discharge rate at the dam site.

Author Contributions

Conceptualization, H.B. and F.Z.; methodology, H.B.; software, H.B.; validation, F.Z., L.Z. and X.Z.; formal analysis, H.B.; investigation, H.B., X.Z. and L.Y.; resources, F.Z.; data curation, X.Z. and L.Y.; writing—original draft preparation, H.B.; writing—review and editing, H.B. and L.Z.; funding acquisition, F.Z. All authors have read and agreed to the published version of the manuscript.

Funding

This research was funded by the National Natural Science Foundation of China (Grant No: 52192673).

Data Availability Statement

The experimental data of this article can be obtained from the corresponding author.

Conflicts of Interest

The authors declare no conflicts of interest. Author Liang Yin is employed by Power China Huadong Engineering Corporation Limited. The remaining authors declare that the research was conducted in the absence of any commercial or financial relationships that could be construed as a potential conflicts of interest.

List of Symbols

huInitial water depth before upstream dam (m)
hdInitial water depth before downstream dam (m)
S0Bottom slope of flume
gGravitational acceleration (m/s2)
hd/huWater depth ratio
uDam break speed (m/s)
u* Dimensionless   dam   break   speed   u * = u / ( H / t op )
QmaxPeak flood discharge (m3/s)
TuTotal duration of dam break when the break speed is u (s)
TmTotal duration of flow process (s)
kThe rate of water level decline
tmaxPeak arrival time (s)
topIdentification time for instantaneous dam break (s)
HDam height (m)
zWater level (m)
BFlume width (m)
vWater flow velocity (m/s)
qPeak discharge coefficient
βPeak arrival coefficient
γPeak process coefficient

References

  1. Bosa, S.; Petti, M. A Numerical Model of the Wave that Overtopped the Vajont Dam in 1963. Water Resour. Manag. 2013, 27, 1763–1779. [Google Scholar] [CrossRef]
  2. Wang, B.; Zhang, T.; Zhou, Q.; Wu, C.; Chen, Y.L.; Wu, P. A case study of the Tangjiashan landslide dam-break. J. Hydrodyn. 2015, 27, 223–233. [Google Scholar] [CrossRef]
  3. Aureli, F.; Maranzoni, A.; Petaccia, G. Review of Historical Dam-Break Events and Laboratory Tests on Real Topography for the Validation of Numerical Models. Water 2021, 13, 1968. [Google Scholar] [CrossRef]
  4. Ritter, A. The propagation of water waves. Ver. Deutsh. Ingenieure Zeitschr. 1892, 36, 947–954. [Google Scholar]
  5. Dressler, R.F. Hydraulic Resistance Effect Upon the Dam-Break Functions. J. Res. Natl. Bur. Stand. 1952, 49, 217–225. [Google Scholar] [CrossRef]
  6. Dressler, R.F. Unsteady Non-Linear Waves in Sloping Channels. Proc. R. Soc. A 1958, 247, 186–198. [Google Scholar]
  7. Su, S.T.; Barnes, A.H. Geometric and frictional effects on sudden release. J. Hydraul. Div. 1970, 96, 2185–2200. [Google Scholar] [CrossRef]
  8. Hunt, B. Asymptotic solution for dam-break problem. J. Hydraul. Div. 1982, 108, 115–126. [Google Scholar] [CrossRef]
  9. Hunt, B. Asymptotic solution for dam-break on sloping channel. J. Hydraul. Div. 1983, 109, 1698–1706. [Google Scholar] [CrossRef]
  10. Hunt, B. Dam-break solution. J. Hydraul. Eng. 1984, 110, 675–686. [Google Scholar] [CrossRef]
  11. Hunt, B. Perturbation solution for dam-break floods. J. Hydraul. Eng. 1984, 110, 1058–1071. [Google Scholar] [CrossRef]
  12. Wang, B.; Chen, Y.L.; Wu, C.; Peng, Y.; Ma, X.; Song, J.J. Analytical solution of dam-break flood wave propagation in a dry sloped channel with an irregular-shaped cross-section. J. Hydro-Environ. Res. 2017, 14, 93–104. [Google Scholar] [CrossRef]
  13. Stansby, P.K.; Chegini, A.; Barnes, T.C.D. The initial stages of dam-break flow. J. Fluid Mech. 1998, 374, 407–424. [Google Scholar] [CrossRef]
  14. Liu, H.; Liu, H.J. Experimental Study on Dam-Break Hydrodynamic Characteristics Under Different Conditions. J. Disaster Res. 2017, 12, 198–207. [Google Scholar] [CrossRef]
  15. Aleixo, R.; Soares-Frazao, S.; Zech, Y. Velocity-field measurements in a dam-break flow using a PTV Voronoï imaging technique. Exp. Fluids 2011, 50, 1633–1649. [Google Scholar] [CrossRef]
  16. Zhang, L.Y.; Zhang, F.X.; Xu, W.L.; Bo, H.J.; Zhang, X.L. An innovative method for measuring the three-dimensional water surface morphology of unsteady flow using light detection and ranging technology. Ocean Eng. 2023, 276, 114079. [Google Scholar] [CrossRef]
  17. Lauber, G.; Hager, W.H. Experiments to dambreak wave: Horizontal channel. J. Hydraul. Res. 1998, 36, 291–307. [Google Scholar] [CrossRef]
  18. Frazao, S.S.; Zech, Y. Dam Break in Channels with 90° Bend. J. Hydraul. Eng. 2002, 128, 956–968. [Google Scholar] [CrossRef]
  19. LaRocque, L.A.; Imran, J.; Chaudhry, M.H. Experimental and numerical investigations of two-dimensional dam-break flows. J. Hydraul. Eng. 2013, 139, 569–579. [Google Scholar] [CrossRef]
  20. Guerra, M.; Cienfuegos, R.; Escauriaza, C.; Marche, F.; Galaz, J. Modeling Rapid Flood Propagation Over Natural Terrains Using a Well-Balanced Scheme. J. Hydraul. Eng. 2014, 140, 04014026. [Google Scholar] [CrossRef]
  21. Chang, T.J.; Kao, H.M.; Chang, K.H.; Hsu, M.H. Numerical simulation of shallow-water dam break flows in open channels using smoothed particle hydrodynamics. J. Hydrol. 2011, 408, 78–90. [Google Scholar] [CrossRef]
  22. Jaan, H.P.; Shao, S.D.; Huang, Y.F.; Hussain, K. Evaluations of SWEs and SPH numerical modeling techniques for dam break flows. Eng. Appl. Comput. Fluid Mech. 2013, 7, 544–563. [Google Scholar] [CrossRef]
  23. Zhou, Z.; Wang, X.; Chen, W.; Deng, S.; Liu, M. Numerical Simulation of Dam-Break Flooding of Cascade Reservoirs. Trans. Tianjin Univ. 2017, 23, 570–581. [Google Scholar] [CrossRef]
  24. Elliot, R.C.; Chaudhry, M.H. A wave propagation model for two-dimensional dam-break flows. J. Hydraul. Res. 1992, 30, 200–221. [Google Scholar] [CrossRef]
  25. Wang, J.S.; Ni, H.G.; He, Y.S. Finite-Difference TVD Scheme for Computation of Dam-Break Problems. J. Hydraul. Eng. 2000, 126, 253–261. [Google Scholar] [CrossRef]
  26. Peng, Y.; Meng, J.P.; Zhang, J.M. Multispeed Lattice Boltzmann Model with Space-Filling Lattice for Transcritical Shallow Water Flows. Math. Probl. Eng. 2017, 2017, 8917360. [Google Scholar] [CrossRef]
  27. Maranzoni, A.; Tomirotti, M. Three-Dimensional Numerical Modelling of Real-Field Dam-Break Flows: Review and Recent Advances. Water 2023, 15, 3130. [Google Scholar] [CrossRef]
  28. Kocaman, S.; Güzel, H.; Evangelista, S.; Ozmen-Cagatay, H.; Viccione, G. Experimental and Numerical Analysis of a Dam-Break Flow through Different Contraction Geometries of the Channel. Water 2020, 12, 1124. [Google Scholar] [CrossRef]
  29. Yang, C.; Lin, B.L.; Jiang, C.; Liu, Y. Predicting near-field dam-break flow and impact force using a 3D model. J. Hydraul. Res. 2010, 48, 784–792. [Google Scholar] [CrossRef]
  30. Cao, Z.; Huang, W.; Pender, G.; Liu, X. Even more destructive: Cascade dam break floods. J. Flood Risk Manag. 2014, 7, 357–373. [Google Scholar] [CrossRef]
  31. Panicker, P.G.; Goel, A.; Iyer, H.R. Numerical Modeling of Advancing Wave Front in Dam Break Problem by Incompressible Navier-Stokes Solver. Aquat. Procedia 2015, 4, 861–867. [Google Scholar] [CrossRef]
  32. Říha, J.; Kotaška, S.; Petrula, L. Dam Break Modeling in a Cascade of Small Earthen Dams: Case Study of the Čižina River in the Czech Republic. Water 2020, 12, 2309. [Google Scholar] [CrossRef]
  33. Xue, Y.; Xu, W.L.; Luo, S.J.; Chen, H.Y.; Li, N.W.; Xu, L.J. Experimental study of dam-break flow in cascade reservoirs with steep bottom slope. Chin. J. Hydrodyn. 2011, 23, 491–497. [Google Scholar] [CrossRef]
  34. Chen, H.Y.; Xu, W.L.; Deng, J.; Xue, Y.; Li, J. Experimental investigation of pressure load exerted on a downstream dam by dam-break flow. J. Hydraul. Eng. 2014, 140, 199–207. [Google Scholar] [CrossRef]
  35. Zhang, Y.K.; Xu, W.L. Retarding Effects of an Intermediate Intact Dam on the Dam-Break Flow in Cascade Reservoirs. J. Hydraul. Res. 2017, 55, 438–444. [Google Scholar] [CrossRef]
  36. Aureli, F.; Maranzoni, A.; Petaccia, G.; Soares-Frazão, S. Review of Experimental Investigations of Dam-Break Flows over Fixed Bottom. Water 2023, 15, 1229. [Google Scholar] [CrossRef]
  37. Wang, H.; Murzyn, F.; Chanson, H. Interaction between free-surface, two-phase flow and total pressure in hydraulic jump. Exp. Therm. Fluid Sci. 2015, 64, 30–41. [Google Scholar] [CrossRef]
  38. Lauber, G.; Hager, W.H. Experiments to dam break wave: Slope channel. J. Hydraul. Res. 1998, 36, 761–773. [Google Scholar] [CrossRef]
  39. Dam Safety Management Center of the Ministry of Water Resources, People’s Republic of China. Dam Breach Register Book of the National Reservoirs; Dam Safety Management Center of the Ministry of Water Resources, People’s Republic of China: Nanjing, China, 2021. (In Chinese) [Google Scholar]
  40. Lu, Q.; Gu, Y.; Wang, S.; Liu, X.; Wang, H. Deformation Field Analysis of Small-Scale Model Experiment on Overtopping Failure of Embankment Dams. Water 2023, 15, 4309. [Google Scholar] [CrossRef]
  41. Quecedo, M.; Pastor, M.; Herreros, M.I.; Fernández-Merodo, J.A.; Zhang, Q. Comparison of two mathematical models for solving the dam break problem using the FEM method. Comput. Methods Appl. Mech. Eng. 2005, 194, 3984–4005. [Google Scholar] [CrossRef]
  42. Biscarini, C.; Di Francesco, S.; Manciola, P. CFD modelling approach for dam break flow studies. Hydrol. Earth Syst. Sci. 2010, 14, 705–718. [Google Scholar] [CrossRef]
  43. Marsooli, R.; Wu, W. 3-D finite-volume model of dam-break flow over uneven beds based on VOF method. Adv. Water Resour. 2014, 70, 104–117. [Google Scholar] [CrossRef]
  44. Ye, Z.; Zhao, X. Investigation of water-water interface in dam break flow with a wet bed. J. Hydrol. 2017, 548, 104–120. [Google Scholar] [CrossRef]
  45. Flow Science Inc. Flow-3D Users Manual; Flow Science Inc.: Santa Fe, NM, USA, 2016. [Google Scholar]
  46. Larocque, L.A.; Imran, J.; Chaudhry, M.H. 3D numerical simulation of partial breach dam-break flow using the LES and k-ε turbulence models. J. Hydraul. Res. 2013, 51, 145–157. [Google Scholar] [CrossRef]
  47. Hirt, C.W.; Nichols, B.D. Volume of fluid (VOF) method for the dynamics of free boundaries. J. Comput. Phys. 1981, 39, 201–225. [Google Scholar] [CrossRef]
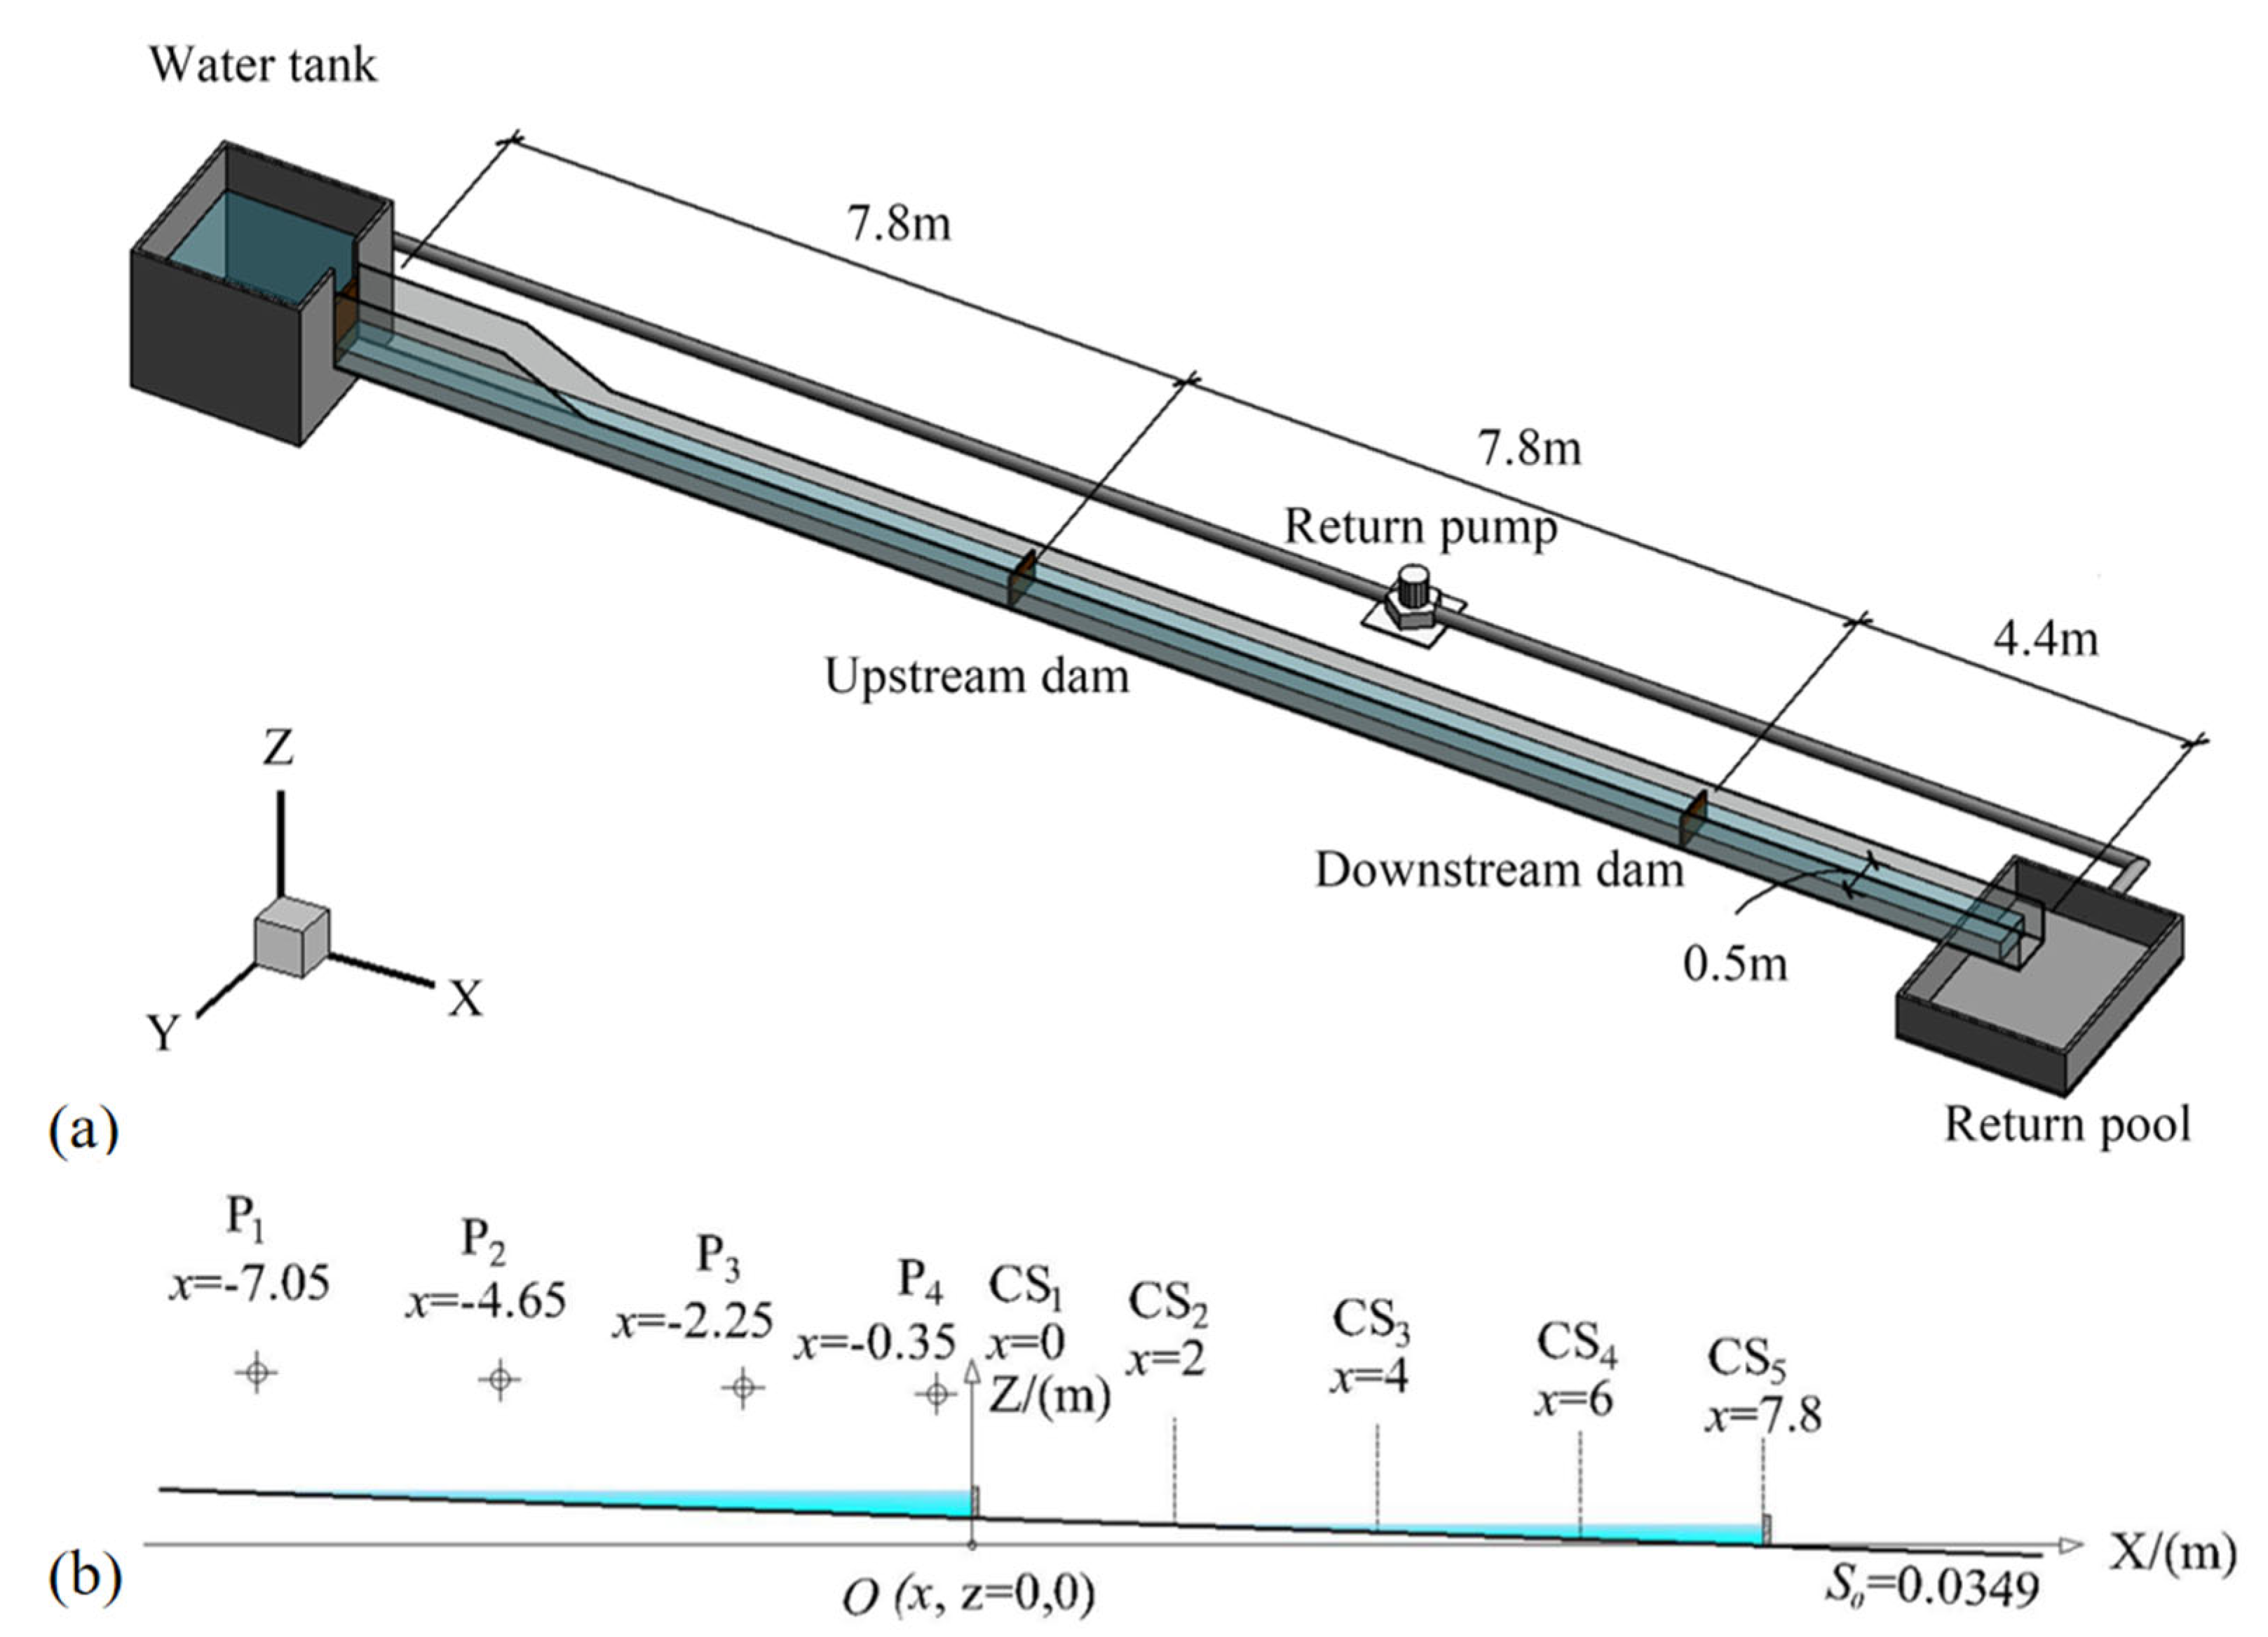
Figure 1. Experimental setup. (a) Three-dimensional model of the experimental system; (b) locations of water level monitoring points and discharge measurement sections.
Water 16 02993 g001
Figure 2. Comparison of water levels along the reservoir at t = 2.0 s after the instantaneous break of the upstream dam under different grid sizes in the z-direction.
Water 16 02993 g002
Figure 3. The simulation results of the dam breaking at different times. (a) t = t1; (b) t = t1 + t.
Water 16 02993 g003
Figure 4. Comparison of dam break flood evolution patterns at upstream instantaneous dam breaks (u* ≈ ∞). (a1) t = 1.2 s (Experimental result); (a2) t = 1.2 s (Simulation result); (b1) t = 3.4 s (Experimental result); (b2) t = 3.4 s (Simulation result); (c1) t = 13.2 s (Experimental result); (c2) t = 13.2 s (Simulation result).
Water 16 02993 g004
Figure 5. Comparison of water levels at point P4 for different upstream break speeds: experiment vs. simulation.
Water 16 02993 g005
Figure 6. Water level time series at points P1–P4 in the upstream reservoir for different upstream dam break speeds.
Water 16 02993 g006
Figure 7. Water level variation curves and corresponding decline rates for three break modes.
Water 16 02993 g007
Figure 8. Dam break flood evolution pattern under the instant dam break mode (u* ≈ ∞). (a) Experimental flood evolution patterns at different times; (b) leaping pattern of the dam break flood.
Water 16 02993 g008
Figure 9. Dam break flood evolution pattern under the fast dam break mode (u* = 0.0250). (a) Experimental flood evolution patterns at different times; (b) climbing pattern of the dam break flood.
Water 16 02993 g009
Figure 10. Dam break flood evolution pattern under the slow dam break mode (u* = 0.0042). (a) Experimental flood evolution patterns at different times; (b) lifting pattern of the dam break flood.
Water 16 02993 g010aWater 16 02993 g010b
Figure 11. Flow rate variations over time for different dam break speeds. (a) hd/hu = 1.0; (b) hd/hu = 0.67; (c) hd/hu = 0.33; (d) hd/hu = 0.
Water 16 02993 g011
Figure 12. Variations in peak flood discharge Qmax and peak arrival time tmax with dam break speed at different cross-sections. (a) Peak flood discharge; (b) Peak arrival time.
Water 16 02993 g012
Figure 13. Peak flood discharge varies with water depth ratio (hd/hu). (a) CS1; (b) CS2; (c) CS3; (d) CS4.
Water 16 02993 g013
Figure 14. Variations in peak discharge coefficient q with dam break speed at different cross-sections. (a) CS1; (b) CS2; (c) CS3; (d) CS4.
Water 16 02993 g014
Figure 15. Variations in peak arrival coefficient β with dam break speed at the dam site.
Water 16 02993 g015
Figure 16. Schematic diagram of the dam head at the time of peak flood discharge.
Water 16 02993 g016
Figure 17. Schematic diagram of the simplified flow process at the dam site.
Water 16 02993 g017
Figure 18. Curve of peak process coefficient γ.
Water 16 02993 g018
Figure 19. Curve of peak arrival coefficient β.
Water 16 02993 g019
Figure 20. Comparison of calculated and simulated peak flood discharge values at the dam site for different break speeds.
Water 16 02993 g020
Table 1. Experimental conditions and non-dimensionalization of dam break speed.
u/(cm/s)0.30.50.71.01.52.02.53.0
u*0.00250.00420.00580.00830.01250.01670.02080.0250
Tu/s10060463020151210/
Disclaimer/Publisher’s Note: The statements, opinions and data contained in all publications are solely those of the individual author(s) and contributor(s) and not of MDPI and/or the editor(s). MDPI and/or the editor(s) disclaim responsibility for any injury to people or property resulting from any ideas, methods, instructions or products referred to in the content.