Article

Mitigation of Fluoride Contamination in Drinking Water Supply Sources by Adsorption Using Bone Char: Effects of Mineral and Organic Matrix

by
Mohamed Raoul Ibrahim
1,
Joshua Akinropo Oyetade
1,
Sadou Dalhatou
2,*,
Anton Nikiforov
3,
Christophe Leys
3 and
Askwar Hilonga
1,*
1
School of Materials, Energy, Water and Environmental Sciences, Nelson Mandela African Institution of Science and Technology, Arusha P.O. Box 447, Tanzania
2
Department of Chemistry, Faculty of Science, University of Maroua, Maroua P.O. Box 814, Cameroon
3
Department of Applied Physics, Ghent University, Saint-Pietersnieuwstraat 41 B4, 9000 Ghent, Belgium
*
Authors to whom correspondence should be addressed.
Water 2024, 16(20), 2991; https://doi.org/10.3390/w16202991
Submission received: 20 August 2024 / Revised: 5 October 2024 / Accepted: 12 October 2024 / Published: 20 October 2024
(This article belongs to the Section Wastewater Treatment and Reuse)

Abstract

:
This study focused on fluoride (F) contamination of water sources in Bahimi village, Cameroon. After the first investigation, results revealed that all water samples collected had elevated concentrations of fluoride ions (2.3 ± 0.1) mg/L to (4.5 ± 0.2) mg/L above the WHO guidelines (less than 1.5 mg/L). To mitigate the F levels, the use of bone char (BC) as an adsorbent material was proposed and its performance was tested. BC was prepared from bovine bones at different calcination temperatures (350 °C, 450 °C, 550 °C and 650 °C) and residence times (1 h and 2 h). The prepared materials were characterized in detail by SEM/EDS, BET, FTIR, and XRD. The BET findings indicated that the surface area of BC samples decreased with increasing calcination temperature and residence time. At a lower heating temperature and holding time (350 °C, 1 h), the prepared BC exhibited a higher specific surface area (112.3 ± 0.3) m2/g and adsorption capacity for F in the sampled water. Also, the batch adsorption experiments showed that the optimized adsorbent dose of 8 g/L facilitates the reduction in the F level of the sampled water below the acceptable limit level (1.5 mg/L) within 5 min of treatment. The presence of Ca2+ and Mg2+ in natural water has a positive effect on the removal of F in BC resulting in a high adsorption performance range of (72.5 ± 1.4)% to (80.3 ± 0.6)%. It was found that the adsorption of Ca2+ on the BC surface occurs via cation exchange with Na+. However, an increase in dissolved organic carbon (DOC) in the treated water limited the application of BC. Overall, the study presented a cost-effective adsorbent for the removal of this recalcitrant ion in the water source.

1. Introduction

The World Health Organization (WHO) recognizes fluoride ion (F) contamination in water as a major threat to human health. Apart from microbial contamination of the water source, pollution evolving from F is considered as the second highest challenge that limits the availability of potable water for consumption [1]. The maximum acceptable content of F in water for drinking should be 1.5 mg/L following the WHO guidelines [2]. At concentrations above 1.5 mg/L, it can be harmful, causing dental and skeletal fluorosis [3]. Apart from its primary effect on bones and teeth, excess intake of F has deleterious effect on vital processes in human respiratory, digestive, nervous, reproductive, and excretory systems [4]. Despite the obvious health hazard, there are reported cases of over 180 million people globally consuming water containing F exceeding WHO requirements [4,5]. The level of consumption reported is most prevalent among sub-Saharan African countries such as Tanzania, Sudan, Malawi, South Africa, Kenya, Ethiopia, Uganda, Nigeria, Ghana, Niger, Benin, and Cameroon [6]. In Cameroon, F contamination has been investigated quantitatively and qualitatively with the first report conducted by Fantong et al. (2010) [7]. The study reported the concentration range of F within the study area to be 0.19 to 15.20 mg/L, with more than half a million of the inhabitants susceptible to dental health-related disease. Also, the northern region of Cameroon reportedly has an excess of F (1.5–3.0 mg/L) in the groundwater along the Benue River Basin in localities such as Figuil, Garoua, Pitoa, and Barnaké [8]. Within this northern region, a significant rise in dental fluorosis has equally been observed among the local inhabitants of the Bahimi village, which points to the effect of significant fluoride contamination of their groundwater. However, to the best of our knowledge, no data are available on the F content of drinking water in this area.
In recent years, various methods have been used for F removal. These include coagulation/precipitation, membrane filtration, ion exchange, and adsorption methods. However, among these technologies, the adsorption process is considered to be the most economical and energy-efficient technique for removing F from water [9,10]. Also, among materials that have been experimented on and applied as adsorbent for the removal of F, bone char (BC) has demonstrated incredible efficiency. The use of this bio-based adsorbent (BC) for defluoridation of water is favorable due to its availability, simplicity of preparation, low cost, biodegradability, and low environmental impact [11,12,13,14]. The literature indicates that adsorption of F on BC can be affected by many factors such as the preparation conditions of the material, solution pH, contact time, initial concentration of F, adsorbent dose, solution temperature, and water matrix [14]. Among the stated factors, water matrix can influence the removal of F due to the presence of anions, cations, and natural organic matter (NOM). Generally, the presence of anions in aqueous solution may compete with F at adsorption sites and reduce removal efficiency, which is in contrast with the presence of metal cations which aid the removal efficiency. Despite the efforts, most studies are limited to analyzing the effect of anions and cations using deionized or simulated water which can neither reflect nor represent raw water with exactitude.
Apart from the presence of dissolved ions, raw water sources may contain NOM. In general, NOM is considered as a pollutant that needs to be removed from drinking water. At high concentrations in water, NOM can react with chlorine (commonly used water disinfectant) which can form potentially harmful by-products such as trihalomethanes and haloacetic acids [15,16,17,18]. The major derivative of NOM is the dissolved organic carbon (DOC) which forms specific fraction with negatively charged surface functional groups competing with F for adsorption sites, thereby limiting the use of conventional adsorbents [19]. The bridge to this limitation of conventional adsorbent is the use of bone char (BC) studied by Brunson et al. (2014) [19], whose report identified that Pahokee Peat humic acid (PPHA) and Nordic Aquatic fulvic acid (NAFA) showed no competition with F on adsorption onto BC. In another study, it was demonstrated that DOC can be removed from raw water using pig bone char in the absence of fluoride ions in the water sample [20]. However, the need still arises to evaluate the adsorptive performance of BC using real-time raw water with natural contamination of F and to analyze the effects of DOC on F removal. The present study, therefore, was conducted to assess the F concentrations in different water supply sources of Bahimi village and to investigate the effect of anions, cations, and DOC present in raw water on F adsorption by BC. The interest of this work lies in the desire to find a solution to the public health concern linked to the natural presence of fluoride ions (fluorosis) by eliminating them completely from drinking water.

2. Materials and Methods

2.1. Sampling and Study Area

The raw water samples were collected in July 2023 in Bahimi village located in the Bibemi district of Benue Department in the Northern region of Cameroon (Figure 1). In total, four (4) samples were randomly taken from wells and water boreholes. These samples were randomly collected from the main water sources supply in the study area (Table 1).

2.2. Determination of Some Parameters (Ions, pH, and Dissolved Organic Carbon)

  • Ions: Analyses for main and trace ions in the sampled water, which included Chloride (Cl), Sulfate (SO42−), Nitrate (NO3), Nitrite (NO2), Fluoride (F), Phosphate (PO43−), Bromide (Br), Sodium (Na+), Potassium (K+), Calcium (Ca2+), Magnesium (Mg2+), Aluminum (Al3+), and Ferrous (Fe2+), were performed by means of ion chromatography (Metrohm IC, ECO IC combined with 863 Autosampler, MetroSep A supp 19-150/4.0 column, Swiss).
  • pH: It was determined using pH meter (Mettler Toledo FEP20).
  • Dissolved Organic Carbon (DOC): It was measured in accordance with the procedures of LCK 385 on Total Organic Carbon after the filtration of respective samples using filter paper (0.45 μm). Briefly, the water sample was filtered to remove solid particles. Next, the sample was acidified using sulfuric acid (1 M) to a pH below 2 to convert inorganic carbon and CO2 to ensure that it is removed during analysis. Next, 2 mL of the sample was placed in pre-dosed reagents (sodium persulfate and phosphoric acid) from the cuvette kit. The cuvette was then heated to 100 °C for 2 h to oxidize the organic carbon to CO2. After that, the cuvette was allowed to cool at room temperature. After cooling, the cuvette was purged with air for approximately 10 min to remove any CO2 generated from inorganic carbon. Finally, the cuvette was placed in a Hach spectrophotometer (DR 2800) and the DOC concentration (mg/L) was read in after selecting the LCK 385 method.

2.3. Preparation of Bone Char (BC)

The bone char was sourced from bovine bones (scapulae) in the city of Arusha (Tanzania). Its preparation was carried out via simple calcination. The collected bones were crushed into small pieces and boiled at 105 °C for 3 h to remove impurities (fats). Then, the bones were dried at room temperature for 12 h and at 80 °C for an additional 12 h. Later, the bones were calcined in a muffle furnace at various temperatures (350 °C, 450 °C, 550 °C, and 650 °C) and residence time of 1 and 2 h, respectively. The obtained products were ground into a fine powder using a mortar and pestle and sieved to particle sizes of 0.25–0.5 mm. Finally, the prepared BC samples were rinsed with distilled water and dried in an oven at 80 °C for 4 h.

2.4. Instrumental Characterization of Bone Char

The surface morphology of the prepared bone char was examined by Scanning electron microscope (SEM) using a JEOL JSM-7600F field emission apparatus operating at 10 kV. The crystalline structure of the materials was studied by an X-ray diffractometer (XRD) using Rigaku Ultima IV using Cu Kα radiation (k = 1.5418 A°) and a scanning rate of 0.02 s−1. The functional group characteristics of the nanomaterials were measured by Fourier Transform Infrared (FTIR) using a Bruker Tensor 27 FTIR instrument in the range of 4000 to 400 cm−1. The pore architectures and their related surface areas were investigated using Brunauer–Emmett–Teller (BET) analysis by the system (NOVA2200e) and Barrett–Joyner–Halenda (BJH) desorption isotherms.

2.5. Adsorption Experiments

The batch experiments were carried out using 50 mL of the sampled water at room temperature while the adsorbent dosage of BC used was optimized at 8 mg/L. After each experiment, the samples were filtered using filter paper and analyzed to determine the residual F concentration. The removal efficiency of F was calculated using the following formula:
%   R e m o v a l = C i C t C i × 100
where Ci and Ct are the initial and final F concentrations (mg/L) in adsorption experiments.

3. Results and Discussion

3.1. Parameter Value of Sampled Groundwater

The results of chemical parameters involving the major and minor ions, pH, and DOC content of the groundwater sample within the study area are presented in Table 2. The analyzed result was compared with the permissible limit set by the WHO standards [2]. From the analytical assay, the results presented revealed that the values of pH, Cl, SO42−, NO2, K+, Na+, Ca2+, and Mg2+ were below the permissible limits of WHO standards. However, the result equally indicated that the highest and lowest concentrations of F (2.3 ± 0.1) mg/L to (4.5 ± 0.2) mg/L, respectively, were above the limit set by the WHO (1.50 mg/L).
Fluorite, fluorapatite, cryolite, topaz, montmorillonite, kaolinite, and vermiculite known to be fluoride-bearing minerals are likely sources of fluoride in groundwater aquifers as a result of dissolution from diverse geochemical processes [21]. The continual consumption of water with high F levels can result in negative health effects such as fluorosis, ligament calcification, nerve weakness, and liver and kidney dysfunction [22]. Also, the average concentration of the nitrate level (NO3) of all the sampled water was above the tolerable limits, with the lowest value being (55.7 ± 0.2) mg/L for the water sampled at Hina and (105.7 ± 0.4) mg/L being the highest value reported for the water sampled at Djaouro Sali. According to WHO standards, the maximum acceptable limit of NO3 content in drinking water is set at 50 mg/L. Moreover, the higher microbial activities in water is in tandem with the high value of nitrates, ammonia, ammoniacal nitrogen, and nitrate, and the presence of these ions disrupts aquatic ecosystems and water quality via increased microbial activity [23,24]. Additionally, the excess presence of nitrates in groundwater can be caused by human activities such as the use of nitrogen-based fertilizers on agricultural land and live-stock waste [25]. Furthermore, DOC levels of the samples ranged from (2.5 ± 0.2) mg/L to (5.0 ± 0.2) mg/L. However, there are no specific WHO guidelines regarding the acceptable concentration value of DOC for drinking water. These results revealed the need for the treatment of contaminated groundwater (with F and NO3) largely consumed by the inhabitants. In the present work, the focus is on F removal using BC as the most affordable, available, and free in this region.

3.2. Characterization of the Prepared Bone Char (BC)

3.2.1. XRD and FTIR Analysis

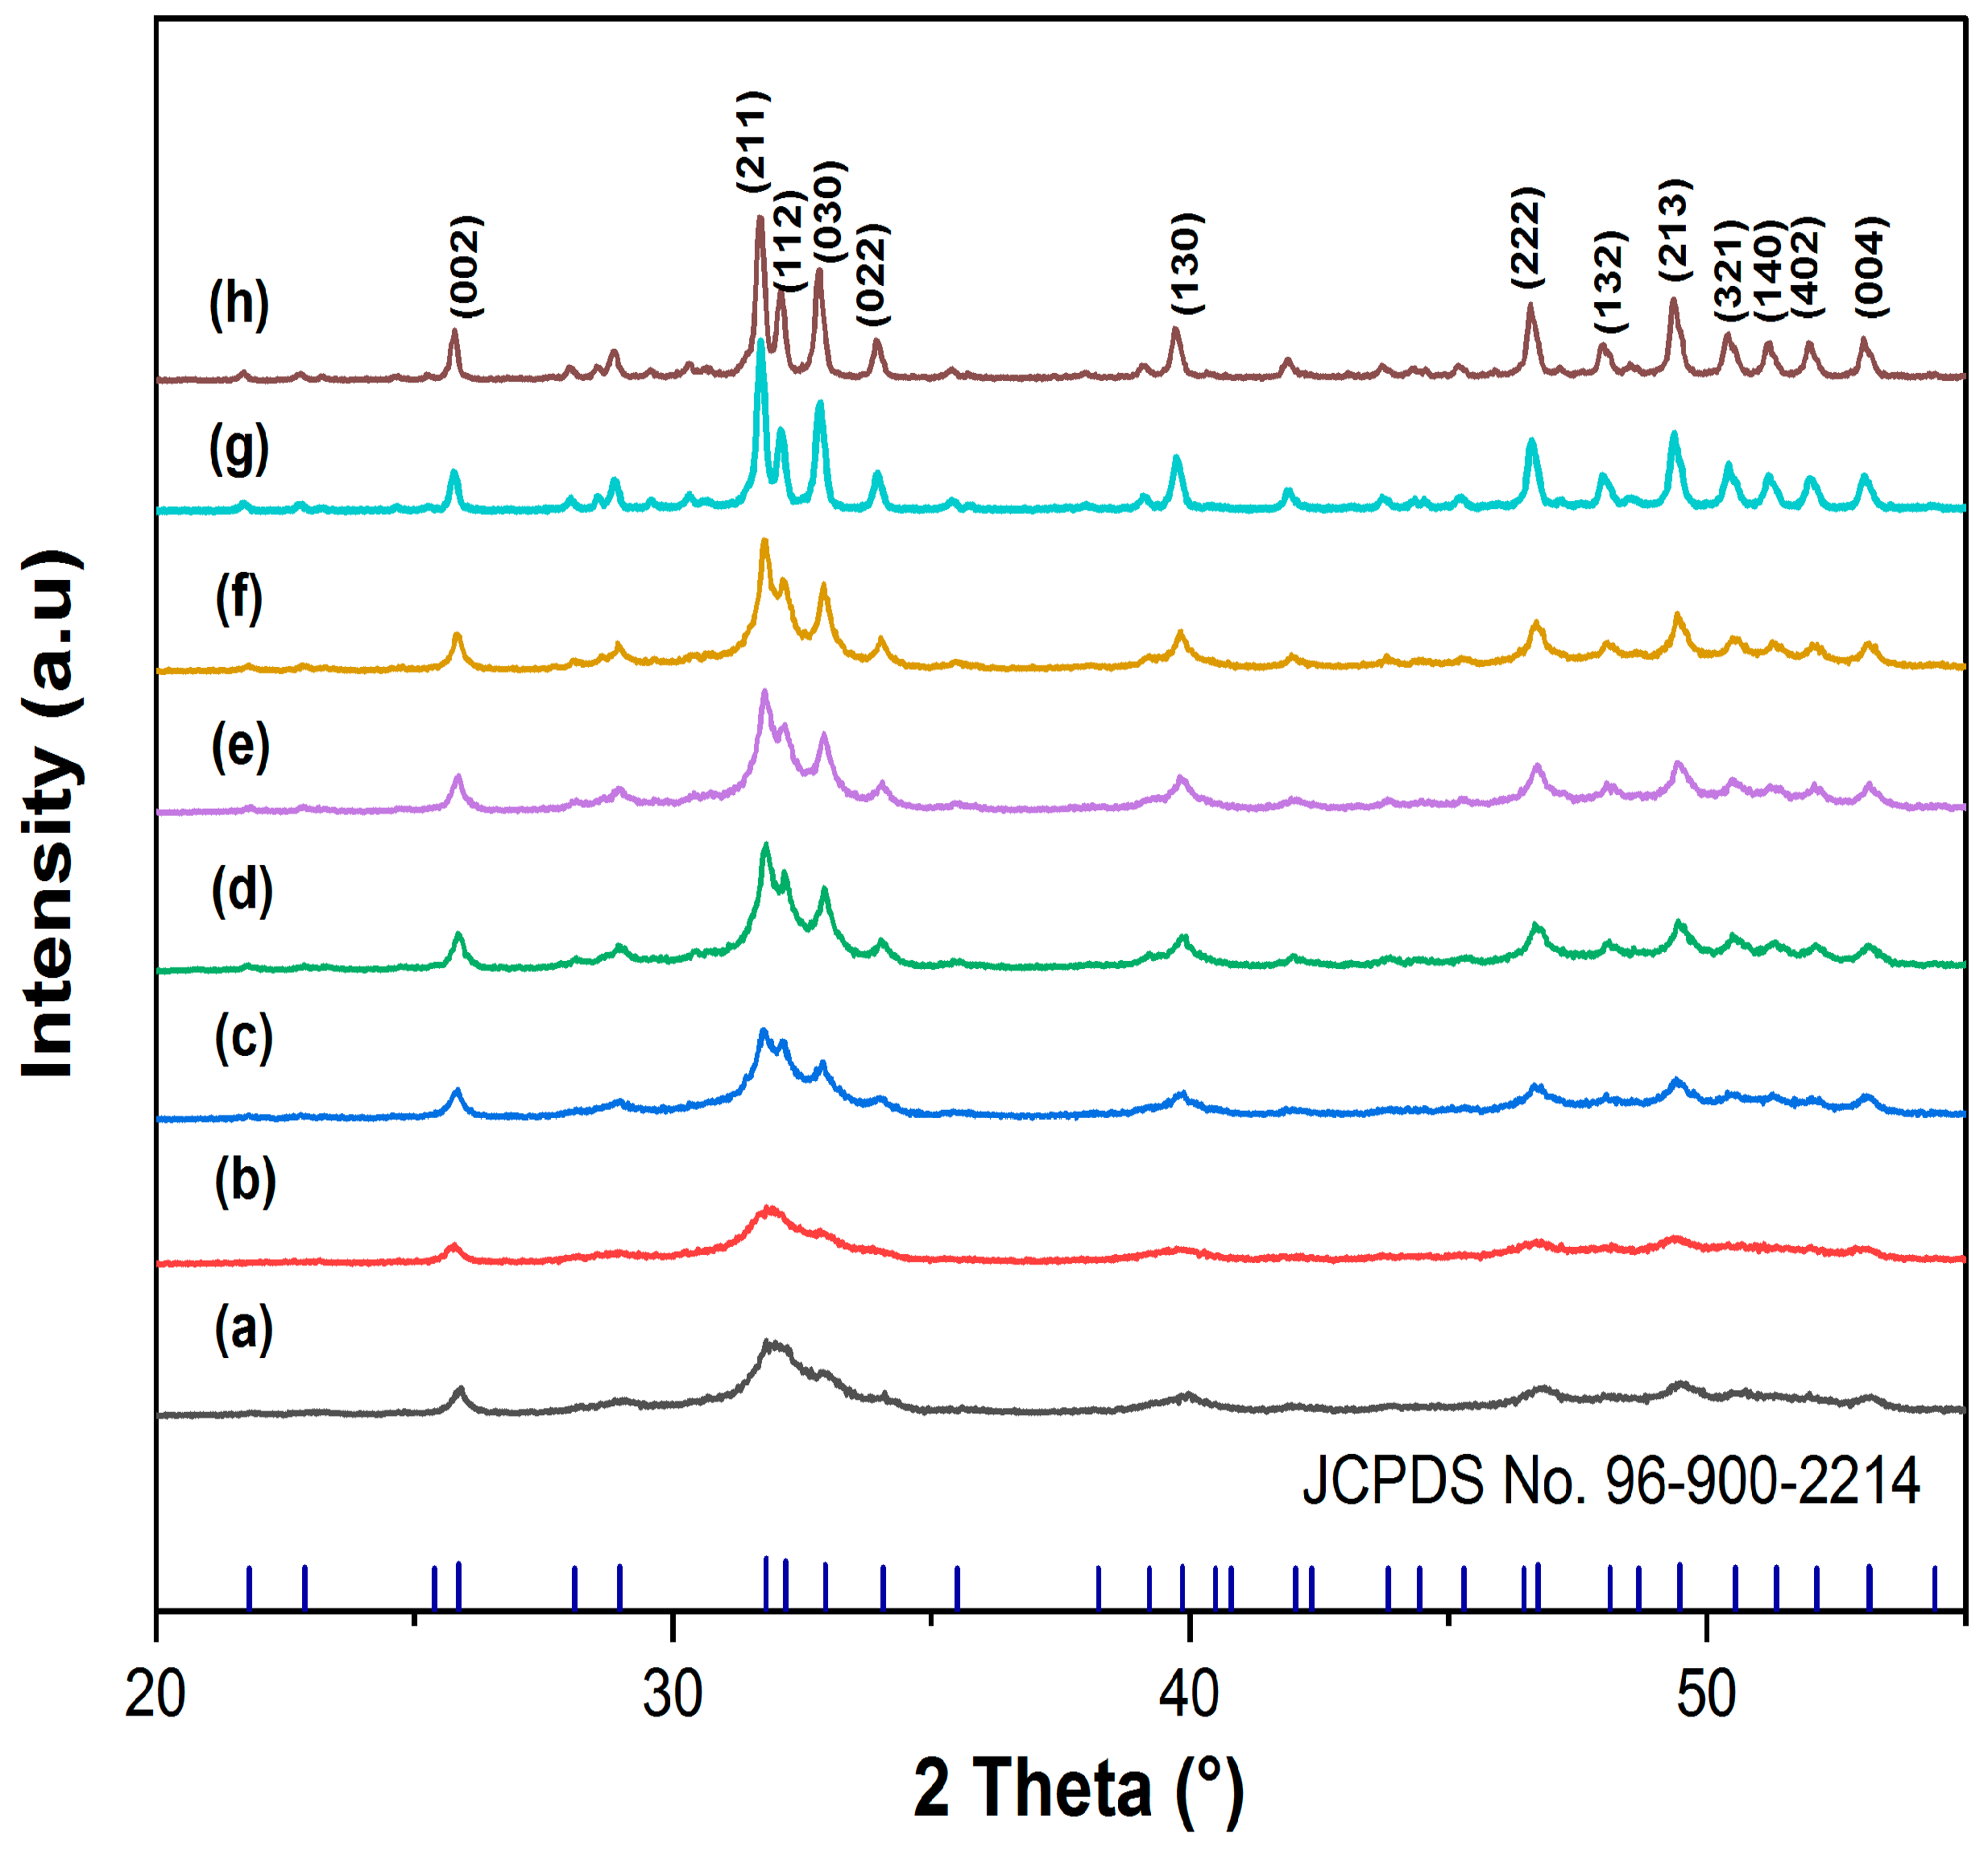
XRD patterns of all prepared BC are presented in Figure 2. The peaks were indexed and compared with the card number 96-900-2214. The obtained patterns were in good agreement with the reference model of crystalline hydroxyapatite. This indicates that hydroxyapatite is the main phase of all BC samples. All samples exhibited diffraction peaks at angles of 25.73°, 31.68°, 32.08°, 32.8°, 33.94°, 39.70°, 46.66°, 48.04°, 49.35°, 50.42°, 51.10°, 52.05°, and 53.11°, which corresponded to the lattice planes (002), (211), (112), (030), (022), (130), (222), (132), (213), (321), (140), (402), and (004). This finding is consistent with the results reported by Shahid et al. (2020) [26]. However, an increase in peak intensity was observed as the calcination temperature increased. That can be explained by the increase in the degree of crystallinity and the crystallite size of hydroxyapatite when the calcination temperature increases [11,27,28].
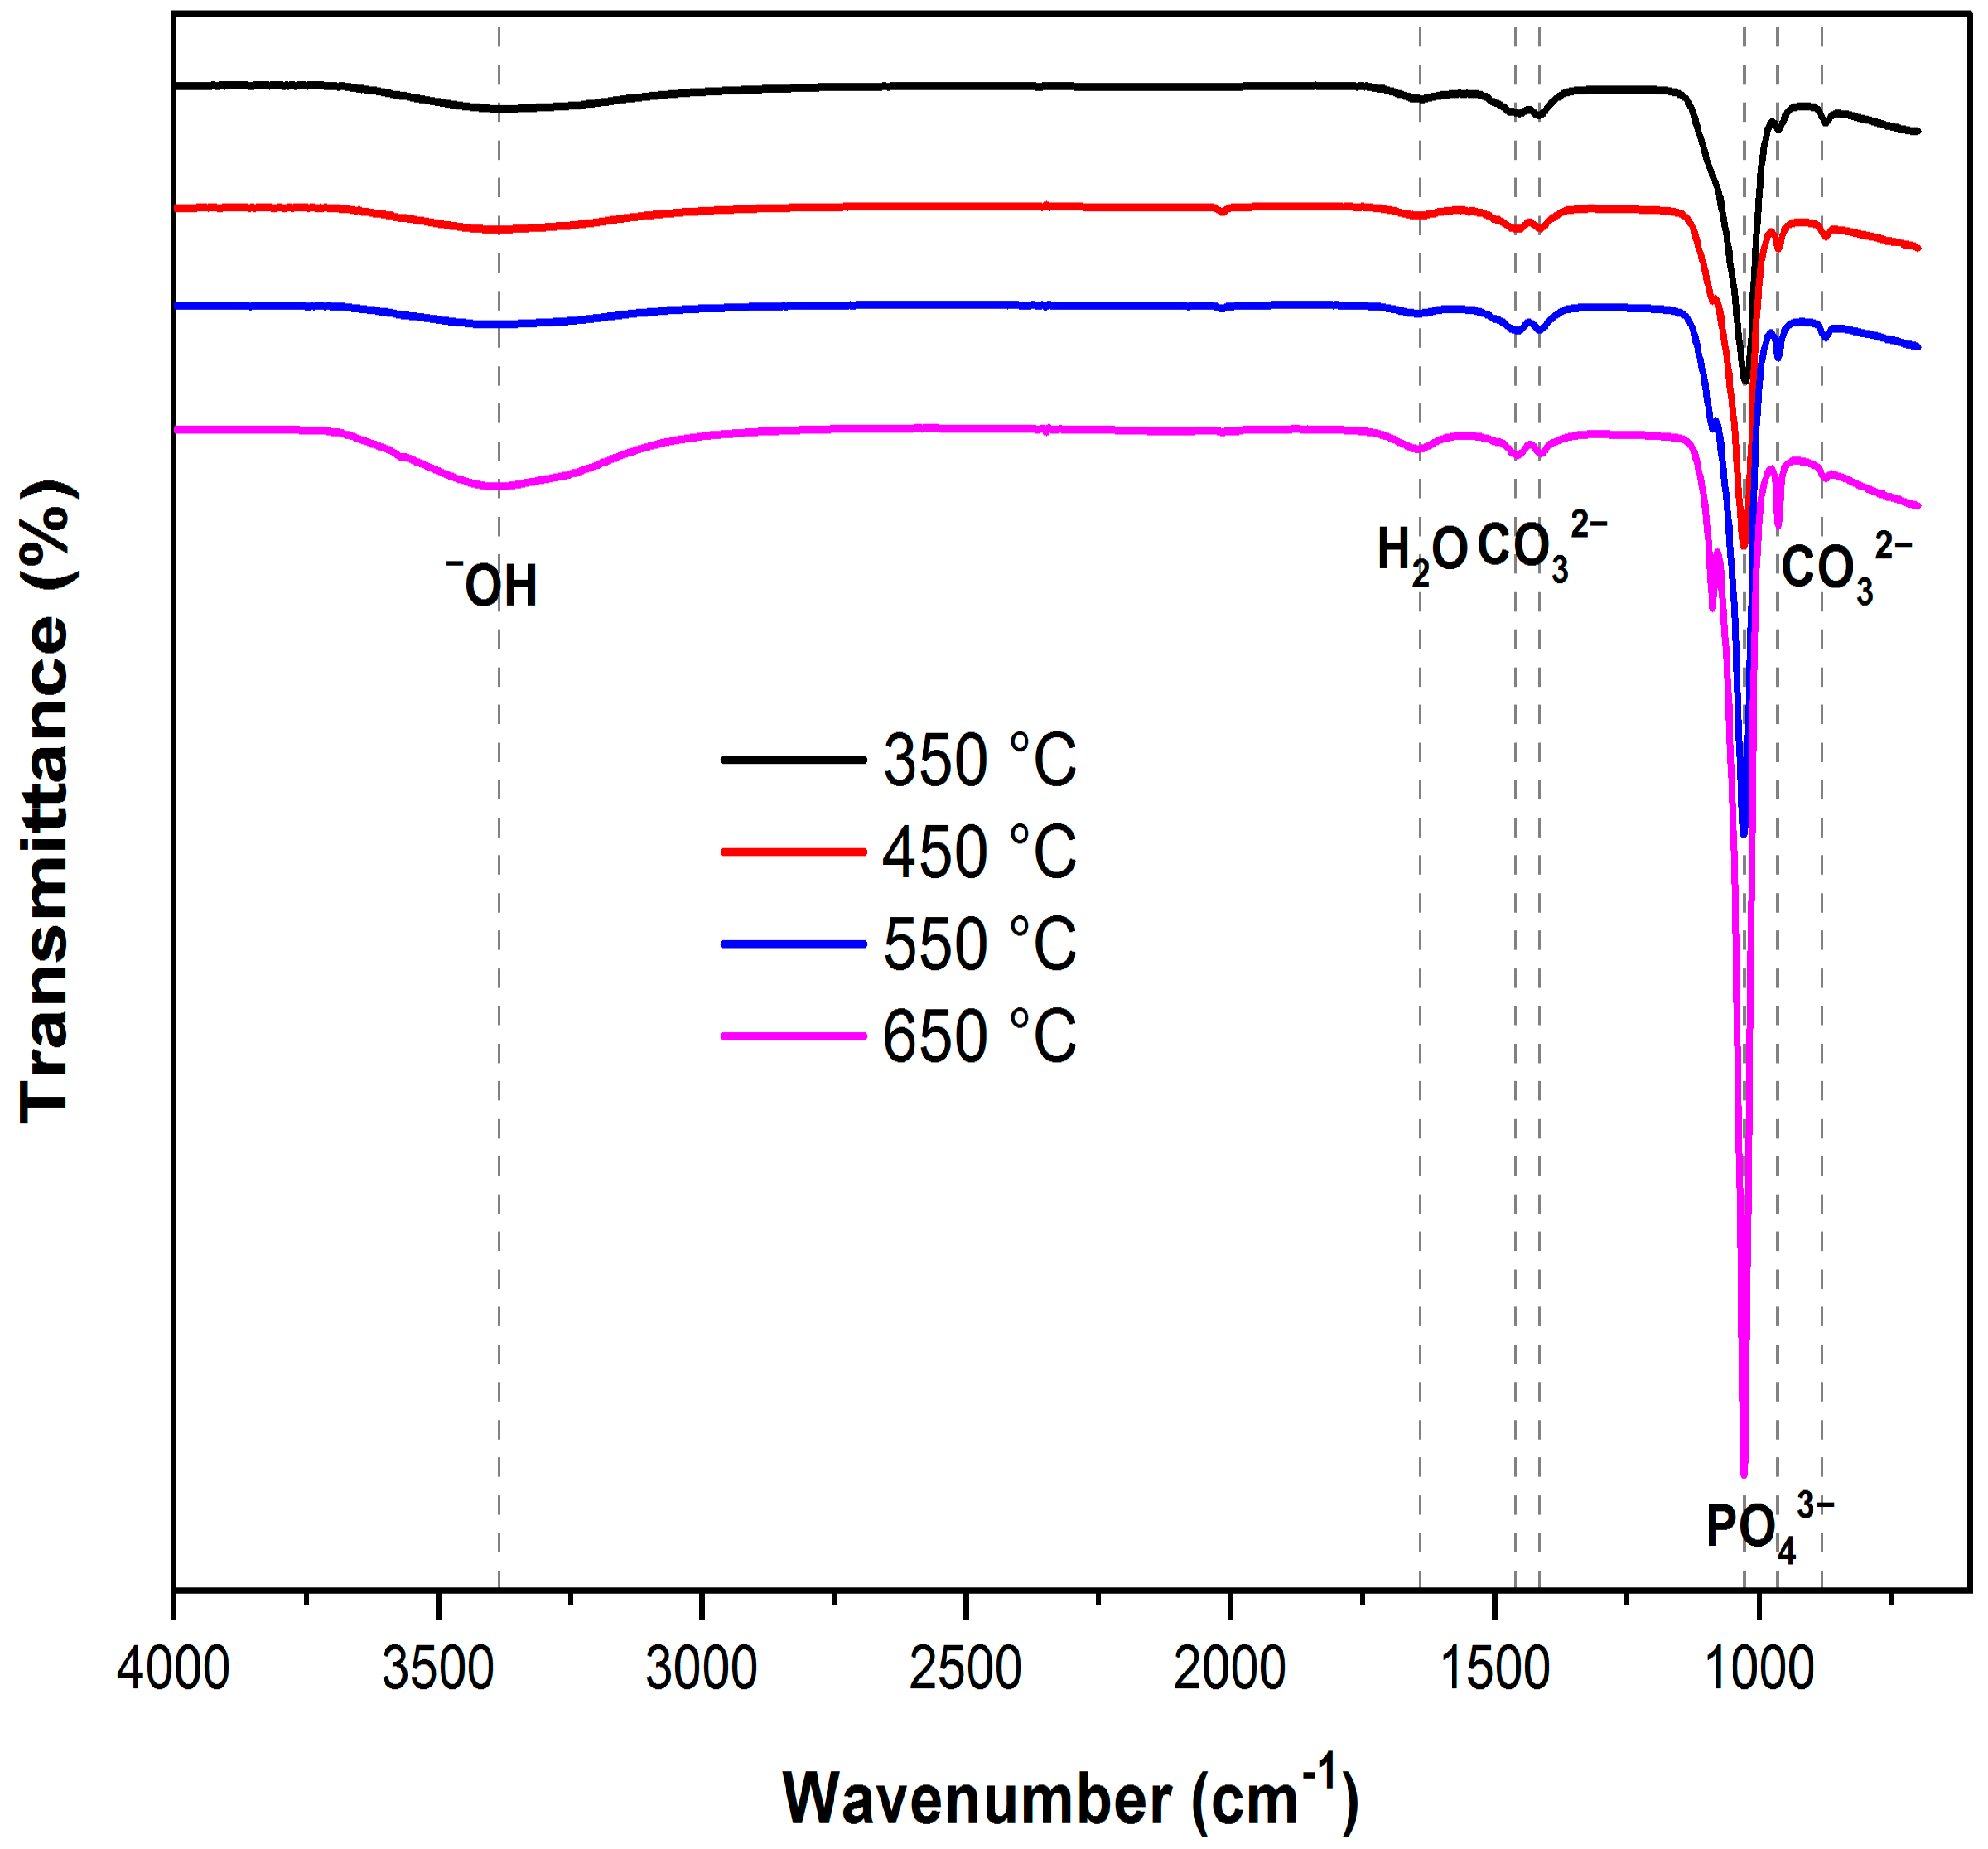
The FTIR spectra of the prepared BC at respective temperatures used in calcination are depicted in Figure 3. The results generally indicated that all the BC samples have several bands associated with different functional groups. The broadband structure around 3400 cm−1 and the band at 1635 cm−1 were assigned to the stretching vibration mode and the symmetric bending vibration mode of the hydroxyl functional group (–OH) [29,30]. The two bands at 1412 cm−1 and 1457 cm−1 were attributed to the asymmetric stretching vibration between carbon and oxygen (C–O) in the carbonate group (CO32− group) [30,31].
The major band at 1028 cm−1 and the band at 963 cm−1 were assigned to the asymmetric and symmetric stretching vibration mode between phosphorus and oxygen (P–O) in the phosphate group (PO43−), respectively [29,32]. The band at 873 cm−1 was assigned to the asymmetric bending vibration mode for the CO32− group [11,28,32]. Hydroxyl (–OH), CO32−, and PO43− functional groups are characteristic to the structure of hydroxyapatite, which is the main inorganic constituent of BC [33]. From the FTIR results, it was observed that as the calcination temperature increased from 350 °C to 650 °C, the major peak at 1028 cm−1 show increased intensity. This indicated elevated calcination temperatures promote the developpment of more stable phosphate structures in BC.

3.2.2. SEM Analysis and BET

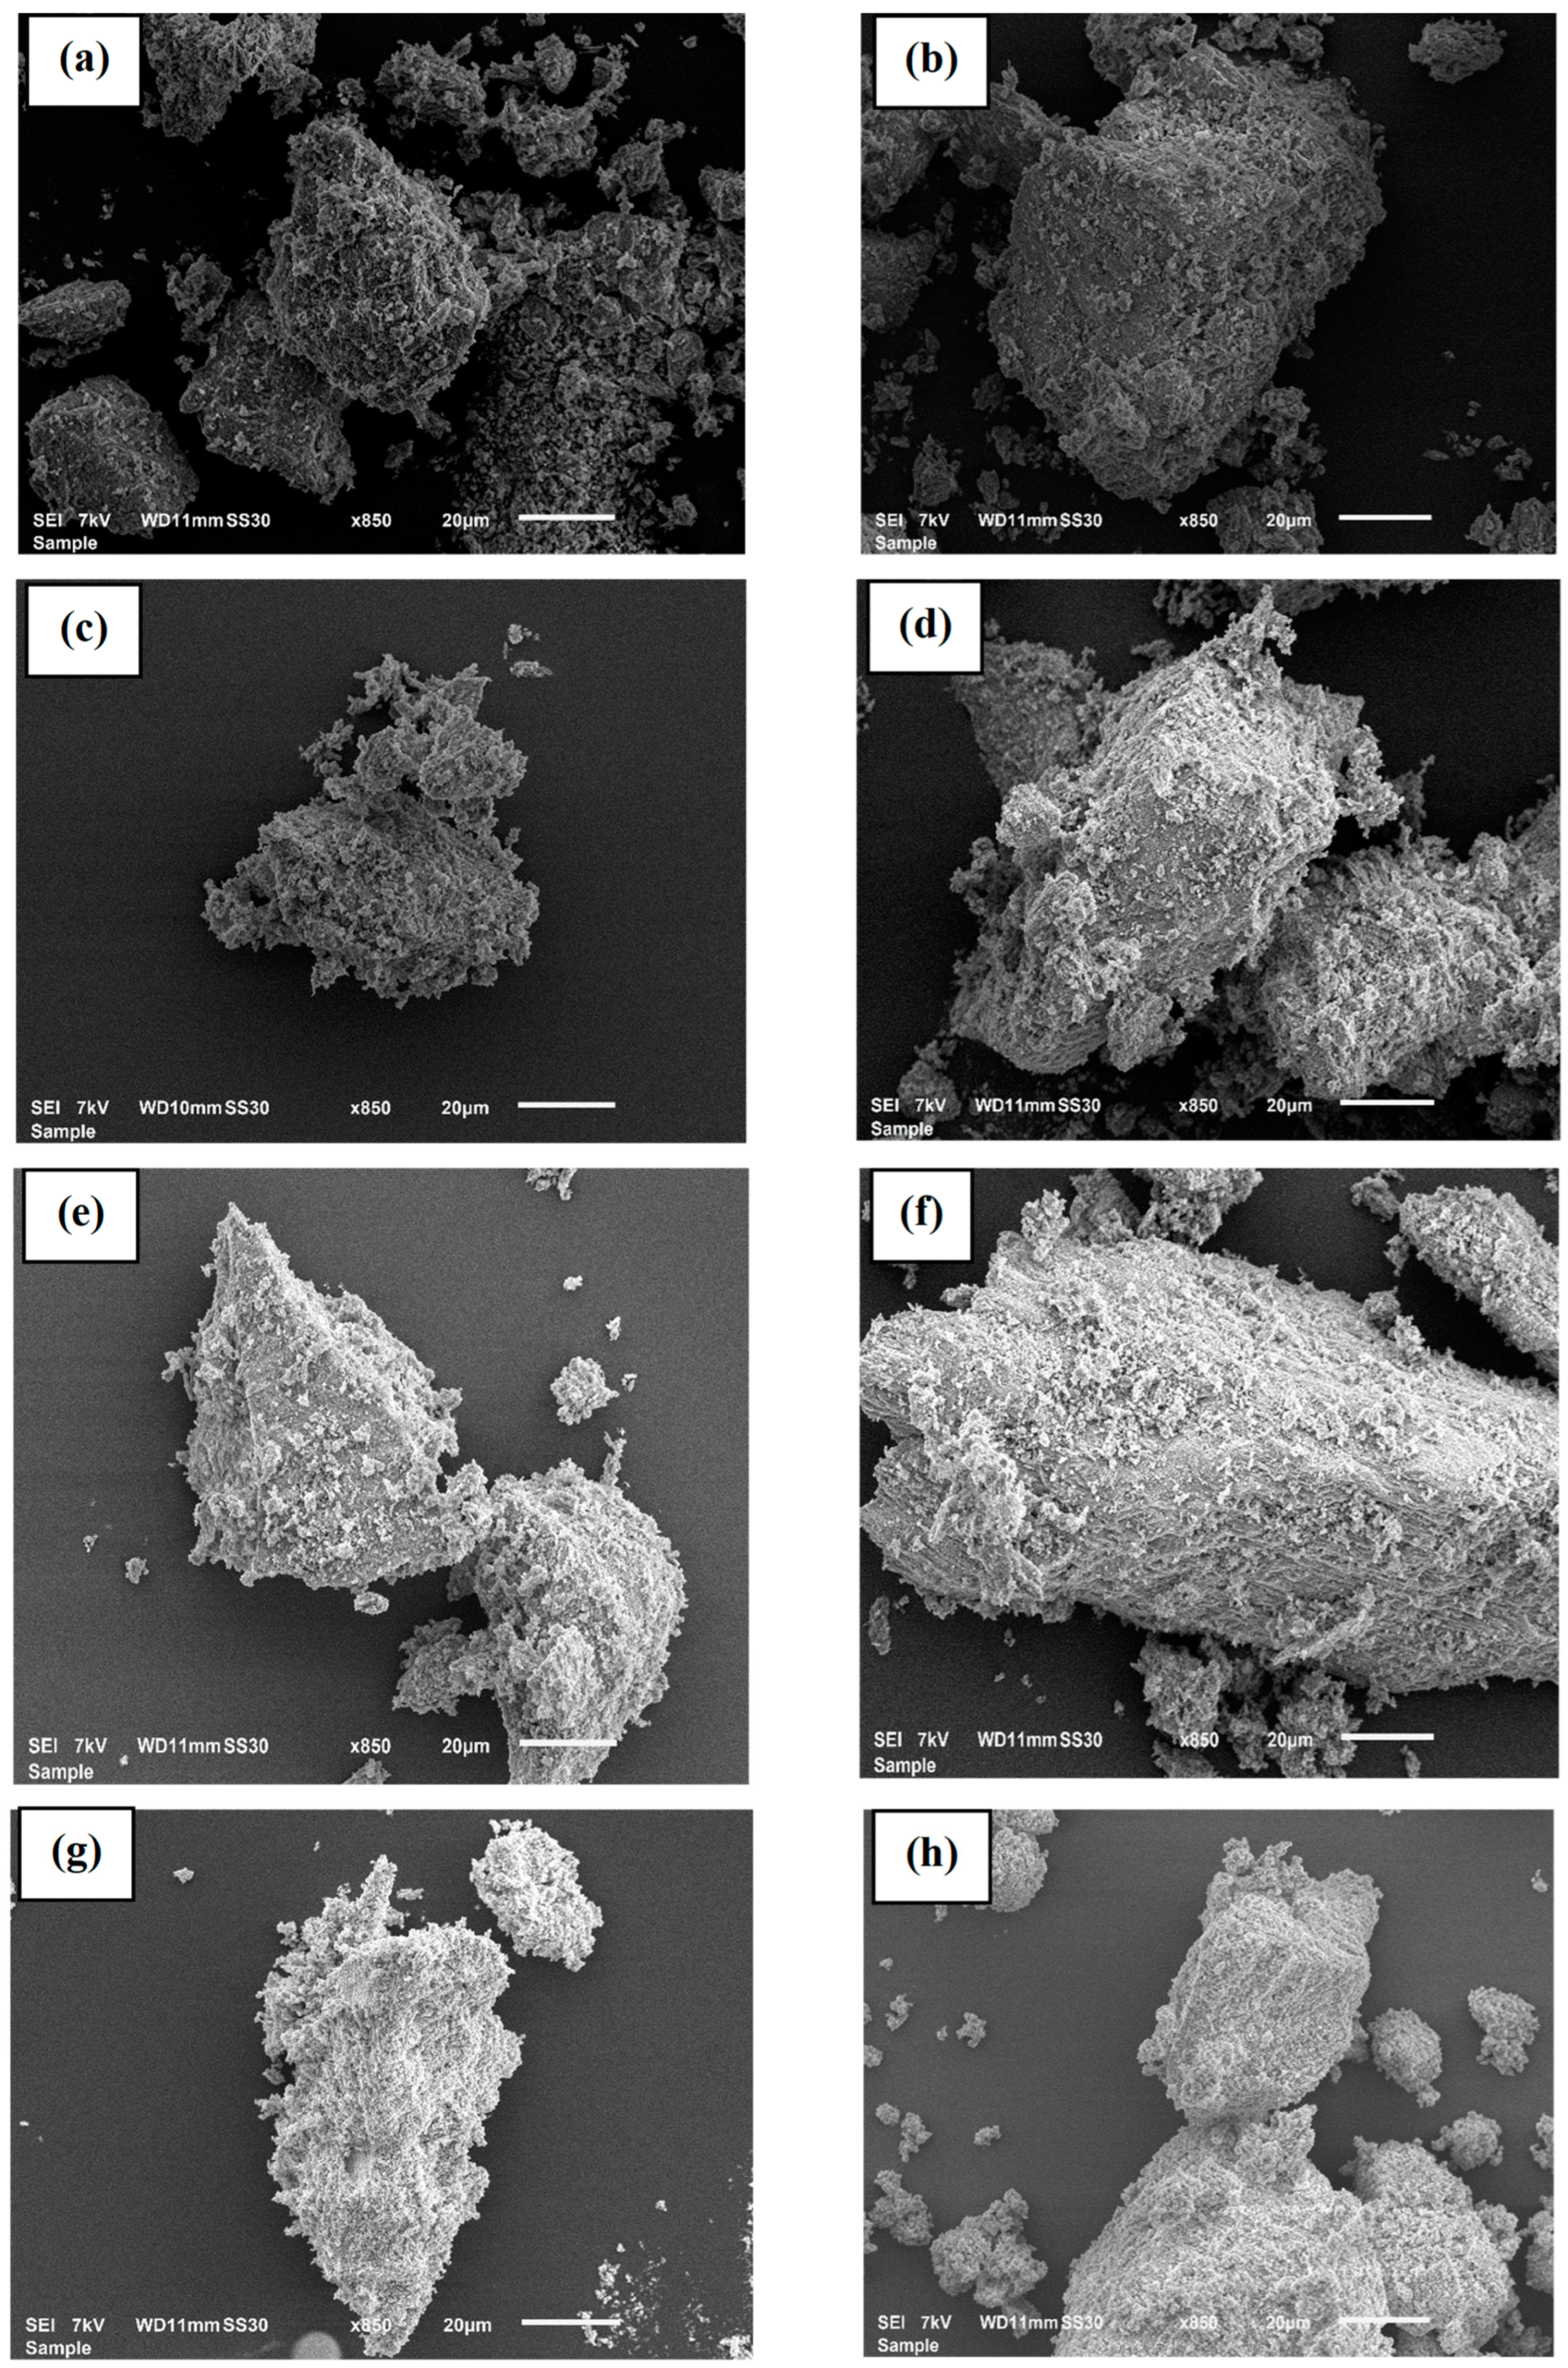
The morphology of the prepared BC at different calcination temperatures and residence times is shown in Figure 4. The imaging revealed that the surface morphology of all synthesized BC samples was very similar with fractured, rough, and undefined geometry. Interestingly, there was no clearly visible large macroscopic pore in all BC samples as revealed by the SEM technique with x850 amplification. It was observed that the increase in pyrolysis temperature (350 to 650 °C) and residence time (1 to 2 h) does not significantly change the morphology of BC. This result is in tandem with morphological imaging of BC reported in the literature [34,35].
The BET surface area (SBET), total pore volume (Vp), and the average pore diameter (Dp) of BC samples are reported in Table 3. Results indicated that the values of SBET are considerably decreased when increasing the calcination temperature, and this effect is most pronounced at high temperatures (650 °C). These values decrease from (112.3 ± 0.3) m2/g to (4.4 ± 0.3) m2/g after raising the calcination temperature from 350 °C to 650 °C. A similar effect was reported in previous works [11,28,36]. However, it was found that as the pore size increased, the specific surface area decreased. According to the literature, BC is mainly composed of 90% hydroxyapatite and 10% carbon [37]. Hence, it is suggestive that the reduction in SBET may be due to the removal of organic matter and the formation of a large hydroxyapatite crystal at higher calcination temperature.
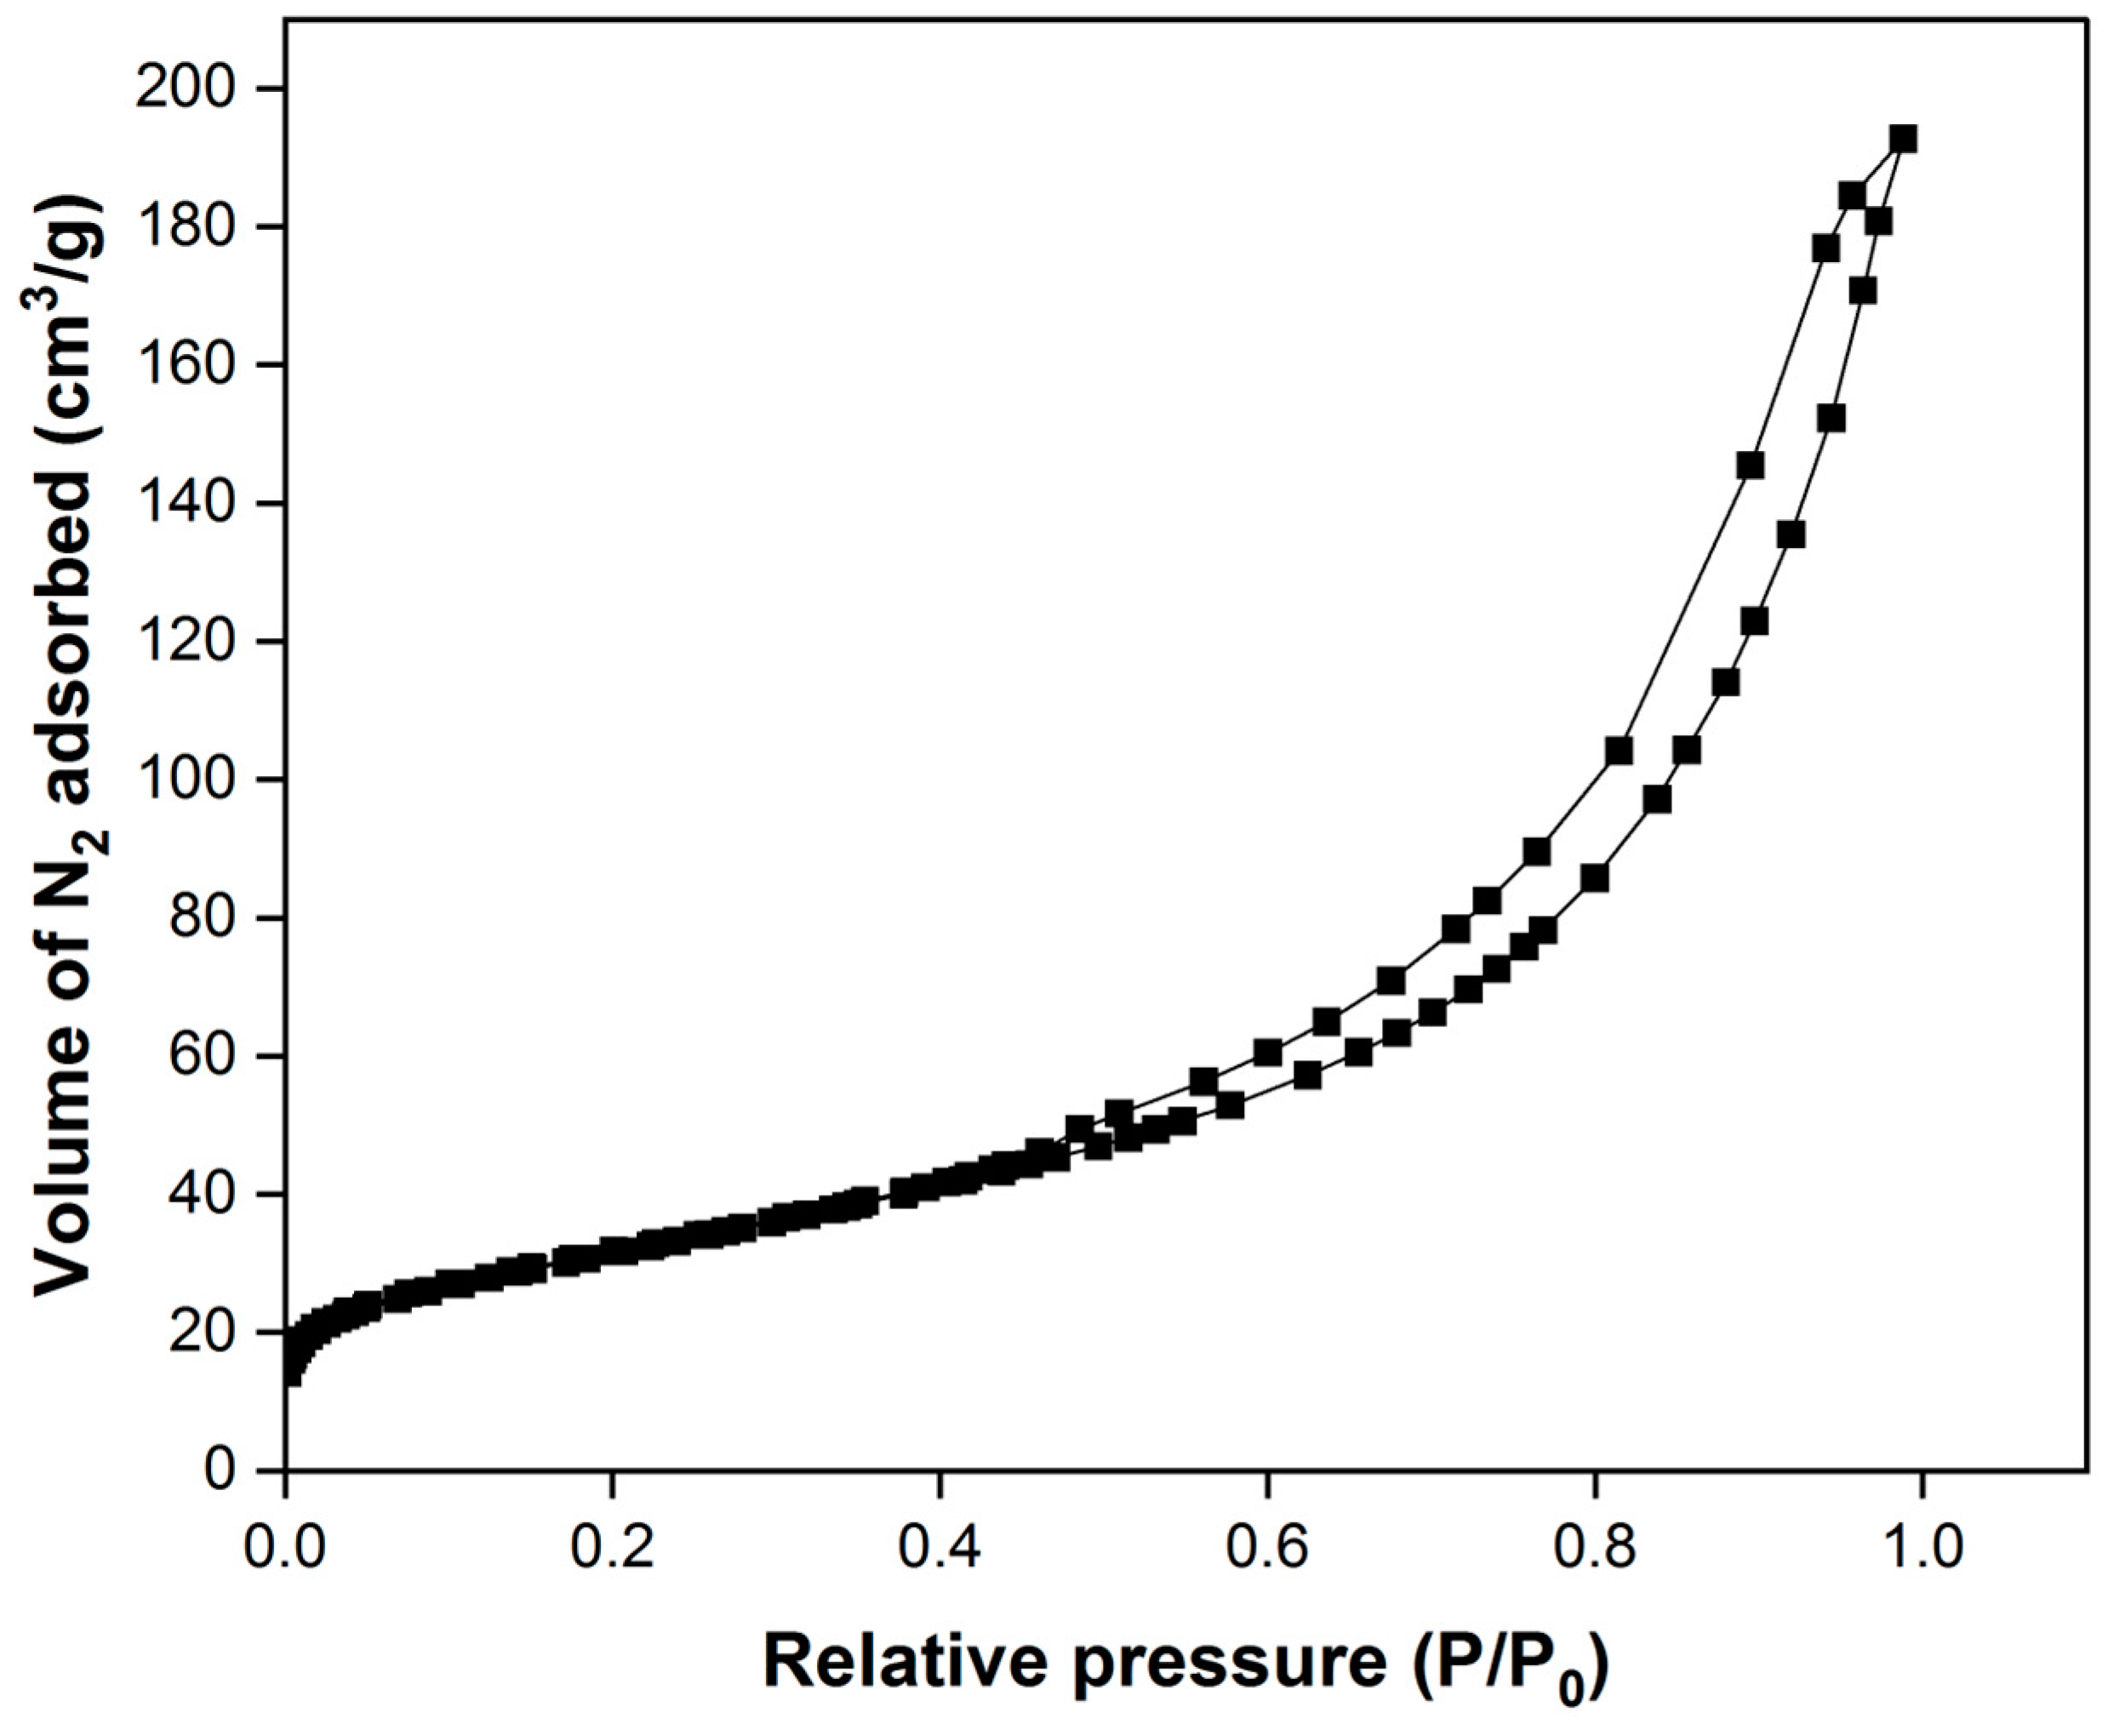
The study also highlighted that the pore volume does not show a significant change with increasing the heating temperature from 350 °C to 550 °C. However, further growth in temperature to 550 °C results in a reduction in pore volume. According to the IUPAC classification, prepared BC samples are mesoporous materials since the average pore diameter is in the range of (9.3 ± 0.3) nm to (39.9 ± 0.4) nm. The N2 adsorption–desorption isotherm of the BC sample with the highest specific surface area (BC prepared at 350 °C, 1 h) is shown in Figure 5. The adsorption isotherm of the prepared BC exhibits characteristics consistent with type IV, confirming its mesoporous nature and indicating the presence of mesoporosity within the material.
In conclusion, the calcination temperature and residence time significantly affect the specific surface area and pore size of the prepared BC, which can influence the fluoride adsorption capacity. Thus, these two parameters need to be controlled during the preparation of BC samples in order to obtain a good adsorbent with high surface area and large pore volume.

3.3. Fluoride Removal Efficiency of BC from Sampled Water

The efficiency of prepared BC samples on F adsorption was evaluated using raw water sampled from Hina and Wouro Dow 2 with a notable amount of fluoride content previously revealed in Table 2. Results of fluoride removal are presented in Figure 6. The BC used as adsorbent for fluoride adsorption was the prepared material with the highest surface area (350 °C, 1 h). This is because BC with high surface area and large pore volume demonstrated high F removal efficiency and adsorption capacity [11,20,27,38].
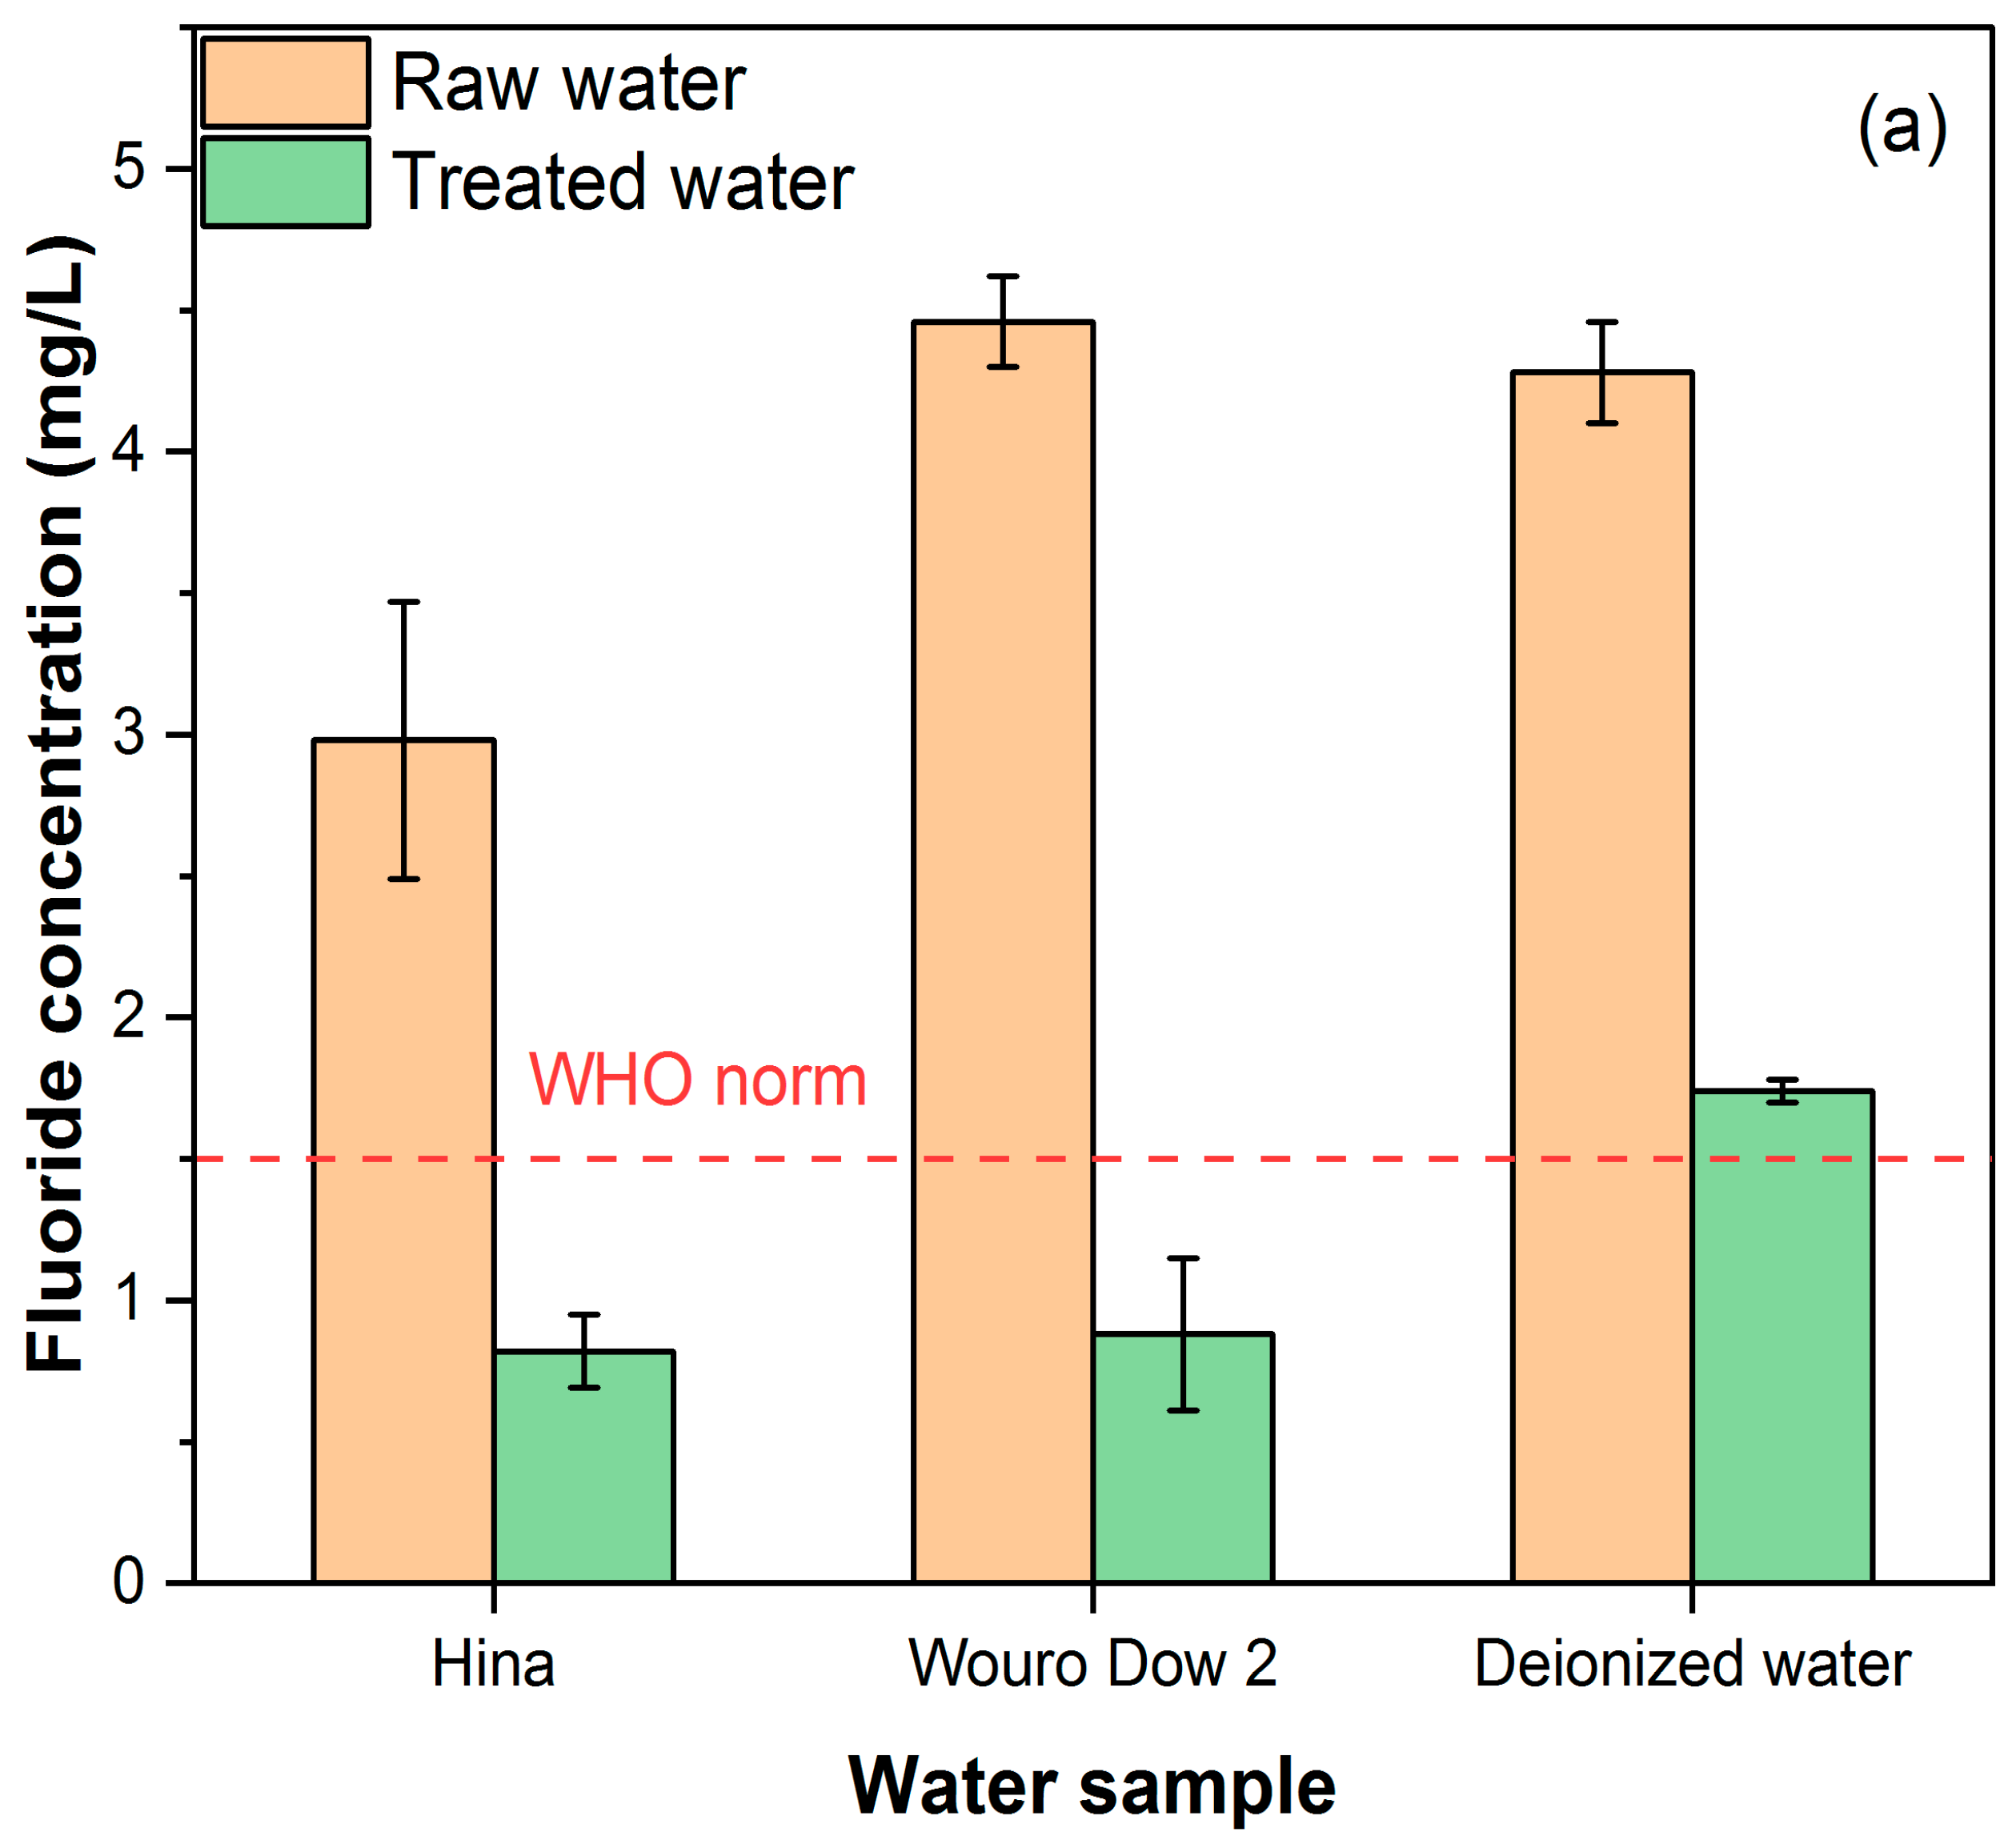
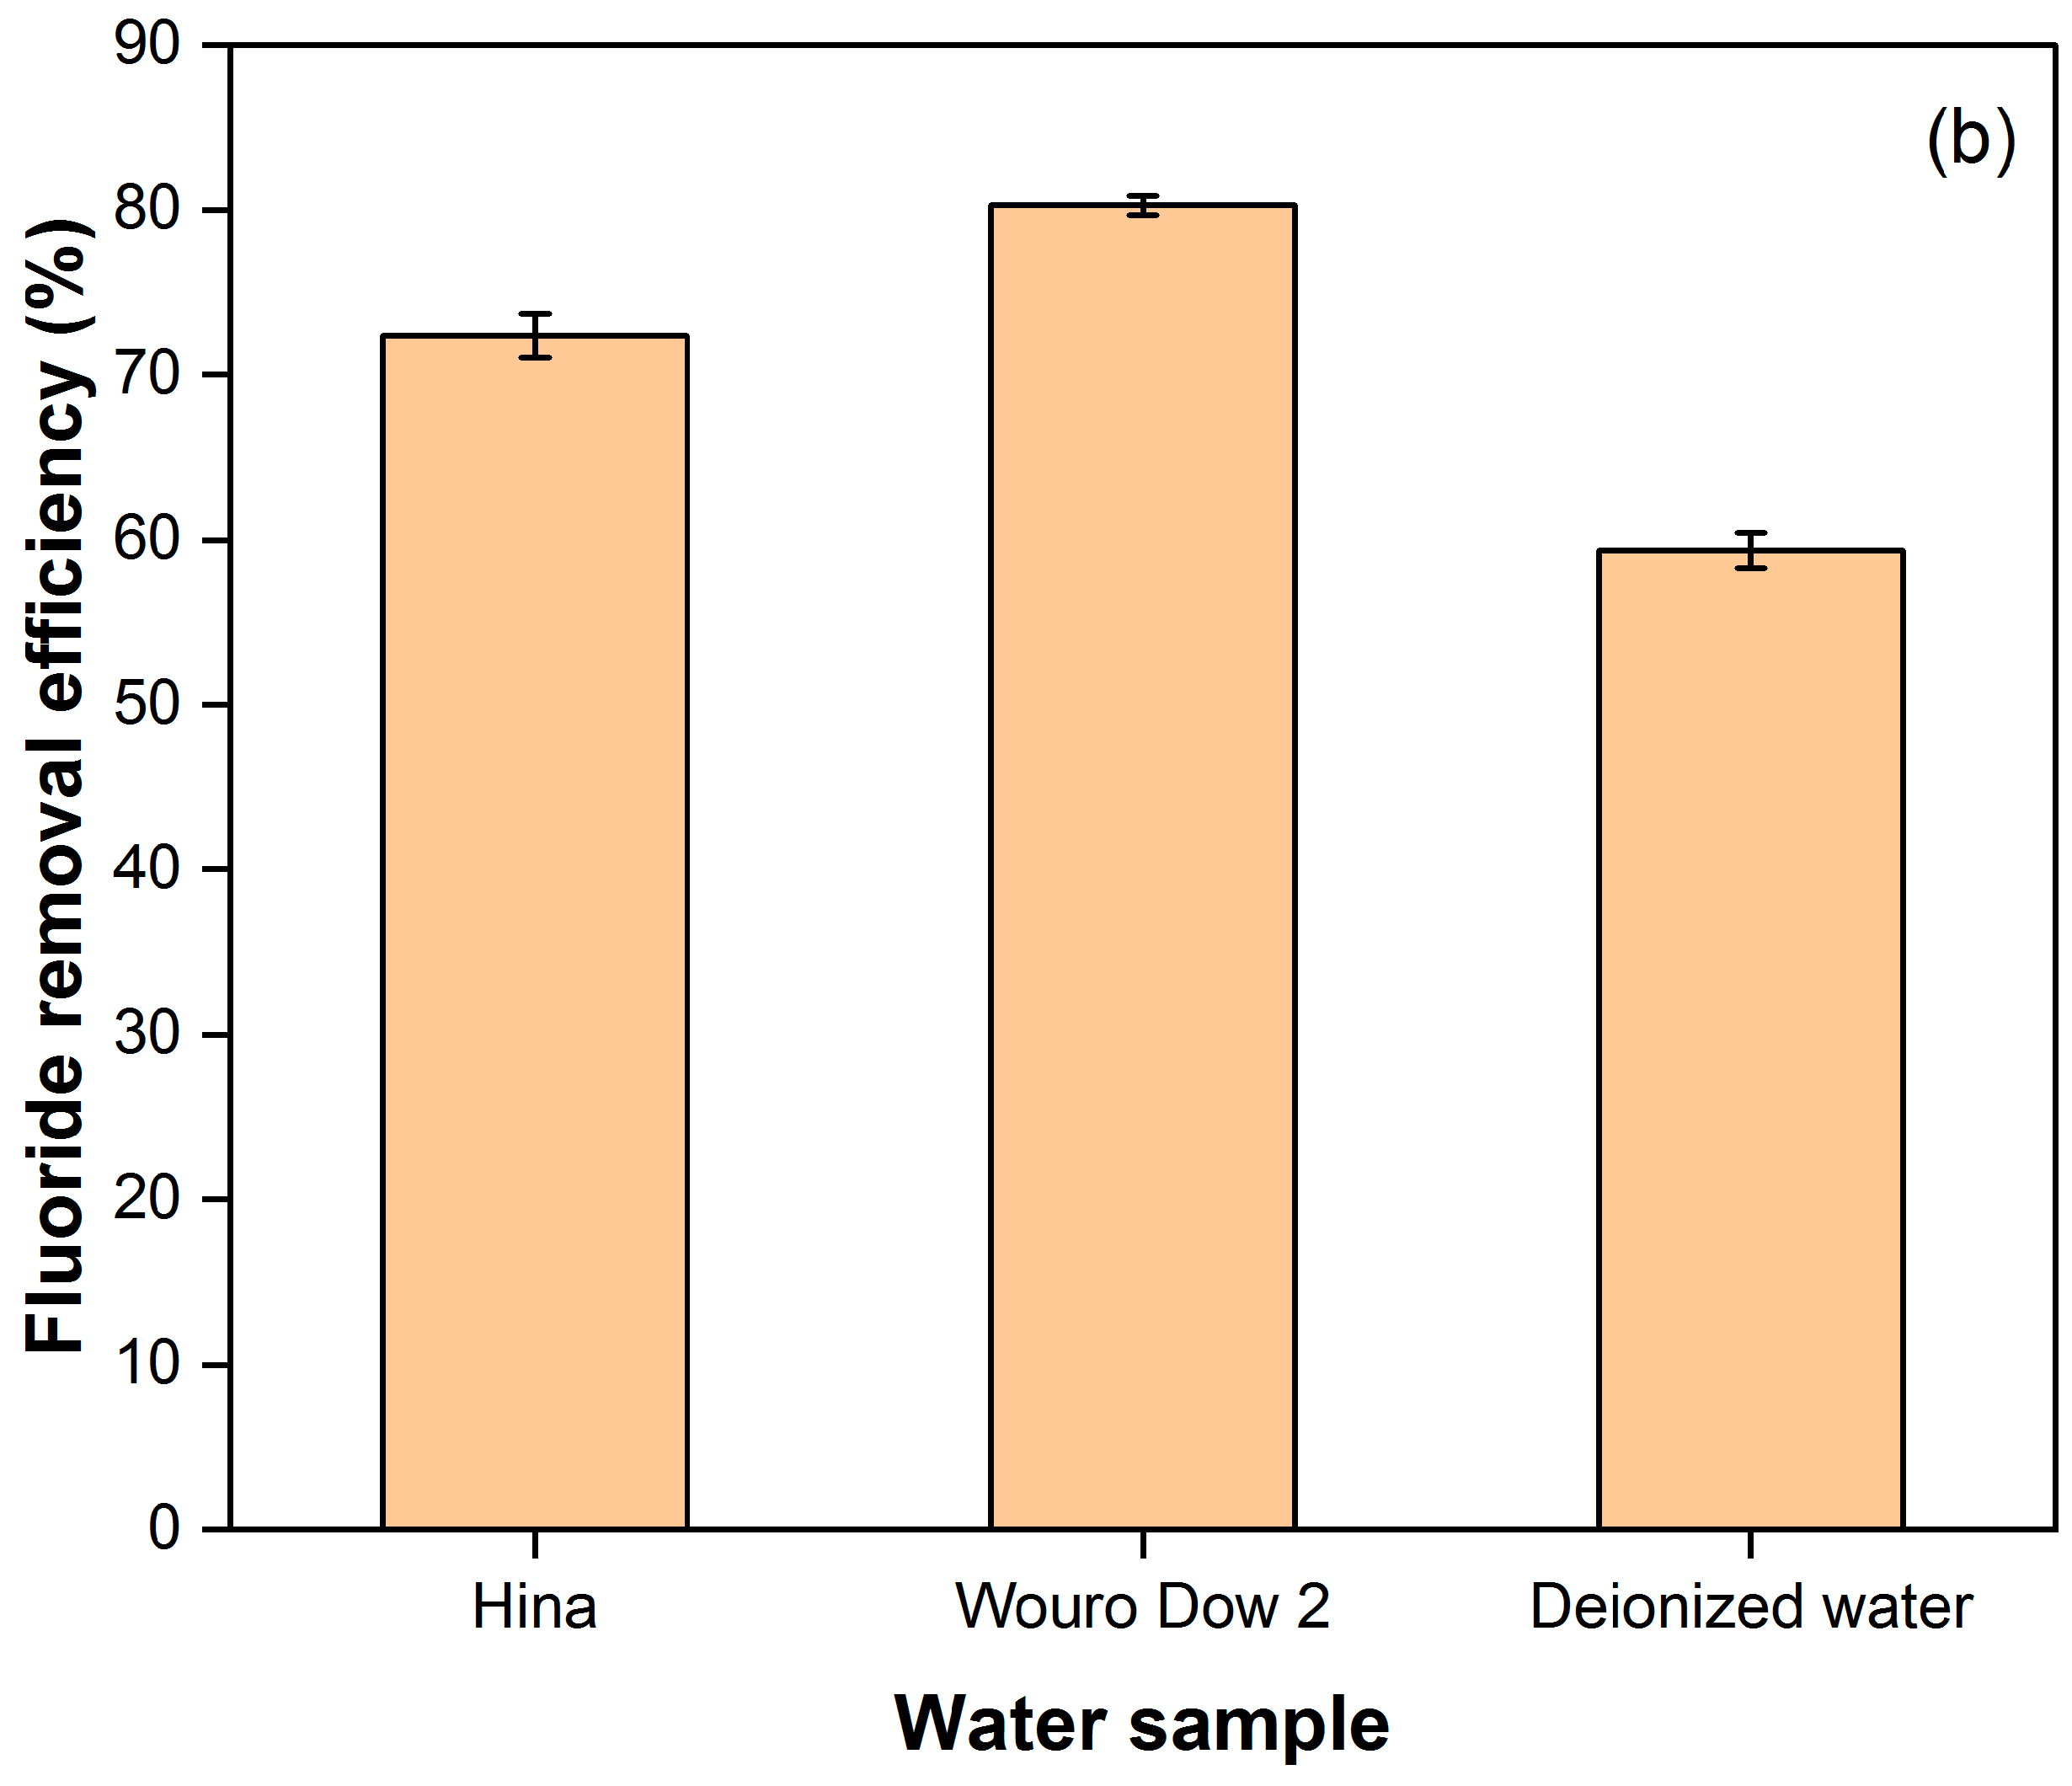
From the results in Figure 6a, BC demonstrated high F adsorption, effectively reducing F concentrations in raw water samples to well below the recommended limits of 1.5 mg/L for drinking water. Removal efficiencies of (72.5 ± 1.4)%, (80.3 ± 0.6)%, and (59.4 ± 1.1)% were obtained from the water samples of Hina, Wouro Dow 2 and deionized water, respectively. The literature indicates that the fluoride removal efficiency can improve at low pH compared to neutral or basic pH due to strong electrostatic attraction between the negative fluoride ions and the surface positively charged BC [29,34]. From the results, it was observed that the removal efficiency of deionized water (containing fluoride ions) was lower than expected compared to the raw water samples. The adsorption of F on BC in deionized water under acidic conditions (low pH) was expected to be higher than of natural water samples characterized by alkaline conditions (neutral pH). Such observation has important practical implementation and can be an important factor in the estimation of the required BC load in a real-life scenario. An observed increase in F removal in real waters can be attributed to the effect of the chemical constituents of the natural water. To gain insight into the observed phenomena, the investigation of the effect of the water matrix on F removal as performed in the next sections.

3.4. Effect of Coexisting Anions and Cations

The anion concentrations of the raw water samples before and after adsorption are presented in Table 4. In the obtained results, only F was absorbed by the adsorbent. The presence of coexisting Cl, SO42−, PO42−, NO3, and NO2 anions in the water matrix has no effect on F removal efficiency. This can be attributed to the ionic size of F which is smaller than other anions [39,40]. In addition, hydroxyl ion (OH) in hydroxyapatite has the same charge and similar ionic radius as F. There is a strong affinity for F to replace OH in hydroxyapatite to from fluorapatite [14,41]. Furthermore, the effect of cations present in water samples on F removal is shown in Table 5. The results indicate that Ca2+ and Mg2+ were absorbed into the surface of BC. The positive metal ions (Ca2+ and Mg2+) adsorbed on the BC surface can react with F to form precipitates (CaF2/MgF2), which promote the decrease in F in aqueous solution. The HCO3 anion is one of the main ions of such waters. There is a possibility for this ion to be present in water samples. However, it is not considered during the analysis by ion chromatography. Further experiments need to be performed to also evaluate the effect of this ion.
Hence, the enhancement of adsorption of F in real water samples compared with deionized water can be explained by the adsorption of Ca2+ and Mg2+ on the BC surface. However, there was no visible evidence of precipitates (CaF2/MgF2) in the aqueous solution. This can be justified by the fact that the molar concentrations of Ca2+/Mg2+ and F in the final solution do not exceed the solubility product of CaF2/MgF2. In the case of Wouro Dow 2 water sample, for example, the products of [Ca2+] × [F]2 and [Mg2+] × [F]2 were 1.94 × 10⁻¹² and 1.99 × 10⁻¹², respectively. According to the literature, the solubility products of CaF2 and MgF2 were 3.4 × 10⁻¹¹ and 7.4 × 10⁻¹¹, respectively [41,42]. As result, it was not possible to see visible precipitates in the final solution under the experimental conditions.
From the results in Table 4 and Table 5, it was important to note an increase in Cl and SO42− concentrations, while there was a slight increase in K+ concentrations in the aqueous solution after the adsorption process (raw water samples and deionized water). This was due to the dissolution of those ions from BC in the treated solution. According to chemical composition, BC was composed of Ca (34.94%), O (35.55%), P (15.88%), C (12.03%), Na (0.86%), and Mg (0.73%) (Table 6). Other elements such as Cl, S, and K likely exist as trace elements which are not detected in BC. A previous study confirmed the presence of Cl (0.1%) and K (0.1%) as trace elements in chicken bone char [41]. On the other hand, the moles of Na+ released into the treated water were nearly equal to two moles of Ca2+ adsorbed on the BC. This result indicated an ion exchange between Na+ in BC and Ca2+ (from the aqueous solution) adsorbed on BC.
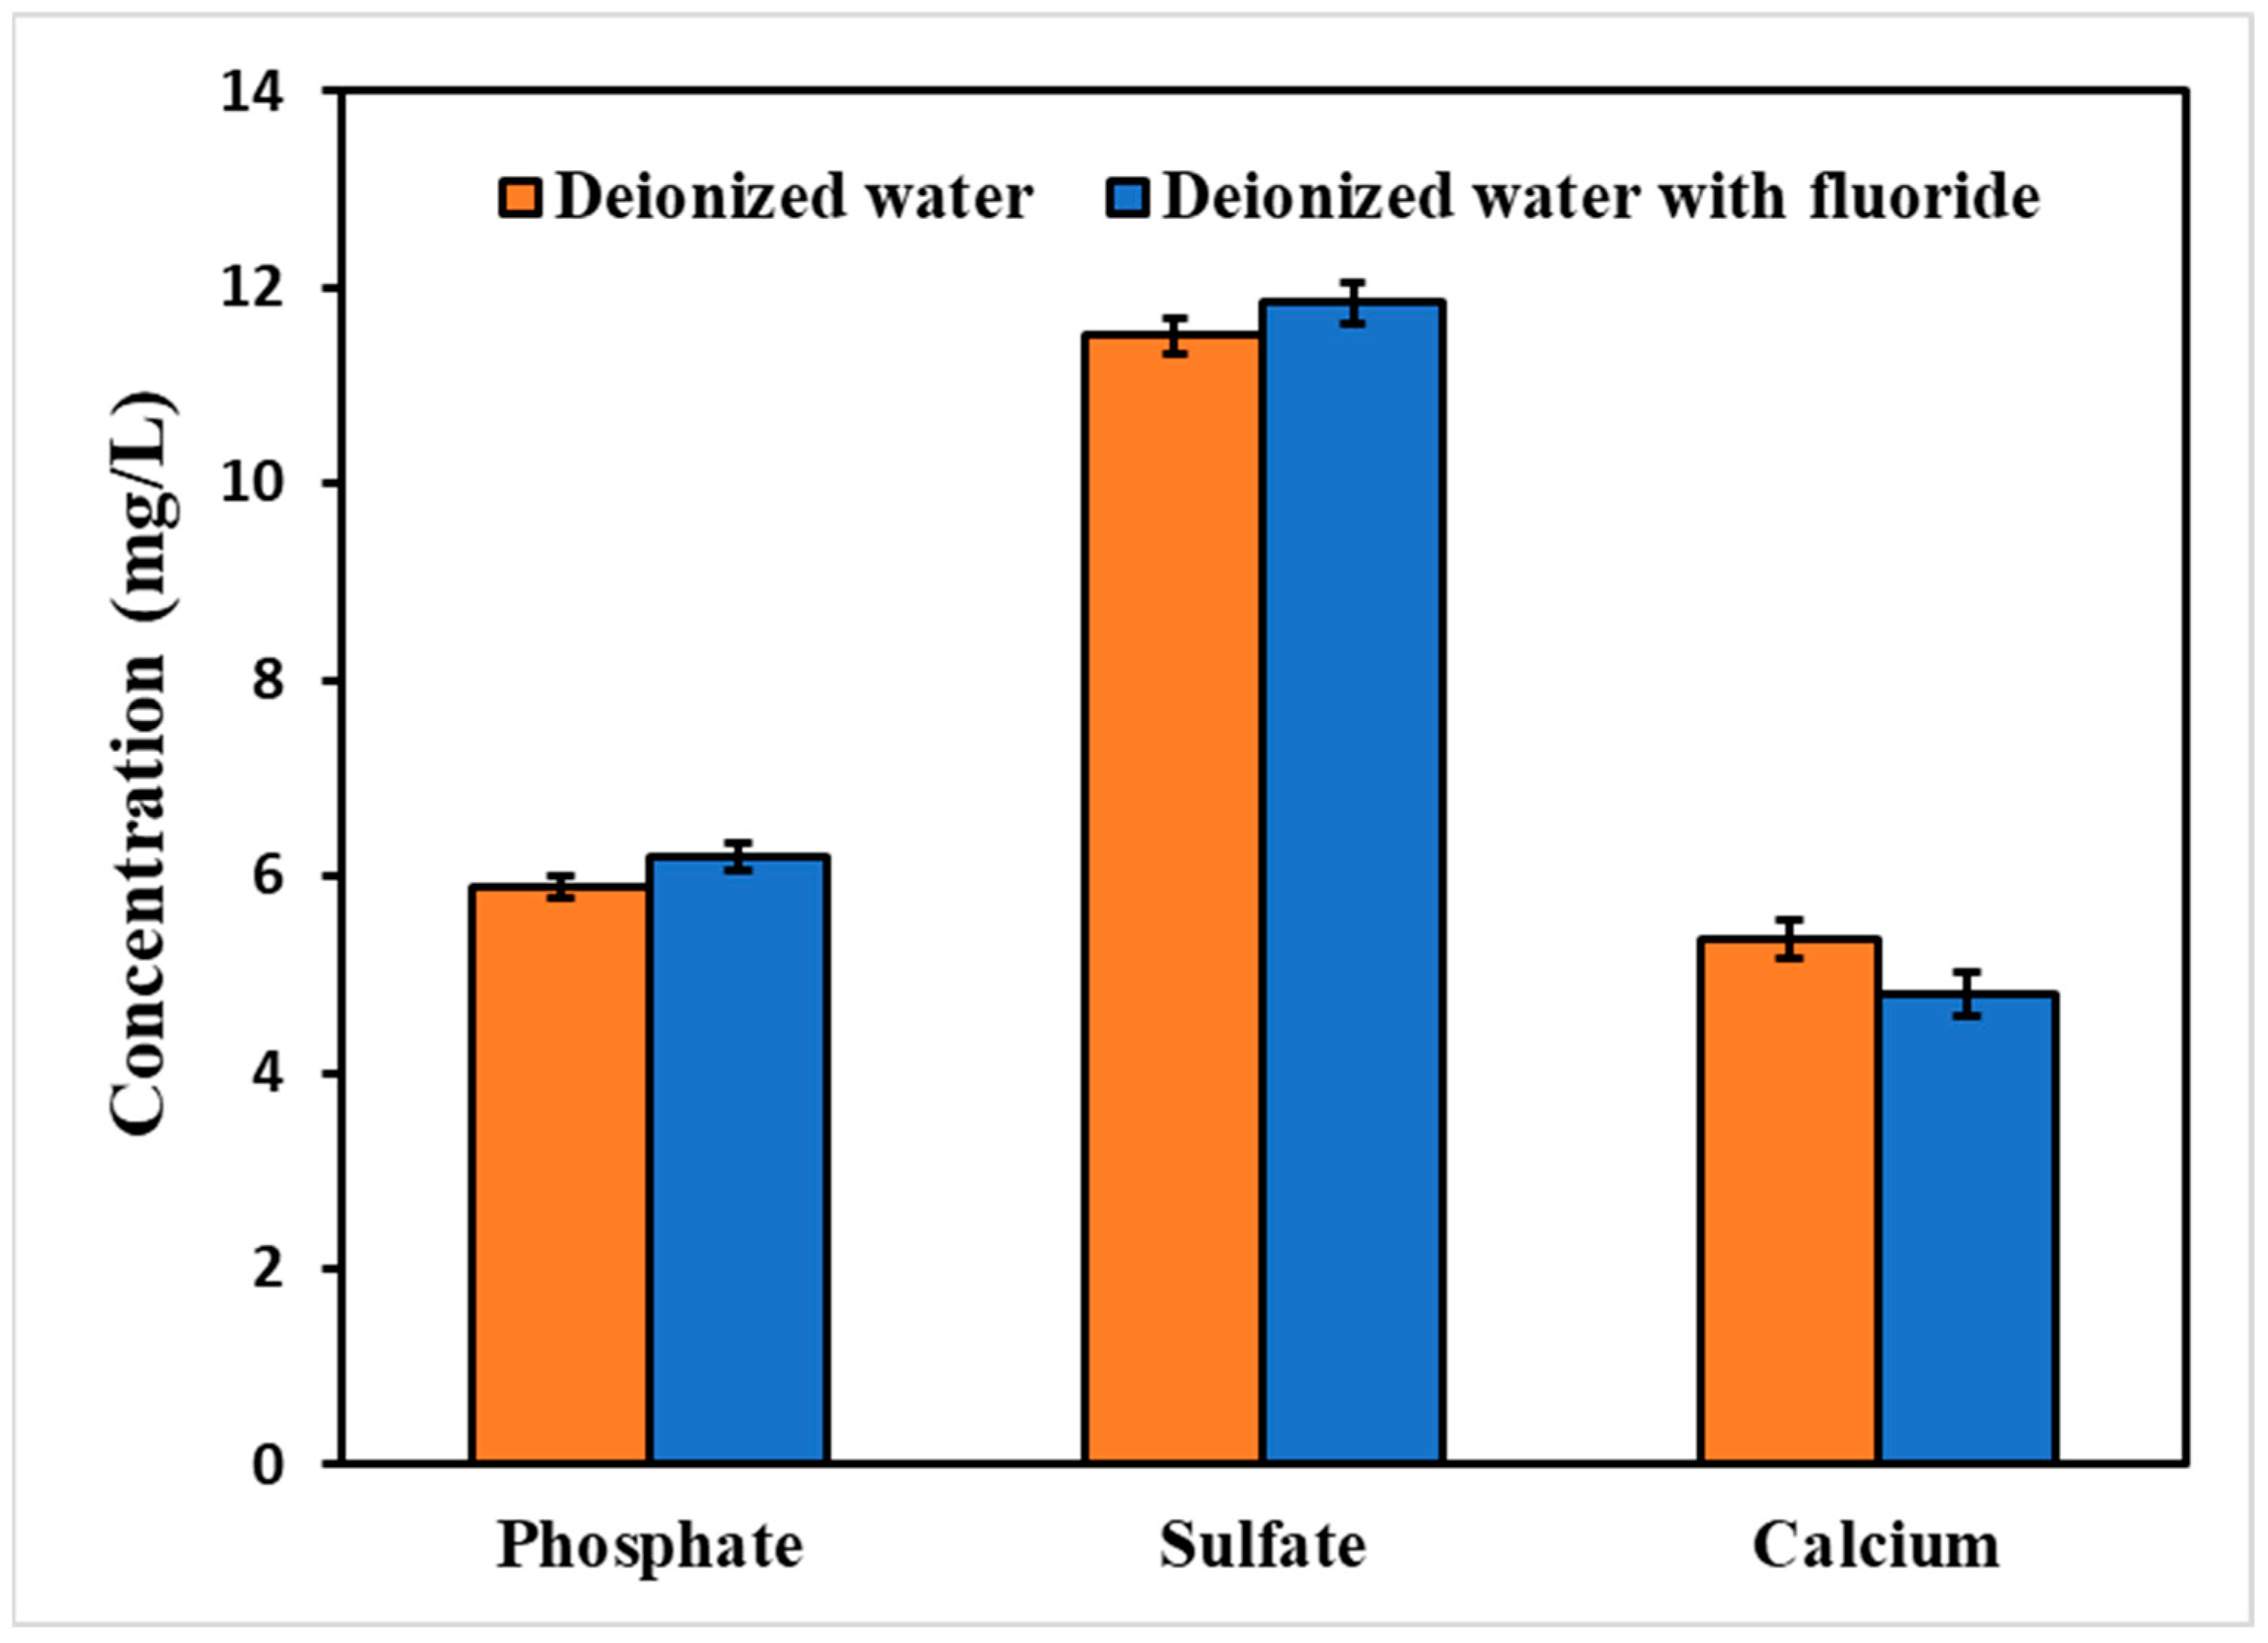
Furthermore, release of PO43− and Ca2+ was observed in deionized water compared to the raw water samples. This can be justified by the dissolution of hydroxyapatite in the acidic solution (pH = 5.32) which resulted in the release of PO43− and Ca2+ in the solution. In contrast, the pH of the raw water sample was alkaline (Table 2), which does not promote the dissolution of hydroxyapatite in BC and the subsequent release of PO43− and Ca2+. Moreover, elution of PO43− and SO42− ions in the treated solution may affect the adsorption process. This is due to the possibility of ion exchange at the surface of BC between F and PO43− or SO42− [42,43]. Additional adsorption experiments were carried out using deionized water with and without F. Concentrations of PO43−, SO42−, and Ca2+ in the final solutions were compared. The data obtained are presented in Figure 7. From the results, it was clear that there was no significant difference in PO43− and SO42− concentrations in the final solution of deionized water with or without F. At the same time, there was no significant difference between the amount of Ca2+ released in the two solutions after adsorption. This may suggest that there was no involvement of ion exchange between SO42− or PO43− and F during the adsorption process on BC. The release of PO43− and SO42− in the treated solution occurred as a result of dissolution of those ions from BC rather than ion exchange. Thus, it can be concluded that the release of PO43− and SO42− in the final solution may not affect the adsorption of F onto BC.

3.5. Effect of Dissolved Organic Carbon (DOC)

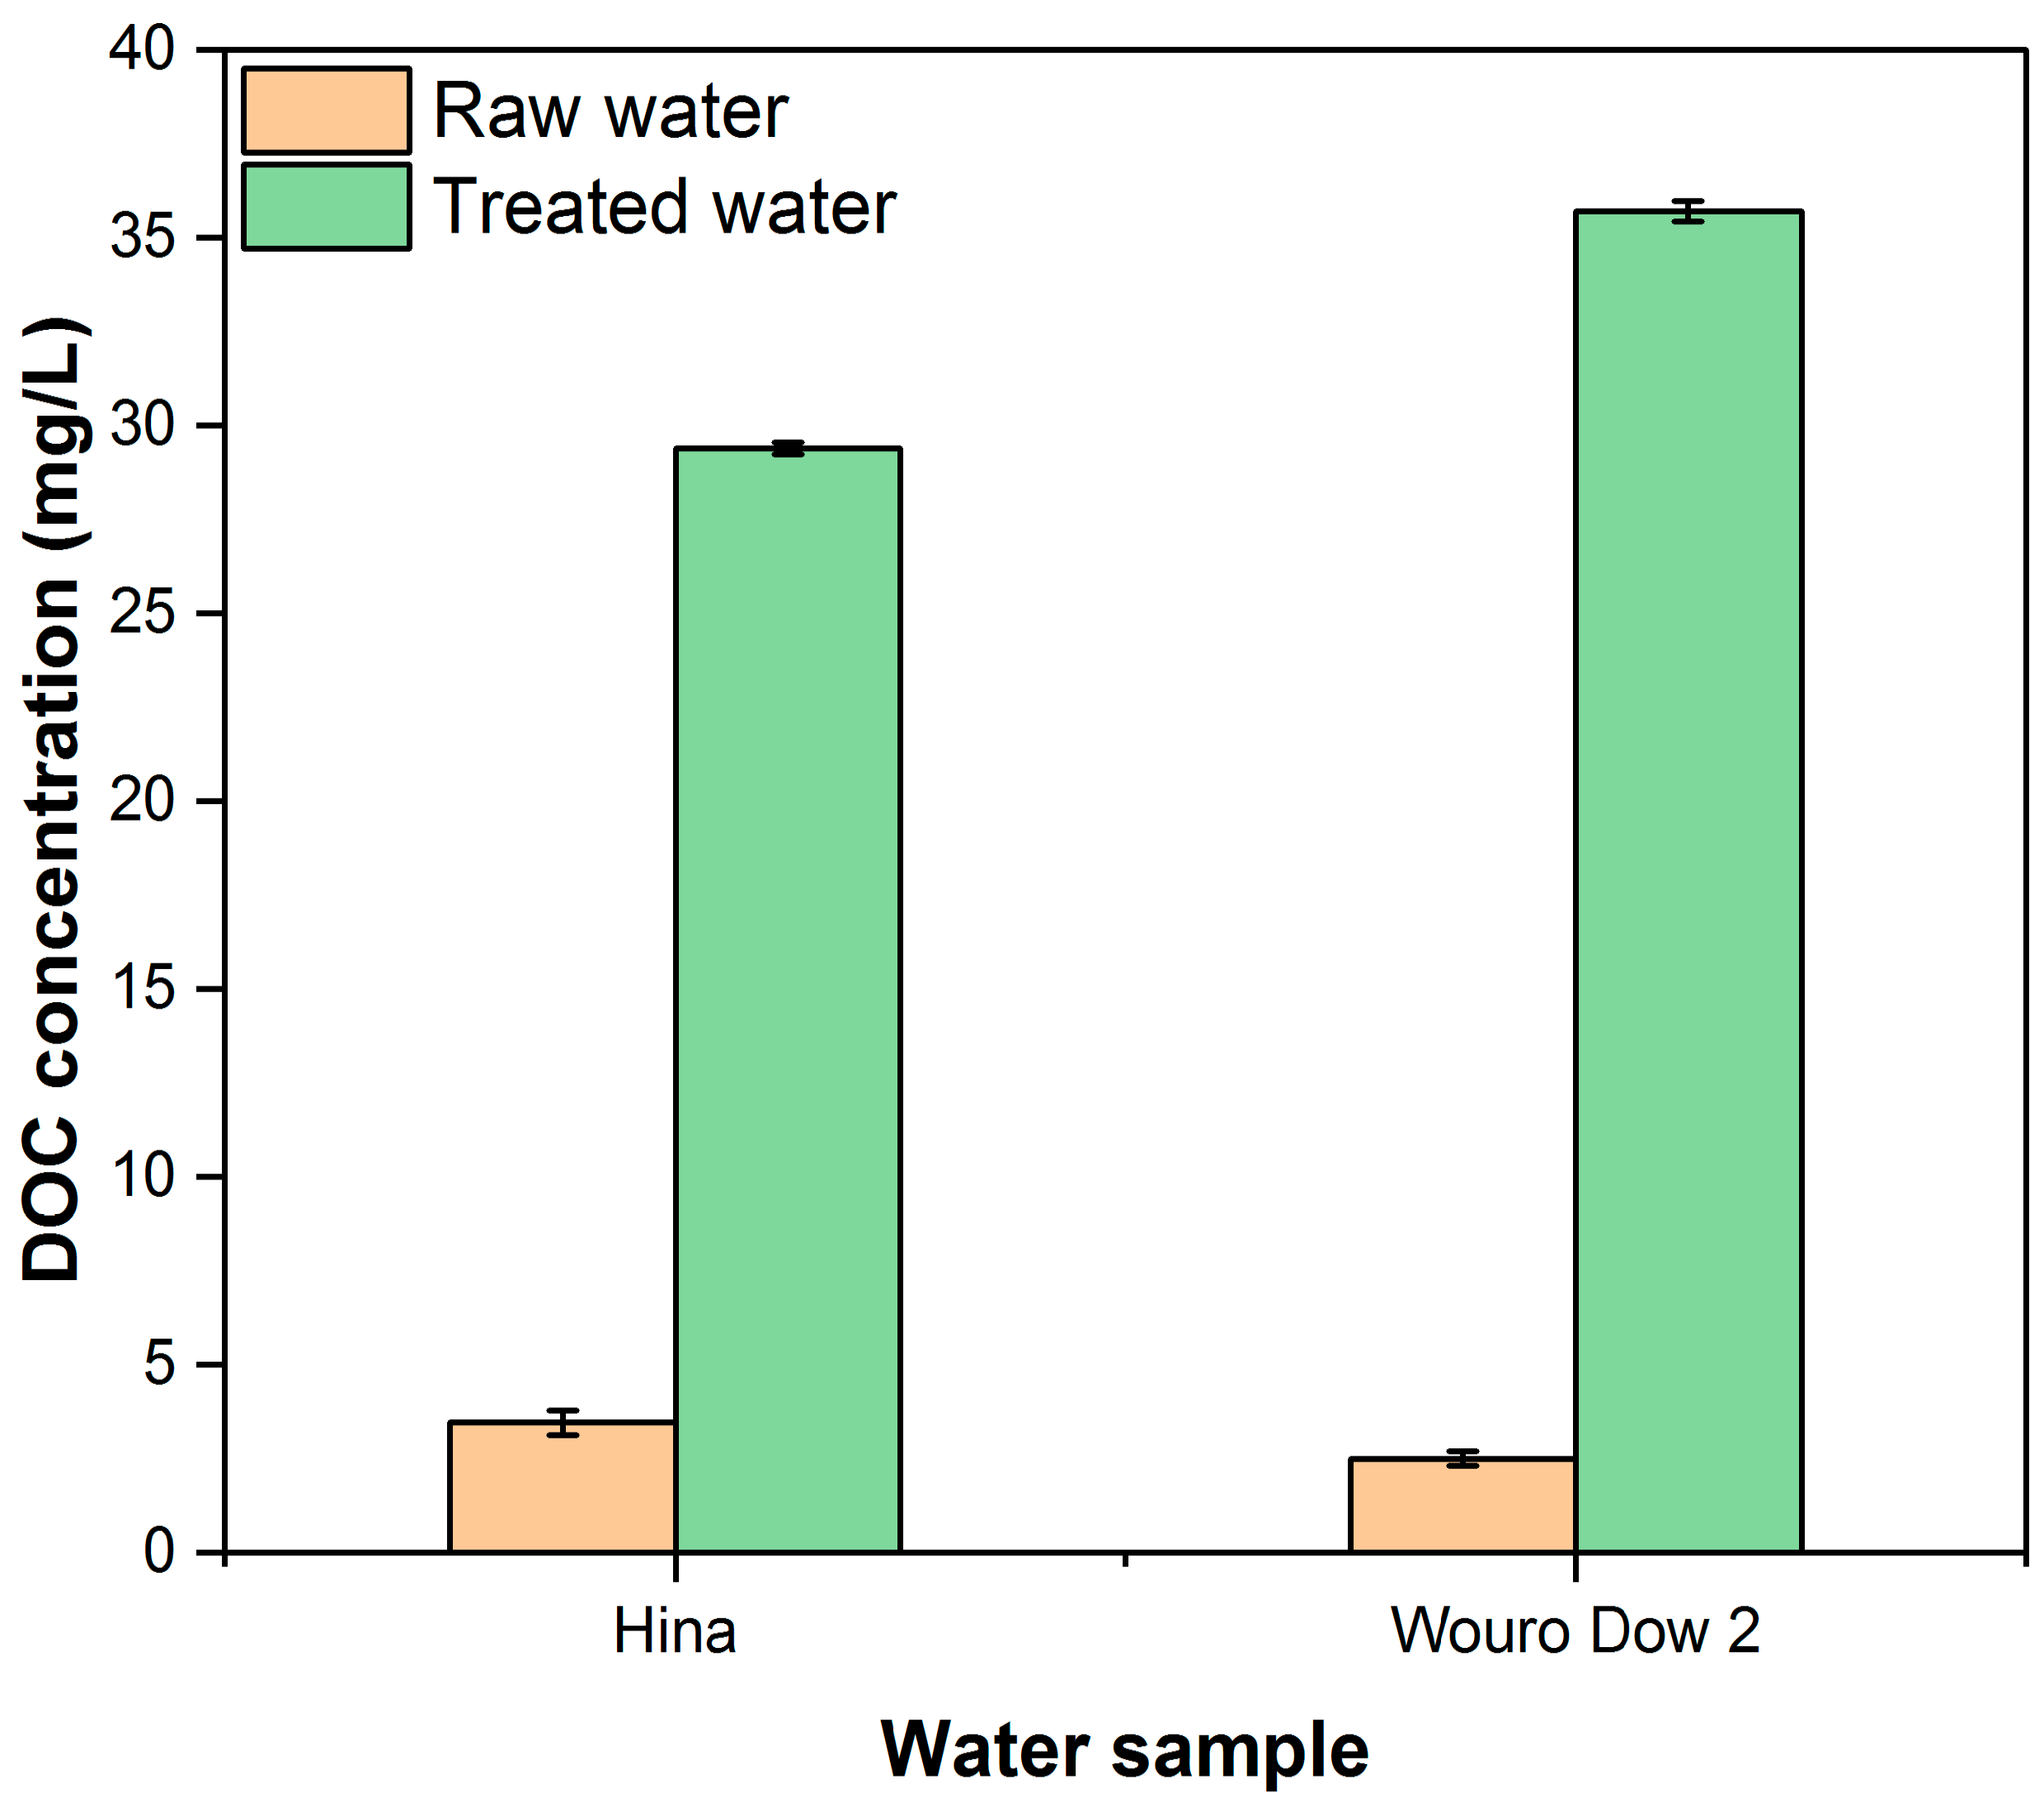
DOC was tested to evaluate the effect of natural dissolved organic matter (DOM) on F removal. DOC concentrations before and after adsorption on BC are shown in Figure 8. It was observed that DOC concentrations in the raw water samples were not adsorbed on BC. Thus, DOC demonstrated no competition with F at the adsorption sites. However, DOC increased from (3.5 ± 0.3) mg/L to (29.4 ± 0.2) mg/L and from (2.5 ± 0.2) mg/L to (35.7 ± 0.3) mg/L from Hina and Wouro Dow 2 water samples, respectively. This may represent another source of water contamination that needs to be addressed. The increase in DOC can be justified by the release of carbon in the treated water due to the incomplete removal of organic matter in the BC. However, it is convenient to note that the treated water does not exhibit a yellowish color using BC prepared at low temperature (<550 °C) as in previous studies [20,26].

3.6. Adsorption Mechanism

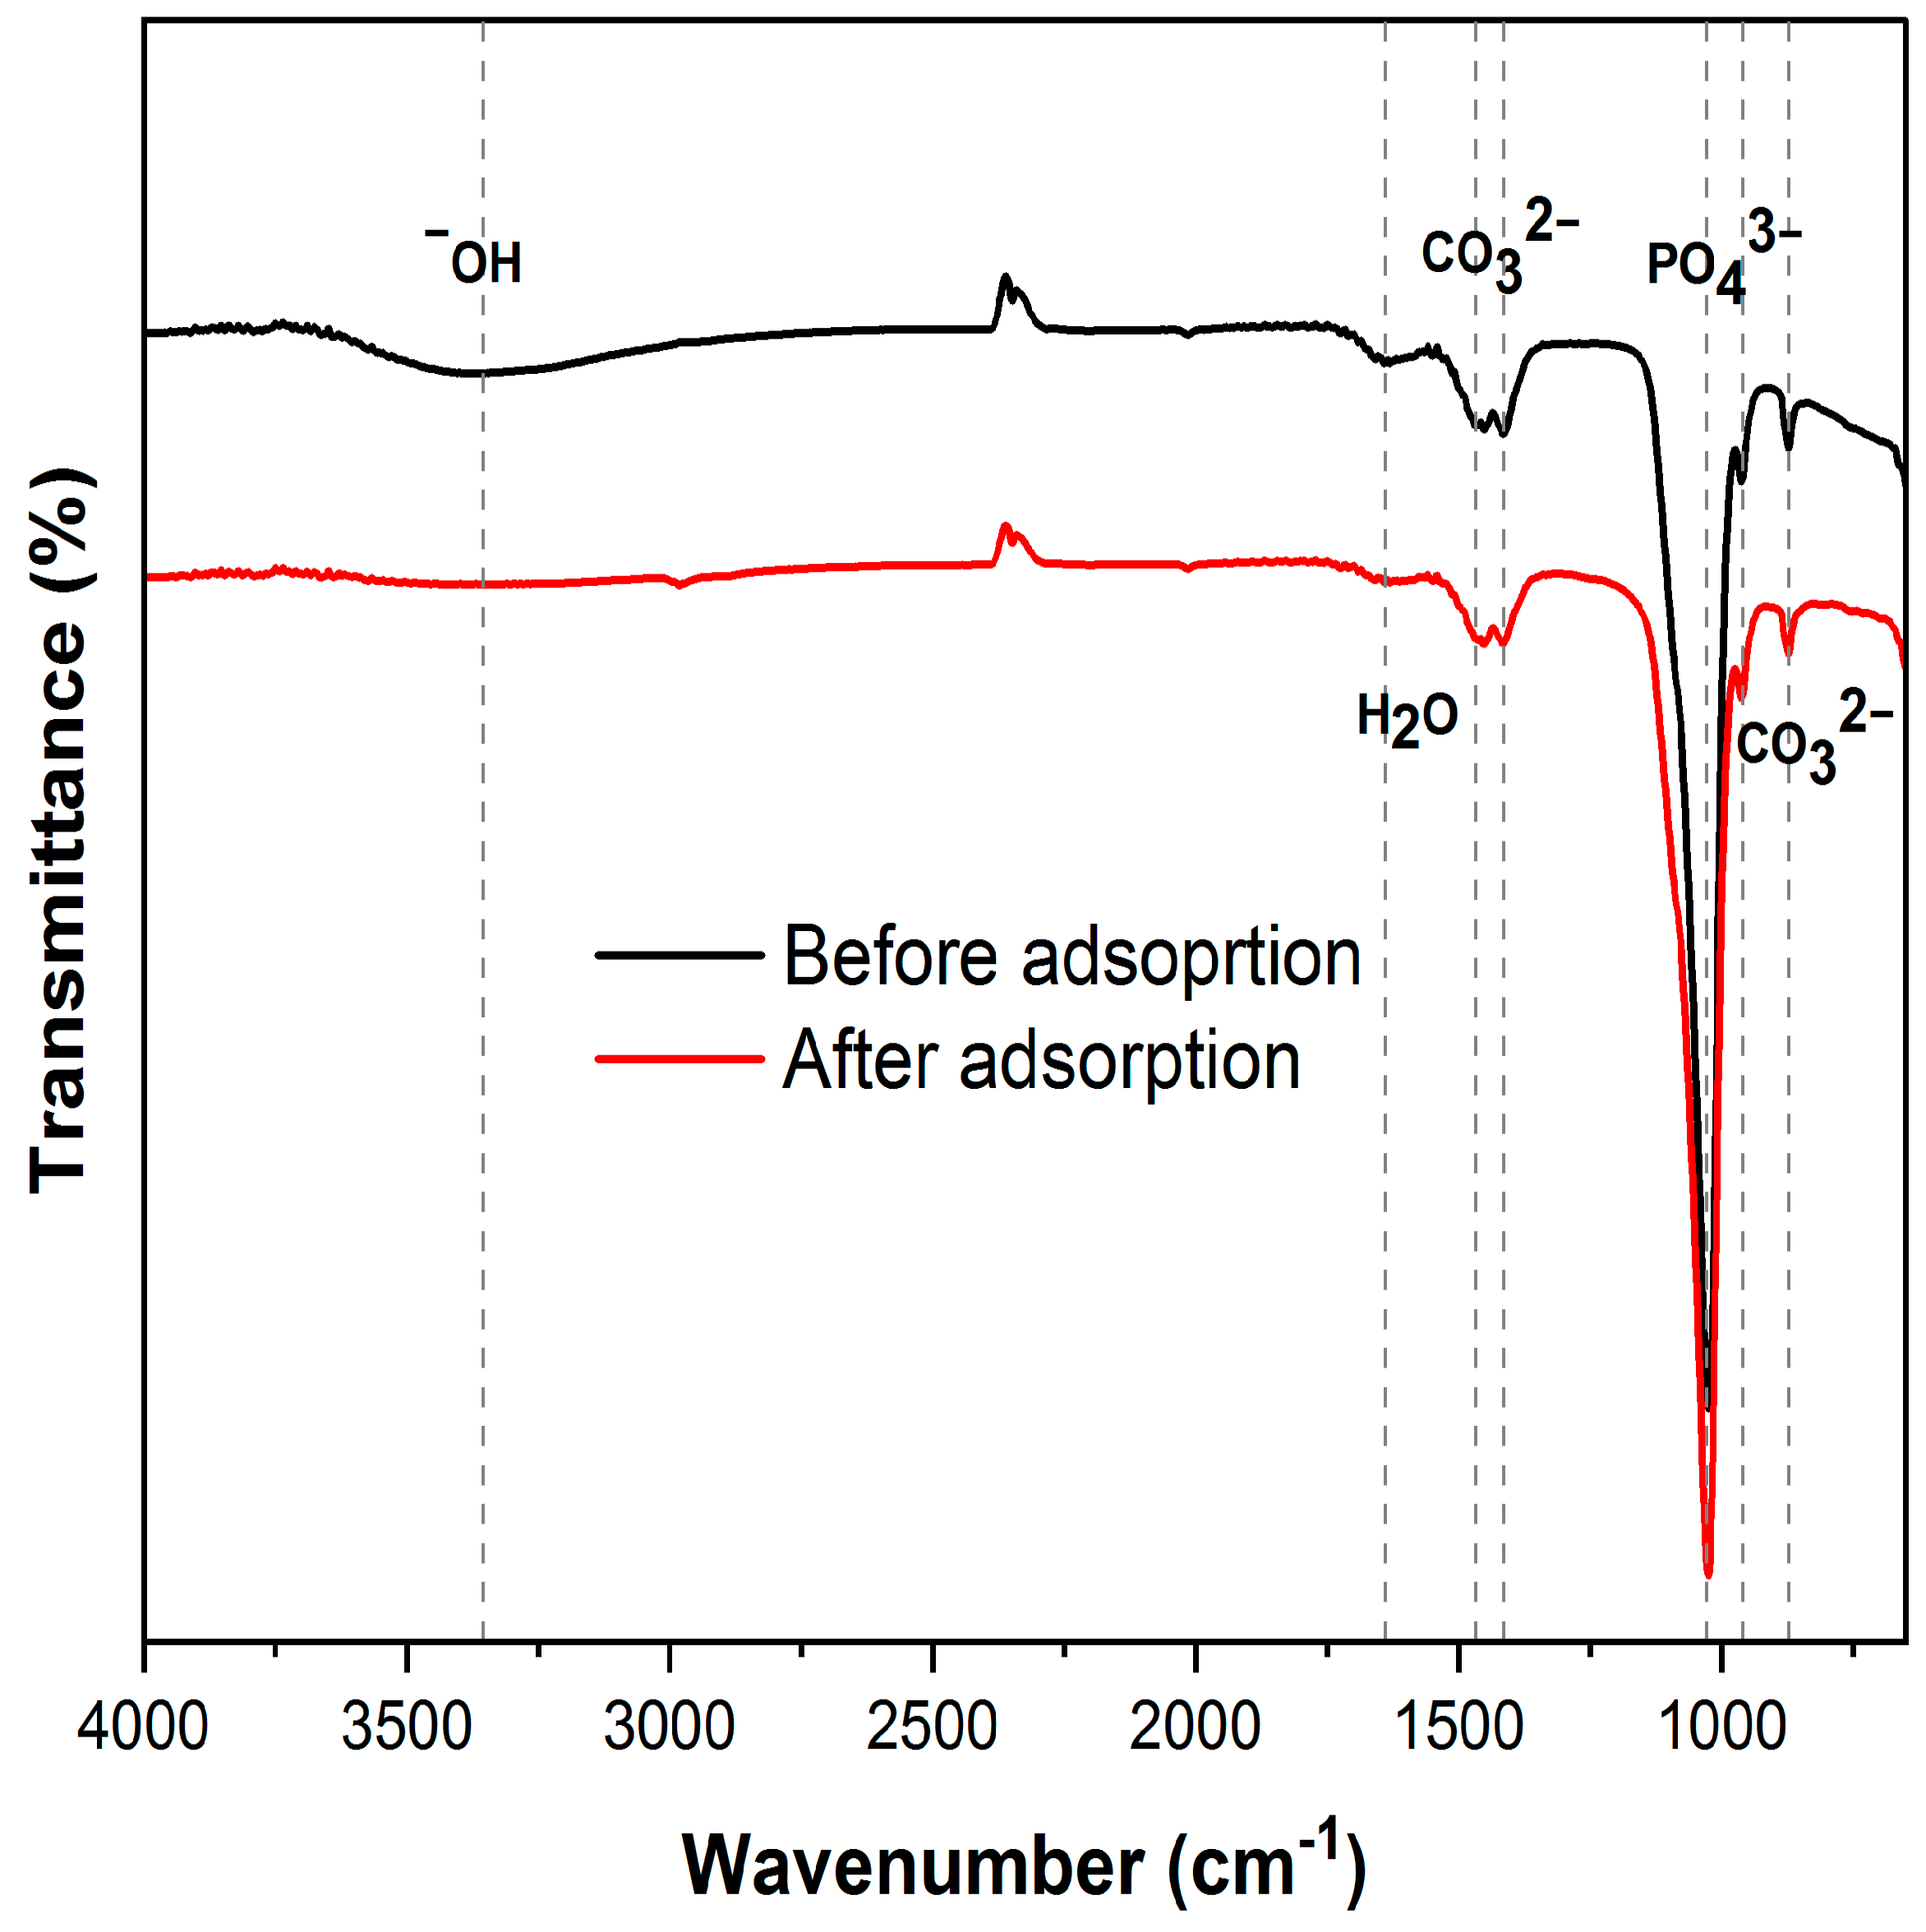
The adsorption mechanism of F onto BC was elucidated by performing the FTIR analyses before and after fluoride adsorption, and the spectra are displayed in Figure 9. The results indicated that the spectrum of BC exhibited the same bands as that of the BC sample containing F. However, a noticeable change was observed in the adsorption bands corresponding to the hydroxyl group (OH), specifically in the range of 3600–3000 cm−1. The intensity of this peak decreased following fluoride adsorption, suggesting a potential ion exchange between the OH group from the hydroxyapatite in BC and F from the water solution. This ion exchange can be represented by the following equation:
C a 10 ( P O 4 ) 6 O H 2 + 2 F C a 10 ( P O 4 ) 6 F 2 + 2 O H
In addition, the presence of positively charged sites on the BC surface exhibited an attractive tendency towards the negatively charged F through electrostatic interactions, which can be represented by the following equations:
C a O H 2 + + F C a O H 2 + F P O H 2 + + F P O H 2 + F
where C a O H 2 + and P O H 2 + represent the positively charged sites on the surface of BC.
On the other hand, the adsorption of cations (Ca2+ and Mg2+) from the raw water sample onto BC is expected to interact with F and thus to form solid precipitates. The absence of visible precipitates suggests this mechanism does not occur during the adsorption process. Further investigation is necessary to explore and elucidate the formation of precipitates during fluoride adsorption on BC.

4. Conclusions

The study was able to report the high levels of F ranging from (2.3 ± 0.1) to (4.5 ± 0.2) mg/L within the study area. The instrument analysis (FTIR and SEM) of the prepared adsorbent (BC) shows no significant change with respect to various calcination temperatures and residence times. However, these parameters affect the surface area of the BC samples. The study presents lower temperature and residence time (350 °C, 1 h) as the optimum charring conditions for the preparation of BC for F adsorption. Furthermore, an increase in DOC in the treated water after adsorption process was reported. This represents one of the limitations of BC application prepared at low calcination temperature. According to the adsorption results, the high removal efficiency range from (72.5 ± 1.4)% to (80.3 ± 0.6)% of the BC was adduced to the presence of Ca2+ and Mg2+ in raw water samples. Also, the study revealed that the presence of competitor anions such as Cl, SO42−, PO43−, NO3, and NO2 has no effect on F removal on BC. On the other hand, it was observed that Cl, SO42−, and K+ release from BC in the aqueous solution both in raw samples and deionized water. This was the result of dissolution of those ions from BC samples independent of the solution pH (acidic or alkaline). However, Na+ release was due to cation exchange with Ca2+ adsorbed on the BC surface. Also, the release of PO42− and SO42− from BC has no effect on the adsorption of F under acidic solution (pH= 5.32). Overall, the BC shows good efficiency for the removal of F in raw water below the limit set by WHO standards. However, the adsorbent contributes to an increase in of amount of DOC. Thus, this limitation needs to be addressed before large-scale industrial application. It is therefore necessary to perform a pretreatment of the prepared material to remove any organic matter before applying it for defluoridation. Furthermore, the study further recommends the studies on the removal of nitrate significantly present in the raw water via bio coagulation or the filtration process for the availability of clean portable water with parameters within the limits set by the WHO.

Author Contributions

Conceptualization: M.R.I., A.H. and S.D.; Methodology: M.R.I., A.H. and S.D.; Software: M.R.I., A.H., S.D., J.A.O., A.N. and C.L.; Data Curation: M.R.I.; Writing—Original draft preparation: M.R.I.; Visualization: M.R.I., A.H., A.N. and C.L.; Investigation: M.R.I., A.H., A.N. and C.L.; Supervision: A.H. and S.D.; Validation: J.A.O., A.N. and C.L.; Writing—Review and Editing: M.R.I., A.H. and S.D. All authors have read and agreed to the published version of the manuscript.

Funding

This research received no external funding.

Data Availability Statement

All relevant data are included in the paper.

Acknowledgments

This work was supported and funded the Regional Scholarship for Innovation Fund (RSIF), a flagship program of the Partnership for Skills in Applied Sciences, Engineering and Technology (PASET).

Conflicts of Interest

The authors declare no conflicts of interest.

References

  1. Premathilaka, R.W.; Liyanagedera, N.D. Fluoride in drinking water and nanotechnological approaches for eliminating excess fluoride. J. Nanotechnol. 2019, 2019, 2192383. [Google Scholar] [CrossRef]
  2. World Health Organization. Guidelines for Drinking—Water Quality, 4th ed.; WHO: Geneva, Switzerland, 2011.
  3. Wang, J.; Xu, W.; Chen, L.; Jia, Y.; Wang, L.; Huang, X.J.; Liu, J. Excellent fluoride removal performance by CeO2–ZrO2 nanocages in water environment. J. Chem. Eng. 2013, 231, 198–205. [Google Scholar] [CrossRef]
  4. Malago, J.; Makoba, E.; Muzuka, A.N. Fluoride levels in surface and groundwater in Africa: A review. Am. J. Water Sci. Eng. 2017, 3, 1–17. [Google Scholar] [CrossRef]
  5. Kut, K.M.K.; Sarswat, A.; Srivastava, A.; Pittman, C.U., Jr.; Mohan, D. A review of fluoride in African groundwater and local remediation methods. Groundwater Sustain. Dev. 2016, 2, 190–212. [Google Scholar] [CrossRef]
  6. Onipe, T.; Edokpayi, J.N.; Odiyo, J.O. A review on the potential sources and health implications of fluoride in groundwater of Sub-Saharan Africa. Environ. Sci. Health Part A 2020, 55, 1078–1093. [Google Scholar] [CrossRef]
  7. Fantong, W.Y.; Satake, H.; Ayonghe, S.N.; Suh, E.C.; Adelana, S.M.; Fantong, E.B.S.; Banseka, H.S.; Gwanfogbe, C.D.; Woincham, L.N.; Uehara, Y. Geochemical provenance and spatial distribution of fluoride in groundwater of Mayo Tsanaga River Basin, Far North Region, Cameroon: Implications for incidence of fluorosis and optimal consumption dose. Environ. Geochem. Health 2010, 32, 147–163. [Google Scholar] [CrossRef]
  8. Fantong, W.Y.; Jokam Nenkam, T.L.; Nbendah, P.; Kimbi, S.B.; Fru, E.C.; Kamtchueng, B.T.; Takoundjou, A.F.; Tejiobou, A.R.; Ngueutchoua, G.; Kringel, R. Compositions and mobility of major, δ D, δ 18 O, trace, and REEs patterns in water sources at Benue River Basin—Cameroon: Implications for recharge mechanisms, geo-environmental controls, and public health. Environ. Geochem. Health 2020, 42, 2975–3013. [Google Scholar] [CrossRef]
  9. Habuda-Stanić, M.; Ravančić, M.E.; Flanagan, A. A review on adsorption of fluoride from aqueous solution. Materials 2014, 7, 6317–6366. [Google Scholar] [CrossRef]
  10. Yadav, K.K.; Gupta, N.; Kumar, V.; Khan, S.A.; Kumar, A. A review of emerging adsorbents and current demand for defluoridation of water: Bright future in water sustainability. Environ. Int. 2018, 111, 80–108. [Google Scholar] [CrossRef]
  11. Alkurdi, S.S.A.; Al-Juboori, R.A.; Bundschuh, J.; Bowtell, L.; Marchuk, A. Inorganic arsenic species removal from water using bone char: A detailed study on adsorption kinetic and isotherm models using error functions analysis. J. Hazard. Mater. 2021, 405, 124112. [Google Scholar] [CrossRef]
  12. Jia, P.; Tan, H.; Liu, K.; Gao, W. Enhanced photocatalytic performance of ZnO/bone char composites. Mater. Lett. 2017, 205, 233–235. [Google Scholar] [CrossRef]
  13. Ranjbar, N.; Hashemi, S.; Ramavandi, B.; Ravanipour, M. Chromium(VI) removal by bone char–ZnO composite: Parameters optimization by response surface methodology and modeling. Environ. Prog. Sustain. Energy 2018, 37, 1684–1695. [Google Scholar] [CrossRef]
  14. Alkurdi, S.S.; Al-Juboori, R.A.; Bundschuh, J.; Hamawand, I. Bone char as a green sorbent for removing health threatening fluoride from drinking water. Environ. Int. 2019, 127, 704–719. [Google Scholar] [CrossRef] [PubMed]
  15. Shen, J.; Schäfer, A.I. Factors affecting fluoride and natural organic matter (NOM) removal from natural waters in Tanzania by nanofiltration/reverse osmosis. Sci. Total Environ. 2015, 527, 520–529. [Google Scholar] [CrossRef]
  16. Samarghandi, M.R.; Khiadani, M.; Foroughi, M.; Zolghadr Nasab, H. Defluoridation of water using activated alumina in presence of natural organic matter via response surface methodology. Environ. Sci. Pollut. Res. 2016, 23, 887–897. [Google Scholar] [CrossRef]
  17. Pagano, T.; Bida, M.; Kenny, J.A. Trends in levels of allochthonous dissolved organic carbon in natural water: A review of potential mechanisms under a changing climate. Water 2014, 6, 2862–2897. [Google Scholar] [CrossRef]
  18. Wongrueng, A.; Rakruam, P.; Siri, A.; Siyasukh, A. Synthesis of porous pig bone char as adsorbent for removal of DBP precursors from surface water. Water Sci. Technol. 2019, 79, 857–865. [Google Scholar] [CrossRef]
  19. Brunson, L.R.; Sabatini, D.A. Practical considerations, column studies and natural organic material competition for fluoride removal with bone char and aluminum amended materials in the Main Ethiopian Rift Valley. Sci. Total Environ. 2014, 488, 580–587. [Google Scholar] [CrossRef]
  20. Sawangjang, B.; Induvesa, P.; Wongrueng, A.; Pumas, C.; Wattanachira, S.; Rakruam, P.; Punyapalakul, P.; Takizawa, S.; Khan, E. Evaluation of fluoride adsorption mechanism and capacity of different types of bone char. Int. J. Environ. Res. Public Health 2021, 18, 6878. [Google Scholar] [CrossRef]
  21. Chen, J.; Wu, H.; Qian, H.; Gao, J. Assessing nitrate and fluoride contaminants in drinking water and their health risk of rural residents living in a semiarid region of Northwest China. Expo. Health 2017, 9, 183–195. [Google Scholar] [CrossRef]
  22. Rahman, M.M.; Bodrud-Doza, M.; Siddiqua, M.T.; Zahid, A.; Islam, A.R.M.T. Spatiotemporal distribution of fluoride in drinking water and associated probabilistic human health risk appraisal in the coastal region, Bangladesh. Sci. Total Environ. 2020, 724, 138316. [Google Scholar] [CrossRef] [PubMed]
  23. Oyetade, J.A.; Machunda, R.L.; Hilonga, A. Investigation of functional performance of treatment systems for textile wastewater in selected textile industries in Tanzania. Water Sci. Technol. 2023, 87, 584–597. [Google Scholar] [CrossRef] [PubMed]
  24. Bidu, J.M.; Van der Bruggen, B.; Rwiza, M.J.; Njau, K.N. Current status of textile wastewater management practices and effluent characteristics in Tanzania. Water Sci. Technol. 2021, 83, 2363–2376. [Google Scholar] [CrossRef] [PubMed]
  25. Mouttoucomarassamy, S.; Virk, H.S.; Dharmalingam, S.N. Evaluation and health risk assessment of arsenic and potentially toxic elements pollution in groundwater of Majha Belt, Punjab, India. Environ. Geochem. Health 2024, 46, 208. [Google Scholar] [CrossRef] [PubMed]
  26. Shahid, M.K.; Kim, J.Y.; Shin, G.; Choi, Y. Effect of pyrolysis conditions on characteristics and fluoride adsorptive performance of bone char derived from bone residue. J. Water Process. Eng. 2020, 37, 101499. [Google Scholar] [CrossRef]
  27. Rojas-Mayorga, C.K.; Bonilla-Petriciolet, A.; Aguayo-Villarreal, I.A.; Hernandez-Montoya, V.; Moreno-Virgen, M.R.; Tovar-Gómez, V.; Montes-Morán, M.A. Optimization of pyrolysis conditions and adsorption properties of bone char for fluoride removal from water. J. Anal. Appl. Pyrolysis 2013, 104, 10–18. [Google Scholar] [CrossRef]
  28. Alkurdi, S.S.; Al-Juboori, R.A.; Bundschuh, J.; Bowtell, L.; McKnight, S. Effect of pyrolysis conditions on bone char characterization and its ability for arsenic and fluoride removal. Environ. Pollut. 2020, 262, 114221. [Google Scholar] [CrossRef]
  29. Shahid, M.K.; Kim, J.Y.; Choi, Y. Synthesis of bone char from cattle bones and its application for fluoride removal from the contaminated water. Groundwater Sustain. Dev. 2019, 8, 324–331. [Google Scholar] [CrossRef]
  30. Smolen, D.; Chudoba, T.; Malka, I.; Kedzierska, A.; Lojkowski, W.; Swieszkowski, W.; Kurzydlowski, K.J.; Kolodziejczyk-Mierzynska, M.; Lewandowska-Szumiel, M. Highly biocompatible, nanocrystalline hydroxyapatite synthesized in a solvothermal process driven by high energy density microwave radiation. Int. J. Nanomed. 2013, 8, 653–668. [Google Scholar] [CrossRef]
  31. Irfan, M.; Suprajaa, P.; Baraneedharan, P.; Reddy, B. A comparative study of nanohydroxyapetite obtained from natural shells and wet chemical process. J. Mater. Sci. Surf. Eng. 2020, 7, 938–943. [Google Scholar]
  32. Patel, S.; Han, J.; Qiu, W.; Gao, W. Synthesis and characterisation of mesoporous bone char obtained by pyrolysis of animal bones, for environmental application. J. Environ. Chem. Eng. 2015, 3, 2368–2377. [Google Scholar] [CrossRef]
  33. Obada, D.O.; Osseni, S.A.; Sina, H.; Oyedeji, A.N.; Salami, K.A.; Okafor, E.; Csaki, S.; Abolade, S.A.; Akande, A.; Dauda, M. Hydroxyapatite materials-synthesis routes, mechanical behavior, theoretical insights, and artificial intelligence models: A review. J. Aust. Ceram. Soc. 2023, 59, 565–596. [Google Scholar] [CrossRef]
  34. Cruz-Briano, S.A.; Medellín-Castillo, N.A.; Torres-Dosal, A.; Leyva-Ramos, R.; Moreno-Piraján, J.C.; Giraldo-Gutiérrez, L.; Díaz-Flores, P.E.; Reyes-López, S.Y.; Ocampo-Pérez, R. Bone char from an invasive aquatic specie as a green adsorbent for fluoride removal in drinking water. Water Air Soil Pollut. 2021, 232, 346. [Google Scholar] [CrossRef]
  35. Medellín-Castillo, N.A.; Cruz-Briano, S.A.; Leyva-Ramos, R.; Moreno-Piraján, J.C.; Torres-Dosal, A.; Giraldo-Gutiérrez, L.; Labrada-Delgado, G.J.; Pérez, R.O.; Rodriguez-Estupiñan, J.P.; Reyes Lopez, S.Y.; et al. Use of bone char prepared from an invasive species, pleco fish (Pterygoplichthys spp.), to remove fluoride and Cadmium(II) in water. J. Environ. Manag. 2020, 256, 109956. [Google Scholar] [CrossRef] [PubMed]
  36. Medellin-Castillo, N.A.; Padilla-Ortega, E.; Tovar-García, L.D.; Leyva-Ramos, R.; Ocampo-Pérez, R.; Carrasco-Marín, F.; Berber-Mendoza, M.S. Removal of fluoride from aqueous solution using acid and thermally treated bone char. Adsorption 2016, 22, 951–961. [Google Scholar] [CrossRef]
  37. Azeem, M.; Shaheen, S.M.; Ali, A.; Jeyasundar, P.G.; Latif, A.; Abdelrahman, H.; Li, R.; Almazroui, M.; Niazi, N.K.; Sarmah, A.K.; et al. Removal of potentially toxic elements from contaminated soil and water using bone char compared to plant-and bone-derived biochars: A review. J. Hazard Mater. 2022, 427, 128131. [Google Scholar] [CrossRef]
  38. Rojas-Mayorga, C.K.; Silvestre-Albero, J.; Aguayo-Villarreal, I.A.; Mendoza-Castillo, D.I.; Bonilla-Petriciolet, A. A new synthesis route for bone chars using CO2 atmosphere and their application as fluoride adsorbents. Microporous Mesoporous Mater. 2015, 209, 38–44. [Google Scholar] [CrossRef]
  39. Chen, L.; Zhang, K.S.; He, J.Y.; Xu, W.H.; Huang, X.J.; Liu, J.H. Enhanced fluoride removal from water by sulfate-doped hydroxyapatite hierarchical hollow microspheres. Chem. Eng. 2016, 285, 616–624. [Google Scholar] [CrossRef]
  40. Xiang, B.; Tang, J.; Feng, X.; Zhu, Y.; Li, Y.; Tan, T. Preparation of aluminium-hydroxide-modified diatomite and its fluoride adsorption mechanism. Sci. Rep. 2023, 13, 3871. [Google Scholar] [CrossRef]
  41. Herath, H.A.S.; Kawakami, T.; Tafu, M. The extremely high adsorption capacity of fluoride by chicken bone char (CBC) in defluoridation of drinking water in relation to its finer particle size for better human health. Healthcare 2018, 6, 123. [Google Scholar] [CrossRef]
  42. Kariuki, S.M.; Ngari, M.S.; Mavura, W.J.; Ollengo, M.S.; Ongoma, P.O. Effect of essential mineral ions from aqueous media on adsorption of fluoride by bone char. J. Environ. Sci. Toxicol. Food Technol. 2015, 9, 9–17. [Google Scholar]
  43. Kawasaki, N.; Ogata, F.; Tominaga, H.; Yamaguchi, I. Removal of fluoride ion by bone char produced from animal biomass. J. Oleo Sci. 2009, 58, 529–535. [Google Scholar] [CrossRef] [PubMed]
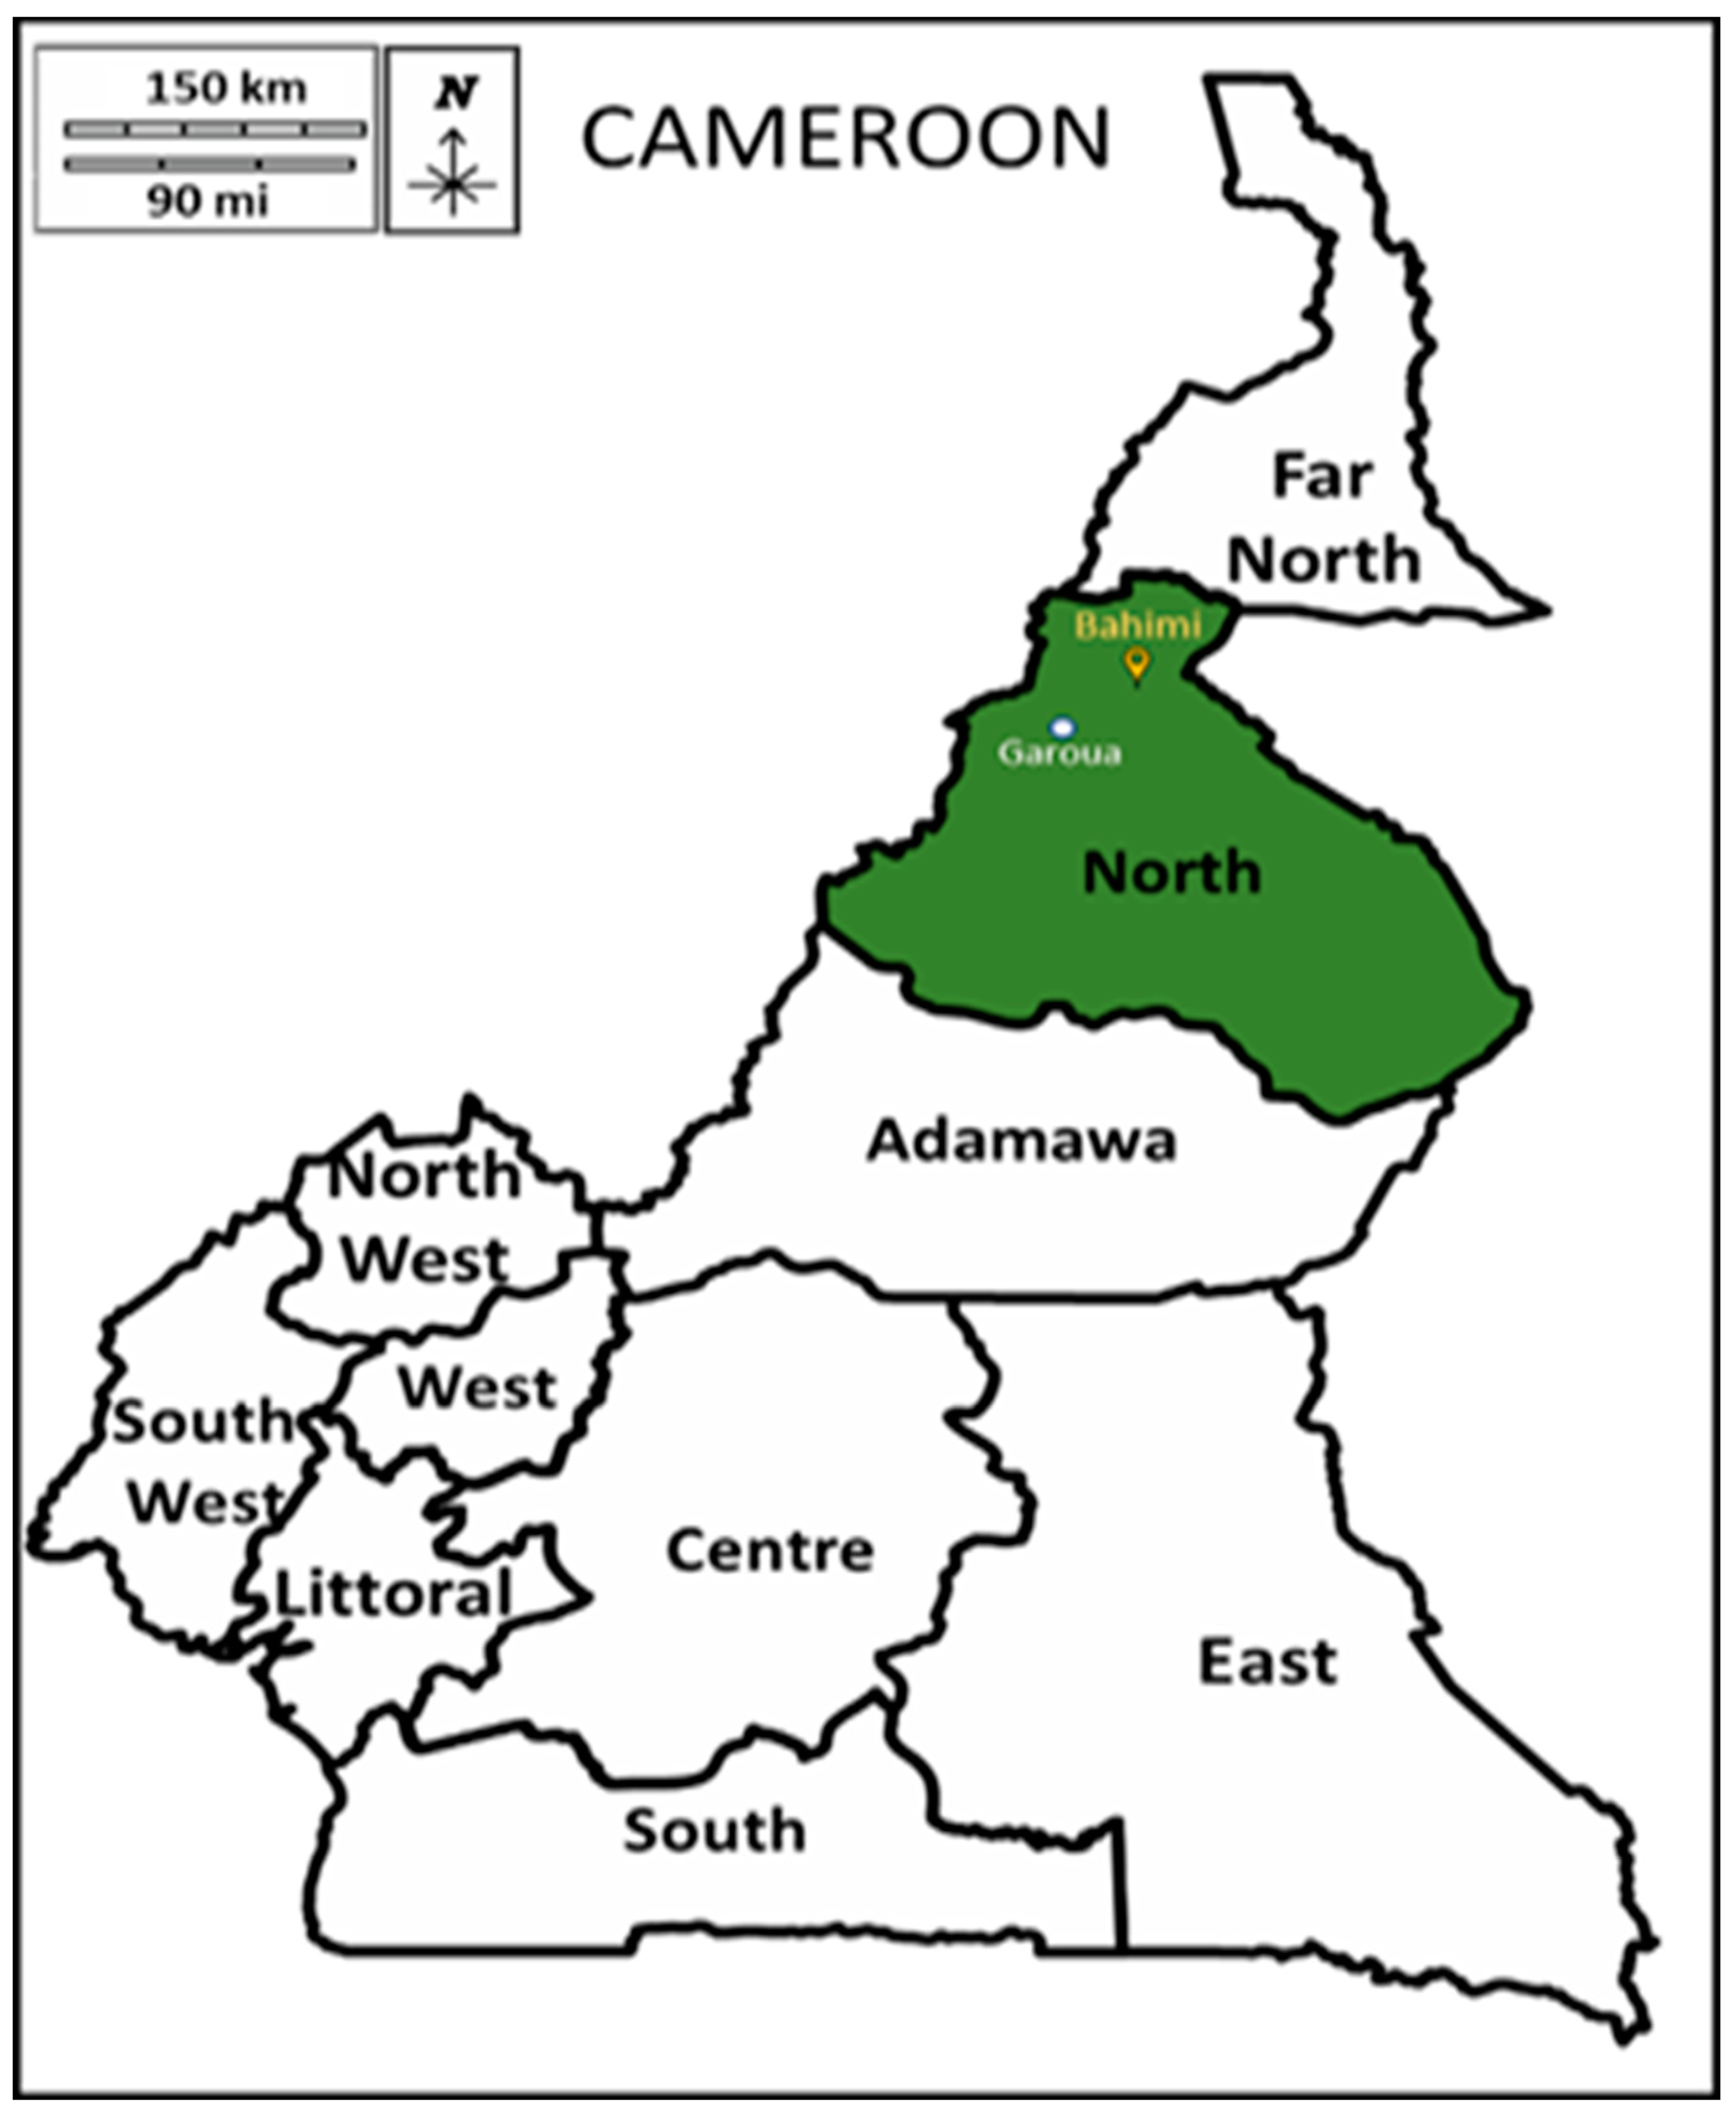
Figure 1. Map of the study area.
Water 16 02991 g001
Figure 2. XRD patterns of prepared BC at different heating temperatures and resistance times. (a) 350 °C—1 h, (b) 350 °C—2 h, (c) 450 °C—1 h, (d) 450 °C—2 h, (e) 550 °C—1 h, (f) 550 °C—2 h, (g) 650 °C—1 h, (h) 650 °C—2 h.
Water 16 02991 g002
Figure 3. FTIR results of BC at various calcination temperatures for a 1 h resistance time.
Water 16 02991 g003
Figure 4. SEM images of synthesized BC samples at various calcination temperatures and resistance times. (a) 350 °C—1 h, (b) 350 °C—2 h, (c) 450 °C—1 h, (d) 450 °C—2 h, (e) 550 °C—1 h, (f) 550 °C—2 h, (g) 650 °C—1 h, (h) 650 °C—2 h.
Water 16 02991 g004
Figure 5. Adsorption–desorption isotherms of N2 on BC (350 °C, 1 h) at T = 77 K.
Water 16 02991 g005
Figure 6. (a) Fluoride concentration in raw water sample before and after adsorption; (b) Fluoride removal efficiency in raw water and deionized water samples for t = 5 min of treatment (Hina: pH = 7.84, [BC] = 8 g/L; Wouro Dow 2: pH = 8.15, [BC] = 8 g/L and Deionized water: [F]0 = 4.28 mg/L, pH = 5.32, [BC] = 8 g/L).
Water 16 02991 g006aWater 16 02991 g006b
Figure 7. Concentrations of PO43−, SO42−, and Ca2+ in deionized water only ([F]0 = 0 mg/L, [BC] = 8 mg/L, pH = 5.32, time = 5 min) and deionized water with fluoride ions ([F]0 = 4.28 mg/L, [BC] = 8 mg/L, pH = 5.32, time = 5 min).
Water 16 02991 g007
Figure 8. DOC before and after adsorption on BC ([BC] = 8 g/L and t = 5 min).
Water 16 02991 g008
Figure 9. FTIR of BC before and after adsorption of fluoride.
Water 16 02991 g009
Table 1. Sample location sites and geographical coordinates.
Samples NoLocationSource of WaterGPS
1HinaBorehole water9.5026050, 13.7682890
2Wouro Dow 1Well water9.5039300, 13.7675970
3Wouro Dow 2Well water9.5031810, 13.7672480
4Djaouro SaliSurface water9.5038220, 13.7718340
Table 2. pH, ions and dissolved organic carbon content of the water samples.
ParametersWater Sample
HinaWouro Dow 1Wouro Dow 2Djaouro SaliWHO
Standards (2011)
pH7.8 ± 0.27.4 ± 0.38.2 ± 0.18.12 ± 0.096.5–8.5
Cl (mg/L)15.2 ± 0.434.0 ± 0.114.4 ± 0.238.87 ± 0.05250.0
SO4 (mg/L)9.2 ± 0.123.0 ± 0.39.8 ± 0.131.5 ± 0.2250.0
NO3 (mg/L)55.7 ± 0.2102.6 ± 0.257.6 ± 0.6105.7 ± 0.450.0
NO2 (mg/L)1.23 ± 0.071.00 ± 0.021.22 ± 0.050.88 ± 0.033.0
F (mg/L)3.0 ± 0.53.3 ± 0.24.5 ± 0.22.3 ± 0.11.5
PO4 (mg/L)BDLBDLBDLBDL-
Br (mg/L)BDLBDLBDLBDL-
K (mg/L)2.04 ± 0.092.2 ± 0.11.39 ± 0.061.7 ± 0.112.0
Na (mg/L)25.2 ± 0.132.9 ± 0.129.4 ± 0.239.7 ± 0.3200.0
Ca (mg/L)52.5 ± 0.360.1 ± 0.240.93 ± 0.0342.7 ± 0.475.0
Mg (mg/L)21.2 ± 0.513.6 ± 0.423.7 ± 0.314.0 ± 0.250.0
Al (mg/L)BDLBDLBDLBDL-
Fe (mg/L)BDLBDLBDLBDL-
DOC (mg/L)3.5 ± 0.34.3 ± 0.22.5 ± 0.25.0 ± 0.2-
BDL: Below detectable limit.
Table 3. Textural properties of BC at different calcination temperatures and residence times.
TResistance Time (h)SBET (m2/g)Vp (cm3/g)Dp (nm)
3501112.3 ± 0.30.26 ± 0.039.3 ± 0.3
2110.0 ± 0.40.29 ± 0.0610.7 ± 0.3
450198.6 ± 0.30.30 ± 0.0212.2 ± 0.6
283.2 ± 0.20.29 ± 0.0313.9 ± 0.1
550169.6 ± 0.20.23 ± 0.0313.5 ± 0.2
254.8 ± 0.40.26 ± 0.0218.8 ± 0.3
65019.5 ± 0.30.06 ± 0.0326.7 ± 0.4
24.4 ± 0.30.04 ± 0.0239.9 ± 0.4
Table 4. Anion concentrations before and after adsorption on BC.
Water SourceDeionized WaterHina Water SampleWouro Dow 2 Water Sample
[X] (mg/L)RawTreatedRemarkRawTreatedRemarkRawTreatedRemark
F4.3 ± 0.21.74 ± 0.04Adsorbed3.0 ± 0.50.8 ± 0.1Adsorbed4.5 ± 0.20.9 ± 0.3adsorbed
ClBDL10.92 ± 0.03Released15.2 ± 0.423.93 ± 0.08Released14.4 ± 0.423.5 ± 0.2released
SO42−BDL11.8 ± 0.2Released9.2 ± 0.115.9 ± 0.2Released9.8 ± 0.216.08 ± 0.04released
NO2BDLBDL-1.23 ± 0.071.2 ± 0.2No change1.2 ± 0.21.2 ± 0.2No change
NO3BDLBDL-55.7 ± 0.255.6 ± 0.4No change57.6 ± 0.657.8 ± 0.2No change
PO43−BDL6.3 ± 0.2ReleasedBDLBDL-BDLBDL-
[X] = Concentration of X.
Table 5. Cation concentrations before and after adsorption on BC.
Water SourceHinaWouro Dow 2Remark
[X] (mg/L)Raw WaterTreated WaterRaw WaterTreated Water
K+2.04 ± 0.093.18 ± 0.11.39 ± 0.062.8 ± 0.2Released
Na+25.2 ± 0.139.4 ± 0.529.4 ± 0.245.3 ± 0.2Released
Ca2+52.5 ± 0.341.3 ± 0.249.93 ± 0.0336.2 ± 0.1Adsorbed
Mg2+21.2 ± 0.520.3 ± 0.223.7 ± 0.421.6 ± 0.3Adsorbed
Table 6. EDX of prepared BC (charring temperature 350° C, 1 h residence time).
ElementWeight %Weight % SigmaAtomic %
C12.030.6921.42
O35.550.7147.52
Na0.860.150.80
Mg0.730.140.64
P15.880.5010.96
Ca34.940.8618.65
Total100.00 100.00
Disclaimer/Publisher’s Note: The statements, opinions and data contained in all publications are solely those of the individual author(s) and contributor(s) and not of MDPI and/or the editor(s). MDPI and/or the editor(s) disclaim responsibility for any injury to people or property resulting from any ideas, methods, instructions or products referred to in the content.