Article

Integrated Geospatial and Analytical Hierarchy Process Approach for Assessing Sustainable Management of Groundwater Recharge Potential in Barind Tract

by
Md. Zahed Hossain
1,2,
Sajal Kumar Adhikary
2,
Hrithik Nath
2,3,
Abdulla Al Kafy
4,
Hamad Ahmed Altuwaijri
5 and
Muhammad Tauhidur Rahman
6,*
1
Department of Civil Engineering, Bangladesh University of Business and Technology (BUBT), Dhaka 1216, Bangladesh
2
Department of Civil Engineering, Khulna University Engineering & Technology (KUET), Khulna 9203, Bangladesh
3
Department of Civil Engineering, University of Creative Technology Chittagong (UCTC), Chattogram 4212, Bangladesh
4
Department of Geography & The Environment, The University of Texas at Austin, 1 University Station A3100, Austin, TX 78712, USA
5
Department of Geography, College of Humanities and Social Sciences, King Saud University, Riyadh 11451, Saudi Arabia
6
Geospatial Information Sciences Program, School of Economic, Political and Policy Sciences, University of Texas at Dallas, 800 Campbell Road, Richardson, TX 75080, USA
*
Author to whom correspondence should be addressed.
Water 2024, 16(20), 2918; https://doi.org/10.3390/w16202918
Submission received: 12 August 2024 / Revised: 16 September 2024 / Accepted: 11 October 2024 / Published: 14 October 2024

Abstract

:
Groundwater depletion in Bangladesh’s Barind tract poses significant challenges for sustainable water management. This study aims to delineate groundwater recharge potential zones in this region using an integrated geospatial and Analytical Hierarchy Process (AHP) approach. The methodology combines remote-sensing data with GIS analysis, considering seven factors influencing groundwater recharge: rainfall, soil type, geology, slope, lineament density, land use/land cover, and drainage density. The AHP method was employed to assess the variability of groundwater recharge potential within the 7586 km2 study area. Thematic maps of relevant factors were processed using ArcGIS software. Results indicate that 9.23% (700.22 km2), 47.68% (3617.13 km2), 37.12% (2816.13 km2), and 5.97% (452.70 km2) of the study area exhibit poor, moderate, good, and very good recharge potential, respectively. The annual recharge volume is estimated at 2554 × 106 m3/year, constituting 22.7% of the total precipitation volume (11,227 × 106 m3/year). Analysis of individual factors revealed that geology has the highest influence (33.57%) on recharge potential, followed by land use/land cover (17.74%), soil type (17.25%), and rainfall (12.25%). The consistency ratio of the pairwise comparison matrix was 0.0904, indicating acceptable reliability of the AHP results. The spatial distribution of recharge zones shows a concentration of poor recharge potential in areas with low rainfall (1200–1400 mm/year) and high slope (6–40%). Conversely, very good recharge potential is associated with high rainfall zones (1800–2200 mm/year) and areas with favorable geology (sedimentary deposits). This study provides a quantitative framework for assessing groundwater recharge potential in the Barind tract. The resulting maps and data offer valuable insights for policymakers and water resource managers to develop targeted groundwater management strategies. These findings have significant implications for sustainable water resource management in the region, particularly in addressing challenges related to agricultural water demand and climate change adaptation.

1. Introduction

The global need for freshwater has increased about six times over the past hundred years [1]. Population growth, urbanization, agriculture, economy, industry, etc., are some of the major causes of increasing water demand. The two primary sources of freshwater are surface water and groundwater (GW). Growth in the global population causes unplanned urbanization, declining surface- and GW quality, and rising GW demand [2]. According to the World Bank, global GW use was 261,534 m3 in the fiscal year 2020, compared to 299,054 m3 in the fiscal year 2019 [3]. GW is a vital resource, essential for drinking, agriculture, and industry, especially in (semi-)arid zones [4,5,6]. In addition to being an important source of fresh water, GW also has a positive impact on social development, economic prosperity, poverty reduction, food security, and gender equality. Globally, green space is being rapidly consumed by urban, industrial, and agricultural activities; this emphasizes the need for comprehensive GW management models that consider quantity and quality [7,8]. Freshwater is in short supply due to unchecked pollution and increased industrial activity, especially during the dry season. As a result, GW is a necessary substitute for a variety of purposes [9]. Due to surface water shortages, which are a major concern for industry and agriculture in South Asia, GW is essential [10,11].
A recent study on water demand estimates that GW in Bangladesh provides about 79% of the water needed for homes, farms, irrigation, industry, etc. [12]. Bangladesh is primarily dependent on GW for its industrial, agricultural, municipal, and residential water needs. The majority of developing nations worldwide rely heavily on GW; in Bangladesh and other developing nations, GW declination is particularly high. GW is declining at a rate of 0.1 to 0.5 m3/year. [13]. For instance, in the city of Dhaka, Bangladesh, the Dhaka Water Supply and Sewerage Authority (DWASA) provides piped water; presently, 68% of Dhaka’s water supply comes from GW [14]. In 2016–2017, the total cropping area, mainly reliant on GW, was 1.01 million acres [12]. Key crops include rice, wheat, and potatoes, with Boro rice irrigated during the dry season from January to June. Boro rice requires a lot of water to cultivate, and since it is grown during the dry season, GW supplies the majority of the water needed. Because of this excessive GW exploration, GW levels declined during the dry season at a worrying rate. In Bangladesh’s northwest, in Bangladesh’s Barind Tract (BT), the issues of GW declination and water scarcity are particularly serious [15]. One of Bangladesh’s best areas for rice production is the BT. This area experiences droughts on a regular basis. Prior to starting the Barind Integrated Area Development Project Phase-I, 13% of the district’s land was cultivable, and 117% of Naogaon, Chapai Nawabganj, and Rajshahi were under cultivation. [16]. Which is now 226% [17] and 93.52% [18]. The percentage of irrigation by surface- and GW was 9.40% and 90.60%, respectively, in this region [18]. Low infiltration due to less rainfall, thick top clay, reduced river water flow, and the over-exploration of GW results in continuous depletion of GW levels in the BT. To overcome the aforementioned problems, the development of a sustainable GW management framework is essential. The framework requires a policy to balance the withdrawal and recharge mechanisms of GW, which can be achieved by identifying GW potential zones. The current study is, therefore, an attempt to fill this gap by developing a framework for potential GW zoning in the BT of Bangladesh towards sustainable GW development and management.
Among the factors GW recharge potential (RP) depends on are stream order, slope, soil type (ST), soil texture, drainage density (DD), soil moisture, soil permeability, soil depth, tectonic fault locations, soil consistency, rainfall, stream power index (SPI), land use/land cover (LULC), etc., and the interaction among these factors [19,20,21,22,23,24,25,26,27]. Thematic maps of these factors are required to analyze and derive potential GW zones for a study area. In the past, spatial analysis using thematic maps was very time-consuming because of a lack of resources, advanced software facilities, and high-speed computers. Moreover, previous studies were mostly based on numerical computation and historical analysis. Currently, with the availability of advanced software facilities and high-speed computers, GW potential zones are delineated using remote sensing (RS) and geographical information system (GIS) [25,26,27]. The use of modern geospatial techniques like RS and GIS methods has advantages over traditional methods in regard to time, cost, labor, and efficiency.
Multi-Criteria Decision Analyses (MCDAs) have seen a tremendous amount of use over the last few decades. By developing new methods or improving the existing Multi-criteria Decision Method (MCDM), MCDA is contributing to several sectors of research or other types of study. Some of the most used MCDMs are Analytic Hierarchy Process (AHP), Multi-Attribute Utility Theory, multi-influencing factor approach, Case-based Reasoning, Fuzzy Set Theory, Weighted gray model, Simple Multi-Attribute Rating Technique, deep-learning model, ELECTRE, Data Envelopment Analysis, PROMETHEE, Goal Programming, and Simple Additive Weighting [26,28,29,30,31,32,33]. Among all of these techniques, GW RP analysis using AHP is very popular in the present day. But other methods are also used.
The AHP and multi-influencing factor (MIF) approaches have been widely used by researchers, respectively, for quantitative and qualitative analysis [26,28,29,30,31]. The AHP organizes perceptions and judgments into a framework that aids decision-making by considering multiple factors. The characteristics of AHP are quite different from other decision theories. The use of pair-wise comparisons, which are used both to compare the alternatives with regard to the various criteria and to estimate the weights of the criterion, is a key feature of the AHP technique [34]. In the AHP technique, questionnaires are used to generate the input data. The criteria are important for the successful weight of the alternatives. AHP is identified as a theory of measurement based on a pair-wise matrix that depends on expert opinions to derive a priority scale [35]. Like other MCDM, AHP also has its benefits and drawbacks, though it is one of the most popular methods of MCDM. Its ease of usage is one of its benefits. Its use of pair-wise comparisons can make it relatively simple for decision-makers to weigh coefficients and evaluate alternatives. Because of its hierarchical nature, it is scalable and can simply alter in size to fit decision-making challenges. Even if good pair-wise comparisons necessitate a large amount of data, they result in reliability [36]. The most difficult aspect of this prioritizing strategy is to set the interdependence between the criteria. The methods generate inconsistencies in evaluation among criteria, and ranking of the criteria generates inconsistencies. Moreover, due to its comparison nature for ranking, the addition of alternatives at the end of the procedure could lead the final ranks to flip or reverse. The AHP method can be used for recourse management, performance-type problems, political strategy, planning, resource management, public policy, corporate policy, and strategy. While AHP has limitations, such as sensitivity to expert judgments, they can be mitigated by keeping its consistency ratio within acceptable limits. Despite its drawbacks, the AHP method has the power to handle more critical problems than other MCDMs. For GW RP zoning and analysis, AHP is being used by many researchers [21,22,23,24,37,38,39,40]. There to assign scores, a scale developed by [28] is used. Previous studies for the selected study have used different methods to assess GW RP, but none used a combined AHP–GIS approach. This study’s novelty is applying AHP in combination with a GIS to delineate GW RP in the selected study area. This method is recognized as a more advanced and systematic approach, enabling a MCDM analysis that considers several factors, leading to a more accurate and reliable assessment of GW RP.
The current study encompasses several key objectives. Firstly, it aims to create thematic maps delineating GW’s recharge potential zone (RPZ). Another crucial aspect involves investigating the influence of individual factors on GW RP. Lastly, this study aims to quantify the total volume of recharge water.

2. Materials and Methods

2.1. Study Area Description

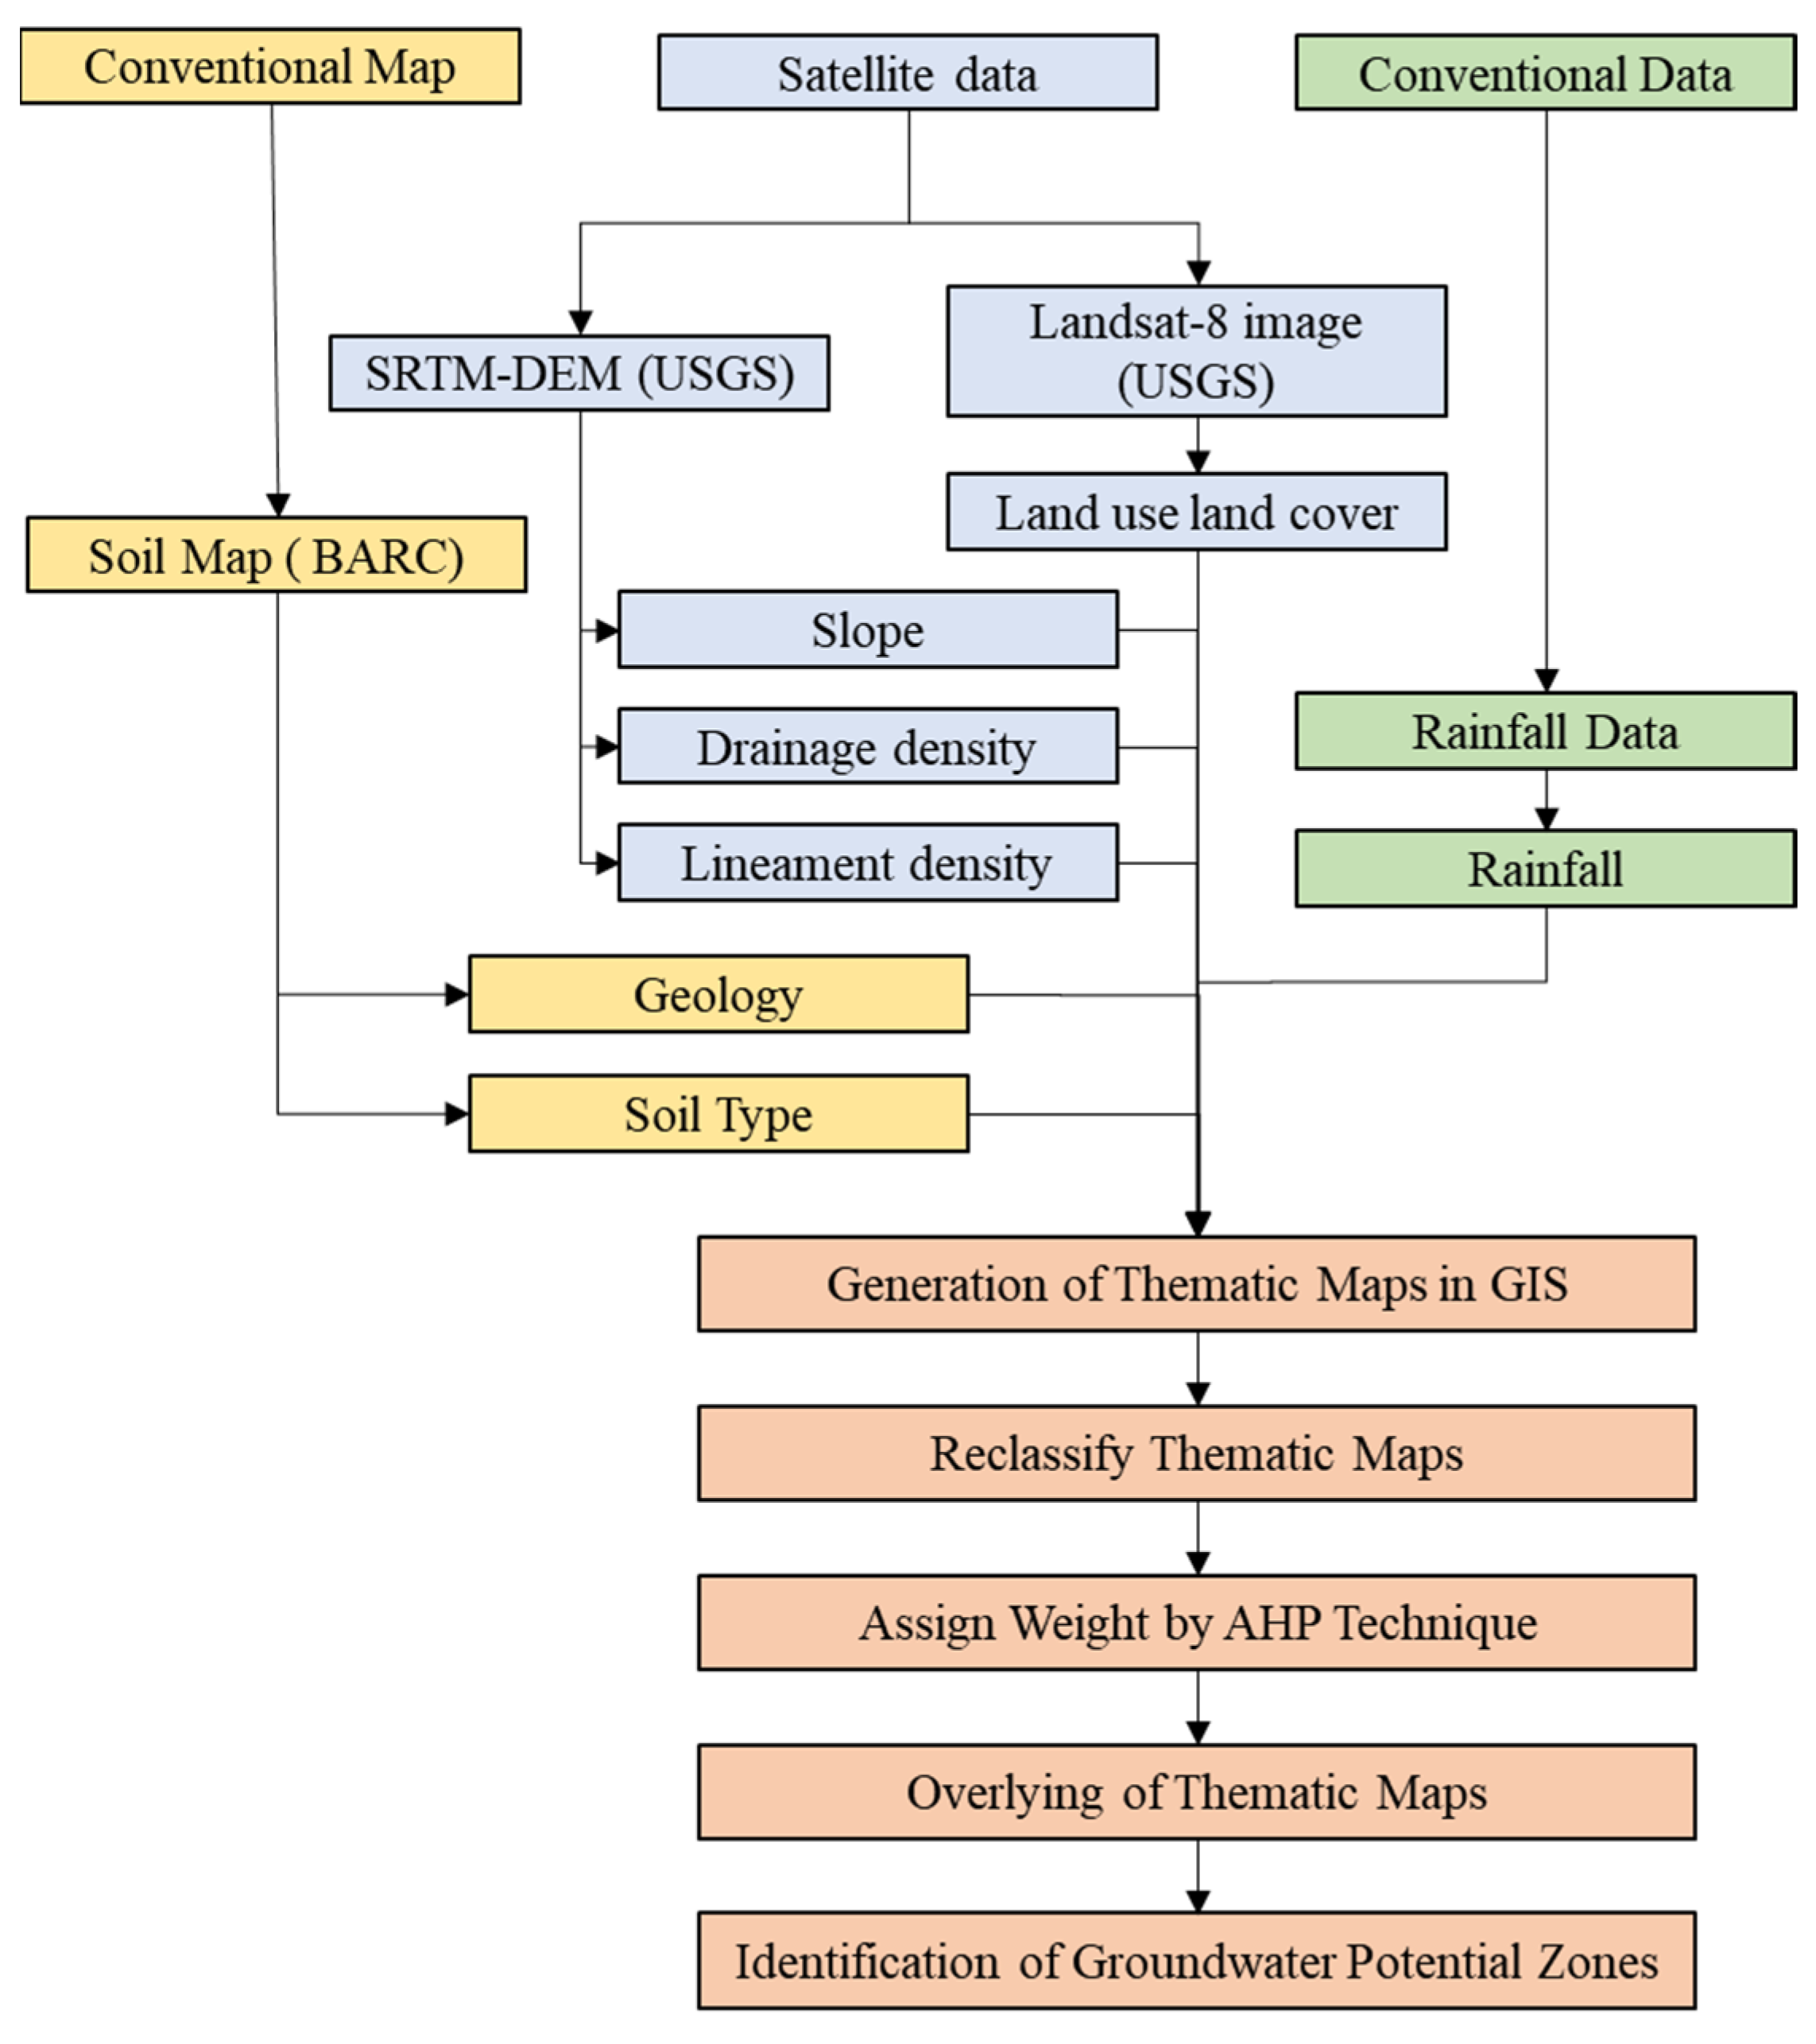
Three administrative districts, namely Naogaon, Chapai Nawabganj, and Rajshahi, located in the BT of Bangladesh, are selected for the current study. The study area location is illustrated in Figure 1. The study area is in the northwestern region of Bangladesh, which covers an area of 7586 km2. The geographical location of the area is between 24°07′ and 25°13′ north latitudes and between 87°55′ and 89°10′ east longitudes. The study region is bordered on three sides by West Bengal, and some areas on the south and east are encircled by two important rivers, the Brahmaputra and the Ganges. The study area’s annual average rainfall ranges from 1380 mm to 1560 mm, with a mean of 1480 mm. The monsoon season (May to September) accounts for 80% of all precipitation. During the dry season (January to June), GW has a maximum depth of 4 m to 15 m [15]. On the other hand, GW reaches its minimum depth at the end of the monsoon season (i.e., October) due to rain and floods, and the difference between the minimum depths in the GW table is generally between 2 and 10 m [41]. The majority of the study area experiences frequent GW droughts [15]. The weather is warm and muggy there. The lowest temperature is between 10 and 20 degrees Celsius, and the maximum temperature is between 25 and 35 degrees Celsius [42]. The study encompasses a large portion of the Barind Irrigation Project. Rice is the project’s principal crop, making up a sizable amount of all agriculture. Other crops farmed in this region are sugarcane, wheat, potato, jute, and vegetables. The variants of Rice are Aman, Aus, and Boro. Boro rice is farmed in the dry season (January to June), which makes up the majority of the rice produced in the research area. GW irrigates the majority of the study area’s water demand during the dry season. This study adopted geospatial techniques such as GIS and RS for GW potential zone determination with the integration of GIS and RS data for the BT of Bangladesh. This methodology is well-recognized by various researchers [21,23,29,43]. A methodological flowchart of this study is presented in Figure 2. Major steps in the methodology are data collection and preparation of thematic maps, weight assignments based on AHP, and overlying operation.

2.2. Preparation of Input Database

This study considered seven GW-recharge-impacting factors: rainfall, slope, LD, DD, land use land cover (LULC), ST, and geology. Data were gathered from a variety of secondary sources, including open-source databases and various government organizations, and based on remotely sensed data. The selection of only seven GW recharge factors out of so many was for various reasons, such as the availability of data, influence of the factor in the study area, variation of different classes for these factors, etc. An overview of the data source in format is provided in Table 1. The time scale of different data was between 2018 and 2022. ArcGIS v10.5 was used for data extraction, analysis, and the derivation of thematic layers for factors such as slope, LD, DD, LULC, geology ST, and rainfall data. Various procedures in ArcGIS were employed for deriving thematic maps. For example, the rainfall map was created from point data using the Inverse Distance Weighted (IDW) interpolation method. The raster distribution of rainfall was obtained by interpolating the point data, which was then clipped and reclassified for the study area.
SRTM data were utilized to derive three factors for GW potential: slope, LD, and DD. The slope map was obtained using the DEM map and the slope function in the ArcGIS software, taking into account the fastest possible rate of change in the DEM elevation value between a cell and its nearby cells. The derivation of LD map from DEM involved hillshade spatial analysis, the creation of a new shapefile, and the use of the line density function. The DD map was derived through a series of steps, including filling the DEM, flow-direction determination, flow accumulation, conditional functions, analysis of stream order, stream to feature conversion, and reclassification. The LULC map was derived from Landsat 8 satellite imagery using supervised classification, identifying agriculture, forest land, bare land, and water body portions. The geology and ST map, obtained from Bangladesh Agricultural Research Council (BARC) in vector format, was converted to a raster image using the function vector to raster, followed by clipping for the study area. The significance of various factors in relation to GW potential was taken into consideration when determining GW RPZ using the classified maps that emerged from these processes.

2.3. Analytical Hierarchical Process (AHP)

The AHP organizes perceptions and judgments into a framework that aids decision-making by considering multiple factors. Implementation of AHP for GW potential zone determination, needs to follow four major steps. They are (1) GW-RP-influencing factor selection, (2) development of pair-wise comparison matrix (PWCM), (3) estimation of weight in relation to the factors, and, finally, (4) consideration for consistency of the PWCM.

2.3.1. GW-RP-Influencing Factor Selection

At the beginning of AHP, the factors that influence GW potential were given a score. The score was based on [28,44], a linear scale of 1 to 9. In Saaty’s linear scale, 1 denotes equal importance, 9 denotes extremely more important, and 1/9 denotes extremely less important. Each score’s significance is listed in Table 2.

2.3.2. Development of PWCM

Using the AHP technique, geographic data (input) is combined and transformed into a decision (output), and Saaty’s scale is utilized to translate qualitative information from specific thematic layers and features into quantitative scores. Then, based on these scores, a pair-wise matrix is constructed founded on Saaty’s scale (Table 2) [44]. In a pair-wise comparison, a factor is compared with itself score is given as 1. The actual Saaty’s scores, or the reciprocal of the Saaty’s scores when a more influential parameter is compared to a less influential parameter, fill the remaining rows when a more influential parameter is compared to a less influential parameter. The PWCM using the GW-influencing factor in this study is illustrated in Table 3.

2.3.3. Estimation of Weight Relevant to the Factors

By evaluating each factor’s relative importance in relation to other factors, experts’ judgment and a literature review were used to determine the weight of each component in the AHP [19,20,21,22,23,24,25,26,27,45,46,47,48,49,50]. In AHP-based PWCM analysis, the eigenvalue is crucial for computing the consistency index, which is then used to calculate the CR. This ratio is used as a safeguard to make sure the comparisons based on expert judgment and literature review are trustworthy. Similar to the one in Table 3, the PWCM also takes into account the conditions unique to the study area as well as prior research. The accuracy of AHP analysis depends on keeping the consistency index below 0.1, even though factors differ between regions [21,22,23,26,37,39,47,51,52]. After that, the value of each factor was divided by the total value of the corresponding column to create the normalized pair-wise matrix. (Table 4). Equation (1) can be written as follows:
X i j = C i j L j
Here, the sum of the values in each column of the PWCM (Table 3) are denoted by Lj, and the value assigned to each factor at the ith row and jth column is denoted by Cij. By adding the values in each row, the weight gained by each factor was calculated.
Then, the classification of the constraints and the percentage of effect of the factors are then ascertained with the aid of eigenvalue factors and eigenvalue computations (Table 5). The eigenvalue factor was computed by dividing the column elements by the column sum from Table 4. The relative weights of each parameter were quantified by averaging across the rows to obtain the principal eigenvector ( λ m a x ) [28,31,53,54,55]. The major eigenvalue for the 7 × 7 matrix was discovered to be 7.716 and is listed in Table 5.

2.3.4. Consideration for Consistency of the PWCM

The consistency of the PWCM has been checked using the consistency ratio. The consistency ratio of the PWCM is calculated using Equations (2) and (3):
C o n s i s t e n c y   I n d e x C I = P r i n c i p l e   E i g e n   V a l u e n u b e r   o f   f a c t o r n u m b e r   o f   f a c t o r 1 = λ m a x n n 1
C o n s i s t e n c y   R a t i o C R = C o n s i s t e n c y   I n d e x R a n d o m n e s s   I n d e x = C I R I
The randomness index is tabulated in Table 6. A perfect comparison pair-wise matrix has a consistency index of 0, but a small inconsistency is in the tolerable limit CI < 0.1 [28]. In this study, the consistency is 0.0904.

2.4. Overlay Operation

The factors are overlayed once the classified spatial distribution map of the variables affecting GW potential has been created. The GW potential zone derivation is produced by ArcGIS software using weighted overlay analysis tools. The weighted score achieved by AHP is used to assign weight to the subgroup of the influencing factor. The corresponding equation used for GW RPZ derivation is Equation (4):
G r o u n d   W a t e r   R e c h a r g e   P o t e n t i a l = i = 1 n W i X i = R c R w + S c S w + G c G w + D D c D D w + L U L C c L U L C w + L D c L D w + S T c S T w
where Wi refers to the value of each factor of each pixel in the derived map, and Xi refers to the total AHP score (%). In other words, it is the weight of each cell value (e.g., rainfall or DEM value) in the map within the ArcGIS software. R refers to rainfall, S refers to slope, and G refers to geology. Moreover, subscript c refers to the criteria class, and D refers to the weight of each factor. This Equation refers to the result in the summation of cell value multiplied by the weightage assigned to the GW-influencing factors. The overlay operation’s schematic diagram is displayed in Figure 3.

2.5. Recharge Volume Estimation

Total recharge water volume estimation directly from the GW RPZ is not an easy task. But there is a simple method of estimating GW recharge volume presented in Equation (5) [31]:
T o t a l   R e c h a r g e   V o l u m e = A n n u a l   R a i n f a l l   V o l u m e × ( R e c h a r g e   R a t i o × %   o f   T o t a l   A r e a )
Here, the recharge ratio can be found from the FAO (1967) study (Table 7) [29], % of the total area represents the portion of total area covered by each category of GW RP, and the summation is carried out for each of the GW RP category.

3. Results

3.1. GW-Recharge-Governing Factor Evaluation

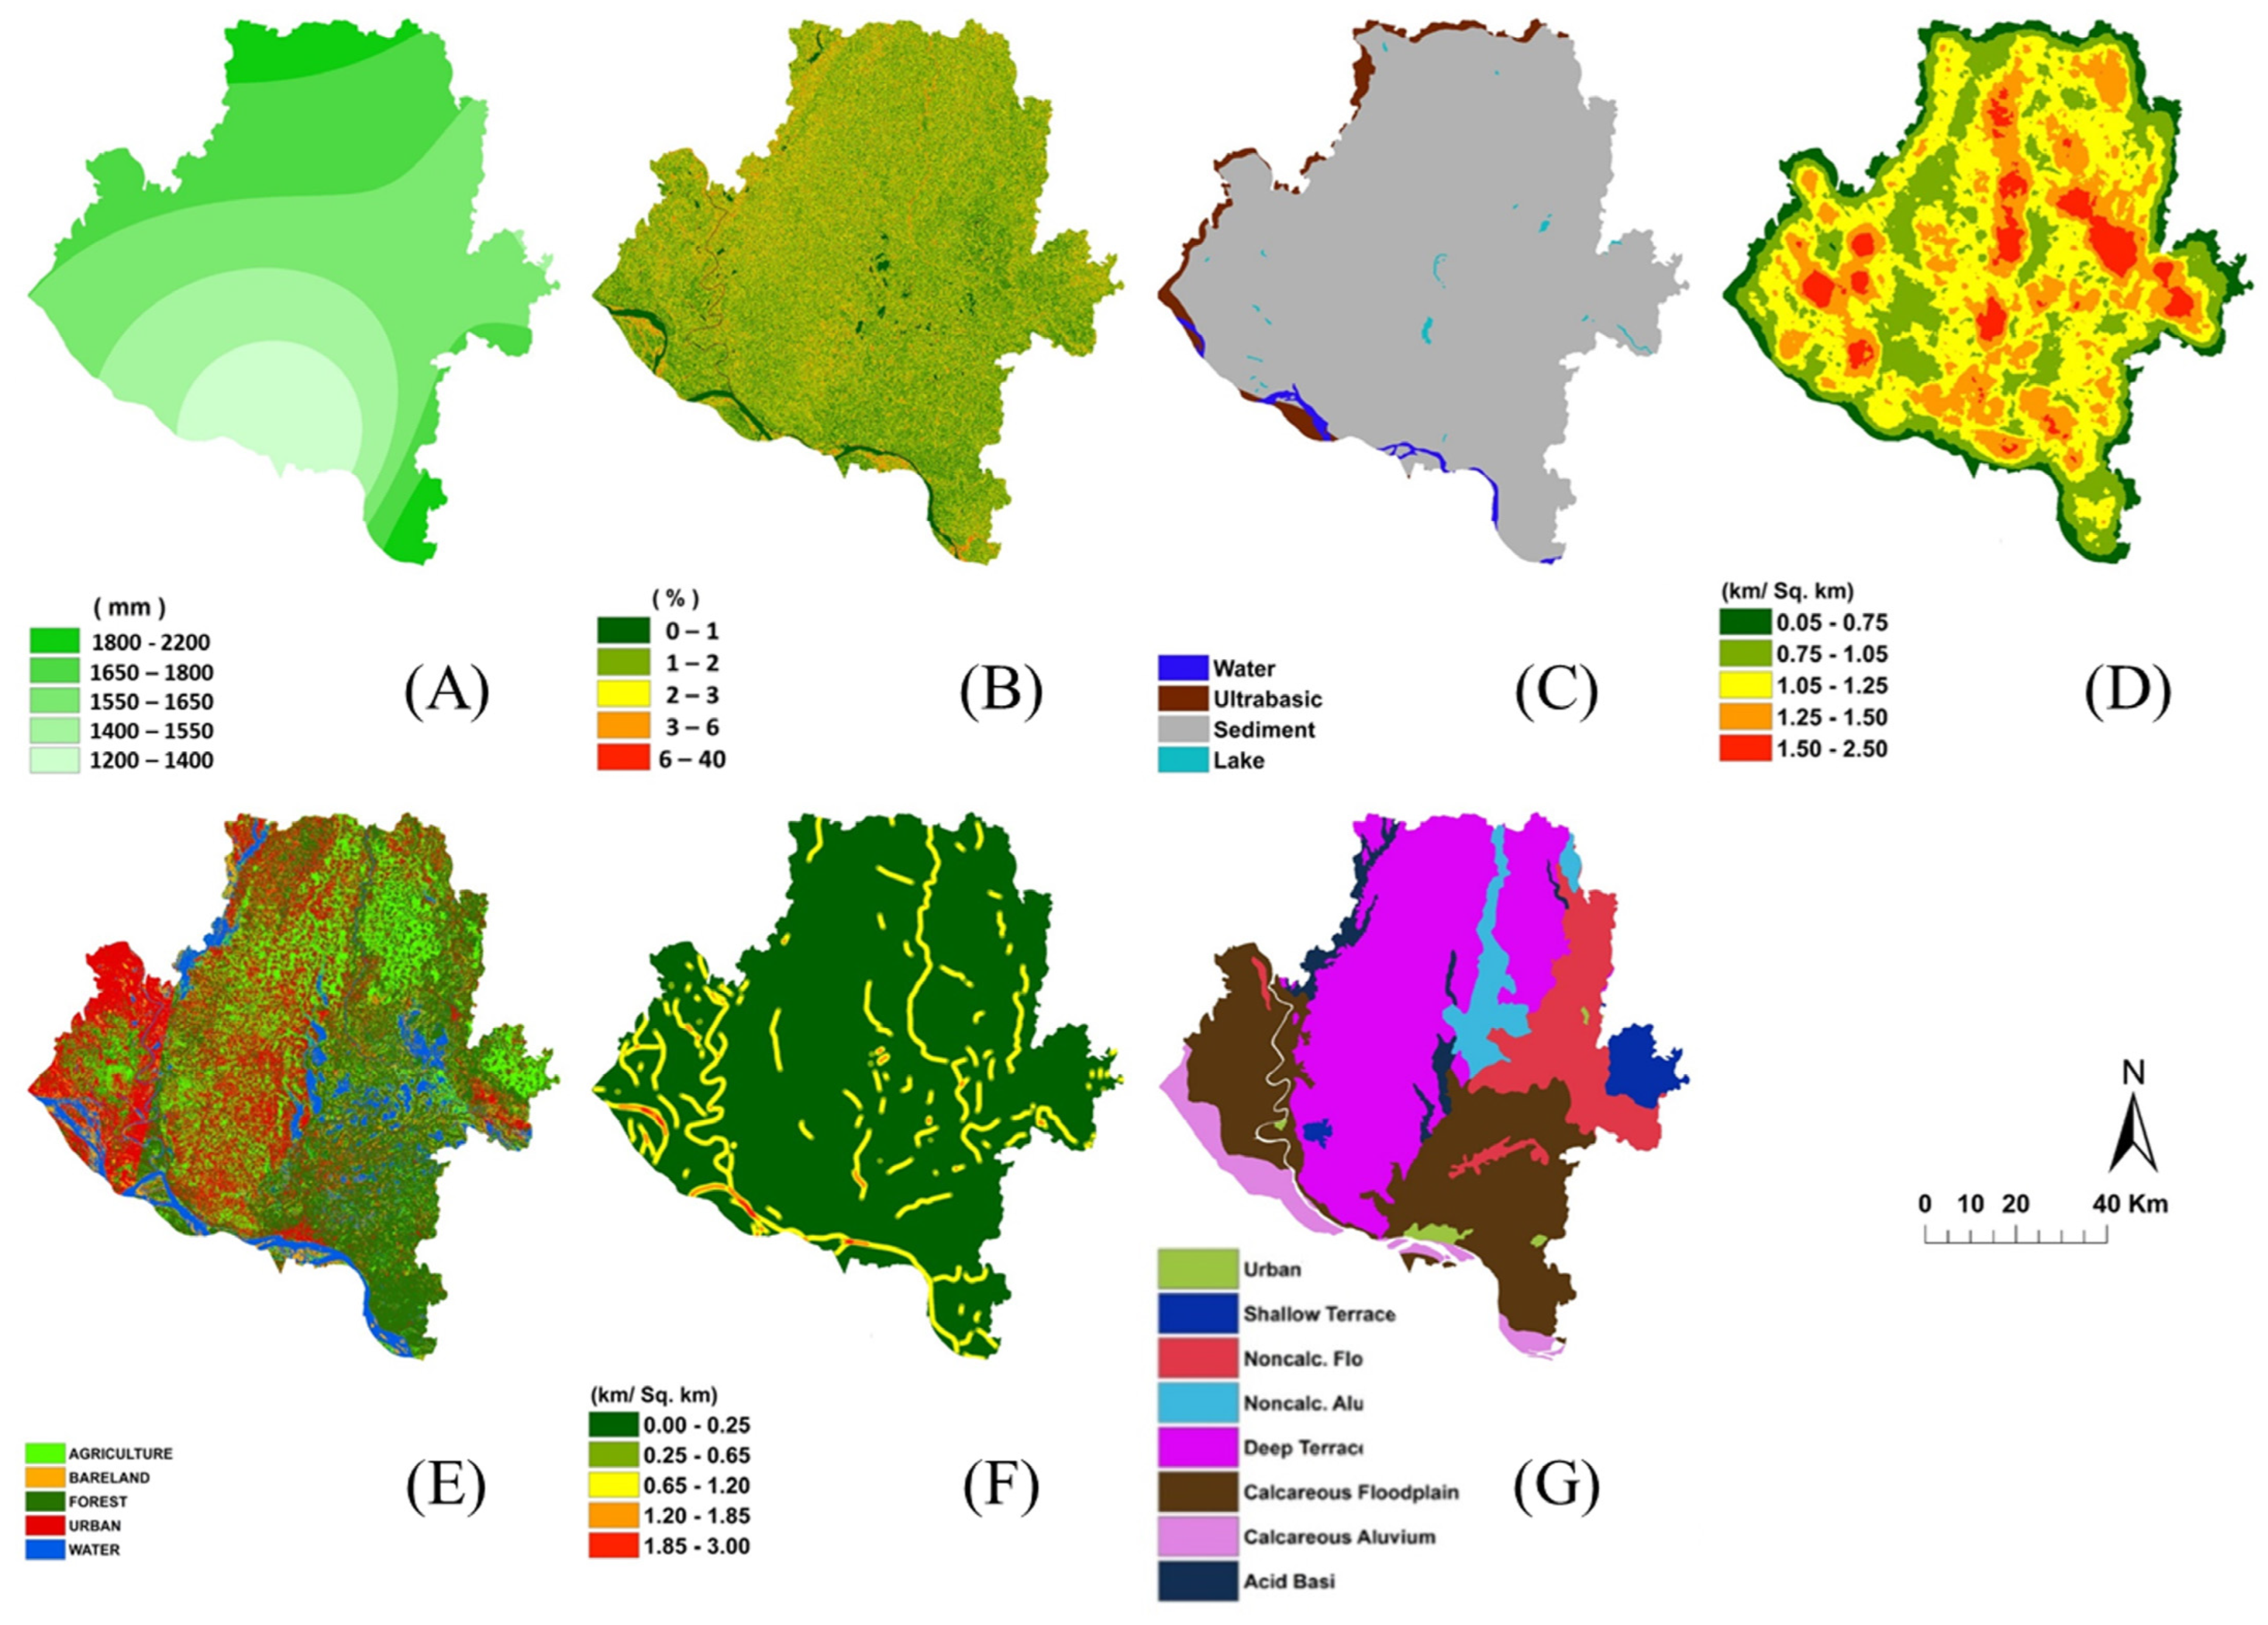
The current study refers to examining several hydrological, geographical, and geological factors influencing GW RP for the BT of Bangladesh to identify GW water RPZs. The investigation identified the seven significant factors impacting GW recharge capacity: rainfall, geology, slope, DD, LULC, LD, and ST. The factors are analyzed, and an appropriate weight of influence is assigned for the AHP. The weight assigned to factors based on AHP is presented in Table 4 The individual scores for each GW-recharge-influencing factor are presented in Table 8. The next section presents a spatial analysis of the contributing factors. Here, the AHP value is used to calculate the total influence of each factor. Then, according to the feature class and the susceptibility to or influence of RP, the feature class was given an individual score. In ArcGIS, a weighted overlay operation means multiplying each score by the value in each cell of a class and then adding them all together.

3.2. Rainfall Features

One of the major factors influencing GW RP is rainfall. It indicates the availability of recharge water volume for infiltrating downward. Soil properties, surface conditions, and rainfall intensity impact infiltration rates, with greater rainfall intensity increasing infiltration [45,46,56,57,58,59]. The interconnection between these factors is crucial for GW recharge studies [60]. Both heavy rainfall and drought have significant impacts on GW potentiality [49,50,61,62,63,64]. The classified spatially distributed map of rainfall is presented in Figure 4A for the study area. The map of rainfall distribution is classified into five categories. The areas covered by feature classes of 1200 to 1400 mm, 1400 to 1550 mm, 1550 to 1650 mm, 1650 to 1800 mm, and 1800 to 2200 mm are 888.47 km2, 1334.20 km2, 2828.84 km2, 2011.80 km2, and 5222.63 km2, respectively, and the percentages of total area covered by each feature group are 11.71%, 17.59%, 37.29%, 26.52%, and 6.89%, respectively. Lower weightage was given to lower rainfall zones and vice versa. The total weight of rainfall is 12%. The individual score given is presented in Table 8. The classified distribution map derived using IDW shows that the lower region of the study area (Rajshahi region) has a low rainfall intensity, and the higher region has a high intensity.

3.3. Slope Features

Another important factor influencing the GW RP is the slope, which influences the infiltration intensity and water retention. When surface water flows through a sloping ground, increasing slope percentage increases the speed of flow; on the contrary, a flat slope takes more time to drain drops of water from the catchment. A steep slope means that rain or storms come faster, and, therefore, there is less time for the rain to enter and vice versa [25,65,66,67]. The classified spatially distributed slope map is presented in Figure 4B for the study area. The slope map derived using SRTM and DEM data is classified into five different categories. The area covered by feature classes of 0 to 1%, 1 to 2%, 2 to 3%, 3 to 6%, and 6 to 40% are 58.26 km2, 1034.50 km2, 1689.63 km2, 2998.83 km2, and 1804.48 km2, respectively, and the percentages of the total area covered by each feature group are 0.77%, 13.64%, 22.27%, 39.53%, and 23.79%, respectively. Higher weightage was given to the lower-slope zone and vice versa. The total weight of the slope is 5%. The individual score given is presented in Table 8.

3.4. Geology Features

Geology is also another significant GW-influencing factor. It provides information about the landforms. The geological feature can influence the movement of GW and the mode of occurrence. Different types of soil formation act differently with respect to GW potential [23,26,47,48,68]. The categorized map of geology is presented in Figure 4C for the study area. The study area map of geology has four categories of geological features. The areas covered by the feature classes of ultrabasic igneous rock, sedimentation, water, and lake are 260.44 km2, 7191.26 km2, 92.69 km2, and 41.32 km2, respectively, and the percentages of the total area covered by each feature group are 3.43%, 94.80%, 1.22%, and 0.54%, respectively. Here, the sedimentation zone covers most of the study area, as BT is named. Lower weightage was given to ultrabasic igneous rock. On the contrary, higher weightage was given to the water and lake zones. The total weight of geology is 34%. The individual score given is presented in Table 8. Geology has a high-gain percentage of weightage. Here, it is considered the most potent factor among all the other GW-recharge-influencing factors.

3.5. Drainage Density Features

Another influencing factor for GW RP is DD. It is the measure of the mechanism of stream channel drainage. It influences infiltration capacity, surface roughness, vegetation cover, resistance to erosion, and climate conditions. To GW RP, DD gives an inversely proportional relationship. As it is a measure of how near the stream channels are located, more DD gives a pathway to drain water in a short time period. This directly affects the GW recharge, as GW recharge is a slow process, and a smaller time period gives lower infiltration [69,70,71]. The classified spatially distributed map of DD for the study area is presented in Figure 4D. The DD map is classified into five categories. The areas covered by feature classes of 0.05 to 0.75 km/km2, 0.75 to 1.05 km/km2, 1.05 to 1.25 km/km2, 1.25 to 1.50 km/km2, and 1.50 to 2.50 km/km2 are 692.60 km2, 1774.98 km2, 2895.50 km2, 1769.08 km2, and 453.68 km2, respectively, and the percentages of total area covered by each feature group are 9.13%, 23.40%, 38.17%, 23.32%, and 5.98%, respectively. Higher weightage was given to lower-density zones and vice versa. The total weight of DD is 6%. The individual score given is presented in Table 8.

3.6. LULC Features

Another dominating factor of GW RP is the LULC of the study area. Different types of land cover provide a different degree of preference for GW RP. The use of LULC in GW studies was initiated by US Geological Survey (USGS) in 1984. Different levels of land use change are common across different levels of renewable resources [21,22,37,72,73,74]. The categorized map of LULC is presented in Figure 4E for the study area. The study area map of LULC has five categories of land cover features. Landsat 8 satellite images are used to derived the study area land cover map. Supervised classification was conducted to derive five basic types of land cover. The areas covered by the types of Urban, Bare Land, Forest, Agriculture, and Water are 2016.61 km2, 656.93 km2, 2555.26 km2, 1632.88 km2, and 724.61 km2, respectively, and the percentages of the total study area covered by each feature group are 26.58%, 8.66%, 33.68%, 21.52%, and 9.55%, respectively. Here, supervised classification based on band images in the Landsat 8 satellite image forest land covers the most area percentage followed by Urban, Agriculture, Water, and Bare Land. Higher weightage was given to the water body because of the availability of water to infiltrate downward, and lower weightage was given to urban areas, as the runoff velocity was quite high. The total weight of LULC is 18%. The individual score given is presented in Table 8.

3.7. Lineament Density Features

Another GW-recharge-influencing factor is the LD. The LD network increases porosity, as it indicates the underlying geological features such as joints, faults, and fractures. Lineament mapping can be defined as the technique of drawing lines on images of maps. It behaves in a proportional way to GW recharge [75,76]. The classified spatially distributed LD map is presented in Figure 4F for the study area. The LD map derived using SRTM and DEM data is classified into five categories. The areas covered by the feature classes of 0 to 0.25 km/km2, 0.25 to 0.65 km/km2, 0.65 to 1.20 km/km2, 1.20 to 1.85 km/km2, and 1.85 to 3.00 km/km2 are 6505.85 km2, 388.50 km2, 631.98 km2, 51.24 km2 and 8.76 km2, respectively, and the percentages of the total area covered by each feature group are 85.76%, 5.12%, 8.33%, 0.68%, and 0.12%, respectively. Here, the feature class of 0 to 0.25 km/km2 covers a major portion of the total area. Higher weightage was given to higher LD zones, and vice versa. The total weight of LD is 8%. The individual score given is presented in Table 8.

3.8. Soil Type Features

The last GW-recharge-influencing factor considered for this study is the ST. Different types of STs act differently for the recharge of GW, as it controls properties such as infiltration capacity, structure, porosity, and consistency. Infiltration capacity is affected by soil stability, soil structure, land use type, and particle size distribution [77]. Changes in land use, from vegetation to continual grazing and tillage, affect the porosity, infiltration, water shortage, and water transport characteristics of soil [22,47,51,78]. The categorized map of geology is presented in Figure 4G for the study area. The study area map of soil has eight different types of soil, which are Acid Basin Clay, Urban, Shallow Terrace Soil, Calcareous Alluvium, Noncalcareous Alluvium, Calcareous Floodplain, Deep Terrace Soils, and Noncalcareous Floodplain. The areas covered by these feature classes are 232.43 km2, 56.77 km2, 233.29 km2, 409.81 km2, 438.07 km2, and 2325.15 km2, respectively, and the percentages of the total study area covered by each feature group are 3.06%, 0.75%, 3.08%, 5.40%, 5.77%, 30.65%, 38.56%, and 12.72%, respectively. The total weight of ST is 17%. Floodplain soils are given a higher weightage, and a lower weightage is given to Clayey-type soil. The individual score given is presented in Table 8.

3.9. Estimation of GW RP

3.9.1. AHP-Based GW RP

The GW RP of the study uses seven GW RP factors for AHP derived using Equation (6):
G r o u n d   W a t e r   R e c h a r g e   P o t e n t i a l = i = 1 n W i X i = R c × 0.13 + S c × 0.05 + G c × 0.34 + D D c × 0.6 + L U L C c × 0.18 + L D c 0.08 + S T c × 0.17
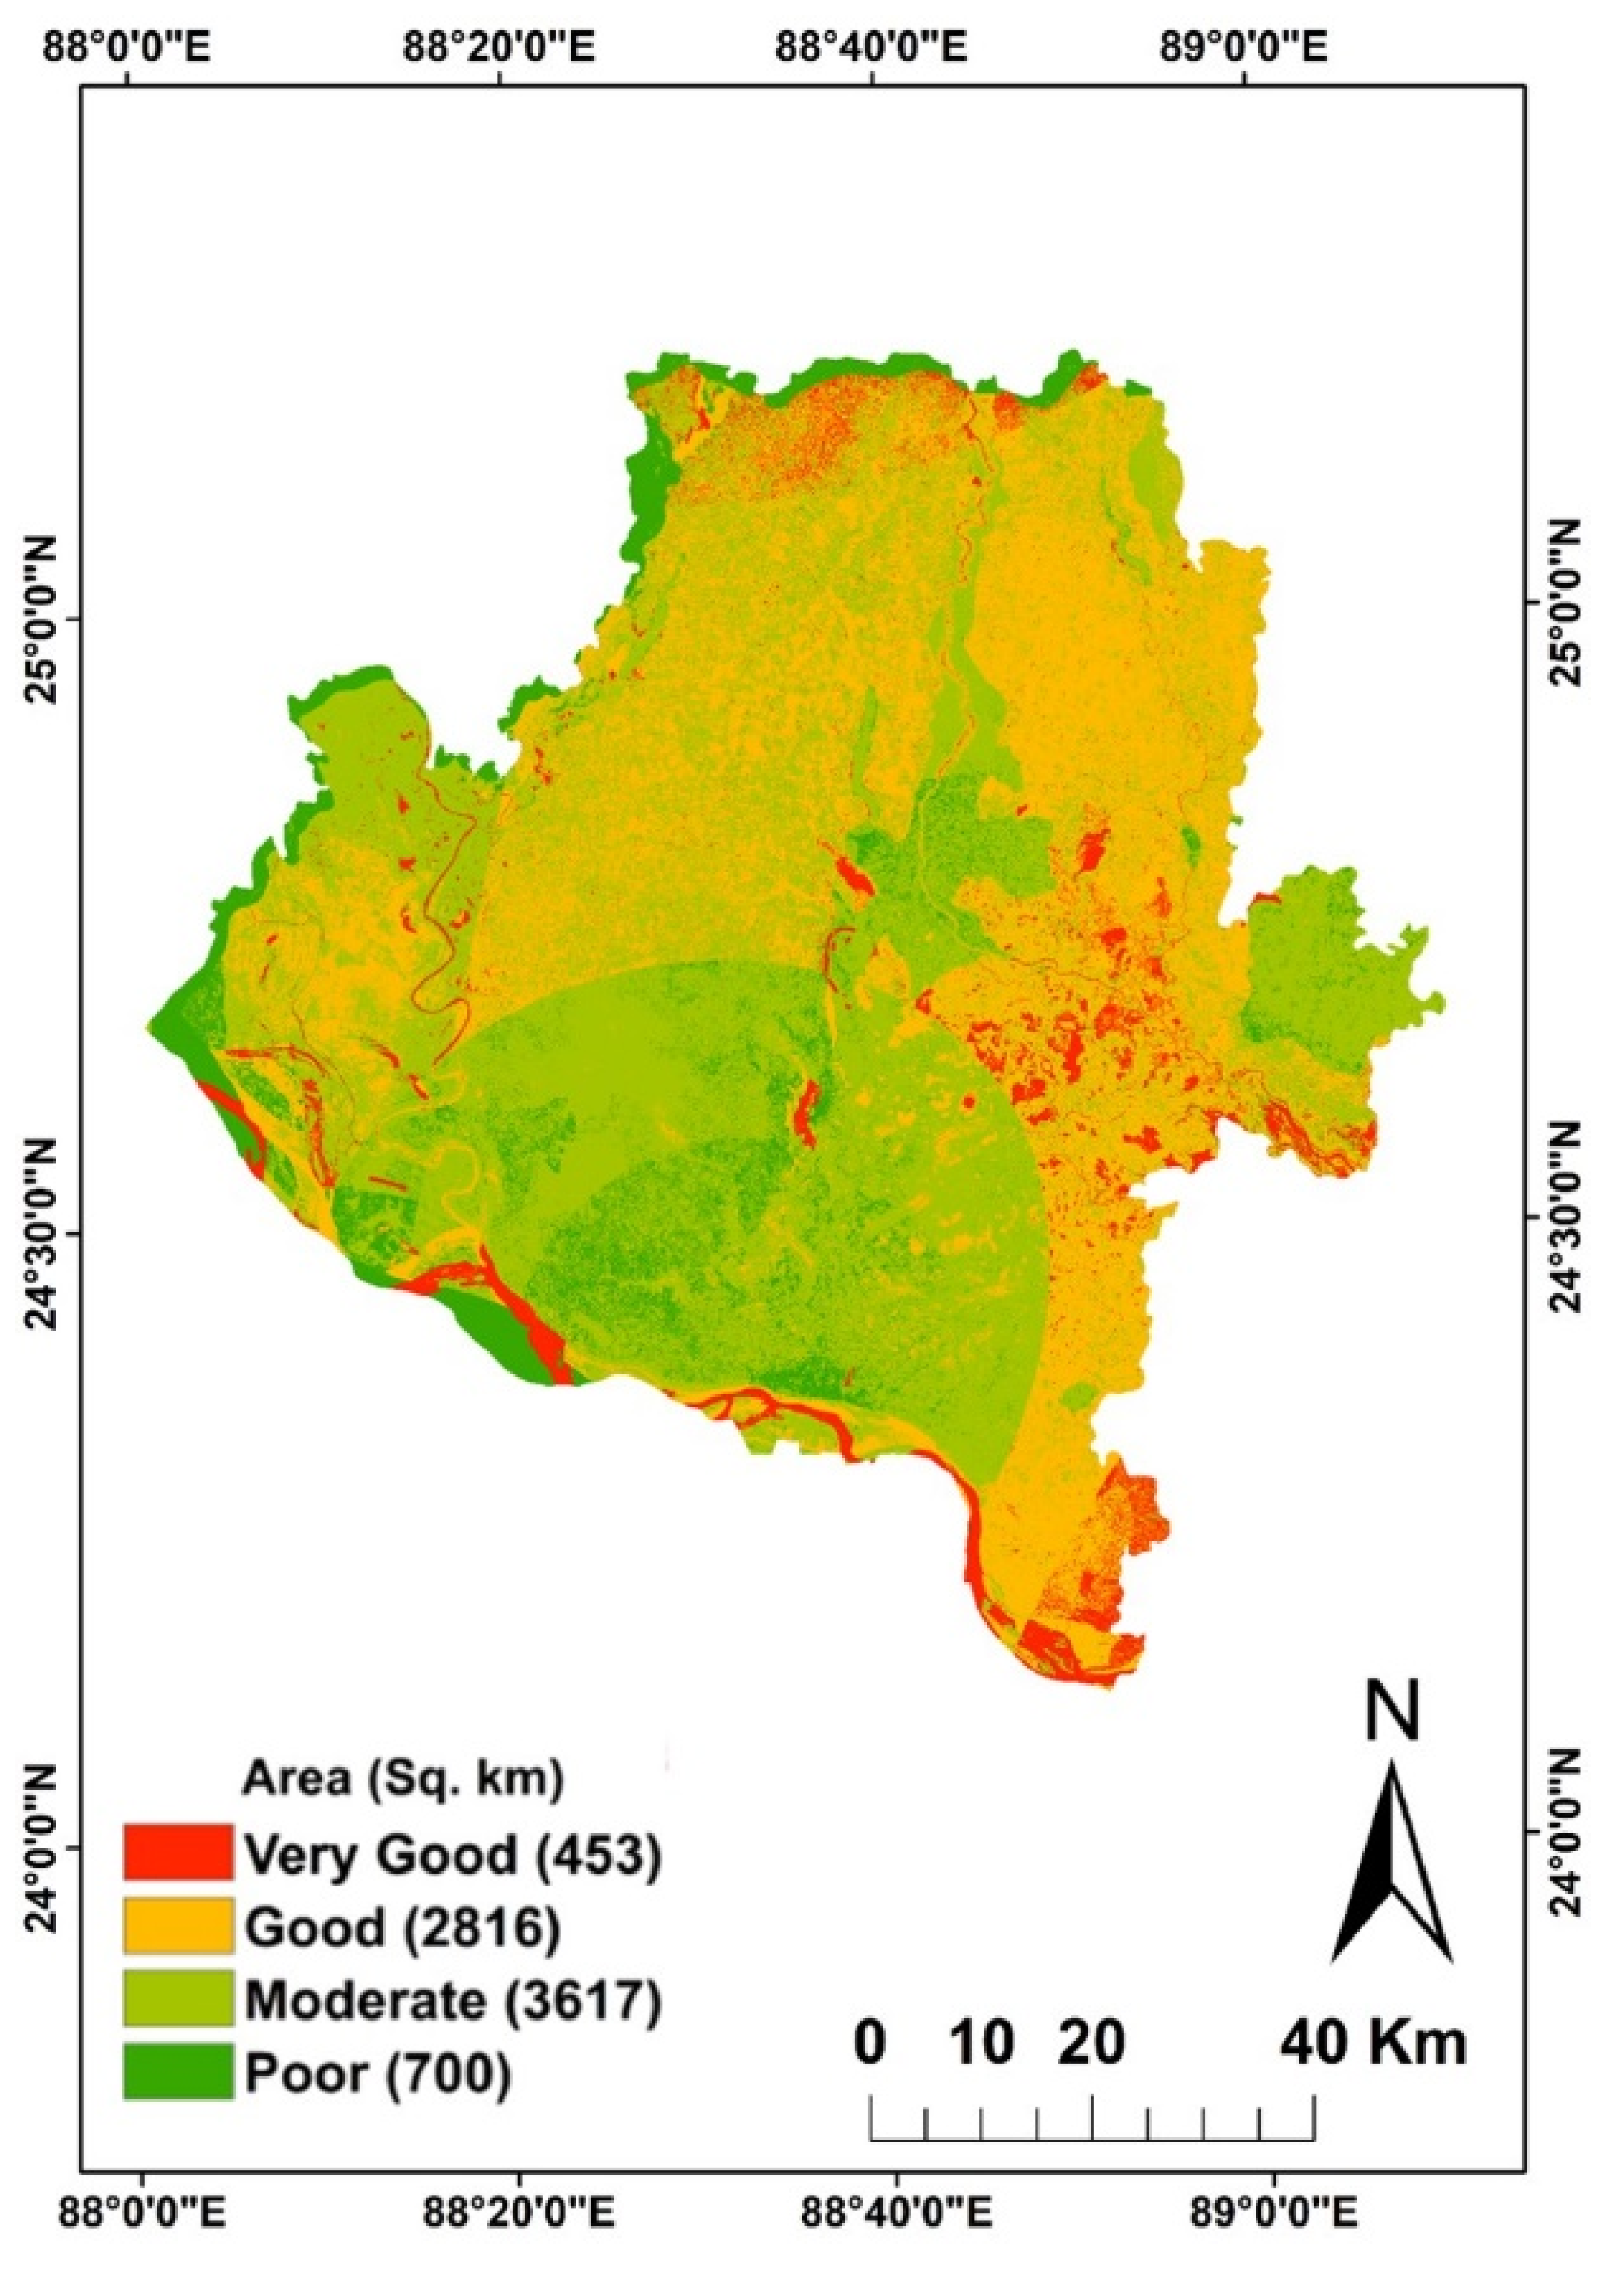
where Wi refers to the value of each factor of each pixel in the derived map, and Xi refers to the total AHP score (%). In other words, it is the weight of each cell value in the map within the ArcGIS software. R refers to rainfall, S refers to slope, and G refers to geology. Moreover, subscript c refers to the criteria class, and D refers to the weight of each factor. The GW RPZ map considering AHP is presented in Figure 5. The areal extent in km2 and percentage of the total study area of the GW potential based on AHP are tabulated in Table 9.
Table 9 shows that approximately 700 km2 of the research area falls inside zone-1, around 9.23% of the total study area. In the current study, identified zone-1 can be given as a “poor GW RPZ”. In the AHP approach, the GW potential map impacts the rainfall distribution map. As GW recharge potentiality is proportional to the rainfall intensity here, zone-1 covers the low-rainfall-intensity zone. This demonstrates that there is a shortage of GW recharge. Also, it covers a portion. It may be due to the speed of water in the river portion. The finer particles in the river bed cause infiltration at a lower rate.
Table 9 also shows that zone-2 covers approximately 3617.13 km2 of the total research area, around 47.68% of the total study area. This portion covers the major part of the research area. In the current study, the identification of zone-2 can be given as a “moderate GW RPZ”. This zone also has the effect of rainfall. The zone is located just upstream of the poor RPZ, as the rainfall intensity is higher in that zone in the region.
It can also be seen from Table 9 that approximately 2816.13 km2 of the total research area falls inside zone-3, which is around 37.12% of the total study area. It mostly covers the rainfall zone higher than zone-2. However, there is a mix of zone-2 and zone-3 in the GW potential map. These two zones exist near each other. Identification of zone-3 can be given as a “good GW RPZ”. The area covered by zone-2 is in the second largest position in this study area. Also, the zone is located in the shallow terrace ST and forest area in the land LULC map.
From Table 9, the last zone-4 covers approximately 452.70 km2, which covers around 5.97% of the total research area. It is the least-covered zone. The identification of zone-4 can be given as a “very good GW RPZ”. It has the best GW RP. The location of this zone is in the lowest part of the study area, which is also the lower part of the Padma River. The other part is also located basically near the water bodies. The rainfall intensity of this zone is also higher. It covers basically the floodplain zone.
The overall study region of GW RP based on AHP shows a reflection of rainfall intensity, though the highest-influencing factor is geology. However, as most of the geological portion of the research area is in the sediment zone, the effect of this factor is minimized. Though rainfall governs the overall RP, LULC also reflects its effect on the forest zone, supporting good GW RP.

3.9.2. Estimation of GW Recharge

The direct estimation of recharge volume is not quite an easy task. Quantitative GW recharge volume estimation into the study area potential zones subsurface is calculated using Equation (7). The annual precipitation volume of the study area is 11,227 × 106 m3/year. The total recharge volume of the study area is calculated for the AHP approach for the GW RP. The total volume of the GW RPZ is as follows:
W = 1227 × 106 (0.475 × 0.06 + 0.325 × 0.37 + 0.15 × 0.48 + 0.075 × 0.09 + 0.025 × 0)
= 2554 × 106 m3/year
where W refers to the total recharge volume, the estimates are used from Table 7, and the % of total area are obtained from Table 9. It is to be mentioned that the total recharge volume is about 22.7% of the total precipitated volume. The inferred PWCM categories were declared after extensive literature review, which are also validated by FAO’s guidlines [21,22,25,29,31].

4. Discussion

The current study aims to derive GW RP maps for the BT of Bangladesh. GIS, along with one of the most used methods of multi-criteria decision analysis, namely AHP, is used to derive the GW RP maps for the study region. Seven GW recharge-influencing maps, namely rainfall, geology, LD, DD, slope, ST, and LULC are used in the analysis purpose.
As a result of careful analysis, four different GW recharge zones were identified. These areas are classified according to pre-defined criteria that give an idea about the regional water quality. Notably, the study found that approximately 9.23% (700.22 km2) of this area exhibited low GW recharge capacity. Most of the area, 47.68% (3617.13 km2), was found to have temporary GW RP, while 37.12% of it (2816.13 km2) showed good GW RP. A small area, 5.97% (452.70 km2), is classified as having GW RP. These categories provide detailed information on GW RP in the Barind region, which is essential for effective water management.
Interestingly, rainfall intensity was found to be the dominant factor in GW increase, although it ranked fourth among the influencing factors. This deficiency highlights the difficulty of utilizing GW, where rainfall intensity has a significant impact but exceeds the list of considerations and other factors. For example, geology has reached a high level in terms of GW exchange. However, the dominance of vegetation areas, corresponding to 94.80% of the research area, reduces the importance of geology as a distinguishing factor in this area.
The results of this study show that the GW volume of Barind GW is approximately 2554 × 106 m3, that is, 22.7% of the total study area. This high-recharge rate demonstrates the region’s ability to replenish GW resources and is a valuable perspective on sustainable management and management planning. Estimates of GW recharge quality and quantity provide essential information for decision-makers and water managers. This study helps prioritize areas for GW development and environmental protection by identifying areas with different RP. Identification of potential areas not only leads to better GW management but also supports planning of agricultural activities, urban development, and environmental protection in the Barind region.
Additionally, research shows that although rainfall intensity has a significant impact on GW, its ranking does not fully reflect its importance. This discrepancy suggests that further research is needed to evaluate the RP of GW, excluding precipitation as a factor. This approach can provide additional information and confirm the prevalence of precipitation in real-world situations. Additionally, this study confirms that the seven factors considered (precipitation, geology, soil density, water density, slope, ST, and soil/land cover) may not cover all important factors. Other factors such as vegetation, soil temperature, and human activities may also play a role in GW recharge capacity. Future research should therefore include these additional factors to provide a better understanding of GW recharge dynamics.
When discussing GW RPZ, it is important to compare the results with similar studies to highlight both the similarities and unique aspects of the studies. For example, in a similar region of the Indian subcontinent, the Mithina Upwansi study identified five categories of GW RPZs: very low (4%), low (25%), medium (45%), high (18%), and very high (8%) [79]. This distribution reflects a gradient of recharge potential, with a significant portion of the area (45%) classified as medium, similar to the results of the present study, where 47.68% of the area is within the medium RPZ. Narongsak Kaewdum’s study in Thailand, which has geographical and climatic similarities with the study area, also classified GW RPZs as high, medium, low, and very low. Kewdam’s study found that about 2.26 percent of the total area had high recharge potential, while most of the precipitation was lost through surface runoff or evapotranspiration, suggesting that GW recharge would be problematic [80]. In comparison, the present study found that 5.97% of the region has very good recharge potential, while 37.12% falls under the good recharge category, suggesting that the region may have more favorable conditions for GW recharge compared to the Kew Dam study area. These differences in study results may be attributed to differences in regional characteristics such as geology, land use, and precipitation patterns, which directly affect GW recharge dynamics. The high percentage of moderate recharge zones in both Upwansi and the present study highlights the prevalence of conditions that moderately support GW recharge in these regions. However, the low percentage showing very good recharge potential in the present study compared to the high percentage of high and very high zones in the Upwansi study may indicate that while conditions are favorable for recharge, there are limitations in most of the region that prevent it from reaching its highest recharge potential. These comparisons highlight the importance of adapting GW management strategies to the specific conditions of each region. The results suggest that while there are significant areas with moderate to good replenishment potential in the study area of Bangladesh, targeted interventions may be required to improve replenishment in areas currently classified as poor or moderate. Understanding the factors that contribute to this classification can help develop more effective strategies for GW management and sustainable development, especially in areas with similar environmental challenges.
The analysis’s approach and findings are also valuable for academic research and learning. The combination of AHP and GIS serves as an example of how advanced tools can be applied in environmental management. It offers a blueprint that can be duplicated in other areas encountering comparable obstacles. Educational institutions have the opportunity to utilize this case to teach students about sustainable water management practices, the significance of GW replenishment, and the utilization of GIS and AHP in environmental studies.
This study provides a framework for assessing GW RP in the Barind region, highlighting the importance of multi-factor analysis and the role of different factors. Using AHP and GIS, it identifies key areas for sustainable GW management, helping decision-makers and water managers preserve resources and enhance water security. This study also supports environmental conservation, climate resilience, and agricultural productivity, eventually contributing socio-economic benefits. Engaging local communities and providing policymakers with detailed maps and data can lead to more effective land use planning and water management strategies.

5. Conclusions

This study’s integrated AHP–GIS approach for mapping groundwater recharge potential in Bangladesh’s Barind Tract yields significant insights for sustainable water management. By identifying four distinct recharge zones—poor (9.23%), moderate (47.68%), good (37.12%), and very good (5.97%)—we provide a nuanced understanding of the region’s groundwater dynamics. Our findings reveal that while geology exerts the strongest influence on recharge potential (33.57%), the interplay of factors such as land use, soil type, and rainfall create a complex hydrogeological landscape. The estimated annual recharge of 2554 × 106 m3, representing 22.7% of total precipitation, underscores both the region’s recharge capacity and the critical need for targeted conservation efforts. The spatial distribution of recharge zones offers valuable guidance for policymakers and water managers. Areas with very good recharge potential, though limited (5.97%), present prime opportunities for groundwater conservation and managed aquifer recharge initiatives. Conversely, the significant portion of land with moderate potential (47.68%) suggests a widespread scope for enhancing recharge through tailored land management practices.
While our methodology provides a robust framework for assessing recharge potential, we acknowledge its limitations. Future research should incorporate additional factors such as aquifer characteristics and human activities to refine the assessment further. Moreover, validating these findings through field studies and long-term monitoring would enhance their practical applicability. In addition, additional factors such as vegetation, soil temperature, and human activities should be incorporated to further improve the understanding of GW recharge dynamics. Considering alternative methods and excluding precipitation in certain analyses may provide greater insight into the dominant influences on RP. In addition to the findings and practical implications discussed, this study recognizes the potential to improve the scientific validity of AHP as a subjective task assessment method. Future research may consider incorporating advanced techniques such as fuzzy logic and machine learning or other methods to refine the AHP framework, which would address concerns regarding subjectivity and improve the reliability of GW RP assessment. Expanding the scope of research to include these factors will improve the accuracy of RP maps and provide more precise guidance for sustainable water resources management and policy-making in the Barind region.
This study offers a scientifically grounded approach to addressing water scarcity in the Barind Tract. By pinpointing areas of high recharge potential and identifying factors influencing groundwater replenishment, we provide a valuable tool for sustainable water resource planning. As climate change and growing water demand intensify pressure on groundwater resources, such data-driven approaches will be crucial in ensuring water security and supporting agricultural sustainability in vulnerable regions like the Barind Tract.

Author Contributions

M.Z.H.: conceptualization, methodology, project administration, resources, data preparation, validation, data analysis, writing—original draft, writing—review and editing, visualization. S.K.A.: conceptualization, methodology, investigation, project administration, supervision, resources, data preparation, validation, data analysis, writing—original draft, writing—review and editing. H.N.: supervision, validation, data analysis, writing—original draft, writing—review and editing, visualization. A.A.K.: project administration, supervision, resources, data preparation, validation, data analysis, writing—review and editing. H.A.A.: supervision, resources, data preparation, validation, data analysis, funding acquisition, writing—review and editing. M.T.R.: supervision, resources, validation, funding acquisition, writing—review and editing. All authors have read and agreed to the published version of the manuscript.

Funding

This research work was supported by King Saud University, Riyadh, Saudi Arabia under grant number RSPD2024R848.

Data Availability Statement

Data will be made available on request.

Acknowledgments

The authors extend their appreciation to the researchers supporting project number RSPD2024R848, King Saud University, Riyadh, Saudi Arabia.

Conflicts of Interest

The authors declare no conflicts of interest.

References

  1. UN. The United Nations World Water Development Report 2021: Valuing Water; United Nations: New York, NY, USA, 2021. [Google Scholar]
  2. Jha, M.K.; Shekhar, A.; Jenifer, M.A. Assessing groundwater quality for drinking water supply using hybrid fuzzy-GIS-based water quality index. Water Res. 2020, 179, 115867. [Google Scholar] [CrossRef] [PubMed]
  3. The World Bank. Annual Report; World Bank: Washington, DC, USA, 2021. [Google Scholar]
  4. Avtar, R.; Singh, C.K.; Shashtri, S.; Singh, A.; Mukherjee, S. Identification and analysis of groundwater potential zones in Ken–Betwa river linking area using remote sensing and geographic information system. Geocarto Int. 2010, 25, 379–396. [Google Scholar] [CrossRef]
  5. de Vries, J.J.; Simmers, I. Groundwater recharge: An overview of processes and challenges. Hydrogeol. J. 2002, 10, 5–17. [Google Scholar] [CrossRef]
  6. Allison, G.B. A Review of Some of the Physical, Chemical and Isotopic Techniques Available for Estimating Groundwater Recharge. In Estimation of Natural Groundwater Recharge; Simmers, I., Ed.; Springer: Dordrecht, The Netherlands, 1988; pp. 49–72. [Google Scholar]
  7. Mukherjee, A.; Scanlon, B.R.; Aureli, A.; Langan, S.; Guo, H.; McKenzie, A. Chapter 1—Global groundwater: From scarcity to security through sustainability and solutions. In Global Groundwater; Mukherjee, A., Scanlon, B.R., Aureli, A., Langan, S., Guo, H., McKenzie, A.A., Eds.; Elsevier: Amsterdam, The Netherlands, 2021; pp. 3–20. [Google Scholar]
  8. Lerner, D.N. Groundwater recharge in urban areas. Atmos. Environ. Part B Urban Atmos. 1990, 24, 29–33. [Google Scholar] [CrossRef]
  9. Makki, Z.F.; Zuhaira, A.A.; Al-Jubouri, S.M.; Al-Hamd, R.K.S.; Cunningham, L.S. GIS-based assessment of groundwater quality for drinking and irrigation purposes in central Iraq. Environ. Monit. Assess. 2021, 193, 107. [Google Scholar] [CrossRef]
  10. Michael, H.A.; Voss, C.I. Estimation of regional-scale groundwater flow properties in the Bengal Basin of India and Bangladesh. Hydrogeol. J. 2009, 17, 1329–1346. [Google Scholar] [CrossRef]
  11. Qureshi, A.S.; Ahmed, Z.; Krupnik, T.J. Groundwater Management in Bangladesh: An Analysis of Problems and Opportunities; United States Agency for International Development: Washington, DC, USA, 2014. [Google Scholar]
  12. BBS. Bangladesh Statistics 2017; Statistics and Informatics Division, Ministry of Planning, Bangladesh Bureau of Statistics (BBS): Dhaka, Bangladesh, 2017. [Google Scholar]
  13. Dey, N.C.; Saha, R.; Parvez, M.; Bala, S.K.; Islam, A.K.M.S.; Paul, J.K.; Hossain, M. Sustainability of groundwater use for irrigation of dry-season crops in northwest Bangladesh. Groundw. Sustain. Dev. 2017, 4, 66–77. [Google Scholar] [CrossRef]
  14. Dhaka Water Supply and Sewerage Authority. Establishment of Groundwater Monitoring System in Dhaka City for Aquifer Systems and DWASA Production Wells; Dhaka Water Supply and Sewerage Authority: Dhaka, Bangladesh, 2018. [Google Scholar]
  15. Adhikary, S.K.; Das, S.; Saha, G.; Chaki, T. Groundwater drought assessment for Barind irrigation Project in Northwestern Bangladesh. In Proceedings of the 20th International Congress on Modelling and Simulation (MODSIM2013), Adelaide, SA, Australia, 1–6 December 2013; Modelling and Simulation Society of Australia and New Zealand: Canberra, Australia, 2013; pp. 2917–2923. [Google Scholar]
  16. BMDA. Borandro Authority Past–Present; Barind Multipurpose Development Authority: Rajshahi, Bangladesh, 2006. [Google Scholar]
  17. BMDA. Annual Report: 2018–2019; BMDA: Rajshahi, Bangladesh, 2019. [Google Scholar]
  18. BADC. Minor Irrigation Servey Report 2018–2019; BADC: Dhaka, Bangladesh, 2020. [Google Scholar]
  19. Jha, M.K.; Chowdary, V.M.; Chowdhury, A. Groundwater assessment in Salboni Block, West Bengal (India) using remote sensing, geographical information system and multi-criteria decision analysis techniques. Hydrogeol. J. 2010, 18, 1713–1728. [Google Scholar] [CrossRef]
  20. Jha, M.K.; Chowdhury, A.; Chowdary, V.M.; Peiffer, S. Groundwater management and development by integrated remote sensing and geographic information systems: Prospects and constraints. Water Resour. Manag. 2007, 21, 427–467. [Google Scholar] [CrossRef]
  21. Saranya, T.; Saravanan, S. Groundwater potential zone mapping using analytical hierarchy process (AHP) and GIS for Kancheepuram District, Tamilnadu, India. Model. Earth Syst. Environ. 2020, 6, 1105–1122. [Google Scholar] [CrossRef]
  22. Ahmad, I.; Dar, M.A.; Andualem, T.G.; Teka, A.H. GIS-based multi-criteria evaluation of groundwater potential of the Beshilo River basin, Ethiopia. J. Afr. Earth Sci. 2020, 164, 103747. [Google Scholar] [CrossRef]
  23. Das, N.; Mukhopadhyay, S. Application of multi-criteria decision making technique for the assessment of groundwater potential zones: A study on Birbhum district, West Bengal, India. Environ. Dev. Sustain. 2020, 22, 931–955. [Google Scholar] [CrossRef]
  24. Rahmati, O.; Nazari Samani, A.; Mahdavi, M.; Pourghasemi, H.R.; Zeinivand, H. Groundwater potential mapping at Kurdistan region of Iran using analytic hierarchy process and GIS. Arab. J. Geosci. 2015, 8, 7059–7071. [Google Scholar] [CrossRef]
  25. Jahan, C.S.; Rahaman, M.F.; Arefin, R.; Ali, M.S.; Mazumder, Q.H. Delineation of groundwater potential zones of Atrai–Sib river basin in north-west Bangladesh using remote sensing and GIS techniques. Sustain. Water Resour. Manag. 2019, 5, 689–702. [Google Scholar] [CrossRef]
  26. Nithya, C.N.; Srinivas, Y.; Magesh, N.S.; Kaliraj, S. Assessment of groundwater potential zones in Chittar basin, Southern India using GIS based AHP technique. Remote Sens. Appl. Soc. Environ. 2019, 15, 100248. [Google Scholar] [CrossRef]
  27. Roy, S.; Hazra, S.; Chanda, A.; Das, S. Assessment of groundwater potential zones using multi-criteria decision-making technique: A micro-level case study from red and lateritic zone (RLZ) of West Bengal, India. Sustain. Water Resour. Manag. 2020, 6, 4. [Google Scholar] [CrossRef]
  28. Saaty, T.L. An exposition of the AHP in reply to the paper “remarks on the analytic hierarchy process”. Manag. Sci. 1990, 36, 259–268. [Google Scholar] [CrossRef]
  29. Adham, M.I.; Jahan, C.S.; Mazumder, Q.H.; Hossain, M.M.A.; Haque, A.-M. Study on groundwater recharge potentiality of Barind Tract, Rajshahi District, Bangladesh using GIS and Remote Sensing technique. J. Geol. Soc. India 2010, 75, 432–438. [Google Scholar] [CrossRef]
  30. Ahmed, A.; Alrajhi, A.; Alquwaizany, A. Identification of Groundwater Potential Recharge Zones in Flinders Ranges, South Australia Using Remote Sensing, GIS, and MIF Techniques. Water 2021, 13, 2571. [Google Scholar] [CrossRef]
  31. Zghibi, A.; Mirchi, A.; Msaddek, M.H.; Merzougui, A.; Zouhri, L.; Taupin, J.-D.; Chekirbane, A.; Chenini, I.; Tarhouni, J. Using analytical hierarchy process and multi-influencing factors to map groundwater recharge zones in a semi-arid Mediterranean coastal aquifer. Water 2020, 12, 2525. [Google Scholar] [CrossRef]
  32. Cui, X.; Wang, Z.; Xu, N.; Wu, J.; Yao, Z. A secondary modal decomposition ensemble deep learning model for groundwater level prediction using multi-data. Environ. Model. Softw. 2024, 175, 105969. [Google Scholar] [CrossRef]
  33. Song, Q.; Wang, Z.; Wu, T. Risk analysis and assessment of water resource carrying capacity based on weighted gray model with improved entropy weighting method in the central plains region of China. Ecol. Indic. 2024, 160, 111907. [Google Scholar] [CrossRef]
  34. Løken, E. Use of multicriteria decision analysis methods for energy planning problems. Renew. Sustain. Energy Rev. 2007, 11, 1584–1595. [Google Scholar] [CrossRef]
  35. Saaty, T.L. Decision making with the analytic hierarchy process. Int. J. Serv. Sci. 2008, 1, 83–98. [Google Scholar] [CrossRef]
  36. Velasquez, M.; Hester, P.T. An analysis of multi-criteria decision making methods. Int. J. Oper. Res. 2013, 10, 56–66. [Google Scholar]
  37. Jhariya, D.C.; Kumar, T.; Gobinath, M.; Diwan, P.; Kishore, N. Assessment of groundwater potential zone using remote sensing, GIS and multi criteria decision analysis techniques. J. Geol. Soc. India 2016, 88, 481–492. [Google Scholar] [CrossRef]
  38. Guth, P.L.; Van Niekerk, A.; Grohmann, C.H.; Muller, J.-P.; Hawker, L.; Florinsky, I.V.; Gesch, D.; Reuter, H.I.; Herrera-Cruz, V.; Riazanoff, S.; et al. Digital Elevation Models: Terminology and Definitions. Remote Sens. 2021, 13, 3581. [Google Scholar] [CrossRef]
  39. Januchowski, S.R.; Pressey, R.L.; VanDerWal, J.; Edwards, A. Characterizing errors in digital elevation models and estimating the financial costs of accuracy. Int. J. Geogr. Inf. Sci. 2010, 24, 1327–1347. [Google Scholar] [CrossRef]
  40. Mukherjee, S.; Joshi, P.K.; Mukherjee, S.; Ghosh, A.; Garg, R.D.; Mukhopadhyay, A. Evaluation of vertical accuracy of open source Digital Elevation Model (DEM). Int. J. Appl. Earth Obs. Geoinf. 2013, 21, 205–217. [Google Scholar] [CrossRef]
  41. Shamsudduha, M.; Taylor, R.G.; Ahmed, K.M.; Zahid, A. The impact of intensive groundwater abstraction on recharge to a shallow regional aquifer system: Evidence from Bangladesh. Hydrogeol. J. 2011, 19, 901–916. [Google Scholar] [CrossRef]
  42. Ferozur, R.M.; Jahan, C.S.; Arefin, R.; Mazumder, Q.H. Groundwater potentiality study in drought prone barind tract, NW Bangladesh using remote sensing and GIS. Groundw. Sustain. Dev. 2019, 8, 205–215. [Google Scholar] [CrossRef]
  43. Shaban, A.; Khawlie, M.; Abdallah, C. Use of remote sensing and GIS to determine recharge potential zones: The case of Occidental Lebanon. Hydrogeol. J. 2006, 14, 433–443. [Google Scholar] [CrossRef]
  44. Saaty, T.L. The analytic hierarchy process (AHP). J. Oper. Res. Soc. 1980, 41, 1073–1076. [Google Scholar]
  45. Li, F.; Zhang, G.; Xu, Y.J. Spatiotemporal variability of climate and streamflow in the Songhua River Basin, northeast China. J. Hydrol. 2014, 514, 53–64. [Google Scholar] [CrossRef]
  46. Xu, J.; Chen, Y.; Li, W.; Nie, Q.; Song, C.; Wei, C. Integrating wavelet analysis and BPANN to simulate the annual runoff with regional climate change: A case study of Yarkand River, Northwest China. Water Resour. Manag. 2014, 28, 2523–2537. [Google Scholar] [CrossRef]
  47. Arulbalaji, P.; Padmalal, D.; Sreelash, K. GIS and AHP techniques based delineation of groundwater potential zones: A case study from southern Western Ghats, India. Sci. Rep. 2019, 9, 1–17. [Google Scholar] [CrossRef] [PubMed]
  48. Thapa, R.; Gupta, S.; Guin, S.; Kaur, H. Assessment of groundwater potential zones using multi-influencing factor (MIF) and GIS: A case study from Birbhum district, West Bengal. Appl. Water Sci. 2017, 7, 4117–4131. [Google Scholar] [CrossRef]
  49. Iserloh, T.; Ries, J.; Cerdà, A.; Echeverría, M.; Fister, W.; Geißler, C.; Kuhn, N.; León, F.; Peters, P.; Schindewolf, M. Comparative measurements with seven rainfall simulators on uniform bare fallow land. Z. Geomorphol. 2012, 57, 11–26. [Google Scholar] [CrossRef]
  50. Huang, J.; Wu, P.; Zhao, X. Effects of rainfall intensity, underlying surface and slope gradient on soil infiltration under simulated rainfall experiments. Catena 2013, 104, 93–102. [Google Scholar] [CrossRef]
  51. Anuraga, T.S.; Ruiz, L.; Kumar, M.S.M.; Sekhar, M.; Leijnse, A. Estimating groundwater recharge using land use and soil data: A case study in South India. Agric. Water Manag. 2006, 84, 65–76. [Google Scholar] [CrossRef]
  52. Kaliraj, S.; Chandrasekar, N.; Magesh, N. Identification of potential groundwater recharge zones in Vaigai upper basin, Tamil Nadu, using GIS-based analytical hierarchical process (AHP) technique. Arab. J. Geosci. 2014, 7, 1385–1401. [Google Scholar] [CrossRef]
  53. Malczewski, J. GIS and Multicriteria Decision Analysis; John Wiley & Sons: Hoboken, NJ, USA, 1999. [Google Scholar]
  54. Yeh, H.-F.; Lee, C.-H.; Hsu, K.-C.; Chang, P.-H. GIS for the assessment of the groundwater recharge potential zone. Environ. Geol. 2009, 58, 185–195. [Google Scholar] [CrossRef]
  55. Bonilla Valverde, J.P.; Blank, C.; Roidt, M.; Schneider, L.; Stefan, C. Application of a GIS Multi-Criteria Decision Analysis for the Identification of Intrinsic Suitable Sites in Costa Rica for the Application of Managed Aquifer Recharge (MAR) through Spreading Methods. Water 2016, 8, 391. [Google Scholar] [CrossRef]
  56. Wang, H.; Yang, Z.; Saito, Y.; Liu, J.P.; Sun, X. Interannual and seasonal variation of the Huanghe (Yellow River) water discharge over the past 50 years: Connections to impacts from ENSO events and dams. Glob. Planet. Chang. 2006, 50, 212–225. [Google Scholar] [CrossRef]
  57. Nath, H.; Adhikary, S.K.; Nath, S.; Kafy, A.A.; Islam, A.R.M.T.; Alsulamy, S.; Khedher, K.M.; Shohan, A.A.A. Long-term trends and spatial variability in rainfall in the southeast region of Bangladesh: Implication for sustainable water resources management. Theor. Appl. Climatol. 2024, 155, 3693–3717. [Google Scholar] [CrossRef]
  58. Cristiano, E.; ten Veldhuis, M.-c.; Van De Giesen, N. Spatial and temporal variability of rainfall and their effects on hydrological response in urban areas—A review. Hydrol. Earth Syst. Sci. 2017, 21, 3859–3878. [Google Scholar] [CrossRef]
  59. Ogunbode, T.; Ifabiyi, P. Rainfall trends and its implications on water resources management: A case study of Ogbomoso city in Nigeria. Int. J. Hydrol. 2019, 3, 210–215. [Google Scholar] [CrossRef]
  60. Liu, H.; Lei, T.; Zhao, J.; Yuan, C.; Fan, Y.; Qu, L. Effects of rainfall intensity and antecedent soil water content on soil infiltrability under rainfall conditions using the run off-on-out method. J. Hydrol. 2011, 396, 24–32. [Google Scholar] [CrossRef]
  61. Hawke, R.; Price, A.; Bryan, R. The effect of initial soil water content and rainfall intensity on near-surface soil hydrologic conductivity: A laboratory investigation. Catena 2006, 65, 237–246. [Google Scholar] [CrossRef]
  62. Nath, H.; Rafizul, I.M. Spatial Variability of Metal Elements in Soils of a Waste Disposal Site in Khulna: A Geostatistical Study. In Advances in Civil Engineering, Proceedings of the 5th International Conference on Advances in Civil Engineering (ICACE), Chattogram, Bangladesh, 21–23 December 2020; Springer: Singapore, 2022; pp. 25–36. [Google Scholar]
  63. Yasrebi, J.; Saffari, M.; Fathi, H.; Karimian, N.; Emadi, M.; Baghernejad, M. Spatial variability of soil fertility properties for precision agriculture in Southern Iran. J. Appl. Sci. 2008, 8, 1642–1650. [Google Scholar] [CrossRef]
  64. Machiwal, D.; Jha, M.K. Characterizing rainfall–groundwater dynamics in a hard-rock aquifer system using time series, geographic information system and geostatistical modelling. Hydrol. Process. 2014, 28, 2824–2843. [Google Scholar] [CrossRef]
  65. Hammouri, N.; El-Naqa, A.; Barakat, M. An Integrated Approach to Groundwater Exploration Using Remote Sensing and Geographic Information System. J. Water Resour. Prot. 2012, 04, 717–724. [Google Scholar] [CrossRef]
  66. Naghibi, S.A.; Pourghasemi, H.R.; Dixon, B. GIS-based groundwater potential mapping using boosted regression tree, classification and regression tree, and random forest machine learning models in Iran. Environ. Monit. Assess. 2015, 188, 44. [Google Scholar] [CrossRef] [PubMed]
  67. Pirone, M.; Papa, R.; Nicotera, M.V.; Urciuoli, G. In situ monitoring of the groundwater field in an unsaturated pyroclastic slope for slope stability evaluation. Landslides 2015, 12, 259–276. [Google Scholar] [CrossRef]
  68. Nowreen, S.; Newton, I.H.; Zzaman, R.U.; Islam, A.; Islam, G.M.T.; Alam, M.S. Development of potential map for groundwater abstraction in the northwest region of Bangladesh using RS-GIS-based weighted overlay analysis and water-table-fluctuation technique. Environ. Monit. Assess. 2021, 193, 24. [Google Scholar] [CrossRef]
  69. Andualem, T.G.; Demeke, G.G. Groundwater potential assessment using GIS and remote sensing: A case study of Guna Tana landscape, Upper Blue Nile Basin, Ethiopia. J. Hydrol. Reg. Stud. 2019, 24, 100610. [Google Scholar] [CrossRef]
  70. Horton, R.E. Drainage-basin characteristics. Trans. Am. Geophys. Union 1932, 13, 350–361. [Google Scholar]
  71. Tucker, G.E.; Catani, F.; Rinaldo, A.; Bras, R.L. Statistical analysis of drainage density from digital terrain data. Geomorphology 2001, 36, 187–202. [Google Scholar] [CrossRef]
  72. Henderson-Sellers, A.; Wilson, M.F. Surface albedo data for climatic modeling. Rev. Geophys. 1983, 21, 1743–1778. [Google Scholar] [CrossRef]
  73. He, S.; Wu, J. Relationships of groundwater quality and associated health risks with land use/land cover patterns: A case study in a loess area, Northwest China. Hum. Ecol. Risk Assess. Int. J. 2019, 25, 354–373. [Google Scholar] [CrossRef]
  74. Irwin, E.G.; Geoghegan, J. Theory, data, methods: Developing spatially explicit economic models of land use change. Agric. Ecosyst. Environ. 2001, 85, 7–24. [Google Scholar] [CrossRef]
  75. Karcz, I. Rapid determination of lineament and joint densities. Tectonophysics 1978, 44, T29–T33. [Google Scholar] [CrossRef]
  76. Sander, P. Lineaments in groundwater exploration: A review of applications and limitations. Hydrogeol. J. 2007, 15, 71–74. [Google Scholar] [CrossRef]
  77. Fu, B.; Chen, L.; Ma, K.; Zhou, H.; Wang, J. The relationships between land use and soil conditions in the hilly area of the loess plateau in northern Shaanxi, China. CATENA 2000, 39, 69–78. [Google Scholar] [CrossRef]
  78. Broersma, K.; Robertson, J.A.; Chanasyk, D.S. Effects of different cropping systems on soil water properties of a Boralf soil. Commun. Soil Sci. Plant Anal. 1995, 26, 1795–1811. [Google Scholar] [CrossRef]
  79. Upwanshi, M.; Damry, K.; Pathak, D.; Tikle, S.; Das, S. Delineation of potential groundwater recharge zones using remote sensing, GIS, and AHP approaches. Urban Clim. 2023, 48, 101415. [Google Scholar] [CrossRef]
  80. Kaewdum, N.; Chotpantarat, S. Mapping potential zones for groundwater recharge using a GIS technique in the lower Khwae Hanuman Sub-Basin Area, Prachin Buri Province, Thailand. Front. Earth Sci. 2021, 9, 717313. [Google Scholar] [CrossRef]
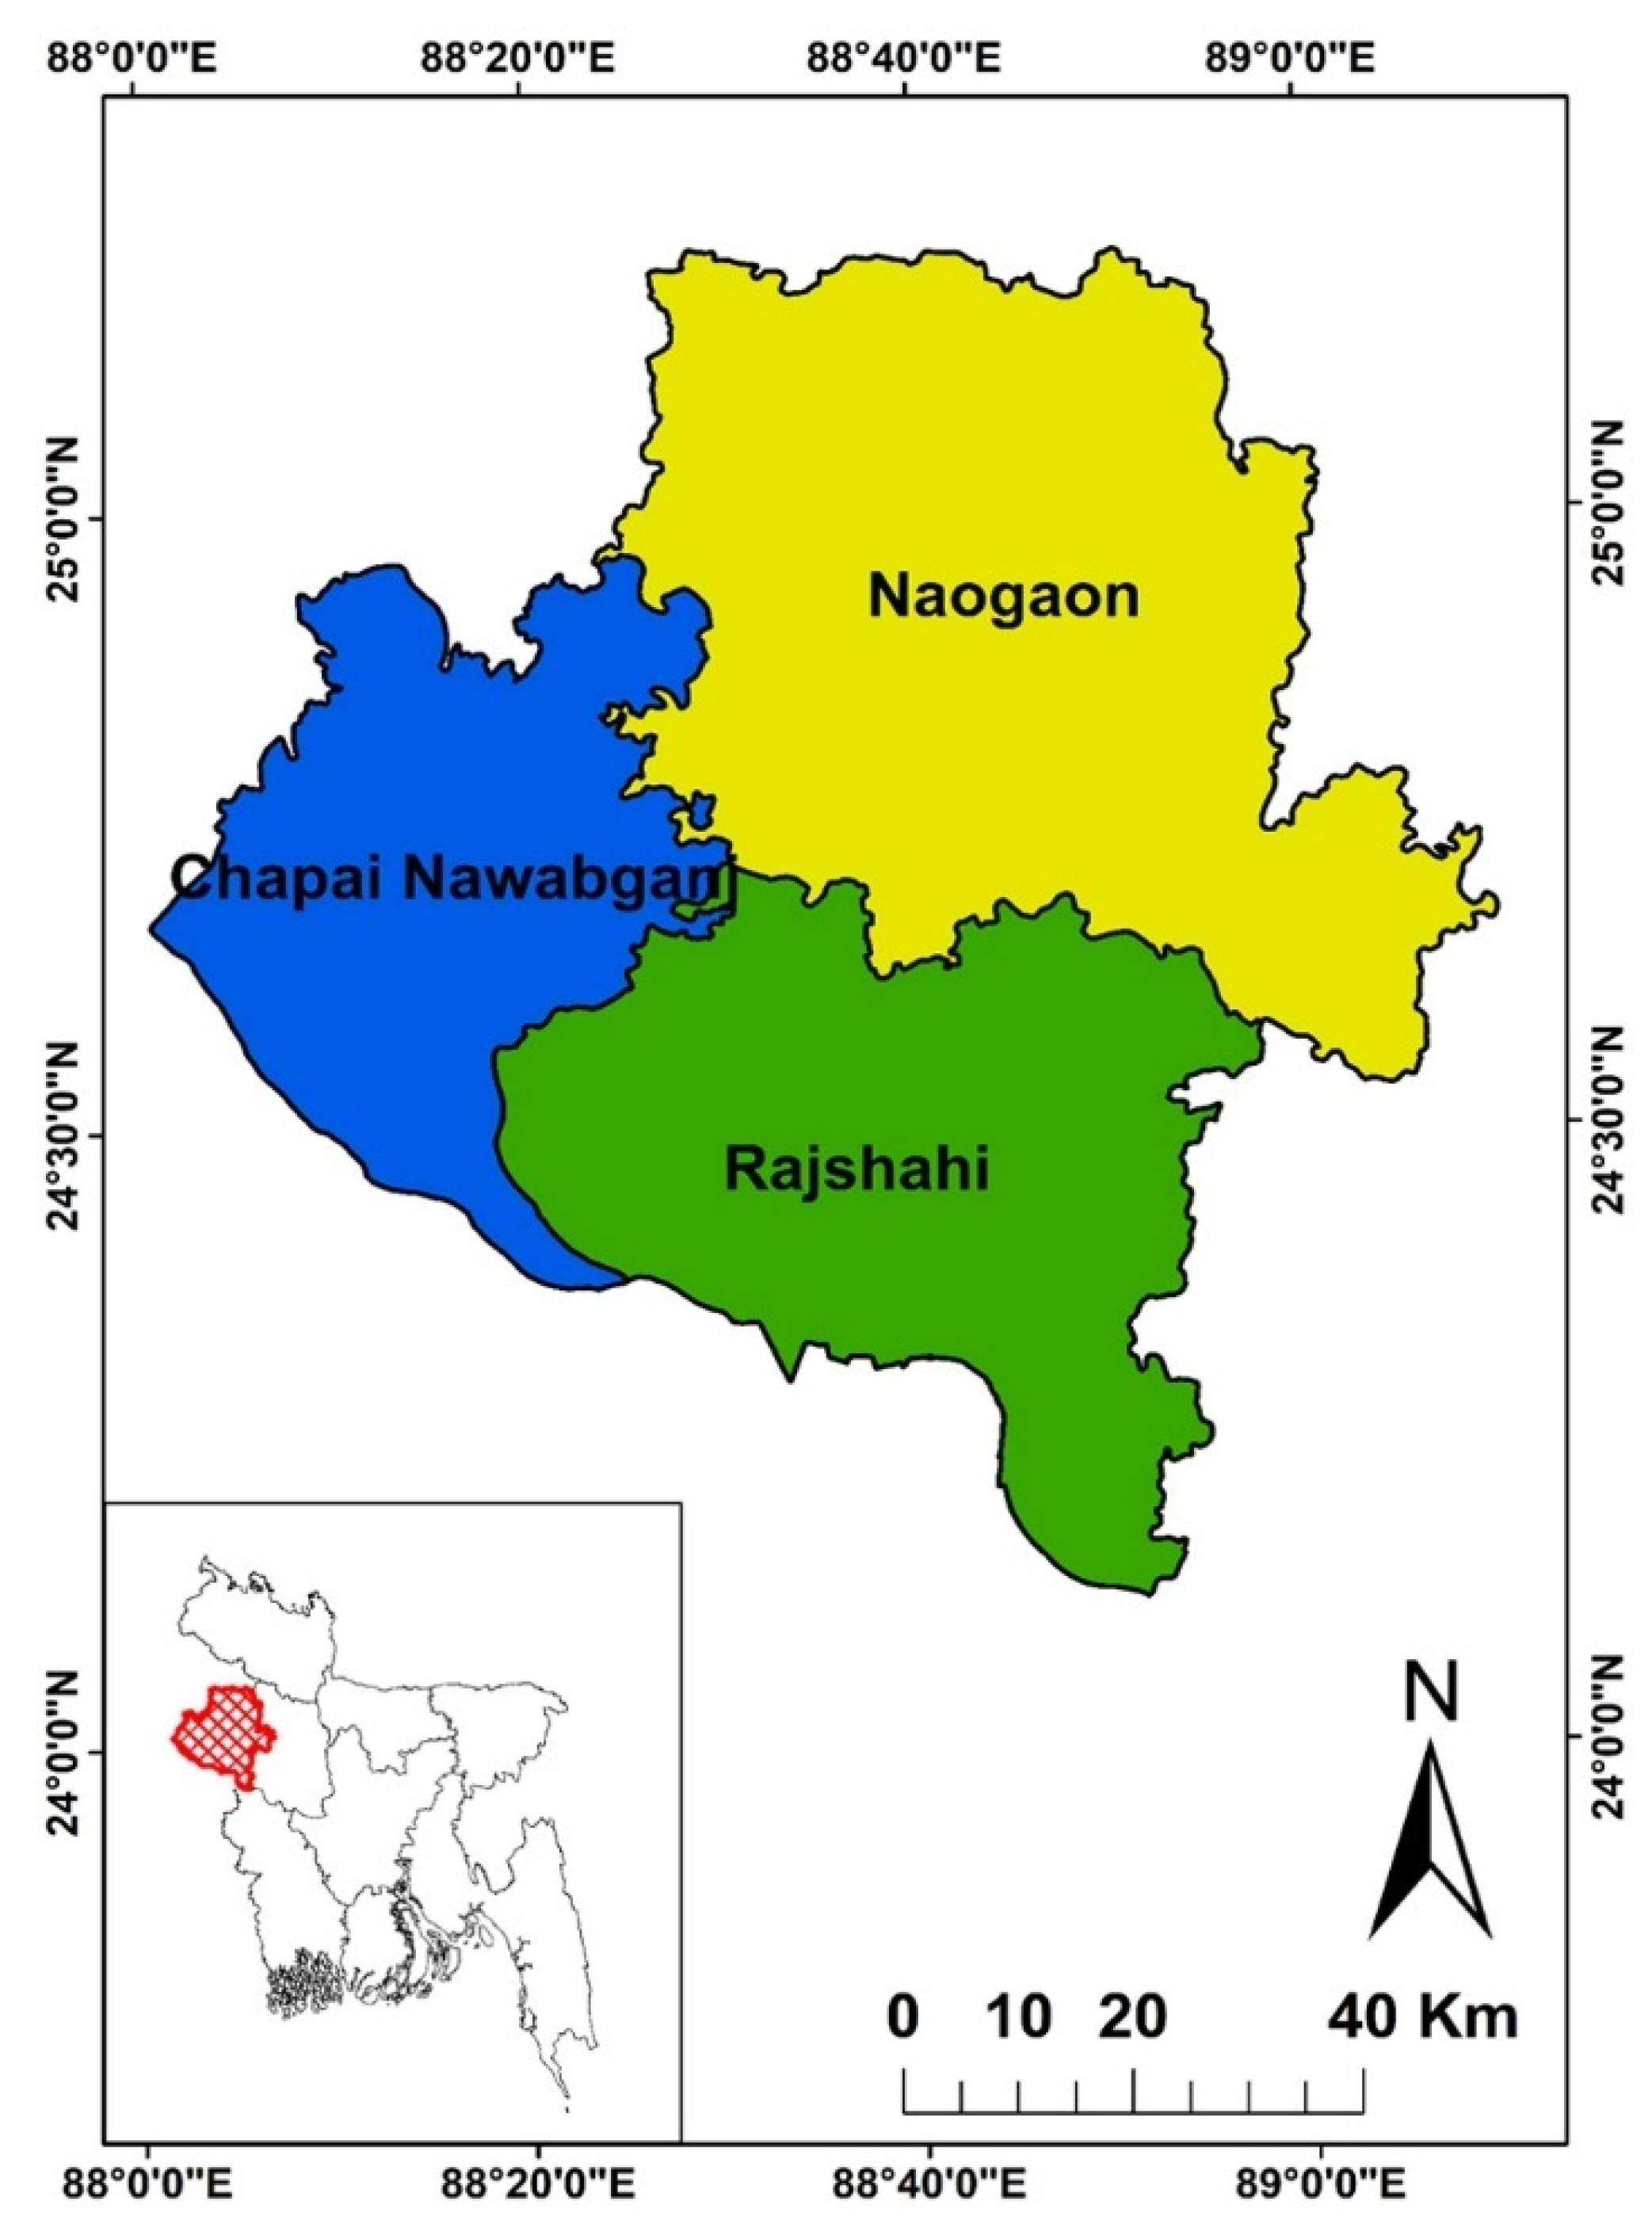
Figure 1. Description of study area.
Water 16 02918 g001
Figure 2. Methodological flowchart for GW RP derivation.
Water 16 02918 g002
Figure 3. Schematic of overlay operation.
Water 16 02918 g003
Figure 4. Derived (A) rainfall distribution, (B) slope, (C) geology, (D) drainage density, (E) LULC, (F) lineament density, (G) soil type map of the study area.
Water 16 02918 g004
Figure 5. GW potential based on the AHP map.
Water 16 02918 g005
Table 1. Summary of data source.
Data TypeSourceData Type
Study Area MapBARCVector
DEMUS geological survey (USGS), SRTM dataRaster, 30 m × 30 m
Slope, Lineament Density, Drainage DensityDerived using SRTM dataRaster, 30 m × 30 m
Land Use/Land Cover (LULC)Landsat 8 satellite image, USGS online portalRaster, 30 m × 30 m
Geology, Soil TypeBARCVector
RainfallBangladesh Meteorological Department (BMD)Point Data
Table 2. Relative class scale for GW RP analysis based on Saaty [44].
ImportanceScaleRemarks
Extremely less important1/9Water 16 02918 i001
1/8
Very strongly less important1/7
1/6
Strongly less important1/5
1/4
Moderately less important1/3
1/2
Equal Importance1
2Water 16 02918 i002
Moderately more important3
4
Strongly more important5
6
Very strongly more important7
8
Extremely more important9
Table 3. Developed PWCM.
RainfallGeologySlopeDDLULCLDST
Rainfall1.000.333.003.000.333.000.33
Geology3.001.003.005.003.005.003.00
Slope0.330.331.001.000.330.330.20
DD0.330.201.001.000.331.000.33
LULC3.000.333.003.001.003.001.00
LD0.330.203.001.000.331.001.00
ST3.000.335.003.001.001.001.00
Total (a)112.7319176.3314.336.87
Table 4. Normalized pair-wise matrix with gained weight.
RainfallGeologySlopeDDLULCLDSTWeight (%) (b)
Rainfall0.0910.1220.1580.1760.0530.2090.04912.25
Geology0.2730.3660.1580.2940.4740.3490.43733.57
Slope0.0300.1220.0530.0590.0530.0230.0295.27
DD0.0300.0730.0530.0590.0530.0700.0495.51
LULC0.2730.1220.1580.1760.1580.2090.14617.74
LD0.0300.0730.1580.0590.0530.0700.1468.40
ST0.2730.1220.2630.1760.1580.0700.14617.25
Total100
Table 5. Eigenvalue calculation.
FactorsRelative Weight (a)
(Table 3)
Eigenvalue Factor (b)
(Table 4)
Eigenvalue (a × b)
Rainfall11.000.1231.348
Geology2.730.3360.918
Slope19.000.0531.001
Drainage Density17.000.0550.937
LULC6.330.1771.124
Lineament Density14.330.0841.204
Soil Type6.870.1731.185
Principle   Eigenvalue   λ m a x 7.716
Table 6. Randomness index (RI).
n234567891011
RI00.580.91.121.241.321.411.451.511.52
Table 7. GW RP category FAO estimates [29].
RP CategoryEstimates (%)Average (%)
Very Good45–5047.5
Good30–3532.5
Moderate10–2015.0
Poor5–107.5
Very Poor0–52.5
Table 8. Assigned weight to different feature class of GW-influencing factors.
CriteriaFeature ClassAHP Score
Total (%) (Xi)Individual
Rainfall (mm)1200–1400122
1400–15503
1550–16506
1650–18009
1800–220012
GeologyUltrabasic3414
Sedimentation24
Water34
Lake34
Slope (%)0–155
1–24
2–33
3–62
6–401
Drainage Density (km/km2)0.05–0.7566
0.75–1.055
1.05–1.254
1.25–1.53
1.5–2.52
LULCUrban183
Bare Land8
Forest13
Agriculture13
Water18
Lineament Density (km/km2)0–0.2583
0.25–0.654
0.65–1.25
1.2–1.857
1.85–38
Soil TypeAcid Basin Clay178
Urban8
Shallow Terrace Soil13
Calcar. Alluvium13
Noncalcar. Alluvium13
Calcar. Floodplain17
Deep Terrace Soils17
Noncalcar. Floodplain17
Table 9. AHP Based on GW RP.
Recharge Potential ZoneAreal Extent (km2)Areal Extent (%)
Poor (zone 1)700.229.23
Moderate (zone 2)3617.1347.68
Good (zone 3)2816.1337.12
Very Good (zone 4)452.705.97
Disclaimer/Publisher’s Note: The statements, opinions and data contained in all publications are solely those of the individual author(s) and contributor(s) and not of MDPI and/or the editor(s). MDPI and/or the editor(s) disclaim responsibility for any injury to people or property resulting from any ideas, methods, instructions or products referred to in the content.