The Coupled Application of the DB-IWHR Model and the MIKE 21 Model for the Assessment of Dam Failure Risk
Abstract
1. Introduction
2. Model and Methods
2.1. DB-IWHR Model
2.1.1. Flow and Velocity at the Breach Section
2.1.2. Scour Model
2.1.3. Modelling of Lateral Extension of Breach
2.2. MIKE 21 Model
2.2.1. Governing Equation
2.2.2. Discrete Equation in Space
2.2.3. Time Integral
2.2.4. Boundary Condition
3. Condition Study
3.1. Analysis of Breach Locations and Breach Flow Processes
3.1.1. Determination of the Location of the Breach
3.1.2. Analysis of Routed Flow Processes
3.2. Modelling the Evolution of Dam Failure Floods
3.2.1. Confirmation of Modelling Scope
3.2.2. Grid Construction
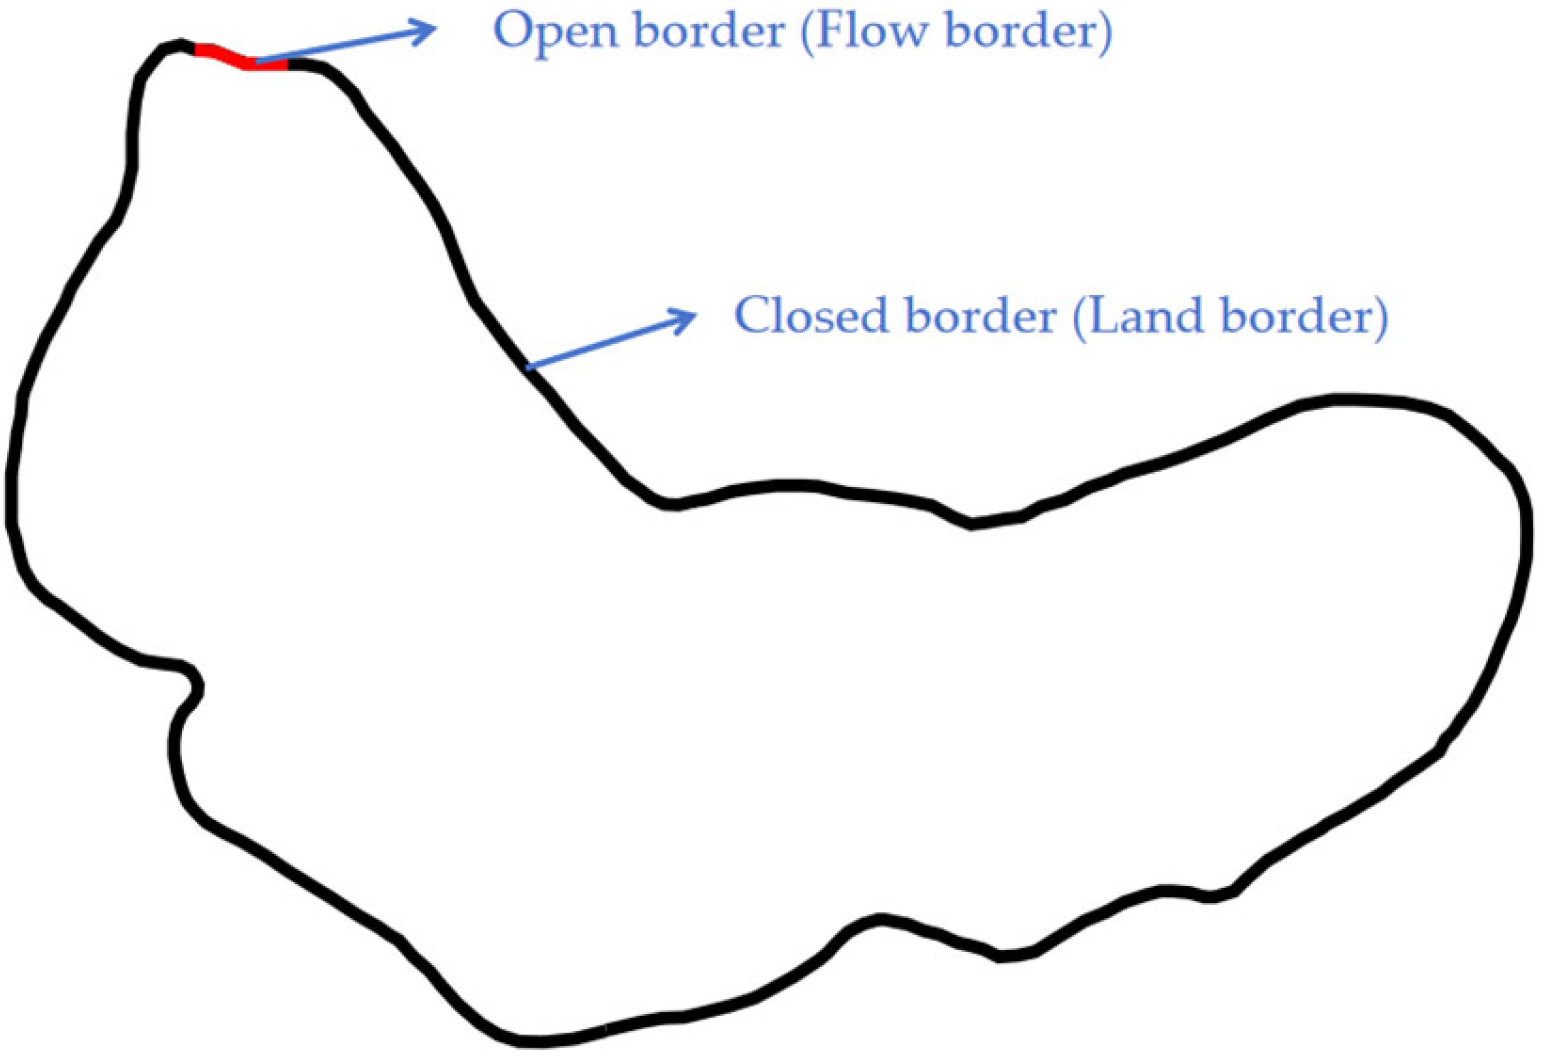
3.2.3. Boundary Condition Setting
- (1)
- Open boundary
- (2)
- Closed boundary
3.2.4. Selection of Model Parameters
- (1)
- Simulation time and time step
- (2)
- Roughness
3.2.5. Build the Model
3.3. Analysis of Inundation under Different Flood Conditions
3.4. Analysis of the Reasonableness of the Results
3.4.1. Grid-Independent Analysis
3.4.2. Roughness Sensitivity Analysis
3.4.3. Local Flow Field Analysis
4. Discussion
5. Conclusions
- (1)
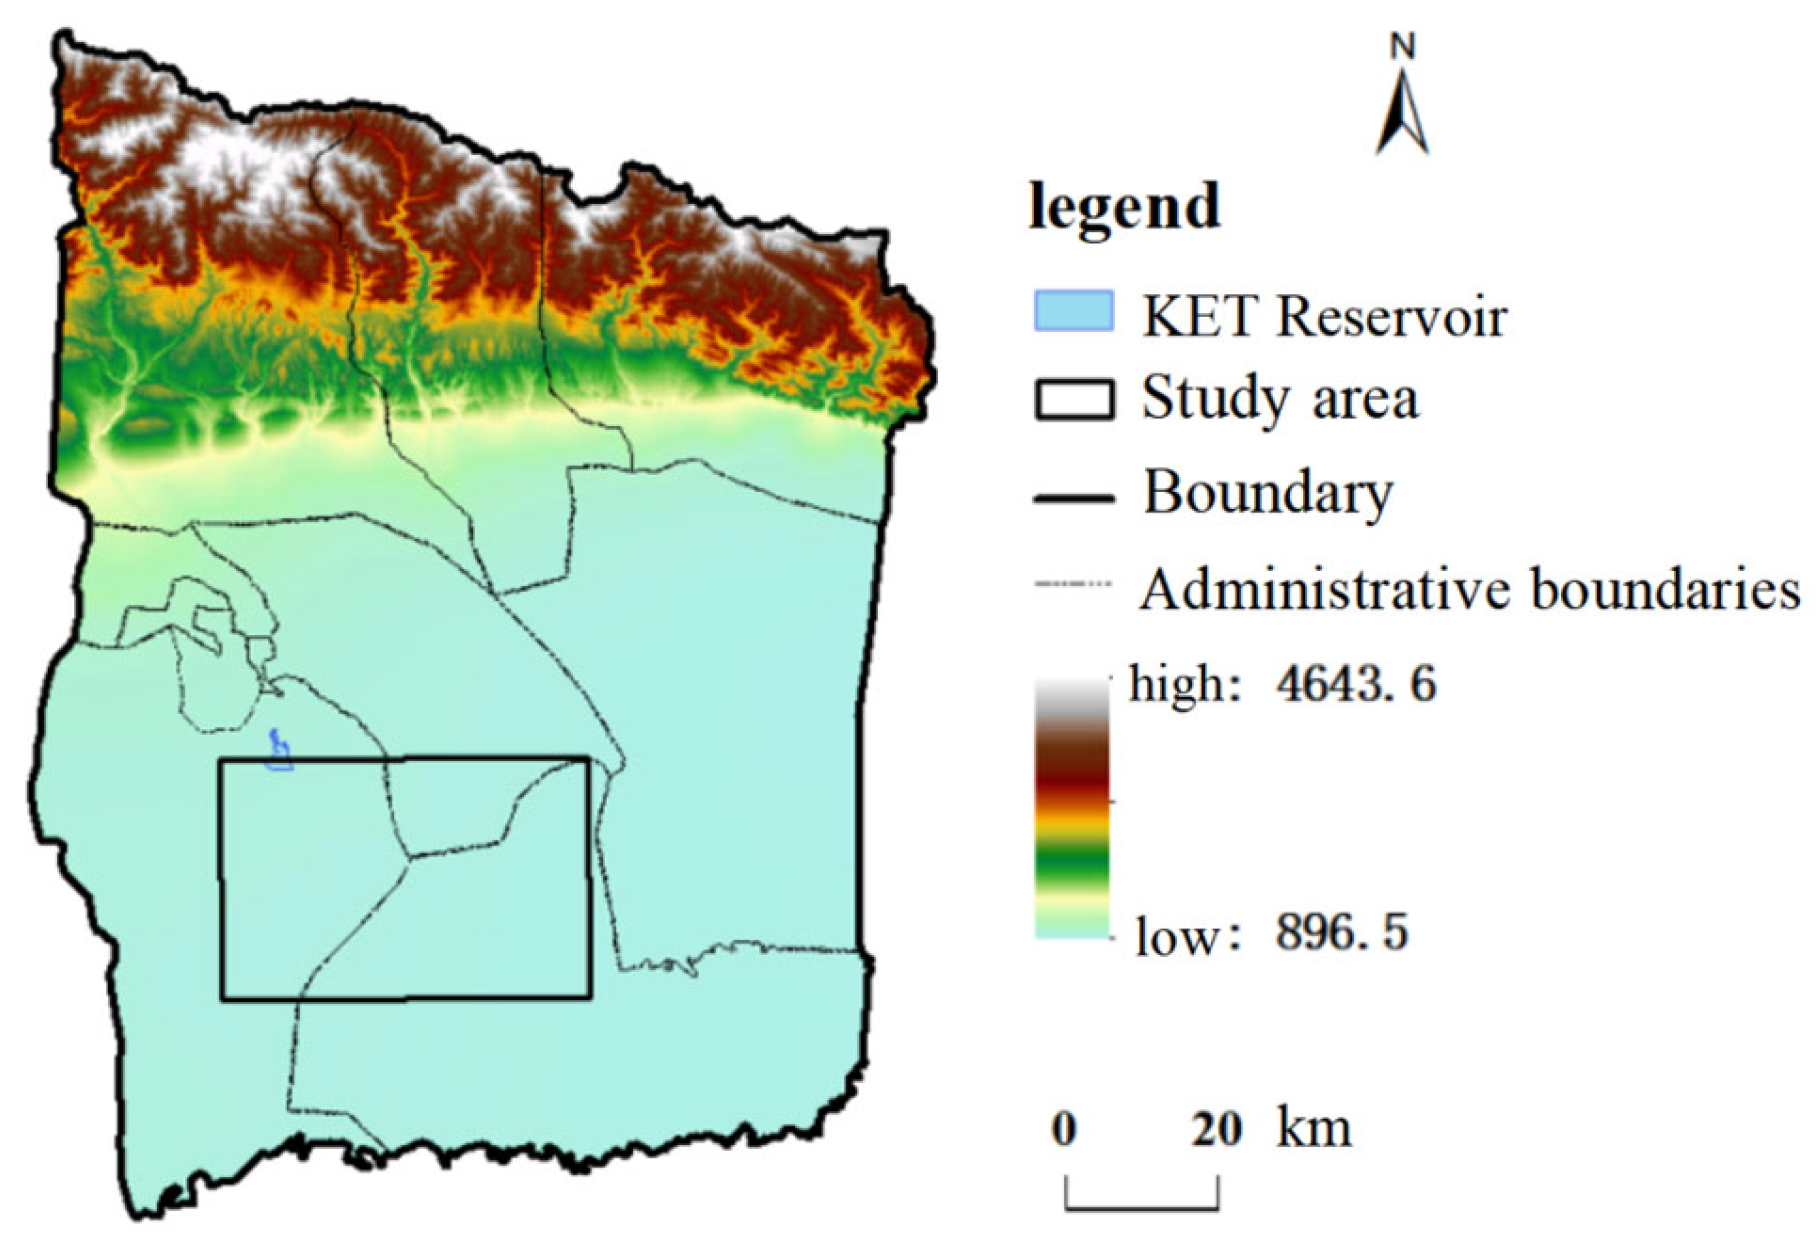
- A new coupled model for predicting the risk of dam failure is proposed, and the coupled analysis of the DB-IWHR model and MIKE 21 model can effectively simulate the dam failure flood evolution process. It can be seen from the topographic map that the study area generally shows a north-high and south-low terrain, and the simulation results also show that the river channel gradually disperses downstream in a fan shape, and the flood shows a north-to-south evolution and gradually spreads to the two sides of the river, with a high degree of suitability of the flood evolution and the terrain. The flood evolution and the terrain are high, and the simulation results are good.
- (2)
- The dam failure flood time flow process curve law was determined, that is, in the dam failure process, the dam failure flow will be where the flood water discharge leads to the water level decline, the decline speed is faster, the flow change is larger, and the dam failure lasts for a longer time. Under the condition of the same incoming water frequency, the higher the starting water level, the shorter the duration of the dam breaching process and the smaller the peak flow; on the contrary, under the condition that the starting water level remains unchanged, the increase of the incoming water frequency will accelerate the occurrence of the dam breaching event, and the duration of the impact of the flood water is much longer, and the peak flow is also increased accordingly.
- (3)
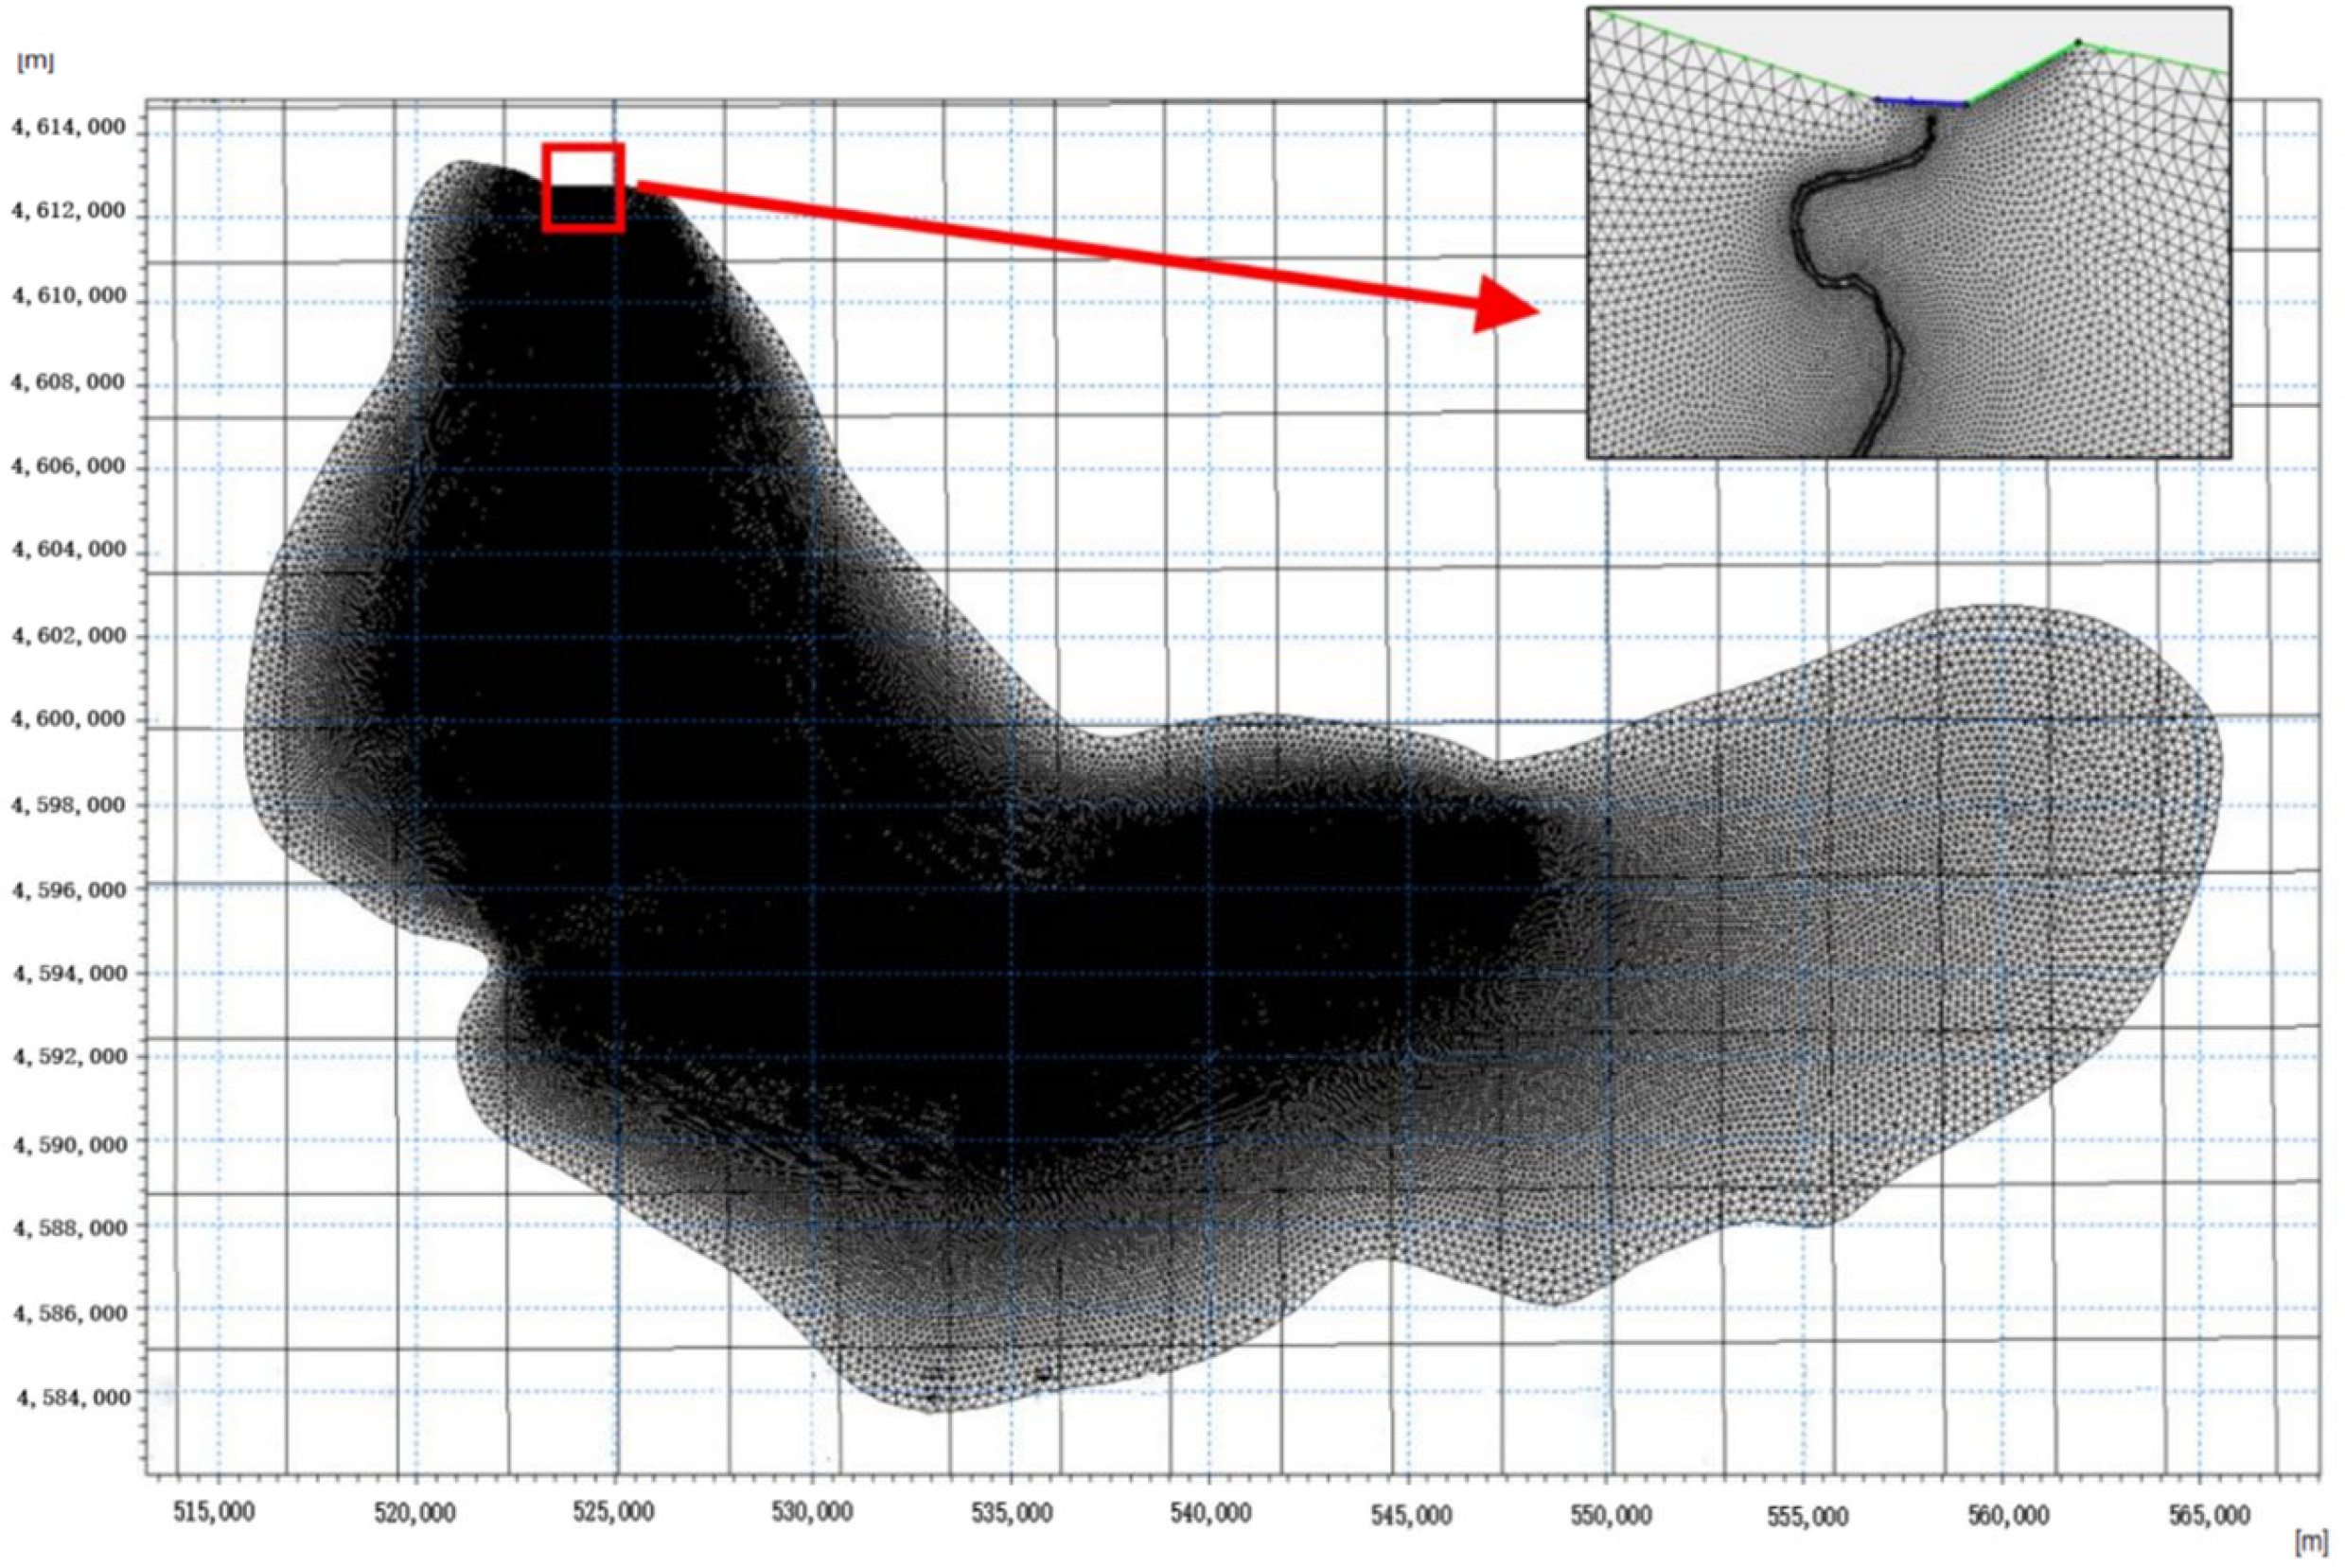
- The model adapts to the shape of the complex boundary terrain, adopts an unstructured grid to analyse and calculate the study area, and determines that the simulation area downstream of the reservoir area is 624 km2, the number of grids is 537,244, and the minimum angle of the triangle grids are all greater than 30°. According to the simulation results, the model parameters are reasonably configured, and it can effectively reproduce the river terrain, which indicates that the numerical model of the study area has a high degree of simulatability, thus verifying the reasonableness of the model.
- (4)
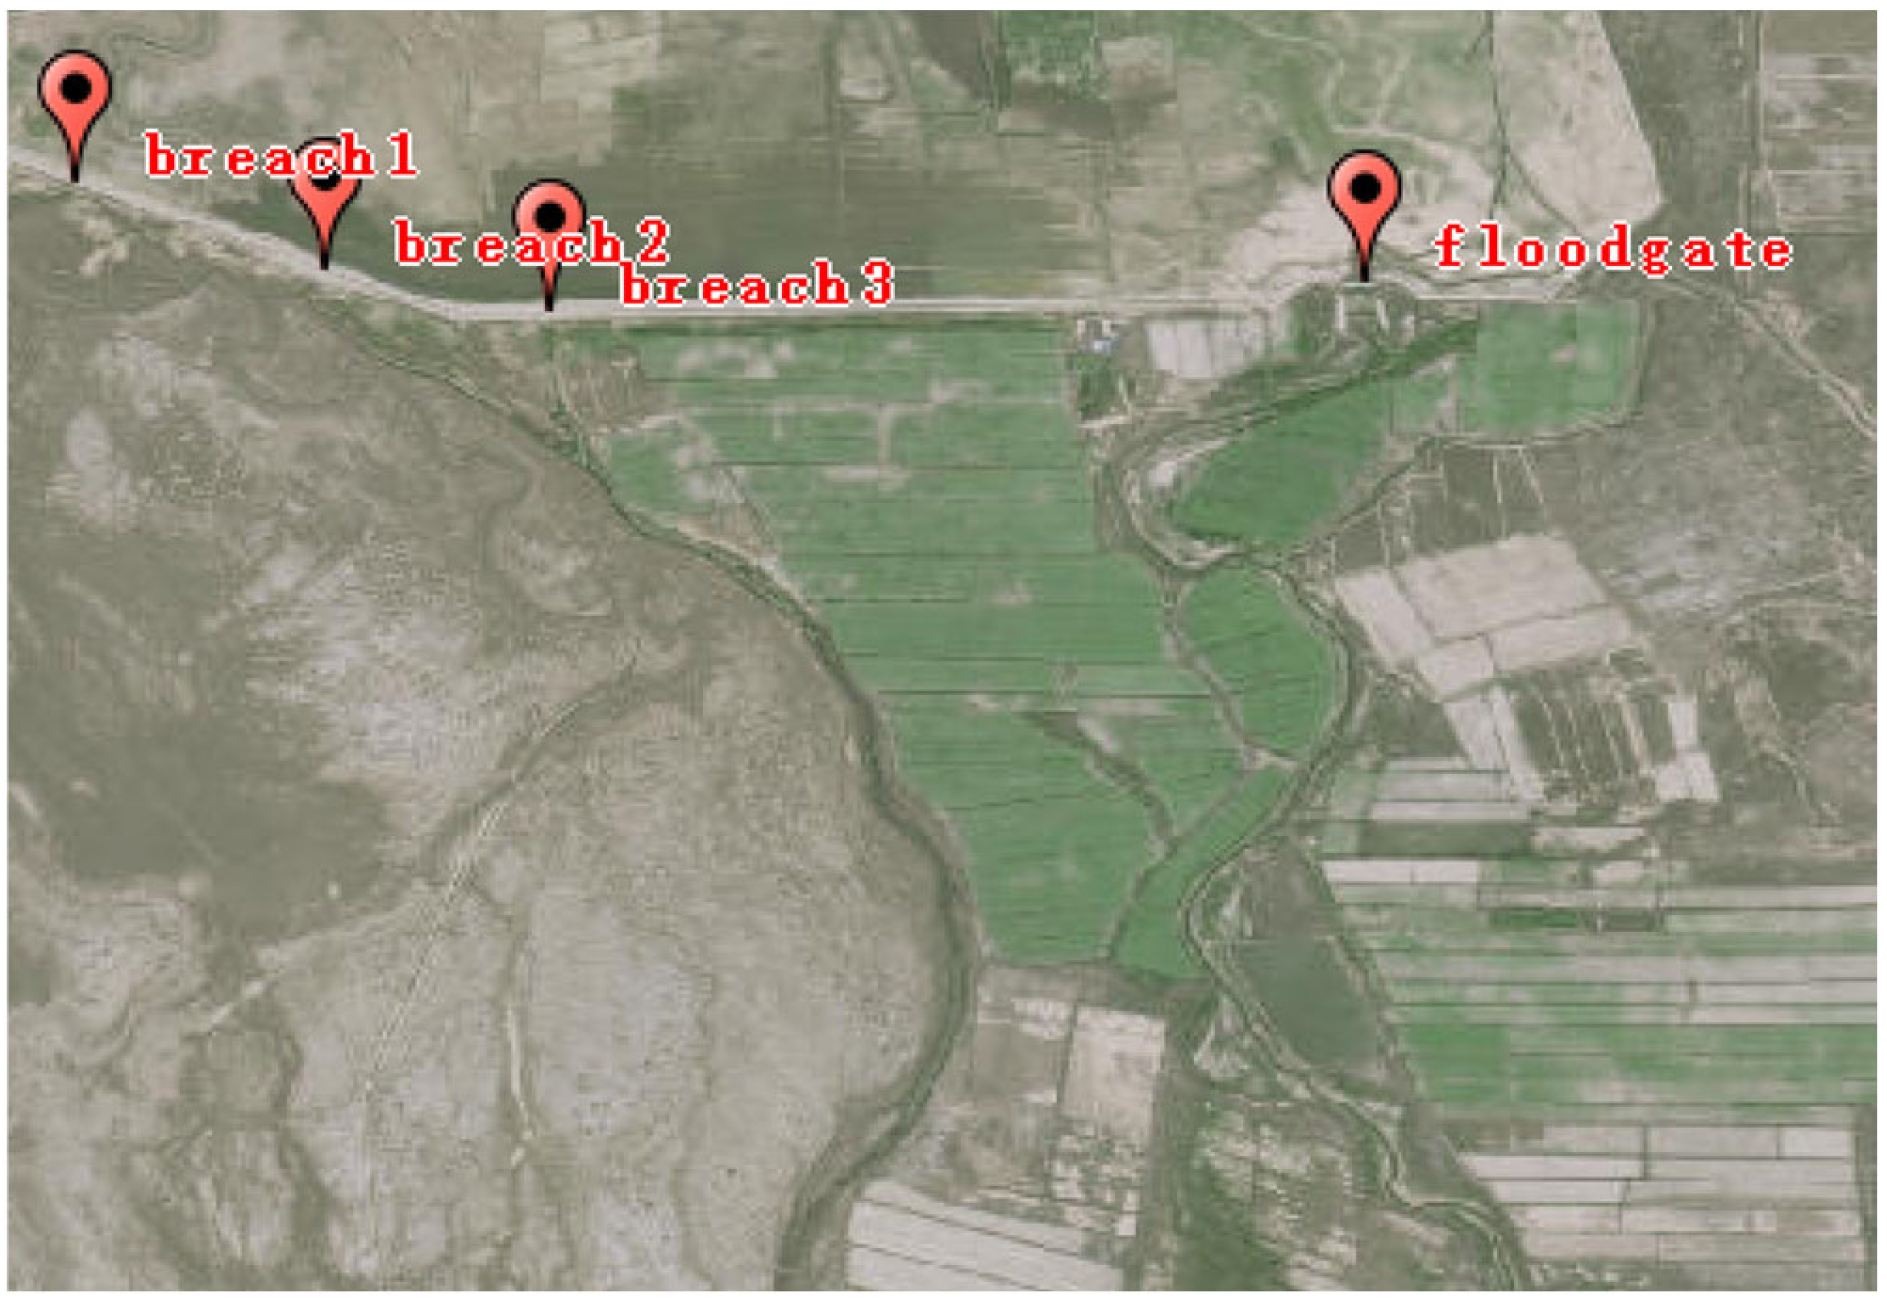
- The most unfavourable locations of reservoir breaches in the event of flooding have been identified as Breach 3, Breach 2, and Breach 1. On this basis, a more efficient contingency plan will be formulated in a targeted manner to ensure that rapid response measures can be taken in the event of a dam failure. The plan will specify the flood avoidance and transfer routes and emergency measures for the affected population so as to minimise casualties and property damage and to safeguard the lives and property of the people.
Author Contributions
Funding
Data Availability Statement
Conflicts of Interest
References
- Fondelli, T.; Andreini, A.; Facchini, B. Numerical Simulation of Dam-Break Problem Using an Adaptive Meshing Approach. Energy Procedia 2015, 82, 309–315. [Google Scholar] [CrossRef]
- Niu, K.; Zheng, X.; Miao, Y. Numerical Simulation of Violent Wave Impact by ISPH Method. Procedia Eng. 2015, 126, 665–669. [Google Scholar] [CrossRef][Green Version]
- He, Z.; Wu, T.; Weng, H. Numerical simulation of dam-break flow and bed change considering the vegetation effects. Int. J. Sediment Res. 2015, 32, 105–120. [Google Scholar] [CrossRef]
- Seyedashraf, O.; Akhtari, A.A. Two-dimensional numerical modeling of dam-break flow using a new TVD finite-element scheme. J. Braz. Soc. Mech. Sci. Eng. 2017, 39, 4393–4401. [Google Scholar] [CrossRef]
- Subklay, K.; Pochai, N. Numerical simulations of a water quality model in a flooding stream due to dam-break problem using implicit and explicit methods. J. Interdiscip. Math. 2017, 20, 461–495. [Google Scholar] [CrossRef]
- Ali, H.; Boualem, R.; Mohamed, R. Numerical modelling of solid transport caused by an extreme flood: Condition of the Hamiz dam failure (Algeria). J. King Saud Univ.-Eng. Sci. 2017, 29, 221–236. [Google Scholar] [CrossRef]
- Elmiloud, C. Numerical Simulation of Dam Break Flows Using a Radial Basis Function Meshless Method with Artificial Viscosity. Model. Simul. Eng. 2018, 2018, 4245658. [Google Scholar]
- Kojima, H.; Kohgo, Y.; Shimada, K. Numerical modeling of flood flow after small earthen dam failure: A Condition study from the 2011 Tohoku earthquake. Paddy Water Environ. 2020, 18, 431–442. [Google Scholar] [CrossRef]
- Li, Y.; Chen, A.; Wen, L. Numerical simulation of non-cohesive homogeneous dam breaching due to overtopping considering the seepage effect. Eur. J. Environ. Civ. Eng. 2020, 26, 1993–2007. [Google Scholar] [CrossRef]
- Wang, K.; Yang, P.; Yu, G.M. 3D Numerical Modelling of Tailings Dam Breach Run Out Flow over Complex Terrain: A Multidisciplinary Procedure. Water 2020, 12, 2538. [Google Scholar] [CrossRef]
- Thu, T.L.H.; Nguyen, C.V. Investigate Impact Force of Dam-Break Flow against Structures by Both 2D and 3D Numerical Simulations. Water 2021, 13, 344. [Google Scholar] [CrossRef]
- Alibek, I.; Aliya, B.; Aizhan, A. Numerical modeling of the dam-break flood over natural rivers on movable beds. Int. J. Nonlinear Sci. Numer. Simul. 2022, 24, 1659–1681. [Google Scholar]
- Sadegh, M.; Mehdi, M.A.; Hossein, M. Numerical Simulation of Water Flow over a Stair Through Improved Weakly Compressible Moving Particle Semi-implicit Method. Int. J. Civ. Eng. 2023, 22, 467–478. [Google Scholar]
- Chen, Z.Y.; Xu, Y.; Sun, P. Slope stability analysis method considering the anisotropic characteristics of rock body shear strength. J. Lanzhou Univ. (Nat. Sci. Ed.) 2015, 51, 759–767. [Google Scholar]
- Shen, H.J.; Xu, L.Q.; Liu, Z.X. Improvement of DB-IWHR model and its application in the impact analysis of tailing pond failure. Adv. Water Resour. Hydropower Sci. Technol. 2022, 42, 64–70. [Google Scholar]
- Wawan, W.; Nowo, D.M.; Warno, S.U. Investigating Impact of Sea Sand Mining in Tunda Island Waters, Indonesia Based in Mike 21 Modelling. Croat. J. Fish. 2023, 81, 73–81. [Google Scholar]
- Mahmoud, P.; Mehdi, N.R.; Alireza, A. Improving the Modeling of Sea Surface Currents in the Persian Gulf and the Oman Sea Using Data Assimilation of Satellite Altimetry and Hydrographic Observations. Remote Sens. 2022, 14, 4901. [Google Scholar] [CrossRef]
- Yan, J.; Chen, M.; Xu, L.J. Mike 21 Model Based Numerical Simulation of the Operation Optimization Scheme of Sedimentation Basin. Coatings 2022, 12, 478. [Google Scholar] [CrossRef]
- Luo, C.T.; Li, D.W.; Xu, B. Study on the Evolution of Tailings Dam Break Disaster under Complex Environment. Sustainability 2023, 15, 14728. [Google Scholar] [CrossRef]
- Hanson, G.J.; Tejral, R.D.; Hunt, S.L.; Temple, D.M. Internal erosion and impact of erosion resistance. In Proceedings of the 30th US Society on Dams Annual Meeting and Conference, Sacramento, CA, USA, 12–16 April 2010; pp. 773–784. [Google Scholar]
- Harris, G.W.; Wagner, D.A. Outflow from Breached Earth Dams. Bachelor’s Thesis, The Department of Civil & Environmental Engineering, The University of Utah, Salt Lake City, UT, USA, 1967. [Google Scholar]
- Fread, D.L.; Lewis, J.M. FLDWAV: A generalized flood routing model. In Proceedings of the 1988 National Conference on Hydraulic Engineering, Colorado Springs, CO, USA, 8–12 August 1988; ASCE: Reston, VA, USA; pp. 668–673. [Google Scholar]
- Te, W.; Zongkun, L.; Wei, G. Risk consequence assessment of dam breach in cascade reservoirs considering risk transmission and superposition. Energy 2023, 265, 126315. [Google Scholar]
- Technical Specification for Flood Dam Break Simulation; China Water Conservancy and Hydropower Press: Beijing, China, 2020.
- Guidelines for Preparing Flood Risk Maps; China Water Resources and Hydropower Press: Beijing, China, 2017.
- Yang, Z.; Feng, M.Q. Coupling of two-dimensional numerical modelling of the breach proximal zone with the evolution of dam failure floods. Hydro-Sci. Eng. 2015, 1, 8–19. [Google Scholar]
- Ma, L.P.; Hou, J.M.; Zhang, D.W.; Xia, J.Q.; Li, B.R.; Ning, Z.L. Study on 2-D numerical simulation coupling with breach evolution in flood propagation. J. Hydraul. Eng. 2019, 50, 1253–1267. [Google Scholar]
- Chen, S.S.; Zhong, Q.M.; Tao, J.J. Advances in simulation of earth and rock dam failures and water flow calculations. Adv. Water Sci. 2008, 19, 903–910. [Google Scholar]





| f (°) | c (kPa) | f1 (°) | c1 (kPa) | γd (kN/m3) | γsat (kN/m3) | Ru |
|---|---|---|---|---|---|---|
| 26.5 | 18 | 0 | 0 | 1.95 | 22.00 | 0 |
| Sampling Location | Sampling Depth (m) | Grain Size (mm) | Unevenness Coefficient | Curvature Coefficient | Define Name | ||||||
|---|---|---|---|---|---|---|---|---|---|---|---|
| >1 | 1 ~ 0.5 | 0.5 ~ 0.25 | 0.25 ~ 0.1 | 0.1 ~ 0.075 | 0.075 ~ 0.05 | <0.05 | |||||
| Content (%) | |||||||||||
| 1 | 1.0 | 0.0 | 0.2 | 2.0 | 10.8 | 29.7 | 39.0 | 18.3 | 2.0 | 1.1 | silt soil |
| 2 | 1.2 | 0.0 | 0.3 | 2.1 | 10.0 | 16.0 | 49.0 | 22.6 | 1.5 | 1.5 | silt soil |
| 3 | 0.8 | 0.0 | 0.0 | 0.2 | 1.9 | 23.1 | 58.7 | 16.1 | 1.5 | 1.5 | silt soil |
| 4 | 0.9 | 0.0 | 0.0 | 0.6 | 8.8 | 18.3 | 59.3 | 13.0 | 1.5 | 1.5 | silt soil |
| 5 | 0.5 | 0.0 | 0.0 | 0.3 | 3.9 | 20.9 | 24.8 | 50.1 | 1.5 | 0.7 | silt soil |
| Average number | 0.0 | 0.1 | 1.0 | 7.1 | 21.6 | 46.2 | 24.0 | ||||
| 1 | 2.5 | 0.0 | 0.0 | 0.3 | 7.1 | 14.5 | 67.6 | 10.5 | 1.5 | 1.5 | silty clay |
| 2 | 2.0 | 0.0 | 0.2 | 0.9 | 4.7 | 12.7 | 69.0 | 12.5 | 1.5 | 1.5 | silty clay |
| 3 | 3.5 | 0.6 | 0.7 | 9.4 | 8.7 | 3.5 | 64.3 | 12.8 | 1.5 | 1.5 | silty clay |
| 4 | 2.5 | 0.0 | 0.3 | 2.4 | 12.3 | 18.0 | 58.0 | 9.0 | 1.0 | 1.0 | silty clay |
| 5 | 1.8 | 0.0 | 0.0 | 1.7 | 3.6 | 12.0 | 70.9 | 11.8 | 1.5 | 1.5 | silty clay |
| Average number | 0.1 | 0.2 | 2.9 | 7.3 | 12.1 | 66.0 | 11.3 | ||||
| Type Name | Element | Roughness (n) | Manning Value (1/n) |
|---|---|---|---|
| Residential area | Neighbourhoods | 0.060 | 16.67 |
| General housing | 0.070 | 14.29 | |
| Squares, open spaces | 0.060 | 16.67 | |
| Rivers and lakes | Rivers and canals | 0.023 | 43.48 |
| Gully | 0.027 | 37.04 | |
| Land with vegetation cover | Grassland | 0.030 | 33.33 |
| Woodland | 0.070 | 14.29 | |
| Land without vegetation cover | Grassed gravel, saline areas | 0.050 | 20.00 |
| Shoreline | 0.035 | 28.57 | |
| Gobi desert | 0.040 | 25.00 |
| Breach Location | Serial Number | Working Condition | Water Frequency | Peak Flow (m3/s) | The Moment of Peak Flow (t) | Inundation Area (km2) | Max Water Depth (m) | Max Flow Velocity (m/s) |
|---|---|---|---|---|---|---|---|---|
| Breach 1 | 1 | Condition 1-1 | P = 5% calibrated flood level | 1940.00 | 3.13 | 141.15 | 4.84 | 11.82 |
| 2 | Condition 1-2 | P = 5% crest level | 5005.05 | 3.20 | 167.56 | 4.92 | 20.22 | |
| 3 | Condition 2-1 | P = 2% calibrated flood level | 2939.00 | 2.48 | 172.75 | 4.88 | 20.10 | |
| 4 | Condition 2-2 | P = 2% crest level | 5218.00 | 3.11 | 187.44 | 4.93 | 20.70 | |
| Breach 2 | 5 | Condition 1-1 | P = 5% calibrated flood level | 1892.00 | 2.99 | 148.29 | 4.87 | 14.91 |
| 6 | Condition 1-2 | P = 5% crest level | 5114.73 | 3.14 | 143.9 | 4.81 | 19.87 | |
| 7 | Condition 2-1 | P = 2% calibrated flood level | 2951.00 | 2.49 | 161.27 | 4.85 | 22.03 | |
| 8 | Condition 2-2 | P = 2% crest level | 5110.00 | 3.04 | 219.08 | 4.97 | 21.39 | |
| Breach 3 | 9 | Condition 1-1 | P = 5% calibrated flood level | 1892.00 | 2.99 | 153.58 | 4.87 | 13.70 |
| 10 | Condition 1-2 | P = 5% crest level | 5114.73 | 3.14 | 147.99 | 5.39 | 22.61 | |
| 11 | Condition 2-1 | P = 2% calibrated flood level | 2951.00 | 2.49 | 166.08 | 4.85 | 17.29 | |
| 12 | Condition 2-2 | P = 2% crest level | 5110.00 | 3.04 | 224.81 | 5.40 | 22.65 |
Disclaimer/Publisher’s Note: The statements, opinions and data contained in all publications are solely those of the individual author(s) and contributor(s) and not of MDPI and/or the editor(s). MDPI and/or the editor(s) disclaim responsibility for any injury to people or property resulting from any ideas, methods, instructions or products referred to in the content. |
© 2024 by the authors. Licensee MDPI, Basel, Switzerland. This article is an open access article distributed under the terms and conditions of the Creative Commons Attribution (CC BY) license (https://creativecommons.org/licenses/by/4.0/).
Share and Cite
Ma, J.; Zhou, F.; Yue, C.; Sun, Q.; Wang, X. The Coupled Application of the DB-IWHR Model and the MIKE 21 Model for the Assessment of Dam Failure Risk. Water 2024, 16, 2919. https://doi.org/10.3390/w16202919
Ma J, Zhou F, Yue C, Sun Q, Wang X. The Coupled Application of the DB-IWHR Model and the MIKE 21 Model for the Assessment of Dam Failure Risk. Water. 2024; 16(20):2919. https://doi.org/10.3390/w16202919
Chicago/Turabian StyleMa, Junling, Feng Zhou, Chunfang Yue, Qiji Sun, and Xuehu Wang. 2024. "The Coupled Application of the DB-IWHR Model and the MIKE 21 Model for the Assessment of Dam Failure Risk" Water 16, no. 20: 2919. https://doi.org/10.3390/w16202919
APA StyleMa, J., Zhou, F., Yue, C., Sun, Q., & Wang, X. (2024). The Coupled Application of the DB-IWHR Model and the MIKE 21 Model for the Assessment of Dam Failure Risk. Water, 16(20), 2919. https://doi.org/10.3390/w16202919


