Article

Impact of Microplastic on Freshwater Sediment Biogeochemistry and Microbial Communities Is Polymer Specific

by
Kristina M. Chomiak
1,
Wendy A. Owens-Rios
1,
Carmella M. Bangkong
1,
Steven W. Day
2,
Nathan C. Eddingsaas
3,
Matthew J. Hoffman
4,
André O. Hudson
1 and
Anna Christina Tyler
1,*
1
Thomas H. Gosnell School of Life Sciences, Rochester Institute of Technology, Rochester, NY 14623-5603, USA
2
Department of Biomedical Engineering, Rochester Institute of Technology, Rochester, NY 14623-5603, USA
3
School of Materials Science and Chemistry, Rochester Institute of Technology, Rochester, NY 14623-5603, USA
4
School of Mathematics and Statistics, Rochester Institute of Technology, Rochester, NY 14623-5603, USA
*
Author to whom correspondence should be addressed.
Water 2024, 16(2), 348; https://doi.org/10.3390/w16020348
Submission received: 23 December 2023 / Revised: 12 January 2024 / Accepted: 14 January 2024 / Published: 20 January 2024
(This article belongs to the Section Biodiversity and Functionality of Aquatic Ecosystems)

Abstract

:
Plastic debris is a growing threat in freshwater ecosystems and transport models predict that many plastics will sink to the benthos. Among the most common plastics found in the Laurentian Great Lakes sediments are polyethylene terephthalate (especially fibers; PET), polyvinylchloride (particles; PVC), and styrene-butadiene rubber resulting from tire wear (“crumb rubber”; SBR). These materials vary substantially in physical and chemical properties, and their impacts on benthic biogeochemistry and microbial community structure and function are largely unknown. We used a microcosm approach to evaluate the impact of these three plastics on benthic-pelagic coupling, sediment properties, and sediment microbial community structure and function using sediments from Irondequoit Bay, a major embayment of Lake Ontario in Rochester, New York, USA. Benthic metabolism and nitrogen and phosphorous cycling were all uniquely impacted by the different polymers. PET fibers and PVC particles demonstrated the most unique effects, with decreased ecosystem metabolism in sediments containing PET and greater nutrient uptake in sediments with PVC. Microbial diversity was reduced in all treatments containing plastic, but SBR had the most substantial impact on microbial community function, increasing the relative importance of metabolic pathways such as hydrocarbon degradation and sulfur metabolism. Our results suggest that individual polymers have unique impacts on the benthos, with divergent implications for ecosystem function. This provides deeper insight into the myriad ways plastic pollution may impact aquatic ecosystems and will help to inform risk assessment and policy interventions by highlighting which materials pose the greatest risk.

1. Introduction

With global plastic production surpassing 300 million tonnes each year [1], the accumulation of plastic debris in the environment is an increasingly critical issue with largely unknown implications for both ecosystem and public health. Plastic debris is now found in a diverse array of aquatic ecosystems [2,3,4,5,6], including the Laurentian Great Lakes [7,8]. These lakes comprise the world’s largest surface freshwater system and millions of people depend on this resource for food, drinking water, and tourism [9]. As such, inputs and impacts of plastic pollution are a significant concern. The Great Lakes are also a gateway to the Atlantic Ocean through the St. Lawrence Seaway, and may act as a conduit to the oceans, especially for buoyant plastic debris. Modeling studies [10,11,12] and field observations suggest that plastic debris behaves differently in freshwater systems than oceans: rather than accumulating in a large floating “patch” [7], debris distribution in the Great Lakes is determined by source location and transport [8,13,14]. Plastic ultimately accumulates nearshore in the benthos and on beaches, in concentrations that can be >10,000 particles kg 1 [15,16,17,18]. Further, plastic began accumulating in the benthos of Lake Ontario, the terminal lake of the Laurentian Great Lakes system, between 20 and 40 years ago [16], with largely unknown impacts to the ecosystem.
Freshwater benthic ecosystems are highly diverse and critical in regulating trophic dynamics and recycling and removing carbon and other nutrients [19]. These functions are largely driven by a diverse community of benthic microbes, but contamination to sediments may alter microbial community structure and function, with cascading effects [20,21,22,23] and the potential to disrupt ecosystem services like water purification and climate regulation. In the environment, plastics are subject to conditions that may alter their physical and chemical properties (e.g., microorganisms, UV exposure, water-borne contaminants), influencing fate and subsequent impacts. Microplastics impact microbial diversity and function in soils [24,25,26], marine sediments [27,28,29,30,31,32,33,34], and sewage sludge [35,36,37,38]. The distinct microbial composition on plastic surfaces often differs from communities in the surrounding environment [28,39], may accumulate toxins or pathogenic microbes [40,41,42,43,44,45], and shift ecosystem processes in the water column and sediment. Potential impacts to key processes, like carbon and nitrogen cycling [36,46,47,48,49], require further investigation to fully understand how microplastics alter ecosystem function and microbial community structure in the benthos of the Great Lakes.
While the impacts of plastic pollution on freshwater systems remain understudied compared to marine environments, recent evidence suggests that microplastics induce similar disruptions to microbial community structure and function by shifting microbial diversity [50,51,52,53,54,55]. For example, in riverine systems, increased relative abundance of nitrifying bacteria in plastic-associated bacteria [56] may increase nitrification in sediments and wastewater effluents [35], creating nitrification hotspots in affected streams and sediments. Alterations in nitrogen cycling from shifts in sediment microbial communities may cascade to impact primary production, trophic structure, and water quality, underscoring the importance of the benthos in whole-ecosystem dynamics. Further, because different plastics have unique impacts on nitrification and denitrification activity [57], it is critical to investigate multiple polymers rather than treating “plastic” as a single pollutant [58].
Plastics vary substantially in their chemical composition and physical properties, both of which influence fate and environmental impacts. While many types of plastics have been identified in freshwater benthos, polymers are not equally distributed and may therefore have different impacts on ecosystem function. Polymers with a higher material density, like synthetic microfibers, (e.g., polyester, nylon), polyvinyl chloride (PVC), and tire wear particles comprised of butylated rubber are among the most commonly reported materials in nearshore sediments [59,60,61]. Fibers have been found in quantities as high as 34,000 fibers kg-sediment dry weight 1 (kg-dw 1 ) [62] in the Great Lakes basin. Despite being one of the most commonly reported polymers and with a substantial recent investigation into microfiber transport pathways [5,61,63,64], little is known about ecosystem impacts in freshwater environments. PVC is another plastic of concern due to its high material density and frequent use in construction materials that may release significant microplastic particles over time [65]. PVC may negatively affect bioturbating organisms [66] and reduce denitrification [57] in marine ecosystems, and shift both denitrification and nitrogen fixation rates in freshwater systems [36,67]. Tire wear particles have been found at densities up to 5500 particles kg-dw 1 [60]. Despite rising concern about toxicity and ecosystem impacts [68,69,70,71], the full effects of butylated rubber particles on aquatic environments remain unclear.
By evaluating how the ecological impacts of different plastics vary within the same system, we can better understand risks and generate a more targeted policy. In this study, we use a microcosm approach to evaluate the impacts of three commonly identified consumer microplastics—polyethylene terephthalate microfibers from clothing (PET); styrene-butadiene rubber (SBR) “crumb rubber” from tires and athletic turf fields; and PVC particles from construction material—on carbon, nitrogen, and phosphorus cycling, community metabolism, benthic microalgal abundance, and microbial community structure and function. This work adds to our growing holistic understanding of microplastic pollution in freshwater systems.

2. Methods

2.1. Microcosm Design and Set-Up

Sediment was collected from the mouth of Irondequoit Bay, a major embayment on the south shore of Lake Ontario (43.2349° N, 77.5337° W), to a depth of approximately 10 cm using a 9.5 cm diameter polycarbonate core tube, separated into depth profiles (0–2, 2–5, 5–10 cm), and sieved through a 1-mm mesh to remove rocks, plants, and macroinvertebrates. Microcosms were created in clean polycarbonate tubing (9.5 inner diameter × 30 cm) sealed at the bottom with a leached butyl rubber stopper by reconstructing the sediment layers. To remove any easily leachable contaminants, all polycarbonate tubes and stoppers were soaked in water for 30 days prior to use in the collection of sediments or as microcosms. Tubes were wrapped with opaque plastic below the sediment–water interface to prevent light penetration to sediment below the water interface. The headspace of each microcosm was filled with approximately 1 L of artificial freshwater [72] and stored in a 416 L recirculating Living Stream tank (FrigidUnits, Inc., Toledo, OH, USA). The tank was held at 23 °C and illuminated with full-spectrum lights on a 14:10 h light:dark cycle to simulate summer conditions, and microcosms were individually aerated with room air using airline tubing attached to an aquarium pump. Climate data suggests that the water temperature of Irondequoit Bay can range from 21–26 °C during the summer months when sediment was collected [73], making 23 °C a realistic temperature for the conditions we aimed to simulate. Microcosms were acclimated in the tank for four weeks to restore microbial communities and porewater solute concentrations prior to imposing experimental conditions. During this time, the water in the tank was held above the level of the microcosms so that the headspace was continuous for all units.

2.2. Material Additions

Following the acclimation period, each treatment microcosm received microplastic additions at a value of 0.1% of whole sediment core dry weight. This value was selected using concentrations found in the literature for the Great Lakes [59,60,61]. Materials were sourced with the intention of using post-consumer items where possible. Ten representative particles of each were measured to determine the size distribution of each material. On average, the SBR crumb rubber and PVC particles used in this study were 1.8 mm and 0.66 mm, respectively. The fabric used for the PET fibers was sourced as a large sheet that was cut into smaller strips and then ground in a coffee grinder until they reached a size fraction of 5.5 mm average length. Additional characteristics of the polymers, including the sourcing of each material, are provided in the Supplemental Information Table S1. In addition, we assessed the potential leaching of additives from each polymerusing the methods of Rani et al. [74]; these results are also provided in the Supplemental Information (Figures S1–S3). PET fibers were sourced from a local fabric retailer JoAnn Fabrics, Rochester, NY, USA, though the exact brand is unknown. The SBR “crumb rubber” was sourced from Al’s Liner Systems (Product #: ALS-RC), Cloverdale, IN, USA. Hard PVC particles were sourced from Sigma Aldrich, Burlington, MA, USA. (Product #: 389293).
Each plastic was thoroughly mixed into 150 g wet weight of additional surface layer (0–2 cm) sediment along with 0.75 g of Urtica powder to replenish organic matter, and this mixture was added to the top of each core. Control microcosms received a similar addition of plastic-free surface layer sediment (n = 4 per treatment). An additional 45 g of surface layer sediment was added on top of the treatment layer to prevent particle resuspension, creating a total sediment height of 12.5 cm. Prepared microcosms were placed back in the tank and incubated for 30 d. The water level in the tank was drawn down 10 mm below the level of the microcosms to isolate the headspace while maintaining a consistent temperature; aerators were reinstalled in each unit to mix the water column and oxygenate the water column.

2.3. Oxygen and Nutrient Flux Measurements

After 30 d, sediment–water column fluxes of oxygen, nitrate (NO 3 ), ammonium (NH 4 + ), and phosphate (PO 4 3 ) were measured in the dark and light. These fluxes of nitrogen- and phosphorus-containing solutes were used to elucidate shifts in nutrient cycling. By measuring sediment uptake or release to the water column, and the variation between rates in the light and dark, we can infer changes in microbial and algal uptake and transformation [75]. Similarly, the sediment–water column flux of oxygen in the light and dark can be used as a proxy for benthic ecosystem metabolism (carbon cycling) and microalgal gross primary production [76]. Each microcosm was filled completely with artificial freshwater and tightly sealed with a clear polycarbonate lid fitted with a rubber o-ring. The rubber stopper inserted into the sampling port in the center of the lid was fitted with a small swivel that held a magnetic stir bar. During the flux measurements, microcosms were placed around a central core tube fitted with a motorized magnetic stir bar that spun each small magnet at approximately 60 rpm in order to prevent the build-up of a diffusion gradient at the sediment interface. Microcosms were tightly wrapped with aluminum foil to create a dark environment for the first half of the experiment.
Samples were taken every two hours, with the first three measurements in the dark and the last two in the light. Oxygen concentrations were measured using a self-stirring dissolved oxygen probe (Hach LDO-BOD with HQ40D meter), and water samples were taken using a 60-cc syringe. Water removed during sampling was replaced with a known volume of artificial freshwater, and this dilution was accounted for in flux calculations. Water samples were immediately filtered through a 0.45 µm PES membrane filter and stored at −20 °C until analysis. Nitrate was analyzed using a vanadium-based method [77], ammonium was measured using the phenol-hypochlorite method [78], and phosphate was measured using the ammonium molybdate method [79]. Flux rates were calculated from the change in concentration over time [75], with daily rates based on the sum of light and dark measurements scaled to a 14:10 h light:dark diel cycle. Gross primary production (GPP) was calculated using the difference between the hourly oxygen flux in the light and dark, assuming respiration is the only oxygen-consuming process occurring in the dark.

2.4. Sediment Properties

The following day, sediments were sampled for oxygen penetration depth, benthic chlorophyll a (Chl a), sediment microbial community structure, and potential denitrification. Fecal mounds from tubificid worms were evident at the surface, likely from juveniles not removed during sediment preparation. Before destructive sampling, the number of fecal mounds was recorded. Following all destructive measures, the remaining sediment was sieved through a 1-mm mesh to isolate and quantify tubificid worms. The depth of oxygen penetration into the sediment was assessed based on the visible color change of the sediment (n = 3 depths averaged per microcosm). Sediment anoxic depth was measured similarly, using visual assessment of the different coloration (n = 5 depths averaged per microcosm). Benthic Chl a and microbial samples were taken in duplicate using clean 5-cc syringe corers to 1 cm depths and placed in 15 mL centrifuge tubes to be stored at −80 °C until further analysis. Syringe corers designated for sediment microbial samples were rinsed with 70% ethanol and allowed to dry before and between sampling to prevent contamination.
Chl a samples were immediately wrapped in aluminum foil to prevent light exposure, frozen at −80 °C, and analyzed within 30 d. Pigments were extracted by sonication in 90% acetone, followed by a 24 h extraction at −20 °C. Samples were then centrifuged, and absorbance of the supernatant was measured at 665 nm and 750 nm on a Shimadzu UV-1800 spectrometer (Shimadzu Scientific Instruments; Columbia, MD, USA). spectrophotometer before and after acidification using 1N HCl [80]. Chl a and phaeopigment concentrations were calculated using equations described by Lorenzen (1967) [81].

2.5. Potential Denitrification

Sediment for potential denitrification was collected using a 60-cc syringe corer to a depth of 2 cm, immediately placed in 50 mL centrifuge tubes, and refrigerated until the following day. Potential denitrification was measured using the acetylene inhibition method [82,83] in 160 mL serum bottles with septa lids. After adding 20 g of soil, 10 mL of sparged nanopure water and 10 mL of media (nitrate 100 mg 1 kg 1 + dextrose 40 mg 1 kg 1 + chloramphenicol 10 mg 1 kg 1 ), anaerobic conditions were ensured by flushing each serum bottle with N 2 gas for 3 cycles of 2 min each, shaking the bottles in-between flushes. Using a gas-tight syringe, 11 mL of acetylene was added to each bottle. Gas samples were taken immediately after adding acetylene and injected into an evacuated gas-tight vial. Bottles were placed on an orbital shaker (125 RPM), and additional samples were taken after 30, 60, and 120 min. Gas samples were analyzed using a Shimadzu Gas Auto Analyzer Gas Chromatograph (Shimadzu Scientific Instruments; Columbia, MD, USA). Potential denitrification rates were calculated based on the increase in N2O over time.

2.6. Microbial Community Structure

Bacterial community structure was evaluated using the Illumina 16S amplicon sequencing protocol [84,85]. Genomic DNA was extracted from soil samples using the DNeasy Powersoil Kit (Qiagen; Germantown, MD, USA) following the manufacturer’s protocol. Two µL genomic DNA from each sample was assessed for DNA concentration using a DNA High Sensitivity Kit on a Qubit 3.0 fluorometer (Thermo Fisher Scientific; Waltham, MA, USA) diluted to a concentration of 5 ng/µL in molecular grade nuclease free water, and 2.5 µL DNA from each extraction was used to amplify the variable 3 and 4 regions of the 16S rDNA using a GoTaq Green PCR (Promega Corporation; Madison, WI, USA) kit with the V3/V4 primers. Samples were then run on two 1% agarose gels to check for the presence of 16S rDNA V3/V4 amplicon at 550 bp. Then, 2.5 µL DNA at 5 ng/µL from each library was amplified with a KapHiFi PCR kit (Qiagen; Germantown, MD, USA), cleaned with AMPureXP (Beckman Coulter; Brea, CA, USA) beads, indexed using Illumina Nextera XT index adapters (Illumina; San Diego, CA, USA), and cleaned again with AMPureXP beads before checking for fragment size distribution using DNA 1000 chips on the Agilent 2100 bioanalyzer (Agilent Technologies; Santa Clara, CA, USA). Fragment size distribution and DNA concentrations from a final Qubit 3.0 check were combined to determine the molarity of sequencing-ready libraries, and libraries were diluted to a concentration of 4 nM. Samples were pooled, denatured, and diluted to a final loading concentration of 6 pM with a 10% PhiX spike-in. The pooled libraries were then run on an Illumina V3 (Illumina; San Diego, CA, USA). 600 cycle cartridge for 2 × 250 bp [84,85].
QIIME2-2022.8 software was used to demultiplex the 16S rRNA sequences in 29 samples (three samples were eliminated in the final analyses due to quality) [86], remove chimeras, and the final 8,140,642 sequences were denoised using the DADA2 1.22.0 plugin for QIIME2-2022.8 software [87]. The SILVA SSU 138.1 database was used to assign taxonomy and formatted by using RESCRIPt 2022.8.0 software [88,89]. Artifacts were converted into a phyloseq object using R-Studio 2020.03.01 and R version 4.2.3 [90,91,92] and then transformed into a ‘microtable’ for the Microeco 1.3.0 package [93]. All ASVs (amplicon sequence variants) not assigned to Archaea or Bacteria, and those assigned to “mitochondria” or “chloroplast” were removed. The ’tidy dataset’ function was used to trim the dataset to eliminate samples with 0 artifacts, and the ’microtable’ was rarefied to a sample size of 100,000 sequences per sample [94].

2.7. Statistical Analysis

Statistical analyses pertaining to metrics of ecosystem function (nutrient fluxes and sediment properties) were completed using JMP 15.0 Pro software; analysis of sediment microbial communities was completed using JMP Pro 16.0 software and RStudio 2020.03.01.
Prior to analysis, all data were assessed for normality and heterogeneity of variance to verify assumptions for analysis of variance (ANOVA). For the analysis of nutrient fluxes and sediment properties, one-way ANOVA was used to compare plastic types for all analyses, apart from ammonium and nitrate fluxes, and to compare the presence of worms among the different treatments. When significant effects were found (p-value ≤ 0.05), Dunnett’s post-hoc tests were used to identify if treatment groups differed significantly from the control. Ammonium and nitrate flux data could not be transformed before analysis to meet assumptions of ANOVA, and Kruskal–Wallis tests were used. Dunn’s tests were used to analyze if treatment groups differed significantly from the control group when significant effects were found. To compare hourly nutrient fluxes in the light and dark for each treatment, paired t-tests were used. To further evaluate the whole suite of biogeochemical variables, a principal component analysis (PCA) was run.
The relative abundance at the Kingdom, Phylum, Class, Order, Family, Genus, and Species levels was calculated, and data visualizations were performed in R using the ggplot2 package [95]. Here we present only results for Phylum and Family. The relative abundance of each family was compared using the non-parametric Kruskal–Wallis test to evaluate differences among treatments. When a difference was observed, post hoc evaluation was used to compare each treatment to the control using Dunn’s test with control for joint ranks. Diversity metrics for each plastic treatment and control were calculated using the Microeco package for R, including Total Observed Features, Faith’s Phylogenetic Diversity (PD), and Shannon (H’) Diversity Indices. Beta diversity analyses were performed in Microeco to evaluate community structure among treatments. Dissimilarity was visualized using non-metric multidimensional scaling and pair-wise Bray-Curtis dissimilarity estimates. The top metabolic functions (by percent) were determined using the FAPROTAX package in Microeco [93,96]. The relative abundance of each functional group was compared between each plastic type and the control using student’s t-test.

3. Results

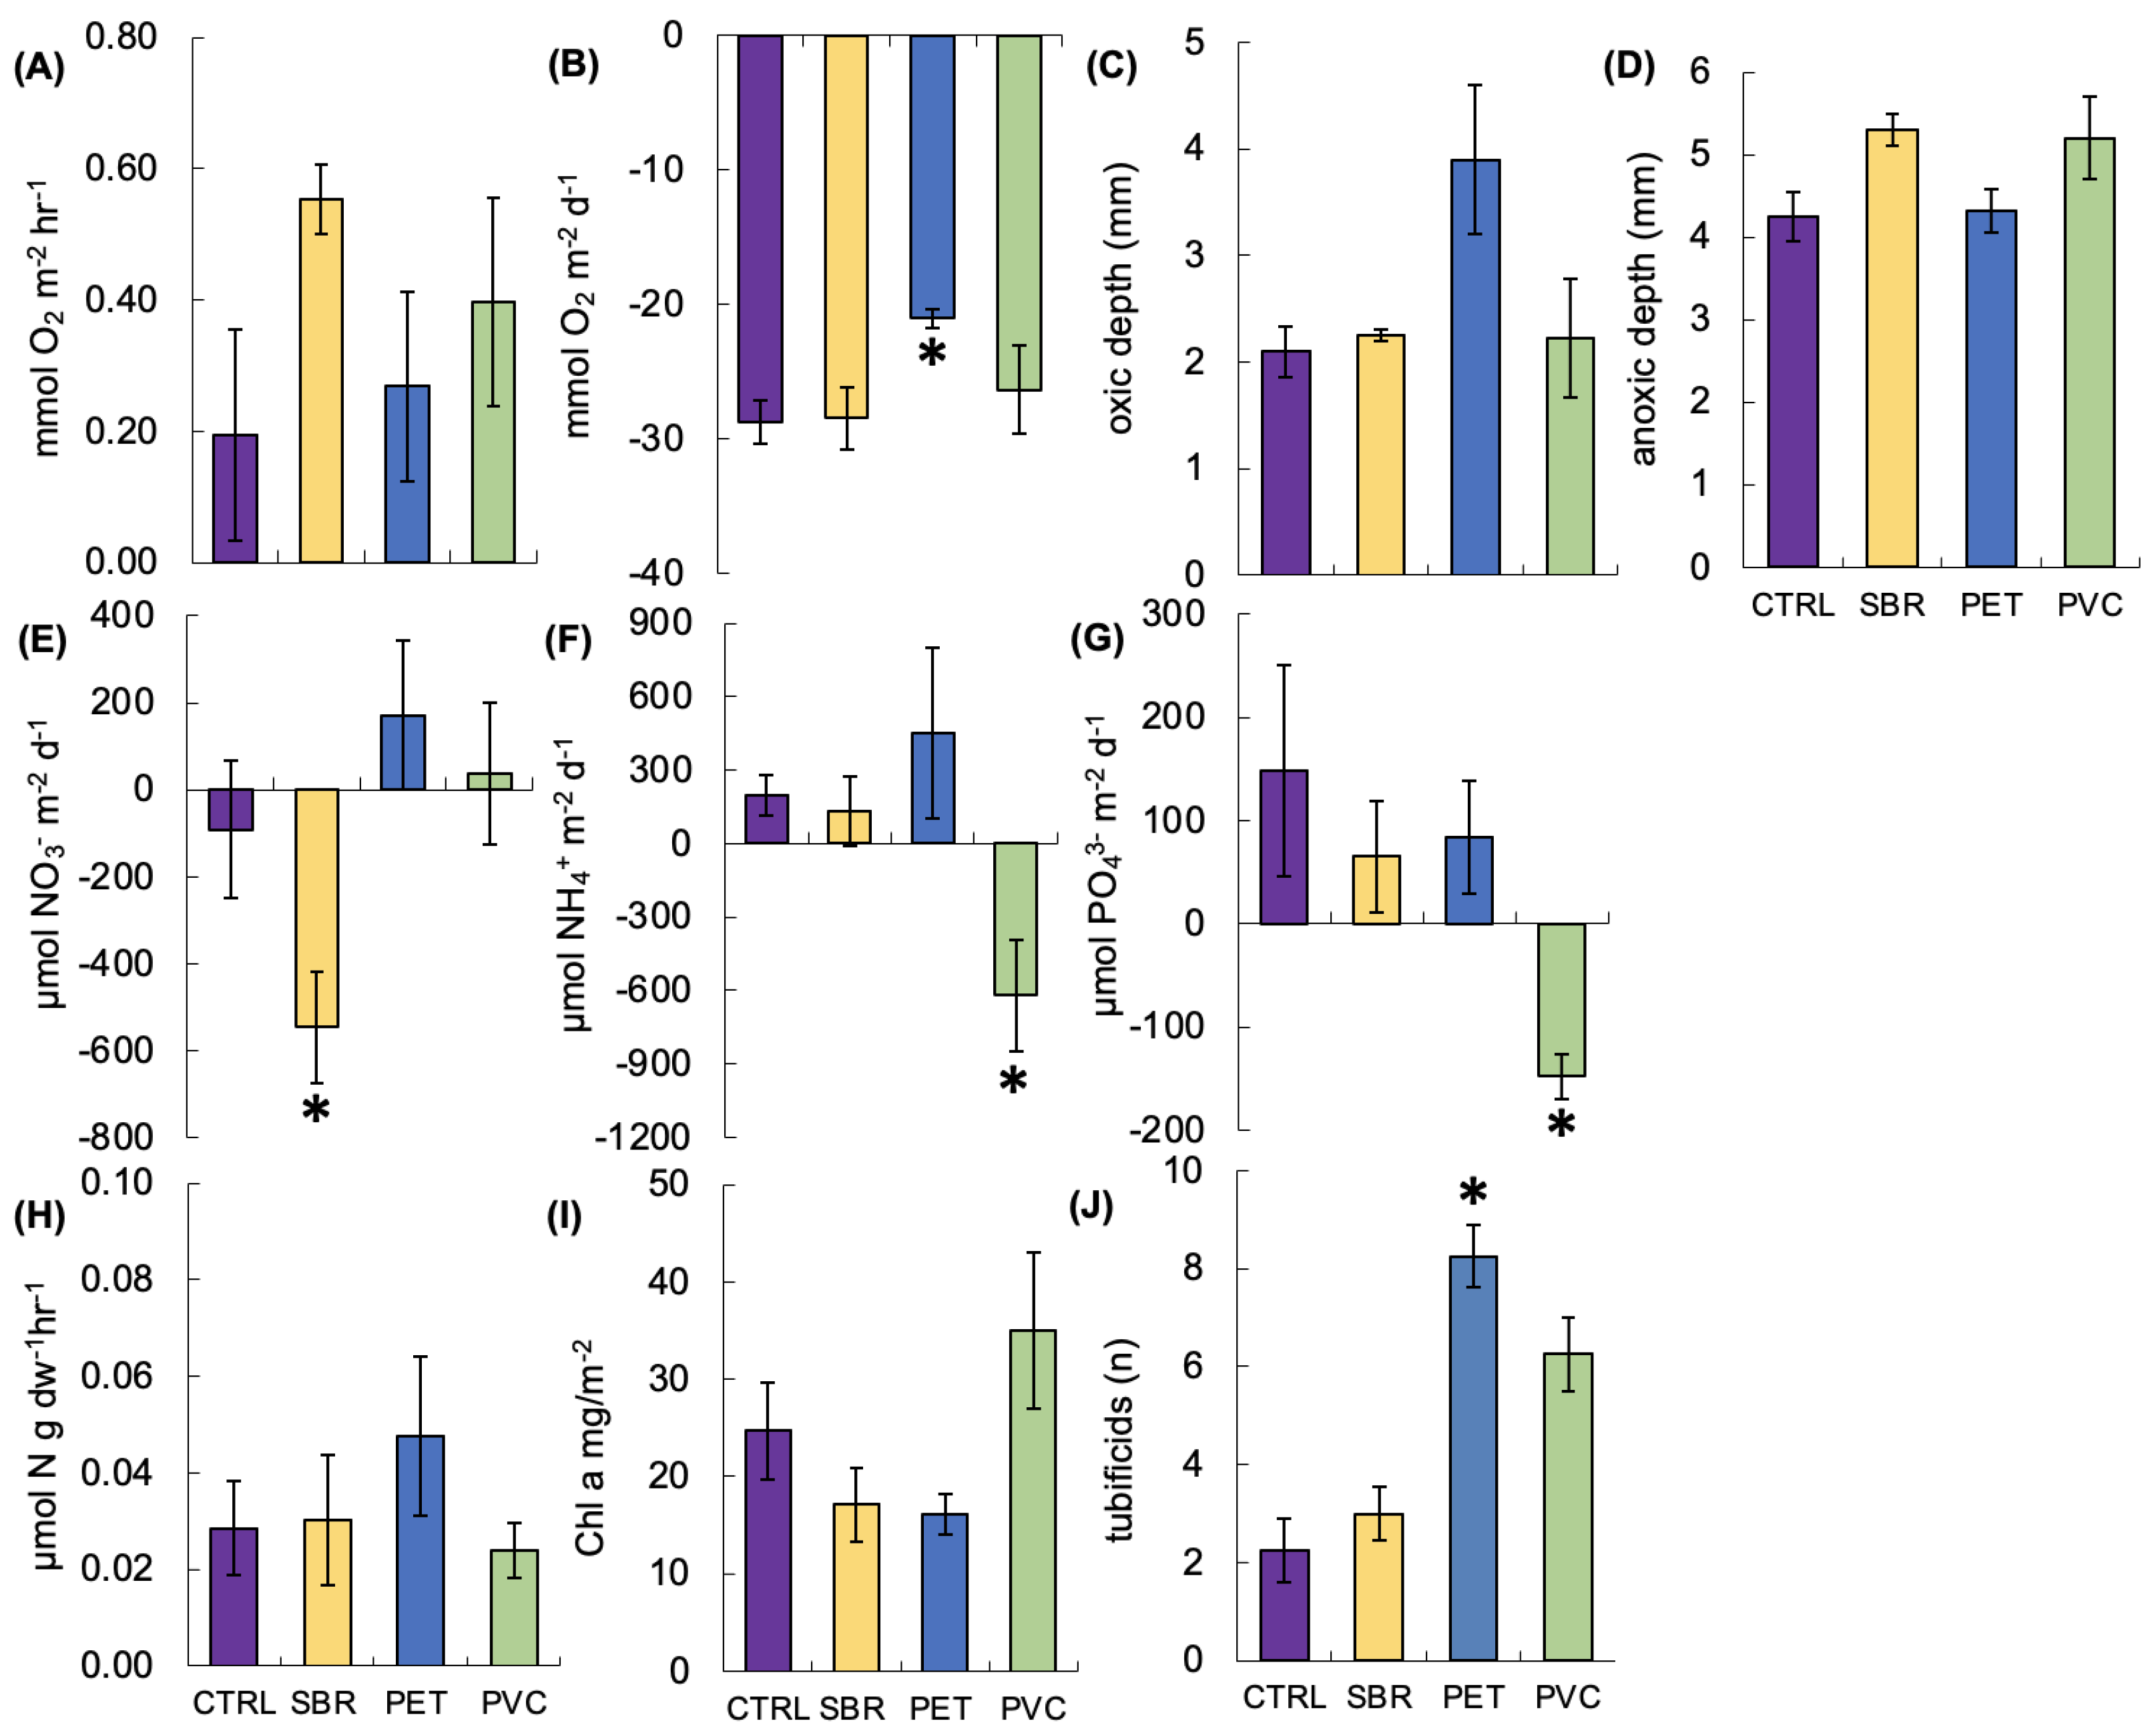
3.1. Nutrient Fluxes and Sediment Properties

Plastics significantly and uniquely impacted key ecosystem processes (Table 1 and Figure 1). While GPP did not differ among treatments (Table 1, Figure 1A, p = 0.31) and all sediments were net heterotrophic and generally similar, PET-containing sediments had a lower NEM than the control (Table 1, Figure 1B, p = 0.02). Along with decreased NEM, sediments containing PET had marginally deeper sediment oxygen penetration (Table 1, Figure 1C). Sediments containing plastic had a more developed and distinct anoxic layer beneath the oxidized surface layer, especially in treatments containing SBR and PVC (Table 1, Figure 1D).
The presence of SBR and PVC was also associated with unique effects on nutrient cycling: nitrate fluxes were negligible in all treatments except for SBR (Figure 1E, p = 0.04), and both ammonium (Figure 1F, p = 0.03) and phosphate (Figure 1G, p = 0.03) were released from the sediments to the water column in all treatments except for PVC, where sediment uptake was significant. Sediments containing PVC had decreased potential denitrification (Figure 1H; p = 0.58) and slightly higher benthic Chl a content (Figure 1I, p = 0.08). Tubificid worm abundance was substantially higher in PET treatments (Figure 1J, p = 0.01).
The impact of microalgal activity was demonstrated in some cases by differences in flux rates between light and dark. In control treatments only, the uptake of nitrate in the light was modestly higher than in the dark (p = 0.07). Ammonium uptake in the PVC treatment occurred only in the light, with release in the dark (Table 2, p = 0.08). No differences were observed between light and dark fluxes of phosphate (p > 0.1 for all).
The PCA resulted in two main components that together explained 49% of the data variability (28.7% Component 1; 20.3% Component 2). The biplot of the PCA shows distinct grouping based on the plastic type, with PVC and PET separating from the control and SBR treatments (Figure 2). PET separates primarily on Component 1, which is defined primarily by reduced NEM, a deeper oxic layer, and worm abundance (Table 3). PVC separates on Component 2, which is associated with high GPP and Chl a, and sediment uptake of ammonium and phosphate (Table 3).

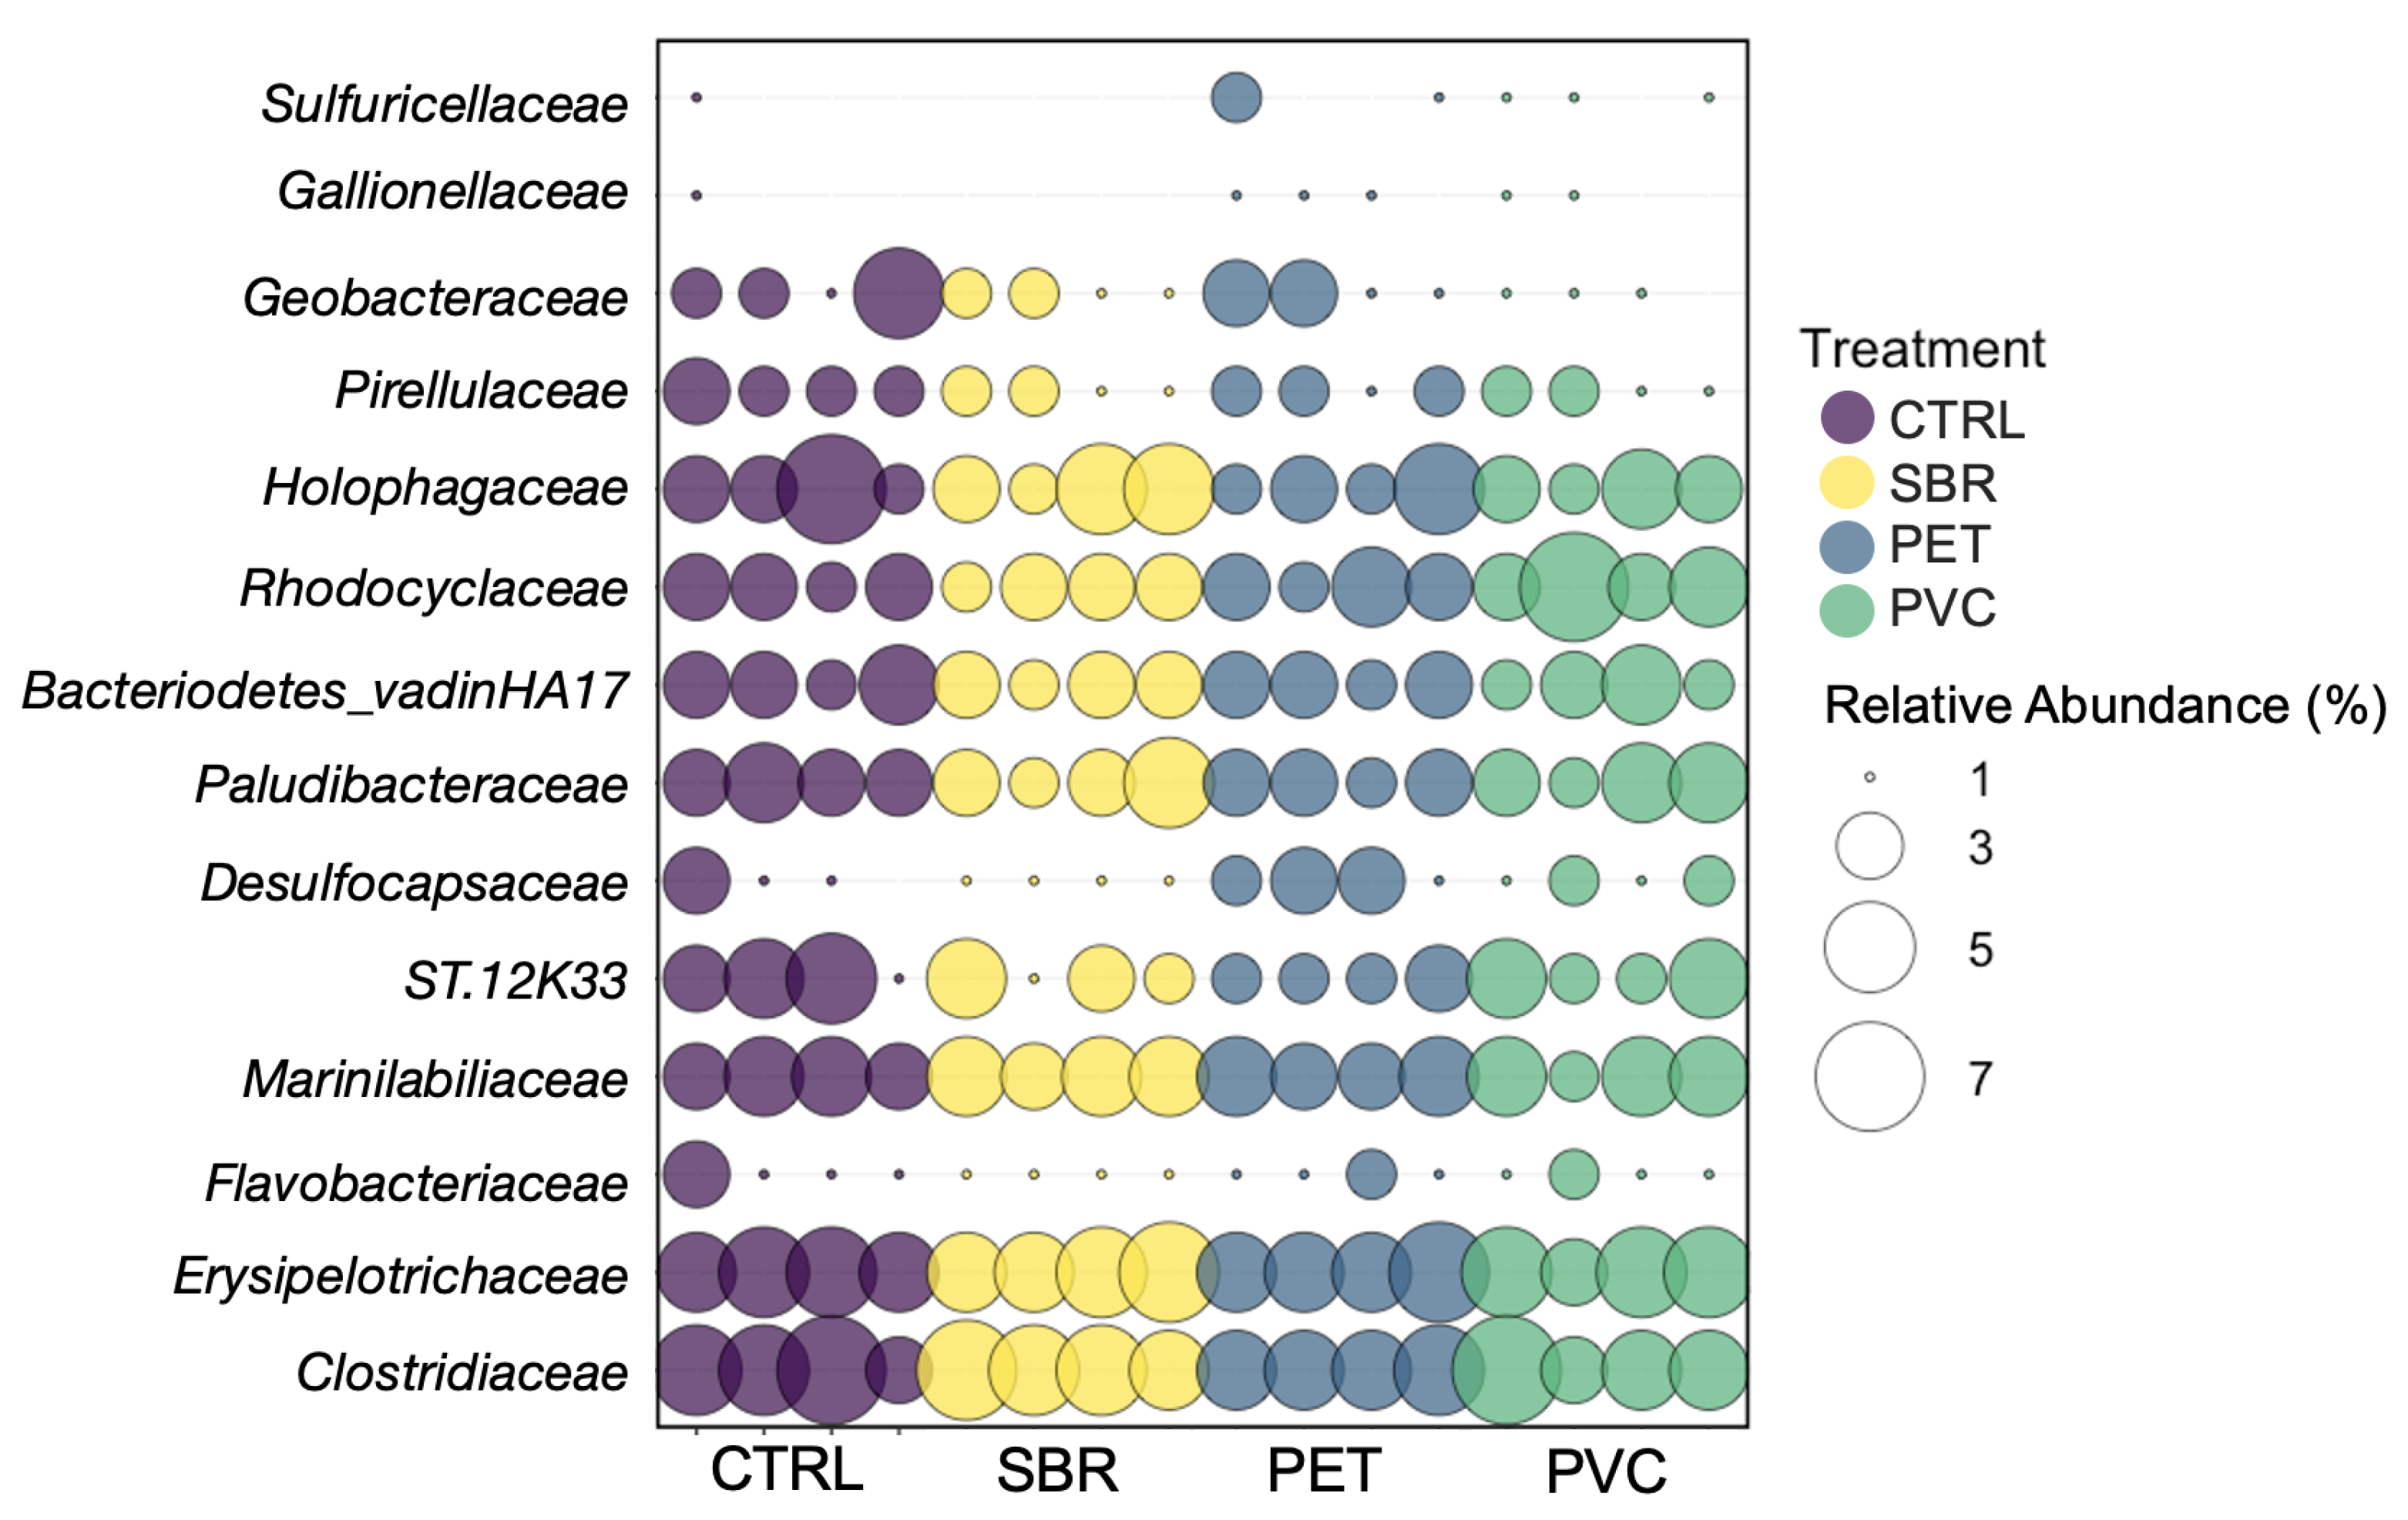
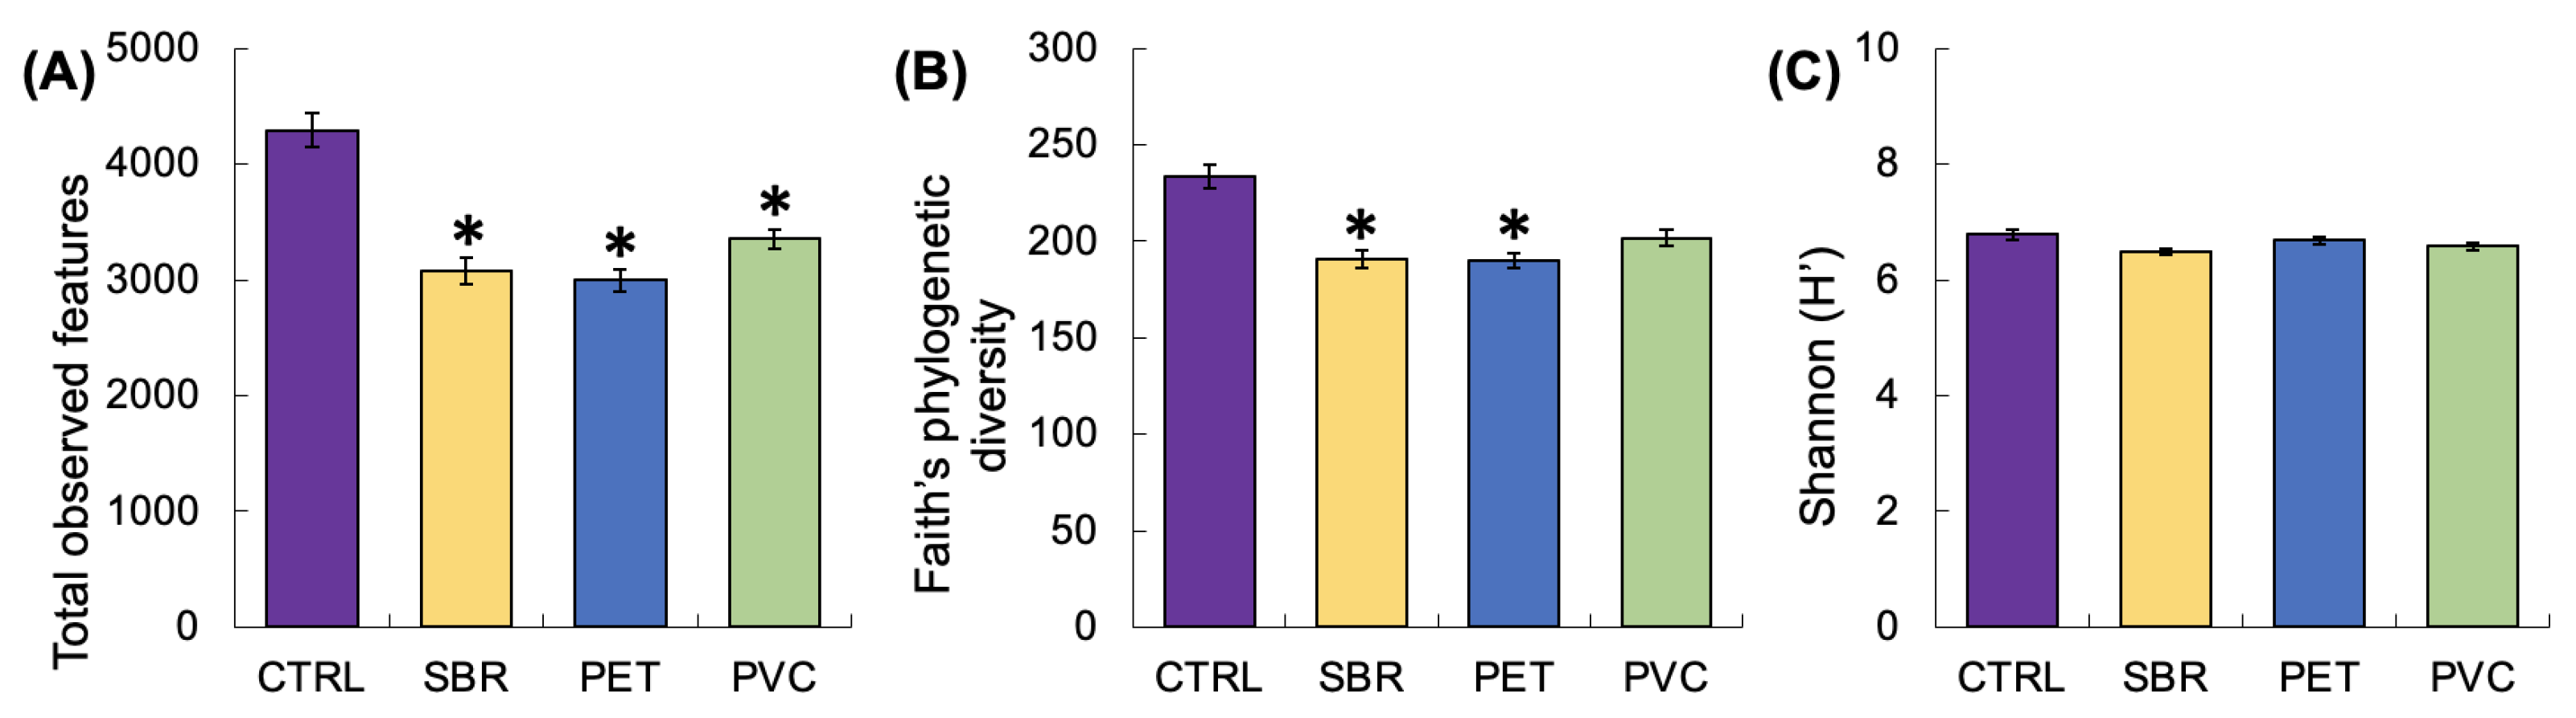
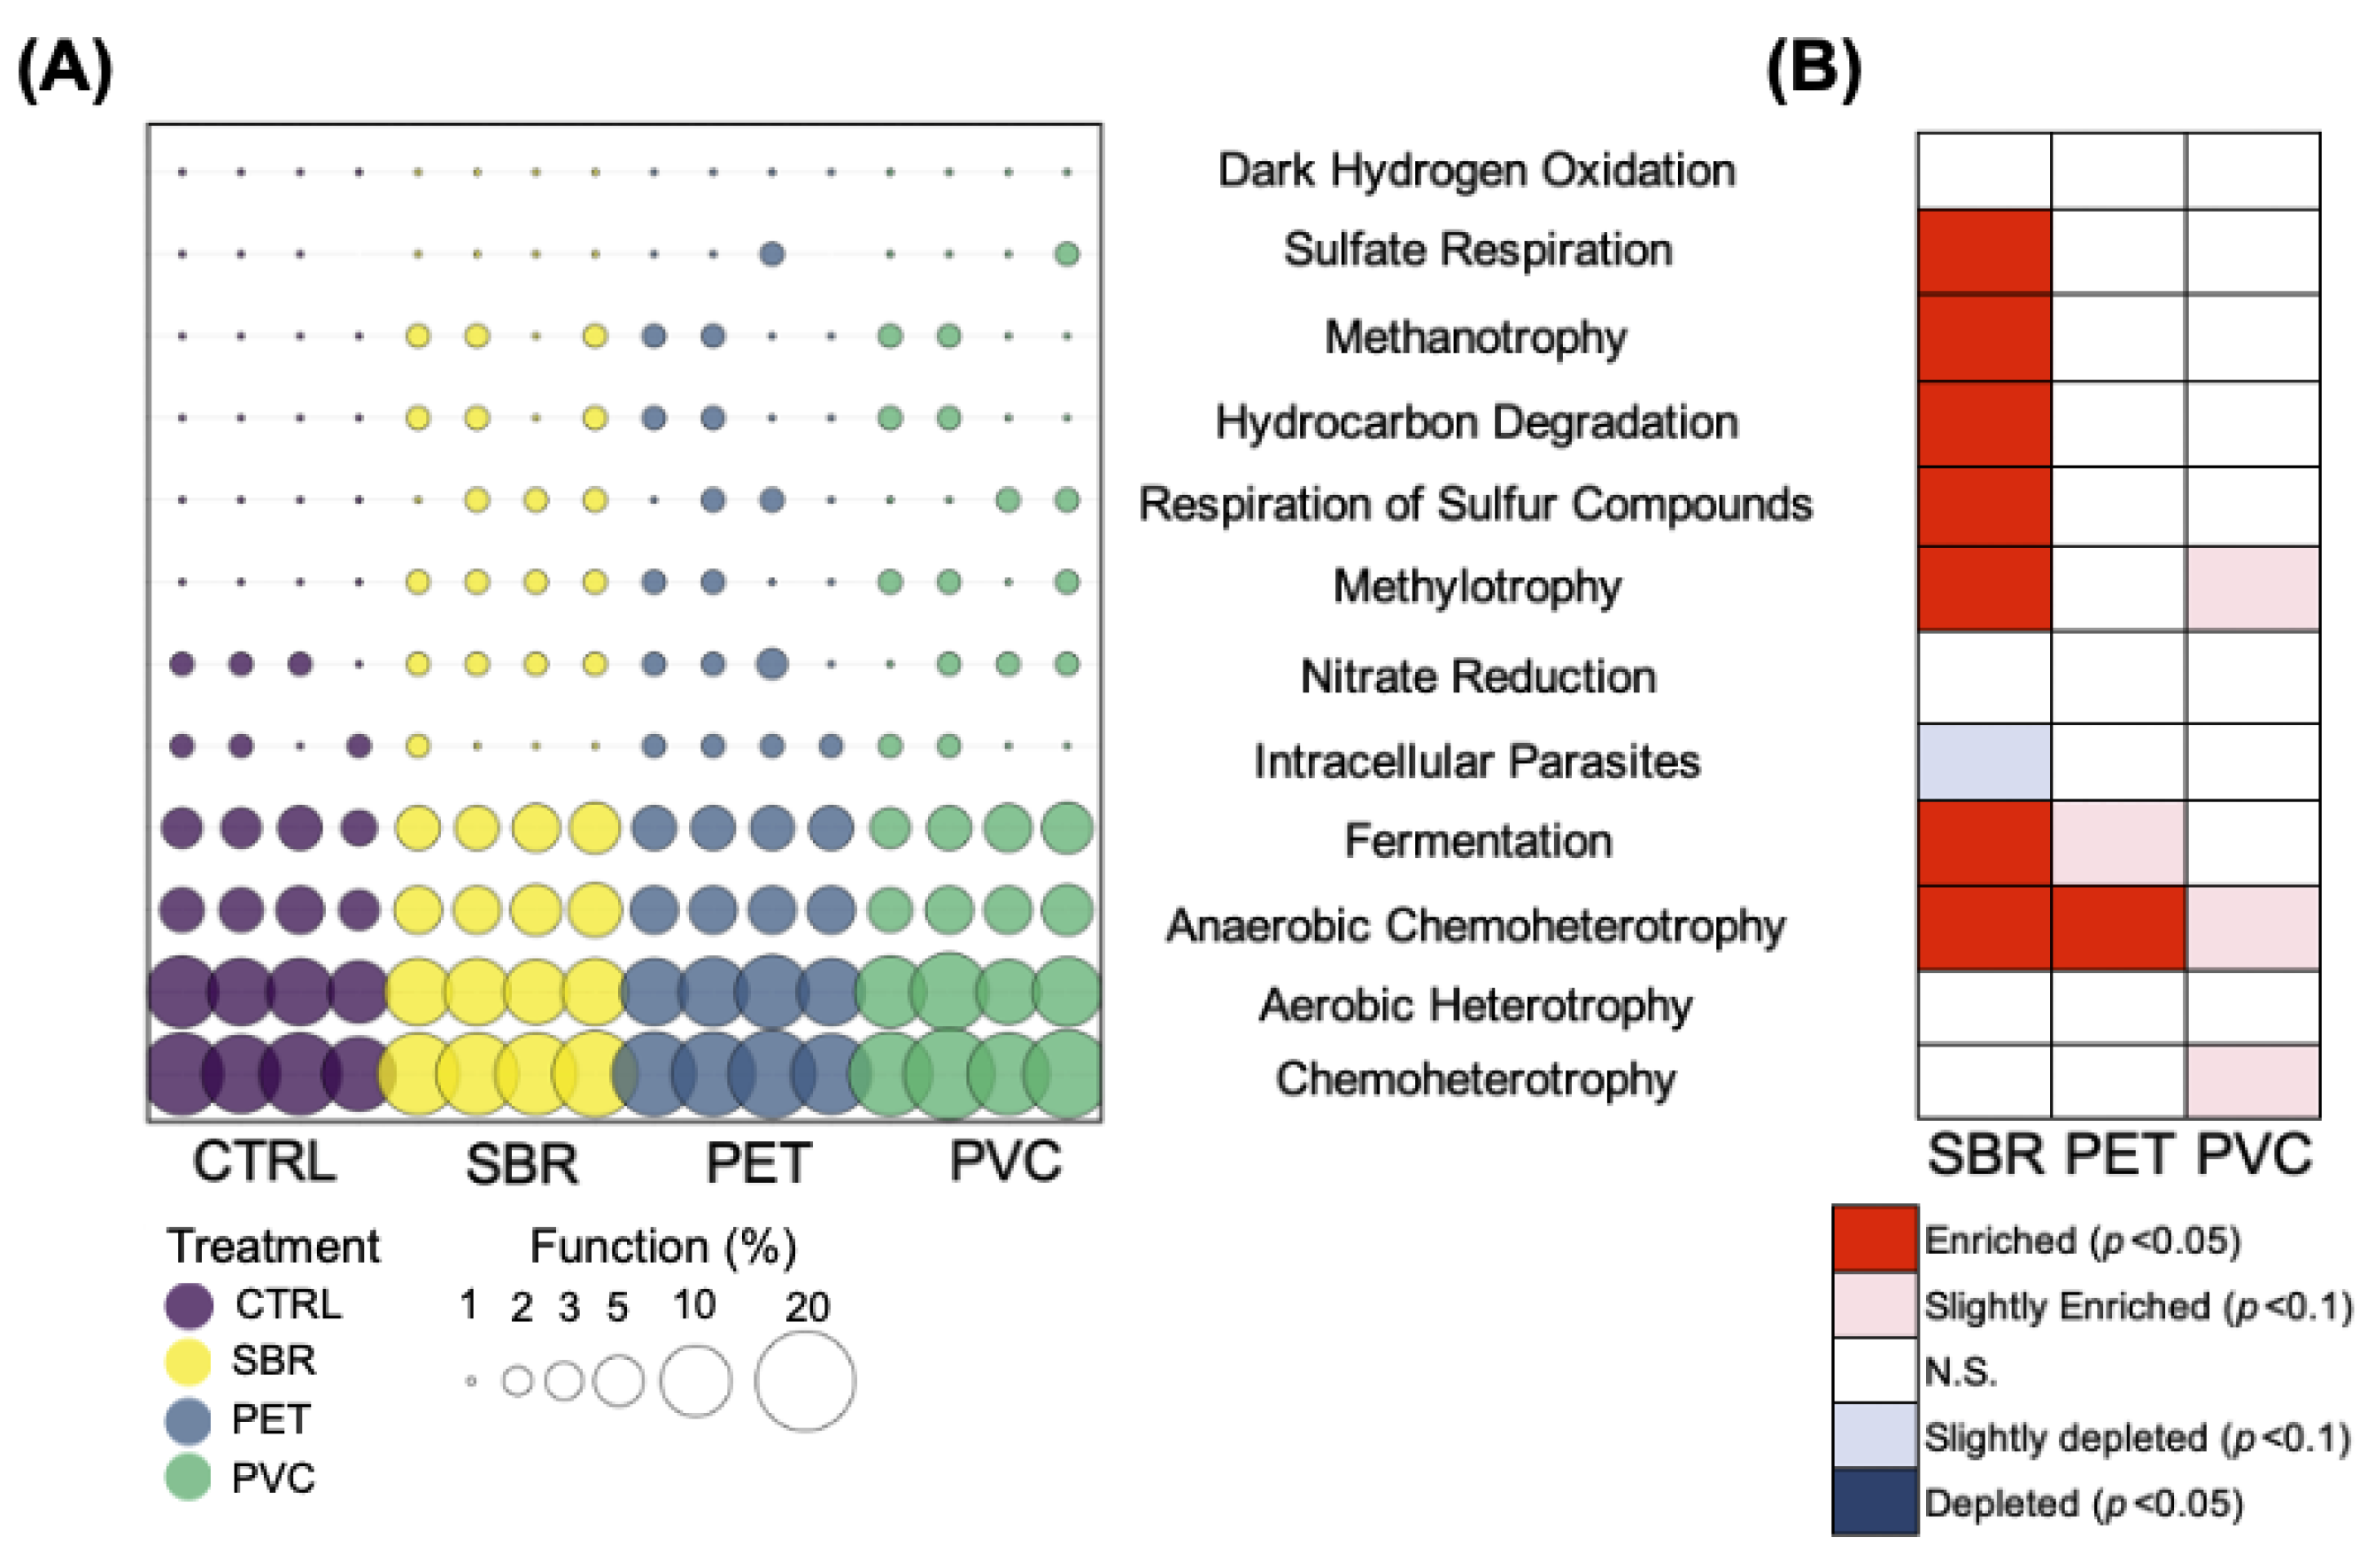
3.2. Microbial Community Structure: Diversity and Function

The analysis of relative abundance within the microbial community across different treatments at the taxonomic level of the family showed trends in microbial community structure within the three treatments compared to the control (Figure 3, Table S1). The families of Clostridiaceae and Erysipelotrichaceae in the phyla Firmicutes were consistent across all treatments (X 2 = 2.05 p = 0.56 and X 2 = 1.21 and p = 0.75), although both families were slightly higher (7–10%) in sediments containing SBR.
Desulfocapsaceae was slightly, but not significantly, greater than the control in PET treatments (X 2 = 3.07, p = 0.38).
Relative abundance of Rhodocyclaceae was also 52% higher in sediments containing PVC compared to the control and was the overall highest among the three treatments. While there were few differences among the individual families across treatments, the trends in alpha diversity were more clear.
Alpha diversity was reduced to some extent in all three polymer treatments relative to the control (Figure 4 and Table 4). Total observed features were 28 % to 43 % higher in the control compared to all plastic treatments, with sediments containing PET having the lowest value (F = 4.76, p < 0.01). While there was no difference in the Shannon index (H’) across treatments, Faith’s phylogenetic diversity was 16-23% greater in the control than SBR and PET, but not different from PVC (F = 4.76, p < 0.05) (Figure 4, Table S2).
Differences in specific metabolic functions may further reflect changes in community structure (Figure 5). Sediments containing SBR had the most notable differences in metabolic functions when compared to the control (p < 0.05), including greater sulfate reduction, methanotrophy, hydrocarbon degradation, respiration of sulfur compounds, methylotrophy, fermentation, and anaerobic chemoheterotrophy. PET treatments also demonstrated higher anaerobic chemoheterotrophy than the control (p < 0.05). PVC was slightly higher for anaerobic chemoheterotrophy and methylotrophy (p < 0.1).

4. Discussion

In this study, we show the unique impacts of three commonly encountered plastics on freshwater benthic ecosystem function, including primary production and nutrient cycling. While others have investigated the impacts of microplastics on freshwater ecosystem function [97,98,99,100,101], this is the first study, to our knowledge, to examine this specific set of diverse plastics under such a comprehensive combination of metrics in freshwater sediments, and the results point to a clear need for additional work to better understand the potential risk that microplastic poses to benthic ecosystems. The ubiquity of both use (i.e., PET clothing, tire debris from vehicles, and PVC in construction/tools) and the environmental presence of the polymers selected for this study suggest a broad applicability of the work and also highlight the extraordinary complexity of the “plastic problem”.
Each product has a characteristic chemical composition and set of physical properties that provide utility during the use phase and also give rise to the unique ecological impacts observed here. While the use of plastic polycarbonate tubing for sediment collection and containment of the microcosms could introduce confounding impacts, the divergent results observed here relative to the control also stored in these same tubes, seem to suggest that the polycarbonate tubing had negligible effects. Microbial diversity was reduced to varying degrees in all plastic treatments (Figure 4). Overall diversity, measured as total observed features (similar to species richness) was lower for all plastics. In addition, Faith’s PD, a measure of how each of the observed ASVs may be evolutionarily related to one another, was reduced with SBR and PET, suggesting a contraction in overall community structure and more similarity among microbes within each plastic-associated community [102,103]. The shift in the microbial community, combined with other direct and indirect effects on the benthos, led to distinct ecosystem characteristics and functions associated with each polymer. PET fibers altered ecosystem metabolism, whereas PVC altered nitrogen and phosphorus cycling. SBR enhanced sediment uptake of nitrate and fostered the most unique microbial community structure and function relative to all other treatments. These results provide deeper insight into the myriad ways plastic particles may alter the benthic environment and will help to inform risk assessment and policy interventions by highlighting which materials pose the greatest risk.

4.1. PET Impacts Ecosystem Metabolism

PET fibers, which separate on the first component of the PCA, shifted metabolism and increased oxygenation of surface sediments (Figure 2). In addition, there was an increase in anaerobic chemoheterotrophy (Figure 5), potentially related to sulfur metabolism associated with a minor shift in Desulfocapsaceae and Sulfuricellaceae (Figure 3). The substantial tubificid worm populations, found only in the microcosms containing PET (Figure 1I), likely contributed to the impact by mixing surface sediment and consuming organic matter. While the presence of invertebrates typically increases NEM [104,105,106,107,108,109,110], we suspect that bioturbation of surface sediments along with organic matter consumption during the 30 d experiment led to the exhaustion of organic matter reserves and ultimately reduced NEM and increased oxygen penetration. However, we also observed worms entangled in fibers, suggesting a strong direct interaction. Toxicity was not directly measured here; however, in other work, we observed both physical and chemical impacts of plastic on similar benthic species [111]. Here, we observed worms as a significant potential driver of the effects observed in PET microcosms (Figure 2). It is unclear whether physical interactions (entanglement) alone or in concert with chemical toxicity drove the combined direct and indirect effects of fibers on ecosystem function. Analysis of chemical additives in the polymers studied here identified three main additives in the PET, including two plasticizers (Bis(2-ethylhexyl)isophthalate; DEHP, and ethylhexyl thioglycolate) and the dye used to color the fabric orange (Coumarin 7). Both plasticizers identified have been noted as significant environmental and human toxins [112,113,114,115] and likely play a role in the impacts observed to tubificid worms. Given the critical role of benthic organisms as ecosystem engineers (e.g., [19]), an additional study investigating the mechanism of toxicity across polymers (i.e., morphology, chemical composition, ingestion, entanglement) is needed to fully understand the impact of plastic pollution in waterways.

4.2. PVC Impacts Nutrient Cycling

Measured ecosystem function in sediments containing PVC was most distinct from both the control and other plastic treatments, particularly in the enhancement of benthic nutrient uptake (Figure 1E,F). Greater uptake of ammonium in the presence of microplastic is consistent with findings in intertidal systems [116], but not other marine sediments [66]. PVC separates from other treatments on the second component of the PCA (Figure 2), where GPP and Chl a are positively loaded and phosphate and ammonium flux are negatively loaded (Figure 2). This suggests a link between benthic microalgal abundance and GPP and sediment nutrient uptake, which is further corroborated by the greater ammonium uptake in the light and release in the dark (Table 2). Combined, these results suggest a PVC-enhanced microalgal production and ammonium uptake. Alternatively, photosynthesis may create oxic zones that facilitate nitrification and also lead to the observed pattern in ammonium uptake. The increased uptake of ammonium and slight release of nitrate to the water column (relative to the control) is consistent with an increase in nitrification activity in freshwater sediment in the presence of PVC [35]. A third potential pathway for ammonium uptake is via anammox (anaerobic ammonium oxidation) in the anoxic layer, which was not assessed here. One route for increased microalgal production is through the provision of substrate for microalgal growth. Other explanations may include the role of additives leaching from PVC to the environment.
Prior studies also suggest that plastics have direct impacts on nitrogen cycling in sediments and soils [57,117,118,119] where the presence of PVC and accompanying suite of additives may further disrupt nitrogen removal. PVC is typically produced with a number of additives that have been shown to leach into the environment [120,121], presenting the potential for additional ecotoxicological impacts to microbial communities. For example, titanium dioxide is a common UV stabilizer and colorant used in plastic manufacturing [122], and a concerning emerging contaminant [123]. Titanium dioxide has negative impacts on nitrification and denitrification activity in soils [124], and may have contributed to the slightly suppressed denitrifying activity in the sediment containing PVC here. Our analysis of other additives (see Supplemental Information) did not uncover additional clues to support a clear explanation of drivers, suggesting a need for further evaluation of the impact of this very common material on aquatic ecosystems.

4.3. SBR Promotes Unique Microbial Communities

Sediments containing SBR had few measured functional changes, with only an increase in sediment nitrate uptake. However, this treatment had the greatest alteration in potential microbial function, with enhanced sulfate respiration/respiration of sulfur compounds, hydrocarbon degradation, methanotrophy, methylotrophy, fermentation, and anaerobic chemoheterotrophy (Figure 5). These results suggest a substantial shift in community structure, likely prompted by a change in organic and inorganic substrates. Our additives analysis revealed that the SBR used in this study features 12 branched hydrocarbons, and 12 long straight changed hydrocarbons; other hydrocarbons may be present but not detected with the methods used here. This enrichment of sediments with hydrocarbons may explain the enhanced hydrocarbon degradation. Several genera of microbes are known hydrocarbon degraders, including Acinetobacter, Pseudomonas, [125,126,127] and Claocibacterium are among the dominant hydrocarbon degraders found in aquatic systems, including freshwater [126]. Analysis at the phylum level (Supplemental Information, Figure S5) identified a greater presence of Firmicutes in sediments containing SBR, which may be attributed to the enhanced fermentation of hydrocarbons (Figure 5). There is growing evidence and concern surrounding the environmental impacts of SBR and similar rubbers used in turf fields and tire manufacturing [128,129,130,131,132]. Many of the additives present in materials like SBR are hazardous to aquatic life, particularly quinones [133,134,135,136]. Polycyclic aromatic hydrocarbons (PAHs), especially pyrenes, are also common chemicals released from rubbers [137]. Pyrene may enhance methylotrophy and methanol oxidation, and suppress nitrogen fixation and ammonia oxidation in soils [55]. We observed enhanced methylotrophy and uptake of nitrate by sediments perhaps promoted by suppressed ammonia oxidation. Pyrene may also suppress rare microbes [55], leading to the compression of the diversity illustrated by Faith’s PD (Figure 4). Further, many rubbers are vulcanized with sulfur to enhance elasticity. Microbes have long been investigated as a potential mechanism for the desulfurization of tire waste to promote reuse and recycling (e.g., [138]), and this enhancement of sulfur availability may also explain the impacts on sulfur and nitrogen cycling.

5. Conclusions

Plastics are a highly diverse group of materials that are critically important to modern society. The vast array of different polymers, each with unique ecological impacts, creates a complex environmental issue. This work provides a glimpse into the potential cascading environmental effects of plastic pollution in freshwater ecosystems and highlights the complexity and need to investigate the impacts of plastic pollution as a multi-faceted issue. Plastics cannot be treated equally when evaluating ecological risk and require a more targeted approach when generating policy. As plastic debris continues to enter the environment, understanding these unique differences among polymers and across systems will aid in developing more strategic and achievable policies surrounding plastic pollution in order to protect vital aquatic resources like the Great Lakes.

Supplementary Materials

The following supporting information can be found at: https://www.mdpi.com/article/10.3390/w16020348/s1. Figure S1: GCMS chromatogram of additives extracted from PET. Figure S2: GCMS chromatogram of additives extracted from SBR. Figure S3: GCMS chromatogram of additives extracted from PVC. Figure S4: NMDS of the Bray-Curtis dissimilarity distances for sediment microbial communities. Figure S5: Bubble graph depicting the relative abundances of the top 13 phyla. Table S1: Physical attributes and sourcing of plastics used in microcosm experiments. Table S2: Descriptions and statistical output of the relative abundance of microbial families compared across all treatment groups. Table S3: Descriptions and statistical output of microbial function percentages as compared to control sediments.

Author Contributions

Conceptualization, A.C.T. and K.M.C.; methodology, A.C.T., K.M.C., N.C.E. and S.W.D.; formal analysis, A.C.T., K.M.C., C.M.B. and W.A.O.-R.; resources, A.C.T., N.C.E. and A.O.H.; writing—original draft preparation, K.M.C.; writing—review and editing, A.C.T., K.M.C., W.A.O.-R., M.J.H., S.W.D. and N.C.E.; visualization, A.C.T. and K.M.C.; supervision, A.C.T.; funding acquisition, A.C.T., M.J.H., N.C.E., A.O.H. and S.W.D. All authors have read and agreed to the published version of the manuscript.

Funding

This publication is a product resulting from project R/CTP-55 funded under award NA18OAR4170096 from the National Sea Grant College Program of the U.S. Department of Commerce’s National Oceanic and Atmospheric Administration to the Research Foundation for the State University of New York on behalf of New York Sea Grant. The statements, findings, conclusions, views, and recommendations are those of the author(s) and do not necessarily reflect the views of any of those organizations. Additional funding was provided by the College of Science at the Rochester Institute of Technology (RIT) and the Thomas H. Gosnell School of Life Sciences (RIT).

Data Availability Statement

Biogeochemical data is available on Figshare under DOI (accessed 11 January 2024): https://doi.org/10.6084/m9.figshare.24983394. Microbial community data is available through NCBI BioProject PRJNA1063702 (accessed on 11 January 2024) at http://www.ncbi.nlm.nih.gov/bioproject/1063702.

Acknowledgments

We sincerely thank the New York Sea Grant College Program and National Oceanic and Atmospheric Administration along with the Thomas H. Gosnell School of Life Sciences and the College of Science at the Rochester Institute of Technology (RIT) for funding this work. We thank Raquel Diaz (RIT), Bre Pollard (RIT), Evan Squier (RIT), and Ben Hamilton (RIT) for their assistance in the lab, and Narayan Wong (RIT), Girish Kumar (RIT) and Elena Lopez-Peredo (RIT) for assistance with 16S amplicon sample processing and data analysis.

Conflicts of Interest

The authors declare no conflicts of interest. The funders had no role in the design of the study; in the collection, analyses, or interpretation of data; in the writing of the manuscript, or in the decision to publish the results.

References

  1. D’ambrières, W. Plastics recycling worldwide: Current overview and desirable changes. J. Field Actions 2019, 19, 12–21. [Google Scholar]
  2. Free, C.M.; Jensen, O.P.; Mason, S.A.; Eriksen, M.; Williamson, N.J.; Boldgiv, B. High-levels of microplastic pollution in a large, remote, mountain lake. Mar. Pollut. Bull. 2014, 85, 156–163. [Google Scholar] [CrossRef] [PubMed]
  3. Brandon, J.A.; Jones, W.; Ohman, M.D. Multidecadal increase in plastic particles in coastal ocean sediments. Sci. Adv. 2019, 5, eaax0587. [Google Scholar] [CrossRef] [PubMed]
  4. Hitchcock, J.N.; Mitrovic, S.M. Microplastic pollution in estuaries across a gradient of human impact. Environ. Pollut. 2019, 247, 457–466. [Google Scholar] [CrossRef] [PubMed]
  5. Firdaus, M.; Trihadiningrum, Y.; Lestari, P. Microplastic pollution in the sediment of Jagir Estuary, Surabaya City, Indonesia. Mar. Pollut. Bull. 2020, 150, 110790. [Google Scholar] [CrossRef] [PubMed]
  6. Ren, Z.; Gui, X.; Xu, X.; Zhao, L.; Qiu, H.; Cao, X. Microplastics in the soil-groundwater environment: Aging, migration, and co-transport of contaminants—A critical review. J. Hazard. Mater. 2021, 419, 126455. [Google Scholar] [CrossRef] [PubMed]
  7. Eriksen, M.; Lebreton, L.C.; Carson, H.S.; Thiel, M.; Moore, C.J.; Borerro, J.C.; Galgani, F.; Ryan, P.G.; Reisser, J. Plastic Pollution in the World’s Oceans: More than 5 Trillion Plastic Pieces Weighing over 250,000 Tons Afloat at Sea. PLoS ONE 2014, 9, e111913. [Google Scholar] [CrossRef]
  8. Baldwin, A.K.; Corsi, S.R.; Mason, S.A. Plastic Debris in 29 Great Lakes Tributaries: Relations to Watershed Attributes and Hydrology. Environ. Sci. Technol. 2016, 50, 10377–10385. [Google Scholar] [CrossRef]
  9. Great Lakes Commission. About the Lakes. Available online: https://www.glc.org/about/ (accessed on 11 January 2023).
  10. Hoffman, M.J.; Hittinger, E. Inventory and transport of plastic debris in the Laurentian Great Lakes. Mar. Pollut. Bull. 2017, 115, 273–281. [Google Scholar] [CrossRef]
  11. Daily, J.; Hoffman, M.J. Modeling the three-dimensional transport and distribution of multiple microplastic polymer types in Lake Erie. Mar. Pollut. Bull. 2020, 154, 111024. [Google Scholar] [CrossRef]
  12. Daily, J.; Tyler, A.C.; Hoffman, M.J. Modeling three-dimensional transport of microplastics and impacts of biofouling in Lake Erie and Lake Ontario. J. Great Lakes Res. 2022, 48, 1180–1190. [Google Scholar] [CrossRef]
  13. Driedger, A.G.; Dürr, H.H.; Mitchell, K.; Van Cappellen, P. Plastic debris in the Laurentian Great Lakes: A review. J. Great Lakes Res. 2015, 41, 9–19. [Google Scholar] [CrossRef]
  14. Cable, R.N.; Beletsky, D.; Beletsky, R.; Wigginton, K.; Locke, B.W.; Duhaime, M.B. Distribution and modeled transport of plastic pollution in the Great Lakes, the world’s largest freshwater resource. Front. Environ. Sci. 2017, 5, 45. [Google Scholar] [CrossRef]
  15. Zbyszewski, M.; Corcoran, P.L. Distribution and degradation of fresh water plastic particles along the beaches of Lake Huron, Canada. Water Air Soil Pollut. 2011, 220, 365–372. [Google Scholar] [CrossRef]
  16. Corcoran, P.L.; Norris, T.; Ceccanese, T.; Walzak, M.J.; Helm, P.A.; Marvin, C.H. Hidden plastics of Lake Ontario, Canada and their potential preservation in the sediment record. Environ. Pollut. 2015, 204, 17–25. [Google Scholar] [CrossRef]
  17. Ballent, A.; Corcoran, P.L.; Madden, O.; Helm, P.A.; Longstaffe, F.J. Sources and sinks of microplastics in Canadian Lake Ontario nearshore, tributary and beach sediments. Mar. Pollut. Bull. 2016, 110, 383–395. [Google Scholar] [CrossRef] [PubMed]
  18. Dean, B.Y.; Corcoran, P.L.; Helm, P.A. Factors in fl uencing microplastic abundances in nearshore, tributary and beach sediments along the Ontario shoreline of Lake Erie. J. Great Lakes Res. 2018, 44, 1002–1009. [Google Scholar] [CrossRef]
  19. Kuntz, K.L.; Tyler, A.C. Bioturbating invertebrates enhance decomposition and nitrogen cycling in urban stormwater ponds. J. Urban Ecol. 2018, 4, juy015. [Google Scholar] [CrossRef]
  20. Vinebrooke, R.D.; Cottingham, K.L.; Norberg, J.; Scheffer, M.; Dodson, S.I.; Maberly, S.C.; Sommer, U. Impacts of multiple stressors on biodiversity and ecosystem functioning: The role of species co-tolerance. Oikos 2004, 104, 451–457. [Google Scholar] [CrossRef]
  21. Hadley, K.R.; Paterson, A.M.; Hall, R.I.; Smol, J.P. Effects of multiple stressors on lakes in south-central Ontario: 15 years of change in lakewater chemistry and sedimentary diatom assemblages. Aquat. Sci. 2013, 75, 349–360. [Google Scholar] [CrossRef]
  22. Jackson, M.C.; Loewen, C.J.; Vinebrooke, R.D.; Chimimba, C.T. Net effects of multiple stressors in freshwater ecosystems: A meta-analysis. Glob. Chang. Biol. 2016, 22, 180–189. [Google Scholar] [CrossRef] [PubMed]
  23. Ponte, S.; Moore, E.A.; Border, C.T.; Babbitt, C.W.; Christina, A. Science of the Total Environment Fullerene toxicity in the benthos with implications for freshwater ecosystem services. Sci. Total Environ. 2019, 687, 451–459. [Google Scholar] [CrossRef] [PubMed]
  24. Huang, Y.; Zhao, Y.; Wang, J.; Zhang, M.; Jia, W.; Qin, X. LDPE microplastic films alter microbial community composition and enzymatic activities in soil. Environ. Pollut. 2019, 254, 112983. [Google Scholar] [CrossRef] [PubMed]
  25. Fei, Y.; Huang, S.; Zhang, H.; Tong, Y.; Wen, D.; Xia, X.; Wang, H.; Luo, Y.; Barceló, D. Response of soil enzyme activities and bacterial communities to the accumulation of microplastics in an acid cropped soil. Sci. Total Environ. 2020, 707, 135634. [Google Scholar] [CrossRef] [PubMed]
  26. Shi, J.; Sun, Y.; Wang, X.; Wang, J. Microplastics reduce soil microbial network complexity and ecological deterministic selection. Environ. Microbiol. 2022, 24, 2157–2169. [Google Scholar] [CrossRef] [PubMed]
  27. Zettler, E.R.; Mincer, T.J.; Amaral-Zettler, L.A. Life in the “plastisphere”: Microbial communities on plastic marine debris. Environ. Sci. Technol. 2013, 47, 7137–7146. [Google Scholar] [CrossRef] [PubMed]
  28. Oberbeckmann, S.; Osborn, A.M.; Duhaime, M.B. Microbes on a bottle: Substrate, season and geography influence community composition of microbes colonizing marine plastic debris. PLoS ONE 2016, 11, e0159289. [Google Scholar] [CrossRef]
  29. Rummel, C.D.; Jahnke, A.; Gorokhova, E.; Kühnel, D.; Schmitt-Jansen, M. Impacts of biofilm formation on the fate and potential effects of microplastic in the aquatic environment. Environ. Sci. Technol. Lett. 2017, 4, 258–267. [Google Scholar] [CrossRef]
  30. Oberbeckmann, S.; Kreikemeyer, B.; Labrenz, M. Environmental factors support the formation of specific bacterial assemblages on microplastics. Front. Microbiol. 2018, 8, 2709. [Google Scholar] [CrossRef]
  31. Oberbeckmann, S.; Labrenz, M. Marine Microbial Assemblages on Microplastics: Diversity, Adaptation, and Role in Degradation. Annu. Rev. Mar. Sci. 2020, 12, 209–232. [Google Scholar] [CrossRef]
  32. Rosato, A.; Barone, M.; Negroni, A.; Brigidi, P.; Fava, F.; Xu, P.; Candela, M.; Zanaroli, G. Microbial colonization of different microplastic types and biotransformation of sorbed PCBs by a marine anaerobic bacterial community. Sci. Total Environ. 2020, 705, 135790. [Google Scholar] [CrossRef] [PubMed]
  33. Bowley, J.; Baker-Austin, C.; Porter, A.; Hartnell, R.; Lewis, C. Oceanic Hitchhikers – Assessing Pathogen Risks from Marine Microplastic. Trends Microbiol. 2021, 29, 107–116. [Google Scholar] [CrossRef] [PubMed]
  34. Marsay, K.S.; Ambrosino, A.C.; Koucherov, Y.; Davidov, K.; Figueiredo, N.; Yakovenko, I.; Itzahri, S.; Martins, M.; Sobral, P.; Oren, M. The geographical and seasonal effects on the composition of marine microplastic and its microbial communities: The case study of Israel and Portugal. Front. Microbiol. 2023, 14, 1089926. [Google Scholar] [CrossRef] [PubMed]
  35. Mußmann, M.; Ribot, M.; von Schiller, D.; Merbt, S.N.; Augspurger, C.; Karwautz, C.; Winkel, M.; Battin, T.J.; Martí, E.; Daims, H. Colonization of freshwater biofilms by nitrifying bacteria from activated sludge. FEMS Microbiol. Ecol. 2013, 85, 104–115. [Google Scholar] [CrossRef] [PubMed]
  36. Dai, H.H.; Gao, J.F.; Wang, Z.Q.; Zhao, Y.F.; Zhang, D. Behavior of nitrogen, phosphorus and antibiotic resistance genes under polyvinyl chloride microplastics pressures in an aerobic granular sludge system. J. Clean. Prod. 2020, 256, 120402. [Google Scholar] [CrossRef]
  37. Kelly, J.J.; London, M.G.; McCormick, A.R.; Rojas, M.; Scott, J.W.; Hoellein, T.J. Wastewater treatment alters microbial colonization of microplastics. PLoS ONE 2021, 16, e0244443. [Google Scholar] [CrossRef] [PubMed]
  38. Ma, J.; Gong, Z.; Wang, Z.; Liu, H.; Chen, G.; Guo, G. Elucidating degradation properties, microbial community, and mechanism of microplastics in sewage sludge under different terminal electron acceptors conditions. Bioresour. Technol. 2022, 346, 126624. [Google Scholar] [CrossRef]
  39. McCormick, A.; Hoellein, T.J.; Mason, S.A.; Schluep, J.; Kelly, J.J. Microplastic is an abundant and distinct microbial habitat in an urban river. Environ. Sci. Technol. 2014, 48, 11863–11871. [Google Scholar] [CrossRef]
  40. Rochman, C.M.; Browne, M.A.; Underwood, A.J.; Van Franeker, J.A.; Thompson, R.C.; Amaral-Zettler, L.A. The ecological impacts of marine debris: Unraveling the demonstrated evidence from what is perceived. Ecology 2016, 97, 302–312. [Google Scholar] [CrossRef]
  41. Mendoza, L.M.R.; Jones, P.R. Characterisation of microplastics and toxic chemicals extracted from microplastic samples from the North Pacific Gyre. Environ. Chem. 2015, 12, 611. [Google Scholar] [CrossRef]
  42. Schönlau, C.; Larsson, M.; Lam, M.M.; Engwall, M.; Giesy, J.P.; Rochman, C.; Kärrman, A. Aryl hydrocarbon receptor-mediated potencies in field-deployed plastics vary by type of polymer. Environ. Sci. Pollut. Res. 2019, 26, 9079–9088. [Google Scholar] [CrossRef] [PubMed]
  43. Parthasarathy, A.; Tyler, A.C.; Hoffman, M.J.; Savka, M.A.; Hudson, A.O. Is Plastic Pollution in Aquatic and Terrestrial Environments a Driver for the Transmission of Pathogens and the Evolution of Antibiotic Resistance? Environ. Sci. Technol. 2019, 53, 1744–1745. [Google Scholar] [CrossRef] [PubMed]
  44. Khalid, N.; Aqeel, M.; Noman, A.; Hashem, M.; Mostafa, Y.S.; Abdulaziz, H.; Alhaithloul, S.; Alghanem, S.M. Chemosphere Linking effects of microplastics to ecological impacts in marine environments. Chemosphere 2021, 264, 128541. [Google Scholar] [CrossRef] [PubMed]
  45. Tu, C.; Liu, Y.; Li, L.; Li, Y.; Vogts, A.; Luo, Y.; Waniek, J.J. Structural and Functional Characteristics of Microplastic Associated Biofilms in Response to Temporal Dynamics and Polymer Types. Bull. Environ. Contam. Toxicol. 2021, 53, 1744–1745. [Google Scholar] [CrossRef] [PubMed]
  46. Wang, Z.; Gao, J.; Li, D.; Dai, H.; Zhao, Y. Co-occurrence of microplastics and triclosan inhibited nitrification function and enriched antibiotic resistance genes in nitrifying sludge. J. Hazard. Mater. 2020, 399, 123049. [Google Scholar] [CrossRef] [PubMed]
  47. Yi, M.; Zhou, S.; Zhang, L.; Ding, S. The effects of three different microplastics on enzyme activities and microbial communities in soil. Water Environ. Res. 2021, 93, 24–32. [Google Scholar] [CrossRef]
  48. Ya, H.; Xing, Y.; Zhang, T.; Lv, M.; Jiang, B. LDPE microplastics affect soil microbial community and form a unique plastisphere on microplastics. Appl. Soil Ecol. 2022, 180, 104623. [Google Scholar] [CrossRef]
  49. Shi, J.; Wang, Z.; Peng, Y.; Zhang, Z.; Fan, Z.; Wang, J.; Wang, X. Microbes drive metabolism, community diversity, and interactions in response to microplastic-induced nutrient imbalance. Sci. Total Environ. 2023, 877, 162885. [Google Scholar] [CrossRef]
  50. Frère, L.; Maignien, L.; Chalopin, M.; Huvet, A.; Rinnert, E.; Morrison, H.; Kerninon, S.; Cassone, A.L.; Lambert, C.; Reveillaud, J.; et al. Microplastic bacterial communities in the Bay of Brest: Influence of polymer type and size. Environ. Pollut. 2018, 242, 614–625. [Google Scholar] [CrossRef]
  51. Wagner, M.; Lambert, S. Freshwater Microplastics; Springer International Publishing: Berlin/Heidelberg, Germany, 2018; Volume 58. [Google Scholar] [CrossRef]
  52. Hu, H.; Jin, D.; Yang, Y.; Zhang, J.; Ma, C.; Qiu, Z. Distinct profile of bacterial community and antibiotic resistance genes on microplastics in Ganjiang River at the watershed level. Environ. Res. 2021, 200, 111363. [Google Scholar] [CrossRef]
  53. Mughini-Gras, L.; van der Plaats, R.Q.; van der Wielen, P.W.; Bauerlein, P.S.; de Roda Husman, A.M. Riverine microplastic and microbial community compositions: A field study in the netherlands. Water Res. 2021, 192, 116852. [Google Scholar] [CrossRef] [PubMed]
  54. Di Pippo, F.; Crognale, S.; Levantesi, C.; Vitanza, L.; Sighicelli, M.; Pietrelli, L.; Di Vito, S.; Amalfitano, S.; Rossetti, S. Plastisphere in lake waters: Microbial diversity, biofilm structure, and potential implications for freshwater ecosystems. Environ. Pollut. 2022, 310, 119876. [Google Scholar] [CrossRef] [PubMed]
  55. Zhang, L.; Yi, M.; Lu, P. Effects of pyrene on the structure and metabolic function of soil microbial communities. Environ. Pollut. 2022, 305, 119301. [Google Scholar] [CrossRef] [PubMed]
  56. Hoellein, T.; Rojas, M.; Pink, A.; Gasior, J.; Kelly, J. Anthropogenic litter in urban freshwater ecosystems: Distribution and microbial interactions. PLoS ONE 2014, 9, e98485. [Google Scholar] [CrossRef] [PubMed]
  57. Seeley, M.E.; Song, B.; Passie, R.; Hale, R.C. Microplastics affect sedimentary microbial communities and nitrogen cycling. Nat. Commun. 2020, 11, 2372. [Google Scholar] [CrossRef] [PubMed]
  58. Rochman, C.M.; Brookson, C.; Bikker, J.; Djuric, N.; Earn, A.; Bucci, K.; Athey, S.; Huntington, A.; McIlwraith, H.; Munno, K.; et al. Rethinking microplastics as a diverse contaminant suite. Environ. Toxicol. Chem. 2019, 38, 703–711. [Google Scholar] [CrossRef] [PubMed]
  59. Deng, H.; Wei, R.; Luo, W.; Hu, L.; Li, B.; Di, Y.; Shi, H. Microplastic pollution in water and sediment in a textile industrial area. Environ. Pollut. 2019, 258, 113658. [Google Scholar] [CrossRef]
  60. Lenaker, P.L.; Baldwin, A.K.; Corsi, S.R.; Mason, S.A.; Reneau, P.C.; Scott, J.W. Vertical Distribution of Microplastics in the Water Column and Surficial Sediment from the Milwaukee River Basin to Lake Michigan. Environ. Sci. Technol. 2019, 53, 12227–12237. [Google Scholar] [CrossRef]
  61. Peller, J.R.; Eberhardt, L.; Clark, R.; Nelson, C.; Kostelnik, E.; Iceman, C. Tracking the distribution of microfiber pollution in a southern Lake Michigan watershed through the analysis of water, sediment and air. Environ. Sci. Process. Impacts 2019, 21, 1549–1559. [Google Scholar] [CrossRef]
  62. Peller, J.; Nevers, M.B.; Byappanahalli, M.; Nelson, C.; Ganesh, B.; Anne, M.; Kostelnik, E.; Keller, M.; Johnston, J.; Shidler, S. Sequestration of micro fi bers and other microplastics by green algae, Cladophora, in the US Great Lakes. Environ. Pollut. 2021, 276, 116695. [Google Scholar] [CrossRef]
  63. Napper, I.E.; Thompson, R.C. Release of synthetic microplastic plastic fibres from domestic washing machines: Effects of fabric type and washing conditions. Mar. Pollut. Bull. 2016, 112, 39–45. [Google Scholar] [CrossRef] [PubMed]
  64. Li, L.; Song, K.; Yeerken, S.; Geng, S.; Liu, D.; Dai, Z.; Xie, F.; Zhou, X.; Wang, Q. Effect evaluation of microplastics on activated sludge nitrification and denitrification. Sci. Total Environ. 2020, 707, 135953. [Google Scholar] [CrossRef] [PubMed]
  65. Geyer, R.; Jambeck, J.R.; Law, K.L. Production, use, and fate of all plastics ever made. Sci. Adv. 2017, 3, e1700782. [Google Scholar] [CrossRef] [PubMed]
  66. Green, D.S.; Boots, B.; Sigwart, J.; Jiang, S.; Rocha, C. Effects of conventional and biodegradable microplastics on a marine ecosystem engineer (Arenicola marina) and sediment nutrient cycling. Environ. Pollut. 2016, 208, 426–434. [Google Scholar] [CrossRef] [PubMed]
  67. Sun, X.; Zhang, X.; Xia, Y.; Tao, R.; Zhang, M.; Mei, Y.; Qu, M. Simulation of the effects of microplastics on the microbial community structure and nitrogen cycle of paddy soil. Sci. Total Environ. 2022, 818, 151768. [Google Scholar] [CrossRef] [PubMed]
  68. Panko, J.M.; Kreider, M.L.; McAtee, B.L.; Marwood, C. Chronic toxicity of tire and road wear particles to water- and sediment-dwelling organisms. Ecotoxicology 2013, 22, 13–21. [Google Scholar] [CrossRef] [PubMed]
  69. Wagner, S.; Hüffer, T.; Klöckner, P.; Wehrhahn, M.; Hofmann, T.; Reemtsma, T. Tire wear particles in the aquatic environment—A review on generation, analysis, occurrence, fate and effects. Water Res. 2018, 139, 83–100. [Google Scholar] [CrossRef]
  70. Tamis, J.E.; Koelmans, A.A.; Dröge, R.; Kaag, N.H.B.M.; Keur, M.C.; Tromp, P.C.; Jongbloed, R.H. Environmental risks of car tire microplastic particles and other road runoff pollutants. Microplast. Nanoplast. 2021, 1, 10. [Google Scholar] [CrossRef]
  71. Chibwe, L.; Parrott, J.L.; Shires, K.; Khan, H.; Clarence, S.; Lavalle, C.; Sullivan, C.; O’Brien, A.M.; Silva, A.O.D.; Muir, D.C.; et al. A Deep Dive into the Complex Chemical Mixture and Toxicity of Tire Wear Particle Leachate in Fathead Minnow. Environ. Toxicol. Chem. 2022, 41, 1144–1153. [Google Scholar] [CrossRef]
  72. United States Environmental Protection Agency. Short-Term Methods for Estimating the Chronic Toxicity of Effluents and Receiving Waters to Freshwater Organisms, 4th ed.; Technical Report EPA-821-R-02-013; EPA: Washington, DC, USA, 2002; 335p. Available online: https://www.epa.gov/sites/default/files/2015-08/documents/short-term-chronic-freshwater-wet-manual_2002.pdf (accessed on 11 January 2024).
  73. National Centers for Environmental Information (NCEI). Climate Data Online. Available online: https://www.ncei.noaa.gov/cdo-web/ (accessed on 11 January 2024).
  74. Rani, M.; Shim, W.J.; Han, G.M.; Jang, M.; Al-Odaini, N.A.; Song, Y.K.; Hong, S.H. Qualitative analysis of additives in plastic marine debris and its new products. Arch. Environ. Contam. Toxicol. 2015, 69, 352–366. [Google Scholar] [CrossRef]
  75. Tyler, A.; McGlathery, K.; Anderson, I. Macroalgae Mediation of Dissolved Organic Nitrogen Fluxes in a Temperate Coastal Lagoon. Estuar. Coast. Shelf Sci. 2001, 53, 155–168. [Google Scholar] [CrossRef]
  76. McGlathery, K.J.; Anderson, I.C.; Tyler, A.C. Magnitude and variability of benthic and pelagic metabolism in a temperate coastal lagoon. Mar. Ecol. Prog. Ser. 2001, 216, 1–15. [Google Scholar] [CrossRef]
  77. Doane, T.A.; Horwáth, W.R. Spectrophotometric determination of nitrate with a single reagent. Anal. Lett. 2003, 36, 2713–2722. [Google Scholar] [CrossRef]
  78. Solorzano, L. Determination of Ammonia in Natural Waters by the Phenolhypochlorite Method 1 1 This research was fully supported by U.S. Atomic Energy Commission Contract No. ATS (11-1) GEN 10, P.A. 20. Limnol. Oceanogr. 1969, 14, 799–801. [Google Scholar] [CrossRef]
  79. Murphy, J.; Riley, J.P. A modified single solution method for the determination of phosphate in natural waters. Anal. Chim. Acta 1962, 27, 31–36. [Google Scholar] [CrossRef]
  80. Bogue, J.P.; Smith, L.F.; Lipsett, L. A Practical Handbook. J. High. Educ. 1957, 28, 405. [Google Scholar] [CrossRef]
  81. Lorenzen, C.J. Determination of Chlorophyll and Pheo-pigments: Spectrophotometric Equations. Limnol. Oceanogr. 1967, 12, 343–346. [Google Scholar] [CrossRef]
  82. Jarvis, S.C.; Hatch, D.J.; Lovell, R.D. An improved soil core incubation method for the field measurement of denitrification and net mineralization using acetylene inhibition. Nutr. Cycl. Agroecosyst. 2001, 59, 219–225. [Google Scholar] [CrossRef]
  83. Groffman, P.; Holland, E.; Myrold, D.D.; Robertson, G.P.; Zou, X. Denitrification. In Standard Soil Methods for Long-Term Ecological Research; Robertson, G.P., Bledsoe, C.S., Coleman, D.C., Sollins, P., Eds.; Oxford Press: New York, NY, USA, 1999; pp. 272–288. ISBN 9780195120837. [Google Scholar]
  84. Caporaso, J.G.; Lauber, C.L.; Walters, W.A.; Berg-Lyons, D.; Lozupone, C.A.; Turnbaugh, P.J.; Fierer, N.; Knight, R. Global patterns of 16S rRNA diversity at a depth of millions of sequences per sample. Proc. Natl. Acad. Sci. USA 2011, 108, 4516–4522. [Google Scholar] [CrossRef]
  85. Caporaso, J.G.; Lauber, C.L.; Walters, W.A.; Berg-Lyons, D.; Huntley, J.; Fierer, N.; Owens, S.M.; Betley, J.; Fraser, L.; Bauer, M.; et al. Ultra-high-throughput microbial community analysis on the Illumina HiSeq and MiSeq platforms. ISME J. 2012, 6, 1621–1624. [Google Scholar] [CrossRef]
  86. Bolyen, E.; Ram Rideout, J.; Dillon, M.R.; Bokulich, N.A.; Abnet, C.C.; Al-Ghalith, G.A.; Alexander, H.; Alm, E.J.; Arumugam, M.; Asnicar, F.; et al. Reproducible, interactive, scalable and extensible microbiome data science using QIIME 2. Nat. Biotechnol. 2019, 37, 852–857. [Google Scholar] [CrossRef] [PubMed]
  87. Callahan, B.J.; Sankaran, K.; Fukuyama, J.A.; McMurdie, P.J.; Holmes, S.P. Bioconductor Workflow for Microbiome Data Analysis: From raw reads to community analyses. F1000Research 2016, 5, 1492. [Google Scholar] [CrossRef] [PubMed]
  88. Quast, C.; Pruesse, E.; Yilmaz, P.; Gerken, J.; Schweer, T.; Yarza, P.; Peplies, J.; Glöckner, F.O. The SILVA ribosomal RNA gene database project: Improved data processing and web-based tools. Nucleic Acids Res. 2013, 41, D590–D596. [Google Scholar] [CrossRef] [PubMed]
  89. Robeson, M.S.; O’Rourke, D.R.; Kaehler, B.D.; Ziemski, M.; Dillon, M.R.; Foster, J.T.; Bokulich, N.A. RESCRIPt: Reproducible sequence taxonomy reference database management. PLoS Comput. Biol. 2021, 17, e1009581. [Google Scholar] [CrossRef] [PubMed]
  90. McMurdie, P.J.; Holmes, S. phyloseq: An R Package for Reproducible Interactive Analysis and Graphics of Microbiome Census Data. PLoS ONE 2013, 8, e61217. [Google Scholar] [CrossRef] [PubMed]
  91. R Core Team. R: A Language and Environment for Statistical Computing; R Core Team: Vienna, Austria, 2022. [Google Scholar]
  92. RStudio Team. RStudio: Integrated Development Environment for R; RStudio Team: Boston, MA, USA, 2022. [Google Scholar]
  93. Liu, C.; Cui, Y.; Li, X.; Yao, M. microeco: An R package for data mining in microbial community ecology. FEMS Microbiol. Ecol. 2021, 97, fiaa255. [Google Scholar] [CrossRef] [PubMed]
  94. Cameron, E.S.; Schmidt, P.J.; Tremblay, B.J.; Emelko, M.B.; Müller, K.M. Enhancing diversity analysis by repeatedly rarefying next generation sequencing data describing microbial communities. Sci. Rep. 2021, 11, 22302. [Google Scholar] [CrossRef]
  95. Wickham, H. Data analysis. In ggplot2; Springer: Berlin/Heidelberg, Germany, 2016; pp. 189–201. [Google Scholar]
  96. Louca, S.; Parfrey, L.W.; Doebeli, M. Decoupling function and taxonomy in the global ocean microbiome. Science 2016, 353, 1272–1277. [Google Scholar] [CrossRef]
  97. Baldwin, A.K.; Spanjer, A.R.; Rosen, M.R.; Thom, T. Microplastics in Lake Mead National Recreation Area, USA: Occurrence and biological uptake. PLoS ONE 2020, 15, e0228896. [Google Scholar] [CrossRef]
  98. Silva, C.J.; Machado, A.L.; Campos, D.; Rodrigues, A.C.; Patrício Silva, A.L.; Soares, A.M.; Pestana, J.L. Microplastics in freshwater sediments: Effects on benthic invertebrate communities and ecosystem functioning assessed in artificial streams. Sci. Total Environ. 2022, 804, 150118. [Google Scholar] [CrossRef]
  99. Nava, V.; Leoni, B. A critical review of interactions between microplastics, microalgae and aquatic ecosystem function. Water Res. 2021, 188, 116476. [Google Scholar] [CrossRef] [PubMed]
  100. López-Rojo, N.; Pérez, J.; Alonso, A.; Correa-Araneda, F.; Boyero, L. Microplastics have lethal and sublethal effects on stream invertebrates and affect stream ecosystem functioning. Environ. Pollut. 2020, 259, 113898. [Google Scholar] [CrossRef] [PubMed]
  101. Marchant, D.J.; Martínez Rodríguez, A.; Francelle, P.; Jones, J.I.; Kratina, P. Contrasting the effects of microplastic types, concentrations and nutrient enrichment on freshwater communities and ecosystem functioning. Ecotoxicol. Environ. Saf. 2023, 255, 114834. [Google Scholar] [CrossRef] [PubMed]
  102. Faith, D.P. Conservation evaluation and phylogenetic diversity. Biol. Conserv. 1992, 61, 1–10. [Google Scholar] [CrossRef]
  103. Faith, D.P.; Lozupone, C.A.; Nipperess, D.; Knight, R. The cladistic basis for the phylogenetic diversity (PD) measure links evolutionary features to environmental gradients and supports broad applications of microbial ecology’s “phylogenetic beta diversity” framework. Int. J. Mol. Sci. 2009, 10, 4723–4741. [Google Scholar] [CrossRef] [PubMed]
  104. Demars, B.O.L.; Kemp, J.L.; Marteau, B.; Friberg, N.; Thornton, B. Stream Macroinvertebrates and Carbon Cycling in Tangled Food Webs. Ecosystems 2021, 24, 1944–1961. [Google Scholar] [CrossRef]
  105. Frost, P.C.; Cross, W.F.; Benstead, J.P. Ecological stoichiometry in freshwater benthic ecosystems: An introduction. Freshw. Biol. 2005, 50, 1781–1785. [Google Scholar] [CrossRef]
  106. Covich, A.P.; Palmer, M.A.; Crowl, T.A. The Role of Benthic Invertebrate Species in Freshwater Ecosystems. BioScience 1999, 49, 119. [Google Scholar] [CrossRef]
  107. Covich, A.P.; Austen, M.C.; Bärlocher, F.; Chauvet, E.; Cardinale, B.J.; Biles, C.L.; Inchausti, P.; Dangles, O.; Solan, M.; Gessner, M.O.; et al. The Role of Biodiversity in the Functioning of Freshwater and Marine Benthic Ecosystems. BioScience 2004, 54, 767. [Google Scholar] [CrossRef]
  108. Prather, C.M.; Pelini, S.L.; Laws, A.; Rivest, E.; Woltz, M.; Bloch, C.P.; Del Toro, I.; Ho, C.; Kominoski, J.; Newbold, T.A.S.; et al. Invertebrates, ecosystem services and climate change. Biol. Rev. 2013, 88, 327–348. [Google Scholar] [CrossRef]
  109. Benke, A.C.; Huryn, A.D. Benthic invertebrate production—Facilitating answers to ecological riddles in freshwater ecosystems. J. N. Am. Benthol. Soc. 2010, 29, 264–285. [Google Scholar] [CrossRef]
  110. Wall Freckman, D.; Blackburn, T.H.; Brussaard, L.; Hutching, P.; Palmer, M.A.; Snelgrove, P. Linking Biodiversity and Ecosystem functioning of soils and sediments. Ambio 1997, 26, 556–562. [Google Scholar]
  111. Chomiak, K.M.; Eddingsaas, N.C.; Tyler, A.C. Direct and Indirect Impacts of Disposable Face Masks and Gloves on Freshwater Benthic Fauna and Sediment Biogeochemistry. Environ. Sci. Technol. Water 2023, 3, 51–59. [Google Scholar] [CrossRef]
  112. Kim, D.; Cui, R.; Moon, J.; Kwak, J.I.; An, Y.J. Soil ecotoxicity study of DEHP with respect to multiple soil species. Chemosphere 2019, 216, 387–395. [Google Scholar] [CrossRef] [PubMed]
  113. Weir, S.M.; Wooten, K.J.; Smith, P.N.; Salice, C.J. Phthalate ester leachates in aquatic mesocosms: Implications for ecotoxicity studies of endocrine disrupting compounds. Chemosphere 2014, 103, 44–50. [Google Scholar] [CrossRef] [PubMed]
  114. Li, X.; Wang, Q.; Wang, C.; Yang, Z.; Wang, J.; Zhu, L.; Zhang, D.; Wang, J. Ecotoxicological response of zebrafish liver (Danio rerio) induced by di-(2-ethylhexyl) phthalate. Ecol. Indic. 2022, 143, 109388. [Google Scholar] [CrossRef]
  115. Liang, J.; Ning, X.; Kong, M.; Liu, D.; Wang, G.; Cai, H.; Sun, J.; Zhang, Y.; Lu, X.; Yuan, Y. Elimination and ecotoxicity evaluation of phthalic acid esters from textile-dyeing wastewater. Environ. Pollut. 2017, 231, 115–122. [Google Scholar] [CrossRef]
  116. Cluzard, M.; Kazmiruk, T.N.; Kazmiruk, V.D.; Bendell, L.I. Intertidal Concentrations of Microplastics and Their Influence on Ammonium Cycling as Related to the Shellfish Industry. Arch. Environ. Contam. Toxicol. 2015, 69, 310–319. [Google Scholar] [CrossRef]
  117. Huang, S.; Guo, T.; Feng, Z.; Li, B.; Cai, Y.; Ouyang, D.; Gustave, W.; Ying, C.; Zhang, H. Polyethylene and polyvinyl chloride microplastics promote soil nitrification and alter the composition of key nitrogen functional bacterial groups. J. Hazard. Mater. 2023, 453, 131391. [Google Scholar] [CrossRef]
  118. Shen, H.; Sun, Y.; Duan, H.; Ye, J.; Zhou, A.; Meng, H.; Zhu, F.; He, H.; Gu, C. Effect of PVC microplastics on soil microbial community and nitrogen availability under laboratory-controlled and field-relevant temperatures. Appl. Soil Ecol. 2023, 184, 104794. [Google Scholar] [CrossRef]
  119. Lin, S.; Boegman, L.; Rao, Y.R.; Weis, J.S.; Hidalgo-Ruz, V.; Gutow, L.; Thompson, R.C.; Thiel, M.; Imhof, H.K.; Laforsch, C.; et al. PVC additives: A global review PVC compounds account for the greatest volume of plastics additives. Ron Babinsky, director Additives & Specialties with Townsend Polymers & Information, reviews the global market for PVC additives. Environ. Pollut. 2021, 6, 778–788. [Google Scholar] [CrossRef]
  120. Walter, R.K.; Lin, P.H.; Edwards, M.; Richardson, R.E. Investigation of factors affecting the accumulation of vinyl chloride in polyvinyl chloride piping used in drinking water distribution systems. Water Res. 2011, 45, 2607–2615. [Google Scholar] [CrossRef] [PubMed]
  121. Lithner, D.; Larsson, Å.; Dave, G. Science of the Total Environment Environmental and health hazard ranking and assessment of plastic polymers based on chemical composition. Sci. Total Environ. 2011, 409, 3309–3324. [Google Scholar] [CrossRef] [PubMed]
  122. Turner, A.; Filella, M. The role of titanium dioxide on the behaviour and fate of plastics in the aquatic environment. Sci. Total. Environ. 2023, 869, 161727. [Google Scholar] [CrossRef] [PubMed]
  123. Shah, S.N.A.; Shah, Z.; Hussain, M.; Khan, M. Hazardous Effects of Titanium Dioxide Nanoparticles in Ecosystem. Bioinorg. Chem. Appl. 2017, 2017, 4101735. [Google Scholar] [CrossRef] [PubMed]
  124. Simonin, M.; Richaume, A.; Guyonnet, J.P.; Dubost, A.; Martins, J.M.; Pommier, T. Titanium dioxide nanoparticles strongly impact soil microbial function by affecting archaeal nitrifiers. Sci. Rep. 2016, 6, 33643. [Google Scholar] [CrossRef] [PubMed]
  125. Kostka, J.E.; Prakash, O.; Overholt, W.A.; Green, S.J.; Freyer, G.; Canion, A.; Delgardio, J.; Norton, N.; Hazen, T.C.; Huettel, M. Hydrocarbon-degrading bacteria and the bacterial community response in Gulf of Mexico beach sands impacted by the deepwater horizon oil spill. Appl. Environ. Microbiol. 2011, 77, 7962–7974. [Google Scholar] [CrossRef]
  126. Jurelevicius, D.; Alvarez, V.M.; Marques, J.M.; Lima, L.R.F.d.S.; Dias, F.d.A.; Seldin, L. Bacterial community response to petroleum hydrocarbon amendments in freshwater, marine, and hypersaline water-containing microcosms. Appl. Environ. Microbiol. 2013, 79, 5927–5935. [Google Scholar] [CrossRef]
  127. Xu, X.; Liu, W.; Tian, S.; Wang, W.; Qi, Q.; Jiang, P.; Gao, X.; Li, F.; Li, H.; Yu, H. Petroleum Hydrocarbon-Degrading Bacteria for the Remediation of Oil Pollution Under Aerobic Conditions: A Perspective Analysis. Front. Microbiol. 2018, 9, 2885. [Google Scholar] [CrossRef]
  128. Armada, D.; Llompart, M.; Celeiro, M.; Garcia-Castro, P.; Ratola, N.; Dagnac, T.; de Boer, J. Global evaluation of the chemical hazard of recycled tire crumb rubber employed on worldwide synthetic turf football pitches. Sci. Total Environ. 2022, 812, 152542. [Google Scholar] [CrossRef]
  129. Cao, G.; Wang, W.; Zhang, J.; Wu, P.; Zhao, X.; Yang, Z.; Hu, D.; Cai, Z. New Evidence of Rubber-Derived Quinones in Water, Air, and Soil. Environ. Sci. Technol. 2022, 56, 4142–4150. [Google Scholar] [CrossRef] [PubMed]
  130. Armada, D.; Martinez-Fernandez, A.; Celeiro, M.; Dagnac, T.; Llompart, M. Assessment of the bioaccessibility of PAHs and other hazardous compounds present in recycled tire rubber employed in synthetic football fields. Sci. Total Environ. 2023, 857, 159485. [Google Scholar] [CrossRef] [PubMed]
  131. Fohet, L.; Andanson, J.M.; Charbouillot, T.; Malosse, L.; Leremboure, M.; Delor-Jestin, F.; Verney, V. Time-concentration profiles of tire particle additives and transformation products under natural and artificial aging. Sci. Total Environ. 2023, 859, 160150. [Google Scholar] [CrossRef] [PubMed]
  132. Zhao, H.N.; Hu, X.; Gonzalez, M.; Rideout, C.A.; Hobby, G.C.; Fisher, M.F.; McCormick, C.J.; Dodd, M.C.; Kim, K.E.; Tian, Z.; et al. Screening p-Phenylenediamine Antioxidants, Their Transformation Products, and Industrial Chemical Additives in Crumb Rubber and Elastomeric Consumer Products. Environ. Sci. Technol. 2023, 57, 2779–2791. [Google Scholar] [CrossRef] [PubMed]
  133. Hiki, K.; Asahina, K.; Kato, K.; Yamagishi, T.; Omagari, R.; Iwasaki, Y.; Watanabe, H.; Yamamoto, H. Acute Toxicity of a Tire Rubber-Derived Chemical, 6PPD Quinone, to Freshwater Fish and Crustacean Species. Environ. Sci. Technol. Lett. 2021, 8, 779–784. [Google Scholar] [CrossRef]
  134. Tian, Z.; Zhao, H.; Peter, K.T.; Gonzalez, M.; Wetzel, J.; Wu, C.; Hu, X.; Prat, J.; Mudrock, E.; Hettinger, R.; et al. A ubiquitous tire rubber-derived chemical induces acute mortality in coho salmon. Science 2022, 371, 185–189, Erratum in Science 2022, 375, 185–189. [Google Scholar] [CrossRef] [PubMed]
  135. Varshney, S.; Gora, A.H.; Siriyappagouder, P.; Kiron, V.; Olsvik, P.A. Toxicological effects of 6PPD and 6PPD quinone in zebrafish larvae. J. Hazard. Mater. 2022, 424, 127623. [Google Scholar] [CrossRef]
  136. Brinkmann, M.; Montgomery, D.; Selinger, S.; Miller, J.G.; Stock, E.; Alcaraz, A.J.; Challis, J.K.; Weber, L.; Janz, D.; Hecker, M.; et al. Acute Toxicity of the Tire Rubber-Derived Chemical 6PPD-quinone to Four Fishes of Commercial, Cultural, and Ecological Importance. Environ. Sci. Technol. Lett. 2022, 9, 333–338. [Google Scholar] [CrossRef]
  137. Sadiktsis, I.; Bergvall, C.; Johansson, C.; Westerholm, R. Automobile Tires—A Potential Source of Highly Carcinogenic Dibenzopyrenes to the Environment. Environ. Sci. Technol. 2012, 46, 3326–3334. [Google Scholar] [CrossRef]
  138. Torma, A.; Raghavan, D. Biodesulfurization of Rubber Materials; Technical Report; EG and G Idaho, Inc.: Idaho Falls, ID, USA, 1990. [Google Scholar]
Figure 1. Gross primary production (GPP; A); net ecosystem metabolism (NEM; B); sediment oxygen penetration (C); sediment anoxic depth (D); daily sediment–water column fluxes for NO 3 (E); NH 4 + (F); and PO 4 3 (G); potential denitrification (H), benthic microalgal Chl a (I), and tubificid worm abundance (J), measured after 30 d. Values are mean ± SE, n = 4. Negative flux values indicate the uptake of the solute by the sediments. Asterisks represent significant differences compared to the control based on post hoc testing.
Water 16 00348 g001
Figure 2. Biplot of factor scores from two strongest principal components. Components 1 and 2 explain 28.7% and 20.3% of variability in the data, respectively.
Water 16 00348 g002
Figure 3. Bubble graph depicting relative abundances of the top 14 bacterial families among the four treatments. The size of the bubble is proportional to the relative abundance of each bacterial family, indicated by the relative abundance legend.
Water 16 00348 g003
Figure 4. Alpha diversity including total observed features (A), Faith’s phylogenetic diversity (B), and Shannon’s diversity (C). Asterisks indicate significant differences from the control identified in Dunnett’s post-hoc tests.
Water 16 00348 g004
Figure 5. Top 12 metabolic function inferred from taxonomic analyses represented by bubble plots depicting the relative proportion of functional attributes across the four treatments (A); heat map illustrating the statistical significance for functional enrichment (red) or depletion (blue) compared to the control sediments (B).
Water 16 00348 g005
Table 1. Results of one-way analysis of variance or Kruskal–Wallis tests examining the effect of plastic on net ecosystem metabolism (NEM), gross primary production (GPP), sediment oxygen penetration (oxic depth), sediment anoxic depth (anoxic depth), daily fluxes of nitrate, ammonium and phosphate, colonization of sediments by tubificid worms (Worm Count), microalgal chlorophyll a (Chl a) content, and potential denitrification (PDNF). Significant effects (p < 0.05) are bolded. Values with asterisks indicate a Chi-square value from Kruskal–Wallis tests used for non-parametric data. All degrees of freedom are 3.
VariablePlastic Type
F/X 2 p
GPP1.320.31
NEM4.970.02
Oxic Depth3.380.05
Anoxic Depth2.820.08
Daily NO 3 7.91 *0.04
Daily NH 4 + 8.930.03
Daily PO 4 3 3.93 *0.03
PDNF2.840.58
Chl a2.840.08
Worm Count5.590.01
Table 2. Hourly fluxes of nitrate (μmol m−2 h 1 ), ammonium (μmol m−2 h−1), phosphate (μmol m−2 h−1) in the light and dark after 30 day incubations (mean ± SE, n = 4). Negative values indicate the uptake of the solute by the sediments. Values in bold are significantly different between light and dark at p < 0.1.
VariableLightCTRLSBRPETPVC
NO 3 Light−43.8 ± 18.3−24.6 ± 14.026.4 ± 9.7−23.6 ± 12.5
Dark52.1 ± 17.5−20.2 ± 27.7−19.9 ± 23.136.8 ± 24.4
NH 4 + Light−7.1 ± 12.621.3 ± 11.69.1 ± 20.0−68.0 ± 31.7
Dark29.9 ± 13.7−16.5 ± 8.730.7 ± 10.233.2 ± 24.3
PO 4 3 Light11.6 ± 9.16.1 ± 5.49.7 ± 4.6−2.9 ± 1.3
Dark3.9 ± 3.31.7 ± 4.50.5 ± 4.6−7.0 ± 1.3
Table 3. Factor loading for the first two Principal Components.
VariableComponent 1Component 2
NEM0.420.28
GPP−0.070.44
Oxic Depth0.450.33
Daily NO 3 0.230.30
Daily NH 4 + 0.38−0.37
Daily PO 4 3 0.23−0.38
PDNF0.18−0.20
Chl a−0.180.45
Worm Count0.540.07
Table 4. Results of one-way analysis of variance examining three different alpha diversity indices of microbial communities identified in each treatment group. All degrees of freedom are 3. Values in bold indicate significant differences at p < 0.05.
Diversity IndexFp
Total observed features7.060.005
Faith’s phylogenetic diversity4.760.02
Shannon index (H’)0.830.50
Disclaimer/Publisher’s Note: The statements, opinions and data contained in all publications are solely those of the individual author(s) and contributor(s) and not of MDPI and/or the editor(s). MDPI and/or the editor(s) disclaim responsibility for any injury to people or property resulting from any ideas, methods, instructions or products referred to in the content.

