Article

The Impact of Vegetation Types on Soil Hydrological and Mechanical Properties in the Hilly Regions of Southern China: A Comparative Analysis

1
Engineering Research Center of Watershed Carbon Neutralization, Ministry of Education, Jiangxi Institute of Ecological Civilization, Nanchang University, Nanchang 330031, China
2
Three-Gorges Reservoir Area (Jinyun Mountain, Chongqing) Forest Ecosystem National Observation and Research Station, Chongqing 400700, China
*
Author to whom correspondence should be addressed.
Water 2024, 16(2), 350; https://doi.org/10.3390/w16020350
Submission received: 25 December 2023 / Revised: 11 January 2024 / Accepted: 16 January 2024 / Published: 20 January 2024
(This article belongs to the Special Issue Remote Sensing-Based Study on Surface Water Environment)

Abstract

:
Background: Vegetation roots are considered to play an effective role in controlling soil erosion by benefiting soil hydrology and mechanical properties. However, the correlation between soil hydrology and the mechanical features associated with the variation root system under different vegetation types remains poorly understood. Methods: We conducted dye-tracer infiltration to classify water flow behavior and indoor experiments (including tests on soil bulk density, soil organic carbon, mean weight diameter, soil cohesion, root density, etc.) to interpret variation patterns in three forest systems (coniferous and broad-leaved mixed forest, CBF; coniferous forest, CF; Phyllostachys edulis, PF) and fallow land (FL). Results: Based on the soil dye-tracer infiltration results, the largest dyeing area was observed in CF (36.96%), but CF also had the lowest infiltration rate (60.3 mm·min−1). The soil under CBF had the highest shear strength, approximately 25% higher than other vegetation types. CF exhibited the highest aggregate stability, surpassing CBF by 98.55%, PF by 34.31%, and FL by 407.41%, respectively. Additionally, PF forests showed the greatest root biomass and length. The results of correlation analysis and PCA reveal complex relationships among hydrological and mechanical soil traits. Specifically, soil cohesion does not exhibit significant correlations with hydrological traits such as the dyeing area, while traits like MWD and PAD show either positive or negative associations with hydrological traits. Root traits generally exhibit positive relationships with soil mechanical traits, with limited significant correlations observed with hydrological traits. Conversely, we found that root biomass contributes significantly to the dyeing area (accounting for 51.48%). Conclusions: Our findings indicate that the reforestation system is a successful approach for conserving water and reducing erosion by increasing soil-aggregated stability and shear strength, causing water redistribution to be more homogenized across the whole soil profile.

1. Introduction

The presence of plants is believed to strengthen soil in many ways, including the influence of plants on hydraulic conductivity and the improvement of physical and chemical properties of soil, which are believed to effectively enhance the infiltration rate and water storage capacity of soil [1]. This includes the combined effects of soil shear strength and aggregate stability [2,3,4]. The highest contributing factor of soil aggregate is RLD, such that a lower RLD at greater distances is expected to reduce soil stabilization more [5]. From a soil bioengineering perspective, the RLD is defined as a mechanical soil reinforcement method [6]. Roots also physically reinforce the soil by adding tensile and compressive strength to the soil’s mantle [3]. This additional strength reduces the potential for shallow landsliding as roots penetrate the soil mantle and cross the failure planes [7]. Karimi found that fine roots have a significant effect on soil water and nutrient absorption [8]. The combination of these factors can govern the transient seepage and stability of geotechnical infrastructure. Among them, the hydrologic conditions of vegetation slope are affected by soil structure and plant roots [9].
Currently, the theory of soil–water coupling mainly focuses on macroscopic and microscopic levels. At the macro level, soil and water coupling is referred to as the matching capacity of land and water resources as well as the water and soil interaction [10]. This concept is divided into regions, basins, or administrative districts. It mainly focuses on conceptual research, the model method, and the coupling law of a water resource or land resource system. At the microscopic level, soil and water coupling are referred to as the soil water characteristic curve, often abbreviated as “SWCC”, which refers to the relationship curve of the soil water’s matrix potential (or soil water suction) changing with the soil water content. Soil water movement, regulation and utilization of soil water, soil improvement and other aspects can be studied through the soil water characteristic curve. While it holds great significance in understanding the relationship between the SWCC, and other mechanical parameters in production practice, it is rarely reported in the literature.
Vegetation is regarded as a crucial component in both urban and wildland areas, enhancing the resilience of social–ecological systems [11]. Studies have demonstrated that plants can influence the function of the soil water resource through both aboveground and subsurface parts. The quantity and duration of precipitation intercepted and retained by the vegetation canopy are vital factors in the water balance. This interception significantly impacts the climate and hydrology of vegetated watersheds and constitutes a critical element in the global climate and hydrologic cycles. The redistribution of precipitation water by plant canopies increases the spatial variation in net precipitation at the surface, influencing soil moisture patterns, localized preferential flow, and soil biogeochemical processes [11]. This paper primarily concentrates on the subsurface part of plants and discovers that the root system can impact the function of the soil water resource in three ways. Firstly, there is the volume occupation of roots in the soil pore space [12]. The root channels created by plant growth or death in the soil allow water and solutes to swiftly pass through or bypass the soil matrix so as to quickly reach the deep soil, forming a soil priority flow and a special soil water distribution [13]. The root channels created by plant growth or death in the soil allow water and solutes to swiftly pass through or bypass the soil matrix, facilitating rapid movement to the deeper soil layers. This process establishes soil preferential flow and results in a distinctive soil water distribution pattern [13]. Secondly, there are mechanical actions such as soil compression due to root expansion [14,15]. The roots expand, insert, and interweave in the soil to form a loose, porous root–soil complex that gradually enhances the soil’s physical properties [16], such as increasing soil porosity to improve the soil infiltration performance. Finally, rhizosphere secretions and changes in the soil organic matter, among other factors [17,18], influence the soil water distribution, eventually contributing to a complex process of soil water transport. The increase in the soil organic carbon (SOC) content in the soil changes the geometry of the soil pore network, resulting in more tortuous and narrow water flow paths [19], which can impact the soil water distribution. Soil organic matter promotes the formation of soil agglomerates, creating numerous large pores and improving soil porosity. The alterations in soil structure caused by these processes induce changes in soil hydrology, and the presence of roots plays a role in the patterns that affect soil water transport.
Many studies have revealed the intricate relationships among soil hydrological, soil mechanical properties, and plant root systems [20,21,22,23,24]. Materechera et al. [23] and Wu et al. [24] found that the roots could deeply till soils, thereby increasing soil permeability through enhanced water infiltration capacity. Furthermore, Jiang et al. [25] found that different morphological structures of the root system led to distinct pore spaces, enhancing water infiltration, influencing the physical properties of the soil, and consequently impacting water infiltration. The changes in soil infiltration performance are indeed typically attributed to plants altering the physical or chemical composition of the soil, ultimately modifying its hydrological characteristics. Understanding the respective contributions of these factors is crucial in comprehending the mechanisms of rooted soil hydrological processes. Here, we define the direct effect of roots on the soil as root-induced change, and the hydrological effect caused by changes in the physical and chemical properties of the soil due to plant cultivation is defined as plant-induced change. This phenomenon has been discussed in the studies by Dexter [15] and subsequently by Czarnes et al. [26]. However, as mentioned earlier, the presence of root systems itself can also impact soil infiltration performance. The direct effects of this aspect, combined with the Indirect effects of altering the soil, collectively modify the soil’s hydrological properties. Understanding the respective contributions of these factors is crucial for comprehending the mechanisms of rooted soil hydrological processes. Here, we define the direct effect of roots on the soil as root-induced change, and the hydrological effect caused by changes in the physical and chemical properties of the soil due to plant cultivation is defined as plant-induced change.
In addition to the extensively studied soil properties such as soil organic matter, soil porosity, bulk density, and others, soil aggregate stability is not only a parameter used to assess soil stability [27] but also the distribution of soil aggregates is a critical aspect of soil structure that governs soil moisture. This aspect has recently garnered attention from researchers [28,29]. Simultaneously, another indicator used to assess soil stability, shear strength [30,31], was also mentioned to have an interrelationship with soil infiltration characteristics in Alderfer [32]. However, we have limited knowledge about the interrelationships among soil hydrological properties, aggregate stability, and shear strength.
Therefore, the objective of this study is to investigate the hydrological and mechanical features of rooted soil and explore the multifaceted mechanisms involving interactions between soil traits and root systems in the hilly mountainous region (a hilly mountainous area refers to an area where the elevation is more than 200 m, and the terrain is clearly undulating [33,34]) of southern China. Our specific objectives are as follows: (1) Compare the differences in soil mechanical and hydrological features under different vegetation types. (2) Detect the relationship between soil hydrological and mechanical features associated with roots. Therefore, we propose the following two hypotheses: (1) Water distribution differs among vegetation types, and the mixed forest exhibits the most effective water distribution effect. (2) The root system contributes more to soil water distribution than the physical and chemical properties of soil.

2. Materials and Methods

2.1. Study Area

All in situ experiments and sample collections were conducted in Dayu County, Ganzhou City, Jiangxi Province, China (25°15′–25°37′ N; 114°–114°44′ E) (Figure 1). In Figure 1, CBF stands for coniferous and broad-leaved mixed forest; CF stands for coniferous forest; PF stands for bamboo forest (Phyllostachys edulis); and FL stands for fallow land. This area is located in the significant southern hilly mountain zone of China, possessing the world’s largest area of intact subtropical forest ecosystems within the same latitude belt in Central Asia. The climate is subtropical and monsoonal humid, with four distinct seasons. The average annual rainfall is 1563 mm, and the average annual temperature is 18.53 °C, with the lowest temperature occurring in January and the highest temperature in July and August. The annual sunshine time is 1499.3 h. The soil type is classified as Quaternary red clay according to the FAO classification, with 29.3% sand, 39.1% silt, and 31.6% clay.
The vegetation cover types mainly include coniferous and broad-leaved mixed forests (CBFs), evergreen broad-leaf forests (BFs), and coniferous forests (CF), with the growth of species including Schim a argentea Pritz. ex Diels, Cinnamomum camphora (L.) Presl, Pinus massoniana Lamb., and Castanopsis fordii Hance in the hilly area of Ganan, including forest tree species in the hills. Around the 1980s, the forests in this region underwent significant degradation, being cleared for the cultivation of crops and various other types of development. Since the 1990s, in order to protect and enhance the ecological functionality of this area, China initiated projects for the conservation of natural forests and ecological restoration through land retirement and afforestation (e.g., Natural Forest Protection Project, Grain for Green Project). These efforts have led to the persistence of numerous man-made forests in the region, along with economically productive forested areas that cater to the regional economic demands. The primary types of man-made forests might encompass Cunninghamia lanceolata (Lamb.) Hook and Phyllostachys heterocycla, whereas economically productive forested areas are predominantly composed of Citrus sinensis Osbeck and Camellia sinensis (L.) Kuntze.

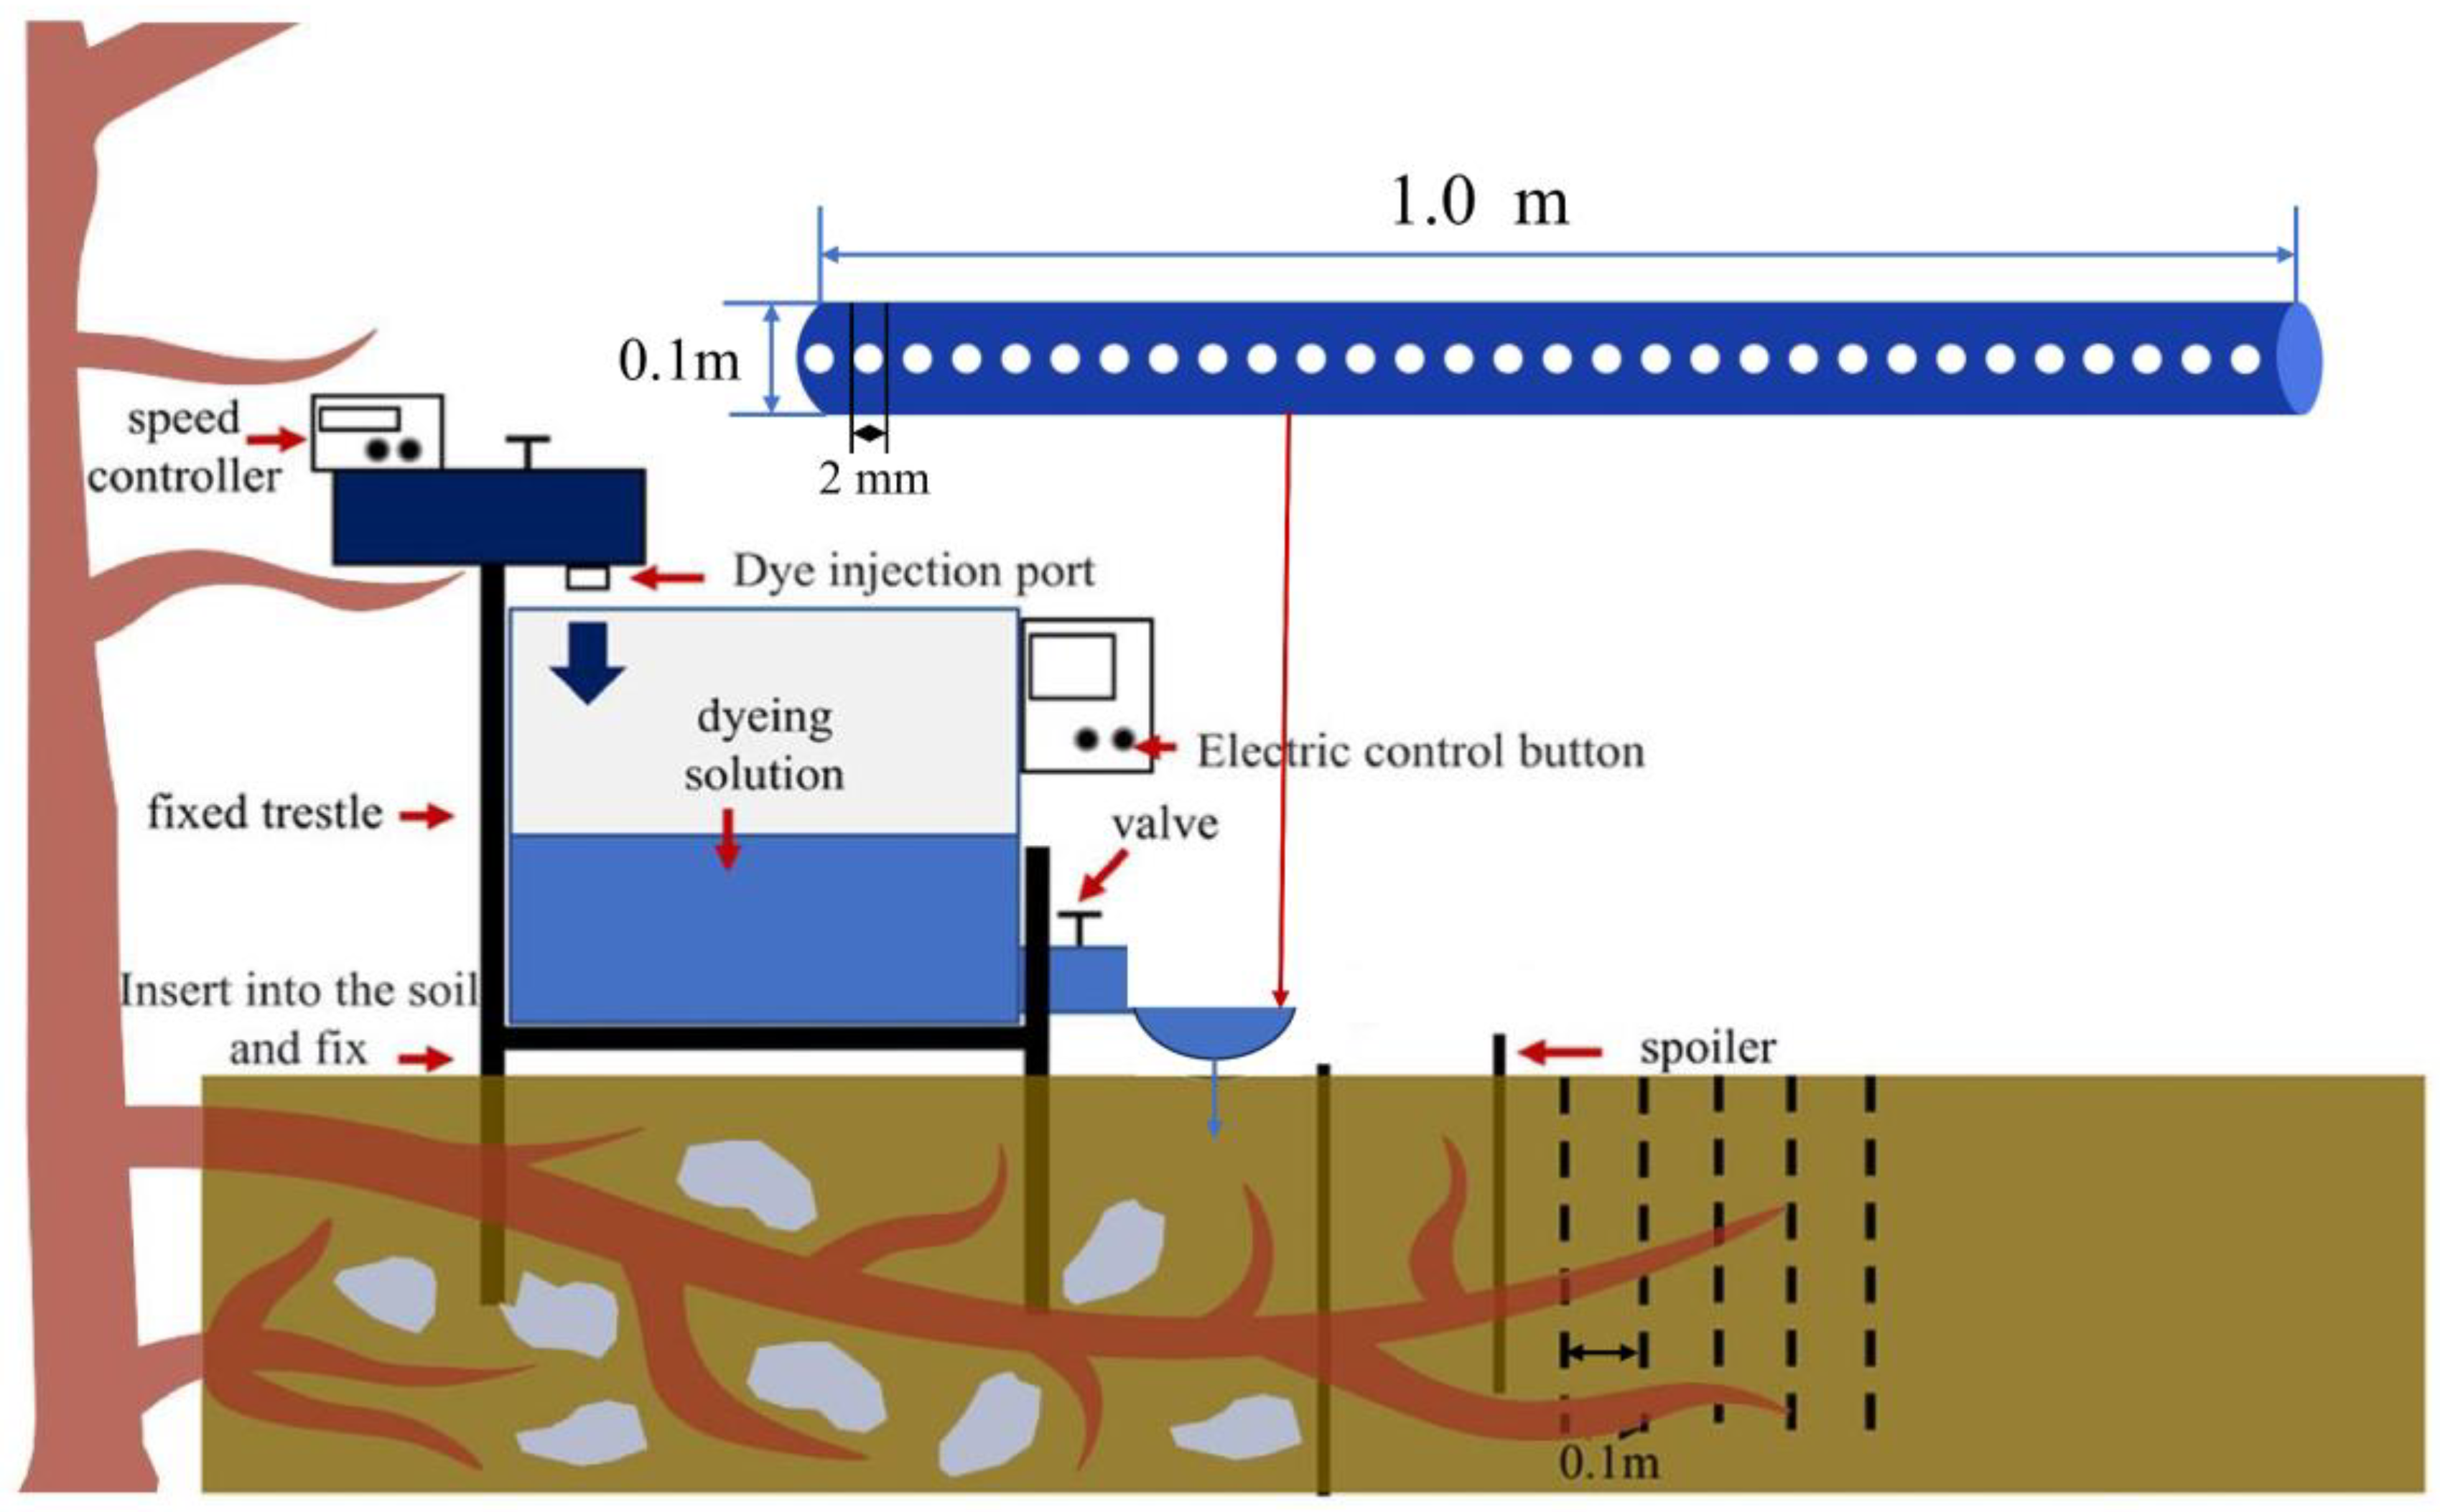
2.2. Experimental Design and Sample Collection

The same soil background, in a relatively concentrated geographical location, and low human interference were selected for the following four foundation types: CBF, PF, CF, and FL (Table 1). The experimental sites are of the same lithology and replicate plots at approximately < 200 m apart. The coniferous and broad-leaved mixed forest and Phyllostachys edulis forest were natural secondary forests without human disturbances from the 1980s. In this region, a portion of the coniferous and broad-leaved mixed forest and coniferous forest areas underwent clear-cutting between 2000 and 2010 for the cultivation of cash crops. The plots chosen for this study referred to as “coniferous forest” and “fallow land”, were converted to coniferous cultivation around 2005. However, the “fallow land” plot was subsequently clear-cut in 2010 and has since remained abandoned. After clear-cutting, stumps were removed and, therefore, some root decomposition may have occurred belowground. However, this area exhibited the presence of shrubs and herbaceous vegetation, which colonized the exposed soil. Thus, we also carefully analyzed the root size and distribution patterns in the soil.
Three plots of each vegetation type were selected, each measuring 3.00 m × 3.00 m, with each plot separated by 4 m. 1 × 1 squares and excavated in each plot for sampling. All the plots were located mid-slope to avoid changes in the topography and slope (altitude: ~150 m, aspect: southeast, and slope: 10~13°). In the plantation sites, the centers of the plots were situated 0.5 m downslope of a tree. The trees were chosen at random, but the following criteria were met: (1) there were no other large trees within the 4 m downslope from the center of the tree; (2) individuals were healthy and robust, without clear signs of disease; (3) the diameter at the breast height (DBH) of the trees was in accordance with the standard size of reference trees for the plot (±50 mm).
We operated all the experiments in July 2021, during the monsoon season. The dye infiltration experiments and sample collection were carried out 48 h after heavy rainfall. The litter horizon was removed, and the soil water content (0~0.6 m depth) was measured along the border of plots with a sensor (TDR-315H, Spectrum, IL, USA), and the gravimetric method (soils were dried for 48 h at 105 °C (NF ISO 11465, 1994 [35])). Soil moisture was 24% ± 2% for TDR and 23% ± 3% for the gravimetric method. No significant differences in soil moisture were found among the plots and sites.
In each plot, we performed one dye-tracer test to visualize the effect of biopores and capture the impact of root systems on flow pathways [36]. We cleared 2.00 m × 2.00 m areas for the dyeing tests in each plot (three replications × four plots). The surface herbaceous plants were trimmed with scissors, and a shovel was used to remove dead material and rocky blocks from the soil‘s surface to reduce disturbance in the soil‘s structure. Within each plot, dyed water was irrigated at a distance of 1.5 m downslope of the tree stem. We chose to apply the dye at this distance to (i) avoid the direct flow of dye close to and around the stem bole, (ii) to avoid being too close to the upper terrace, and (iii) at a distance greater than 1.5 m; therefore, we may not have been able to locate the blue dye downslope of the tree [36]. The dye was contained within a reservoir and introduced by gravity flow into a drain pipe measuring 1.0 m in length and 0.1 m in width. This drain pipe was perforated with 30 holes, each with a diameter of 2 mm. The drain pipe served as the demarcation for the upper boundary of a 1.0 square meter quadrat, which constituted the focal area for subsequent experimental procedures and analyses. The dye permeated through the drain pipe and infiltrated the soil at a consistent discharge rate of 10.0 mL per second. To maintain a relatively stable discharge rate, the water level within the drain pipe was carefully maintained at a uniform level throughout each testing session. To promote infiltration, in each quadrat, a width of stainless steel (1.0 m long by 0.1 m deep) was inserted into the soil 0.3 m away from the upper boundary of the overflow port to block surface runoff. Before the experiments, the soil around the stainless steel was compacted using a rubber mallet.
A solution of 60 L containing 4 g/L of Brilliant Blue powder (an edible dye with low toxicity, low adsorption, and high mobility) was prepared. During the dyeing experiment, the soil around the iron plate was tamped with a rubber hammer to prevent the dyeing solution from leaking sideways along the gaps of the iron plate. We marked the 1.00 m × 1.00 m quadrate and a 1.00 m, 0.30 m wide, and 0.02 m thick iron plate 0.3 m away from the upper boundary of the quadrate. We then poured the dyeing solution into the experimental device to carry out the dyeing experiment, as shown in Figure 2. Twelve dye-tracer tests were conducted on four tetragonal quadrats in the four subsites (three replications × four plots).
After 24 h of infiltration, the soil profile was excavated to the bedrock (to a maximum depth of 0.6 m). The sections were excavated from the lower limit of the plot until the dyed area was found and designated as the first dyed section. A new section was then made at 0.1 m and repeated until 5 soil profiles were excavated. A 1.0 × 1.0 m grid divided into 0.1 m squares was set in front of each section. The sections were then photographed to illustrate the intensity and distribution of the blue dye for mapping and recording results.

2.3. Laboratory Test

After 24 h of infiltration, the soil profile was excavated to the bedrock (at a maximum depth of 0.6 m). The soil was meticulously excavated to create a uniformly even profile surface, starting from the lower boundary of the plot (1.0 m downhill from the irrigation source). Subsequently, a fresh profile was established at 0.1 m of the downslope, and this process was iterated until a total of 5 soil profiles were unearthed. In order to examine the impacts of macrofauna burrows as well as the root size and density on microscale infiltration, a grid measuring 1.0 × 0.1 m and divided into 0.1 m squares was established in front of each profile. Subsequently, the profiles were photographed to capture the distribution and intensity of the blue dye, facilitating the mapping and documentation of the outcomes. These photographs were captured utilizing a digital camera (Sony, a6000-Lens 50, Tokyo, Japan) situated on a tripod and focusing on the center of the section.
After each infiltration test, we collected six ring knife undisturbed root-free soil samples (100 cm3) to test the soil properties and twelve undisturbed root-free soil samples with a ring knife (60 cm3) for soil shear strength tests in three depth horizons (0~20 cm, 20~40 cm, and 40~60 cm). A total of 648 (6 × 36 + 12 × 36) samples were collected. Meanwhile, we also collected 500 g of disturbed soil samples (36 bags). We collected all the roots in the profile in three horizons, totaling 180 bags. Then, we measured the root diameter with a caliper, and we classed the roots into the following three diameter classes: fine (≤2 mm), thin (2~10 mm), and thick (>10 mm). Root samples were placed in an incubator at 4 °C.
The soil bulk density, organic carbon content, particle size distribution, maximum water retention, saturated water content, infiltration rate, soil shear strength, and agglomerate stability were tested in the laboratory. Among them, bulk density (BD) was determined using the core method [37]. The organic matter content was determined using the potassium dichromate method, and the mechanical composition of the soil was determined using a laser particle size meter (Malvern Laser Particle Sizer Mastersizer 2000 UK). The maximum water holding capacity (MWHC) and saturated water content (SMC) were determined using the ring knife method [38]. Specifically, all 100 cm3 ring knife soil samples were brought back to the laboratory, placed in a flat tray with water just above the bottom of the ring knife, peeled, and weighed every other day to measure the soil weight M1 at the maximum water-holding capacity. We continued to add water just above the top of the ring knife, which was peeled and weighed every other day to measure the soil weight M2 with the saturated water content. Then, the soil samples were placed in a flat horizon of fine sand for 2 h and weighed to obtain the peeled weight M3. Finally, the soil samples were dried in an oven at 105 °C to a constant weight and tare-weighed by balance to obtain the dry weight M0 of the soil sample. The calculation formula is as follows [37,38,39]:
BD = M 0 V
MWHC = ( M 1 M 0 ) ρ V × 100
SWC = ( M 2 M 0 ) ρ V × 100
CP = M 3 M 0
NCP = TP CP
TP = 100 × ( 1 BD D )
where BD, MWHC, SMC, CP, NCP, and TP represent the soil bulk weight (g/cm3), soil maximum water-holding capacity (%), soil saturated water content (%), capillary porosity (%), non-capillary porosity (%), and total porosity (%).
The permeability coefficient and permeability rate were measured using double-ring infiltrometer methods [40]. Three replicate plots were selected on the same slope of each vegetation type, and each plot was divided into three horizons to carry out infiltration experiments. The infiltration experiments were repeated three times for each horizon, and the results were averaged. A total of 108 experiments were conducted in four sample sites. The calculation formula is as follows [40]:
IPR = Q a × 10 t a A
SPR = Q b × 10 t b A
PC = Q × 10 t A × L H
where IPR, SPR, and PC: the initial infiltration rate (mm·min−1), steady infiltration rate (mm·min−1), and infiltration coefficient (mL·cm−3·h−1); Qa, Qb, and Q: the infiltration volume (mL) during the initial time period, the infiltration volume (mL) during the steady infiltration time period, and the total time period (mL); ta, tb, t: the interval of infiltration in the initial time period (min), the interval of infiltration in the stable time period (min), and the total infiltration time (min); A: the cross-sectional area of infiltration through (cm2); L: the depth of the iron ring inserted into the soil (cm); H: the thickness of the water horizon maintained during the test (cm).
Soil aggregate stability was determined via the wet sieve method [41] and described using the mean weight diameter (MWD), geometric mean diameter (GMD), and aggregate disruption rate (PAD) of the soil water stability aggregate index. The sieves with apertures of 2 mm, 0.25 mm, and 0.053 mm were arranged from top to bottom in descending order. Then, 50 g of air-dried soil samples were weighed and placed on the sieve set, which was then submerged in a bucket of water and filled until the sieve was completely covered. After allowing 5 min for the soil to become moist, the samples were shaken at 40 r/min for 10 min. The soil water-stable aggregates of four particle sizes >2 mm, 0.25~2 mm, 0.053~0.25 mm, and <0.053 mm were obtained, respectively, and the aggregates on each sieve were transferred to a beaker and dried at 60 °C to a constant weight. The masses of the aggregates at each level were weighed, and the percentages were calculated to obtain the masses of the four particle size fractions, which were used to calculate MWD and GMD. The calculation formula is as follows [42]:
MWD = i = 1 n ( R i W i ) i = 1 n W i
GMD = exp [ i = 1 n ( W i ln R i ) i = 1 n W i ]
PAD = ( D S A 0.25 W S A 0.25 ) D S A 0.25 × 100
where MWD, GMD, and PAD: the average weight diameter of aggregates (mm), the geometric mean diameter of aggregates (mm), and the aggregate disruption rate (%). Ri: the average diameter of aggregates at grain level i (mm); Wi: the weight of aggregates at grain level i as a fraction of the soil dry weight (%); DSA0.25 and WSA0.25: the content of >0.25 mm mechanically stable aggregates and >0.25 mm water-stable aggregate content; i: different grain classes.
Soil shear strength was determined using a straight shear test [43]. Every three soil samples were grouped, and the moisture content of the soil samples was determined before the test. Vertical pressures σ of 50, 100, and 150 kPa were applied to each group of the samples. The soil was sheared when the horizontal shear force reached the maximum. The shear strength of the sample under three vertical pressures was obtained. And the internal friction angle (φ) and soil cohesion (c) were calculated according to the Mohr–Coulomb theory. The calculation formula is as follows [43]:
τ f = σ tan φ + c
The root diameter and root weight of the root system were measured separately using a vernier caliper and balance. The root diameter was measured at three positions (two endpoints and the middle point) using a vernier caliper before being averaged [22]. The root weight was measured three times using a balance with one-thousandth accuracy before being averaged (Shanghai Youke Precision Balance JA-2003N, Shanghai, China). The root length was determined using a straightedge with WinRHIZO software Basic (Regent Instrument, Québec City, QC, Canada). The root length density was calculated. Afterwards, the root dry weight (root biomass) was dried in an oven at 60 °C, and root biomass and root weight density were calculated. The root length density and root weight density of the cultivated land were recorded as 0. The calculation formulas are as follows [22]:
RLD = RL A
RWD = RW A
where RLD and RWD: the root length density (cm/m2) and root weight density (g/m2). RL: the root length (cm); A: cross-sectional area (m2); RW: root weight (g).
The SWCC curve exhibited the classic “S”-type relationship, which was fitted with the Van Genuchten [44] function as follows:
w ( ψ ) = w r + w s w r [ 1 + ( a ψ ) n ] 1 1 / n
where w(ψ) is the volumetric water content (L3L−3) at suction pressure |ψ| ([L] or cm of water); Ws is the saturated soil water content (L3L−3); Wr is the residual soil water content (L3L−3); a is related to the inverse of the air entry suction ([L−1], or cm−1); and n is a measure of the pore-size distribution.

2.4. Data Analysis

Soil profile images were corrected using Adobe Photoshop CS6 (Adobe Systems, Inc., San Jose, CA, USA), cropped, and replaced with black (0) for dyed areas and white (225) for undyed areas using the color replacement tool. The optimal threshold was selected, and the binary image was output as a JPG format. The binarized images were then imported into MATLAB R2022b (MathWorks, Natick, MA, USA) for the statistical analysis of the dyed area ratio.
All data were counted and organized in Excel 2019 (Microsoft Corporation, Redmond, WA, USA). Figures of the boxplot and dyed area ratio, root biomass, soil water storage capacity, organic matter content, and soil aggregate stability were used for analysis with Origin 2022 (Origin Lab, Newton, MA, USA). The dyed area ratio, soil density, soil organic matter content, and soil water storage capacity indicators were analyzed using the Corrplot language package (https://cran.r-project.org/ (accessed on 31 October 2023)) in R-Studio (RStudio, Boston, MA, USA). Pearson correlation analysis was performed for the soil aggregates stability index and root characteristics index. Principal component analysis was performed on the soil water distribution of different vegetation types using SPSS 2022 (IBM, Addison, TX, USA).

3. Results

3.1. Soil Root Distribution

The root biomass of each vegetation type decreased with the deepening of the soil‘s horizon (Table 2). Among them, the root biomass in the surface horizon (0~20 cm) of CBF was the highest compared to other sample sites. The root length density and root weight density also showed a consistent trend in general, decreasing with the increasing soil horizon. The root length density was the highest in all the vegetation types, with root diameters of 2~10 mm. The root diameters of CBF were mainly distributed in thin roots of 2~10 mm, while the roots of PF and CF were mainly fine roots of D ≤ 2 mm. The root length was 1.09 and 1.43 times higher in CF than in CBF and PF, respectively.

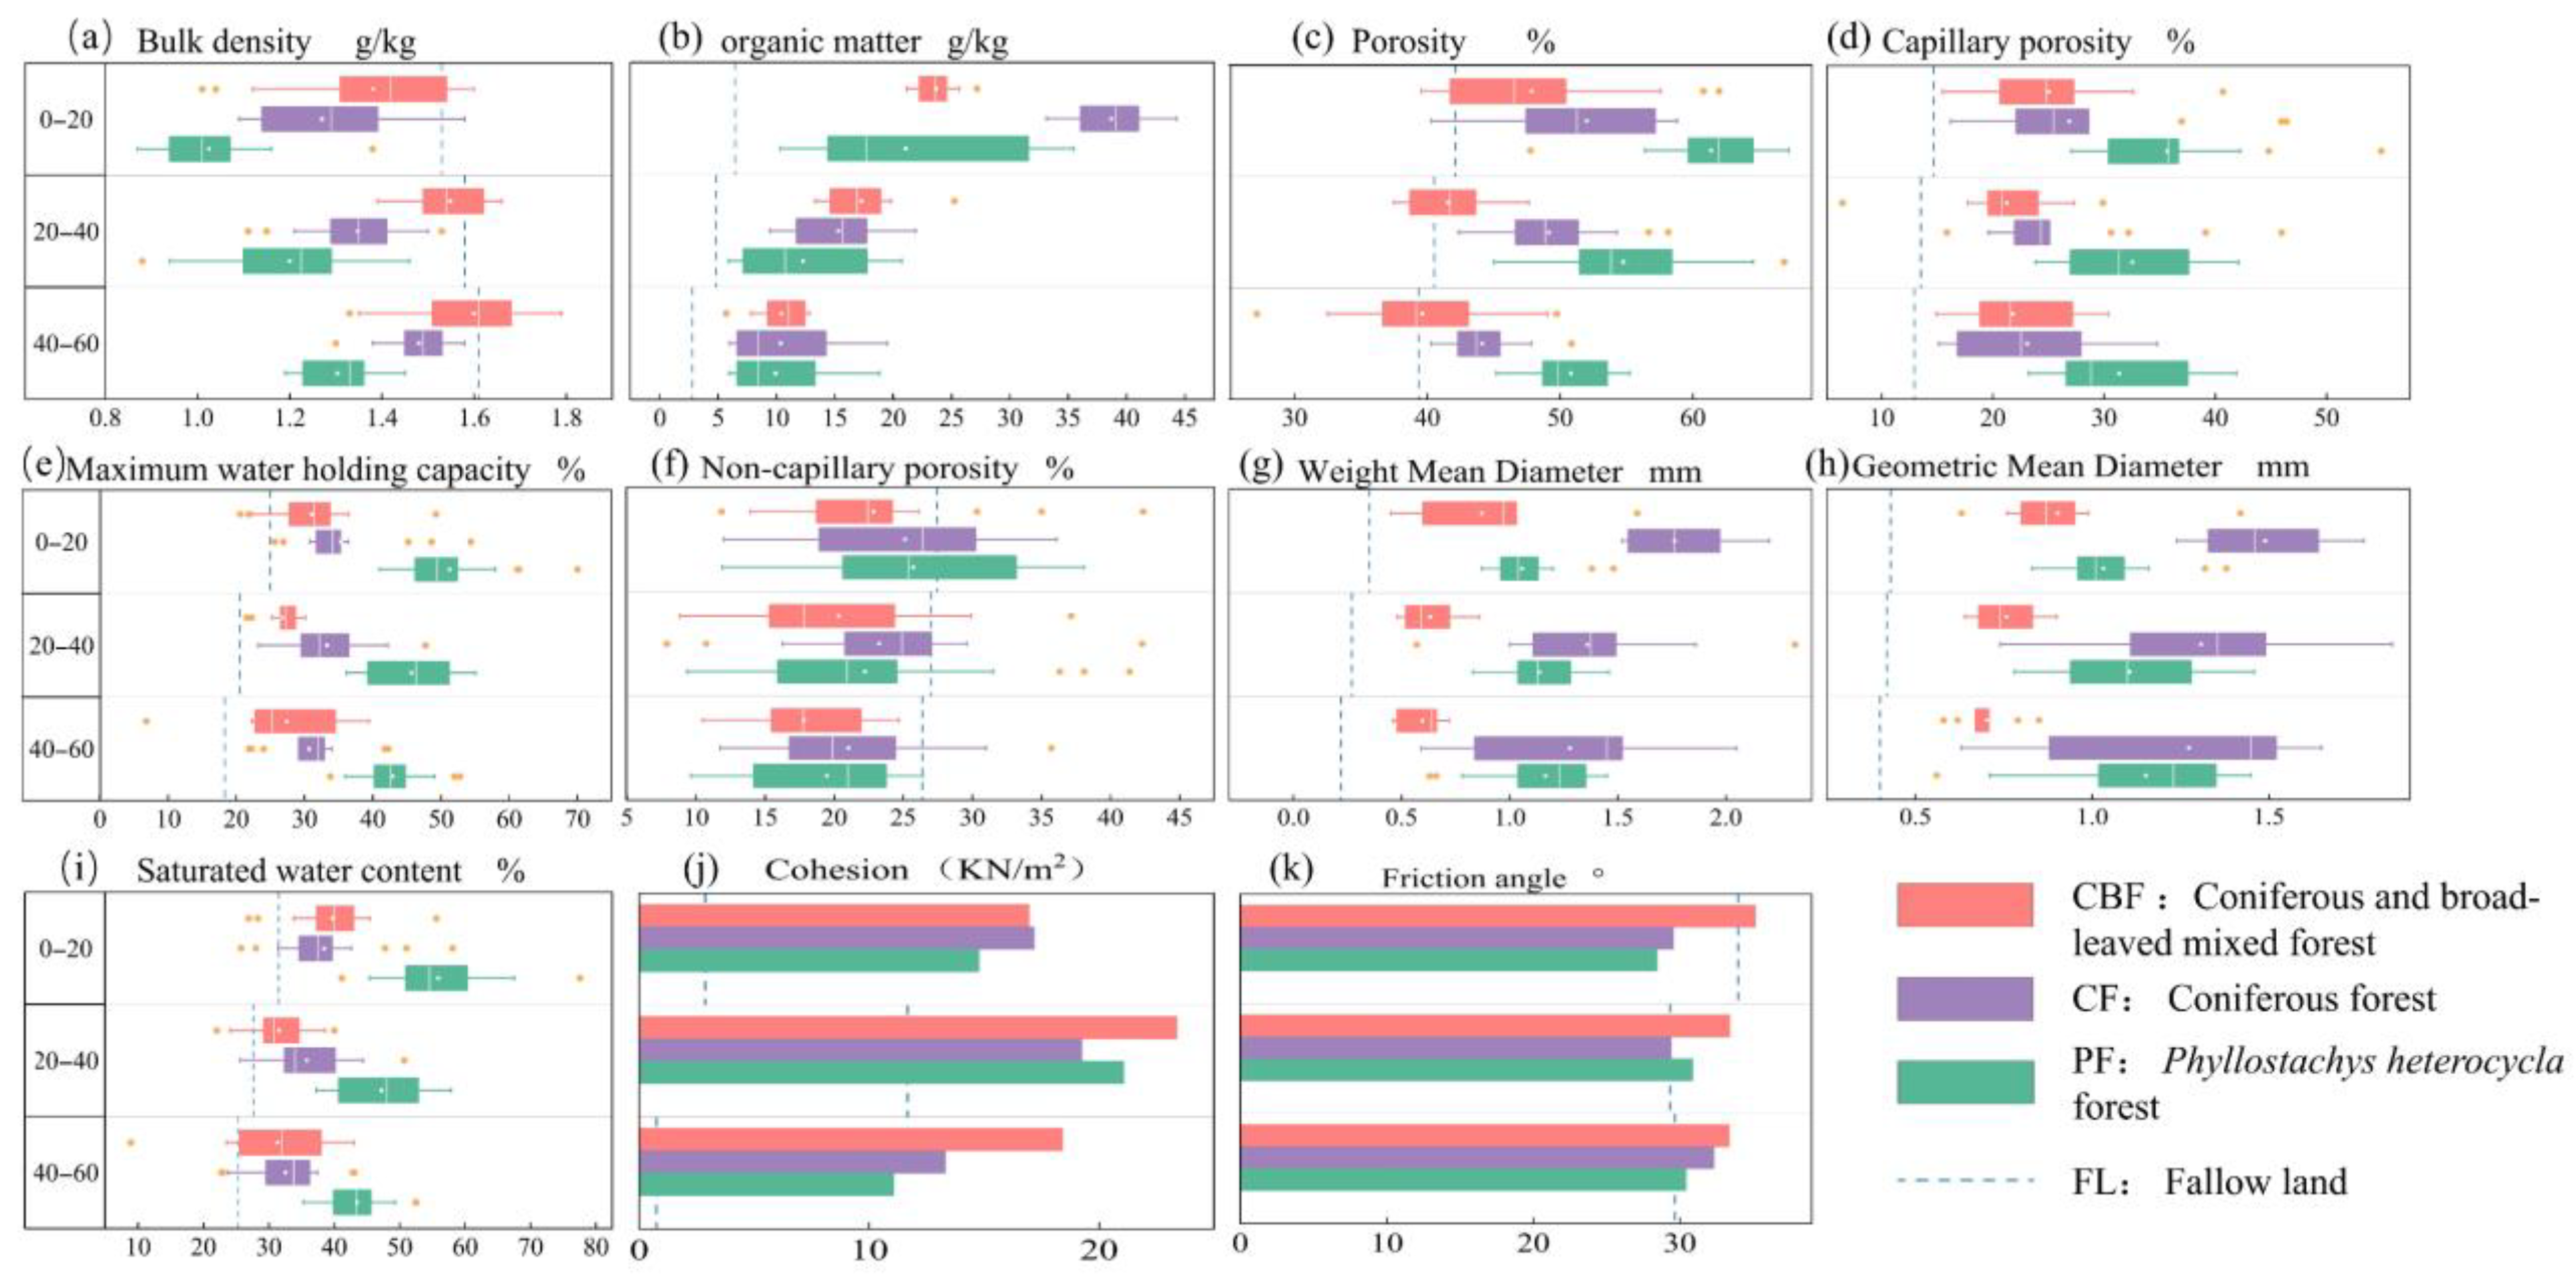
3.2. Soil Physical and Chemical Characteristics

We used the Van Genuchten curve to fit soil water characteristic curves (SWCC), and the fit was successful (Figure 3). And We drew boxplots of indices under different vegetation types and soil depths in Origin (Figure 4). In general, the clay content of forest land is higher than that of fallow land (Table 3). For example, for the soil horizon at 0~60 cm, the soil clay content of CBF, CF, and PF was 2.18, 2.53, and 1.79 times higher than that of FL, respectively. The variation in the soil bulk density ranged from 1.02 to 1.66 g·cm−3 and increased with the increasing soil horizon (Figure 4a, p < 0.001). Soil bulk density was highest in FL, particularly in the 40~60 cm soil horizon, and highest in CBF. Soil organic matter content also decreased with the increasing soil horizon (Figure 4b), and there was significant heterogeneity (p < 0.01) in soil organic matter content from one vegetation type to another. In the 0~20 cm soil horizon, for example, CF had the highest organic matter content (Table 3, 38.78 g·kg−1), followed by CBF (23.26 g·kg−1), PF (21.98 g·kg−1), and FL (6.45 g·kg−1).
SWCC also varied across different soil horizons and sites. It showed a decreasing trend with the deepening of soil depth, and the volumetric water content of the soil in each suction stage decreased. The matric suction of CBF ranged between 0 and 2.4 kPa, while for the other stands, it ranged between 0 and 1.8 kPa. The saturated water content of 0~20 cm, 20~40 cm, and 40~60 cm soil horizons in CBF was 45%, 40%, and 35%, respectively. The results in CF and PF were similar; the saturated water content of the 0~20 cm soil layer was 43%, and that of the 20~40 cm and 40~60 cm soil horizon was about 30%. In FL, the saturated water content of 0~20 cm, 20~40 cm, and 40~60 cm was 38%, 32%, and 30%, respectively.
Total porosity, capillary porosity, and non-capillary porosity all decreased with the increasing soil horizon (Figure 4c,d,f), exhibiting significant differences between vegetation types (p < 0.001). The highest total porosity and capillary porosity in the whole soil horizon were found in PF, followed by CF, CBF, and FL. The capillary porosity was higher in CBF, CF, and PF, each accounting for more than 50% of the total porosity, while the non-capillary porosity in FL accounted for about 66%. Capillary porosity is positively correlated with the maximum water retention and saturated water content. The MWHC and SWC decreased with the increasing soil horizon. The variation range of MWHC was 18.29 to 51.11%, and the variation range of saturated water content was 25.34 to 55.65%. The MWHC (Figure 4e) was highest in each horizon for PF, followed by CF, CBF, and FL. Saturated water content (Figure 4i) was the highest in PF, except for the 0~20 cm soil horizon, followed by CBF, CF, and FL. Both the permeability rate and permeability coefficient decreased with the increasing soil horizon (Figure 5). The permeability coefficient and penetration rate of all soil horizons were the highest in PF, followed by CF, CBF, and FL. For example, the permeability coefficients of PF, CF, and CBF were 5.78, 3.83, and 3.16 times higher than that of FL, respectively, in the 0~20 cm soil horizon.

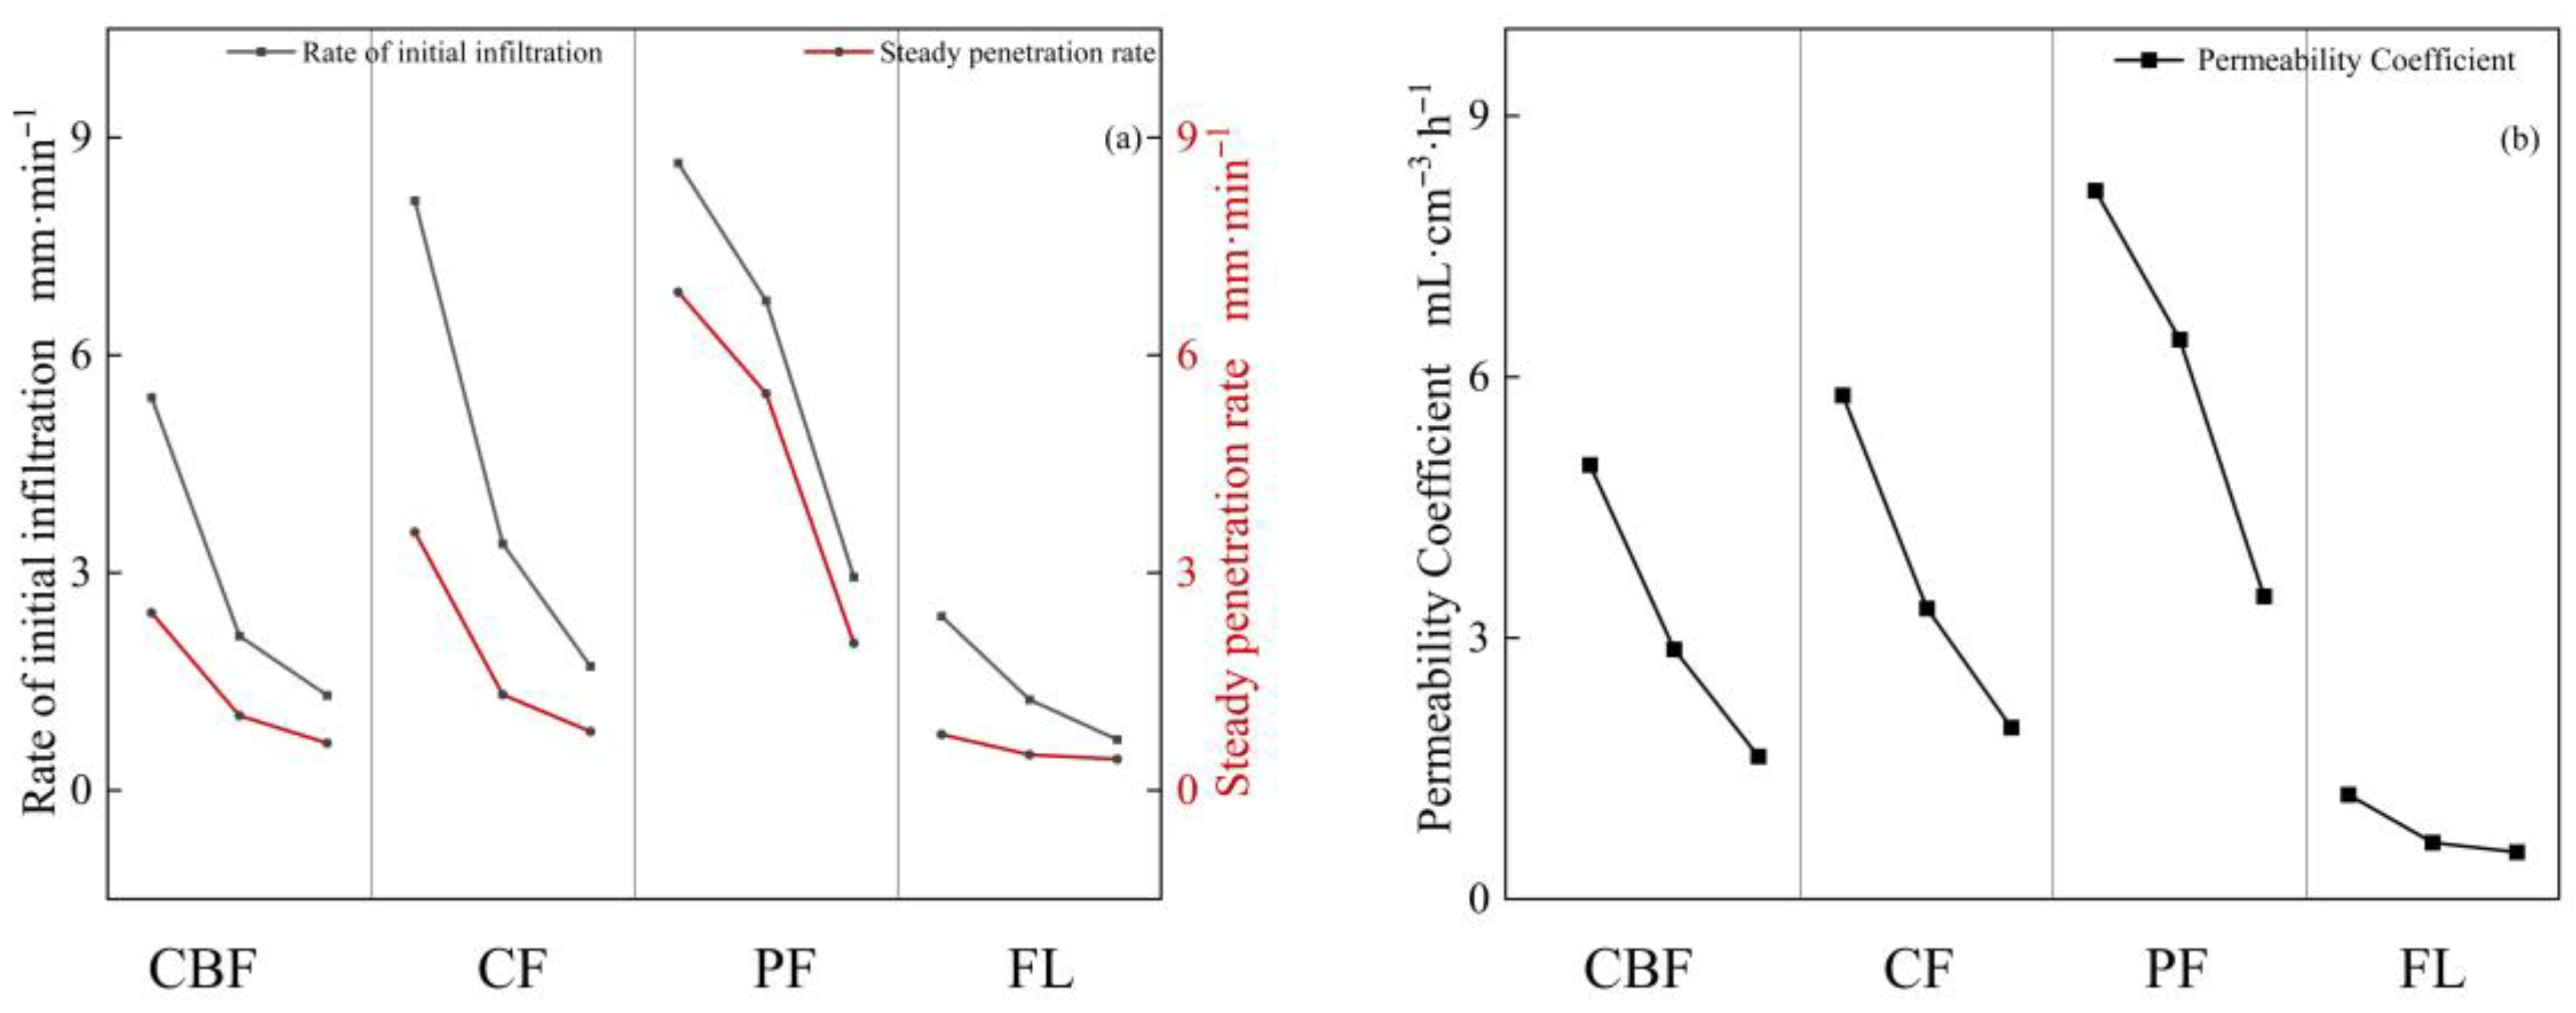
3.3. Characteristics of Soil Infiltration

In general, the dyed area tends to decrease with the increasing soil horizon (Figure 6). In the CBF, the dyed area accounted for 24.07% of the total area. The dyeing depth was 60 cm, except for Section 5 in sample plots 1 and 3 and Section 3 and Section 4 in sample plot 2, where the maximum dyeing area ratio was 95.78%, and the depth was 26 cm (Section 3 in sample plot 3). In the CF, the dyed area accounted for 32.73% of the total area, and the dyeing depth was 60 cm in all cases. The dyeing area ratio was 100% within the depth of 14~44 cm in Section 2 of sample plot 1. In the PF, the dyed area accounted for 26.52% of the total area. Section 4 and Section 5 of sample plot 1 and Section 5 of sample plots 2 and 3 were almost unstained, with a maximum dyed area ratio of 94.17% at a depth of 37 cm (Section 2 of sample plot 1). In contrast, in the FL, the dyed area accounted for 29.86% of the total area, and the dyeing depth was 60 cm, but the dyed area was mainly concentrated in the topsoil horizon (0~20 cm). The preferential flow phenomenon was observed in the CBF, CF, and PF, but the horizontal direction of moisture in the PF was not distributed as in CBF and CF. The FL mainly exhibited a substrate flow, and a blocky dyeing situation was observed.

3.4. Soil Aggregates’ Stability and Shear Strength

MWD and GMD decreased with the increasing soil horizons (Figure 4g,h). The MWD varied from 0.22 to 1.79 mm, and GMD varied from 0.40 to 1.49 mm. In both 0~20 cm and 20~40 cm soil horizons, MWD values were greatest in CF, followed by PF, CBF, and FL. In the 40~60 cm soil horizon, the MWD values were greatest in the PF, followed by the CF, CBF, and FL. The MWD in the 0~20 cm soil horizon of CF was 1.99 times higher than that in the 40~60 cm soil horizon, showing the most substantial heterogeneity. Throughout the soil horizons, GMD values were the greatest in CF, followed by PF, CBF, and FL. The CF also showed the greatest heterogeneity.
In general, the cohesion values showed an increase followed by a decrease with the deepening of the soil horizon (Figure 4j). From the 0~20 cm soil horizon to the 20~40 cm soil horizon, there was an overall increase of 45.60%, and from the 20~40 cm soil horizon to the 40~60 cm soil horizon, there was an overall decrease of 73.16%. Regardless of the soil horizon, the soil cohesion values were significantly higher in the sample plots with plantings than in the FL (284%, 225%, and 206% higher in the CBF, CF, and PF than in the FL, respectively). The internal friction angle of CBF decreased with the deepening of the soil horizon, and the difference between the internal friction angle of 20~40 cm and 40~60 cm soil horizons was not significant. With the deepening of the soil horizon, the angle of internal friction in CF showed an unimodal variation curve, reaching its minimum value of 29.4° in the 20~40 cm soil horizon. The angle of internal friction in the 40~60 cm soil horizon was higher than that in the 0~20 cm horizon by 9%. The angle of the internal friction of PF showed an unimodal variation curve, with the highest value of 30.88° observed in the 20~40 cm soil horizon. In the 40~60 cm soil horizon, the angle of internal friction was 7% higher than that in the 0~20 cm horizon. The angle of internal friction in the FL showed an unimodal variation curve with the increase in the soil horizon reaching its minimum value of 29.34° for the 20~40 cm soil horizon. It was 15% lower in the 40~60 cm soil horizon than in the 0~20 cm (p < 0.05).

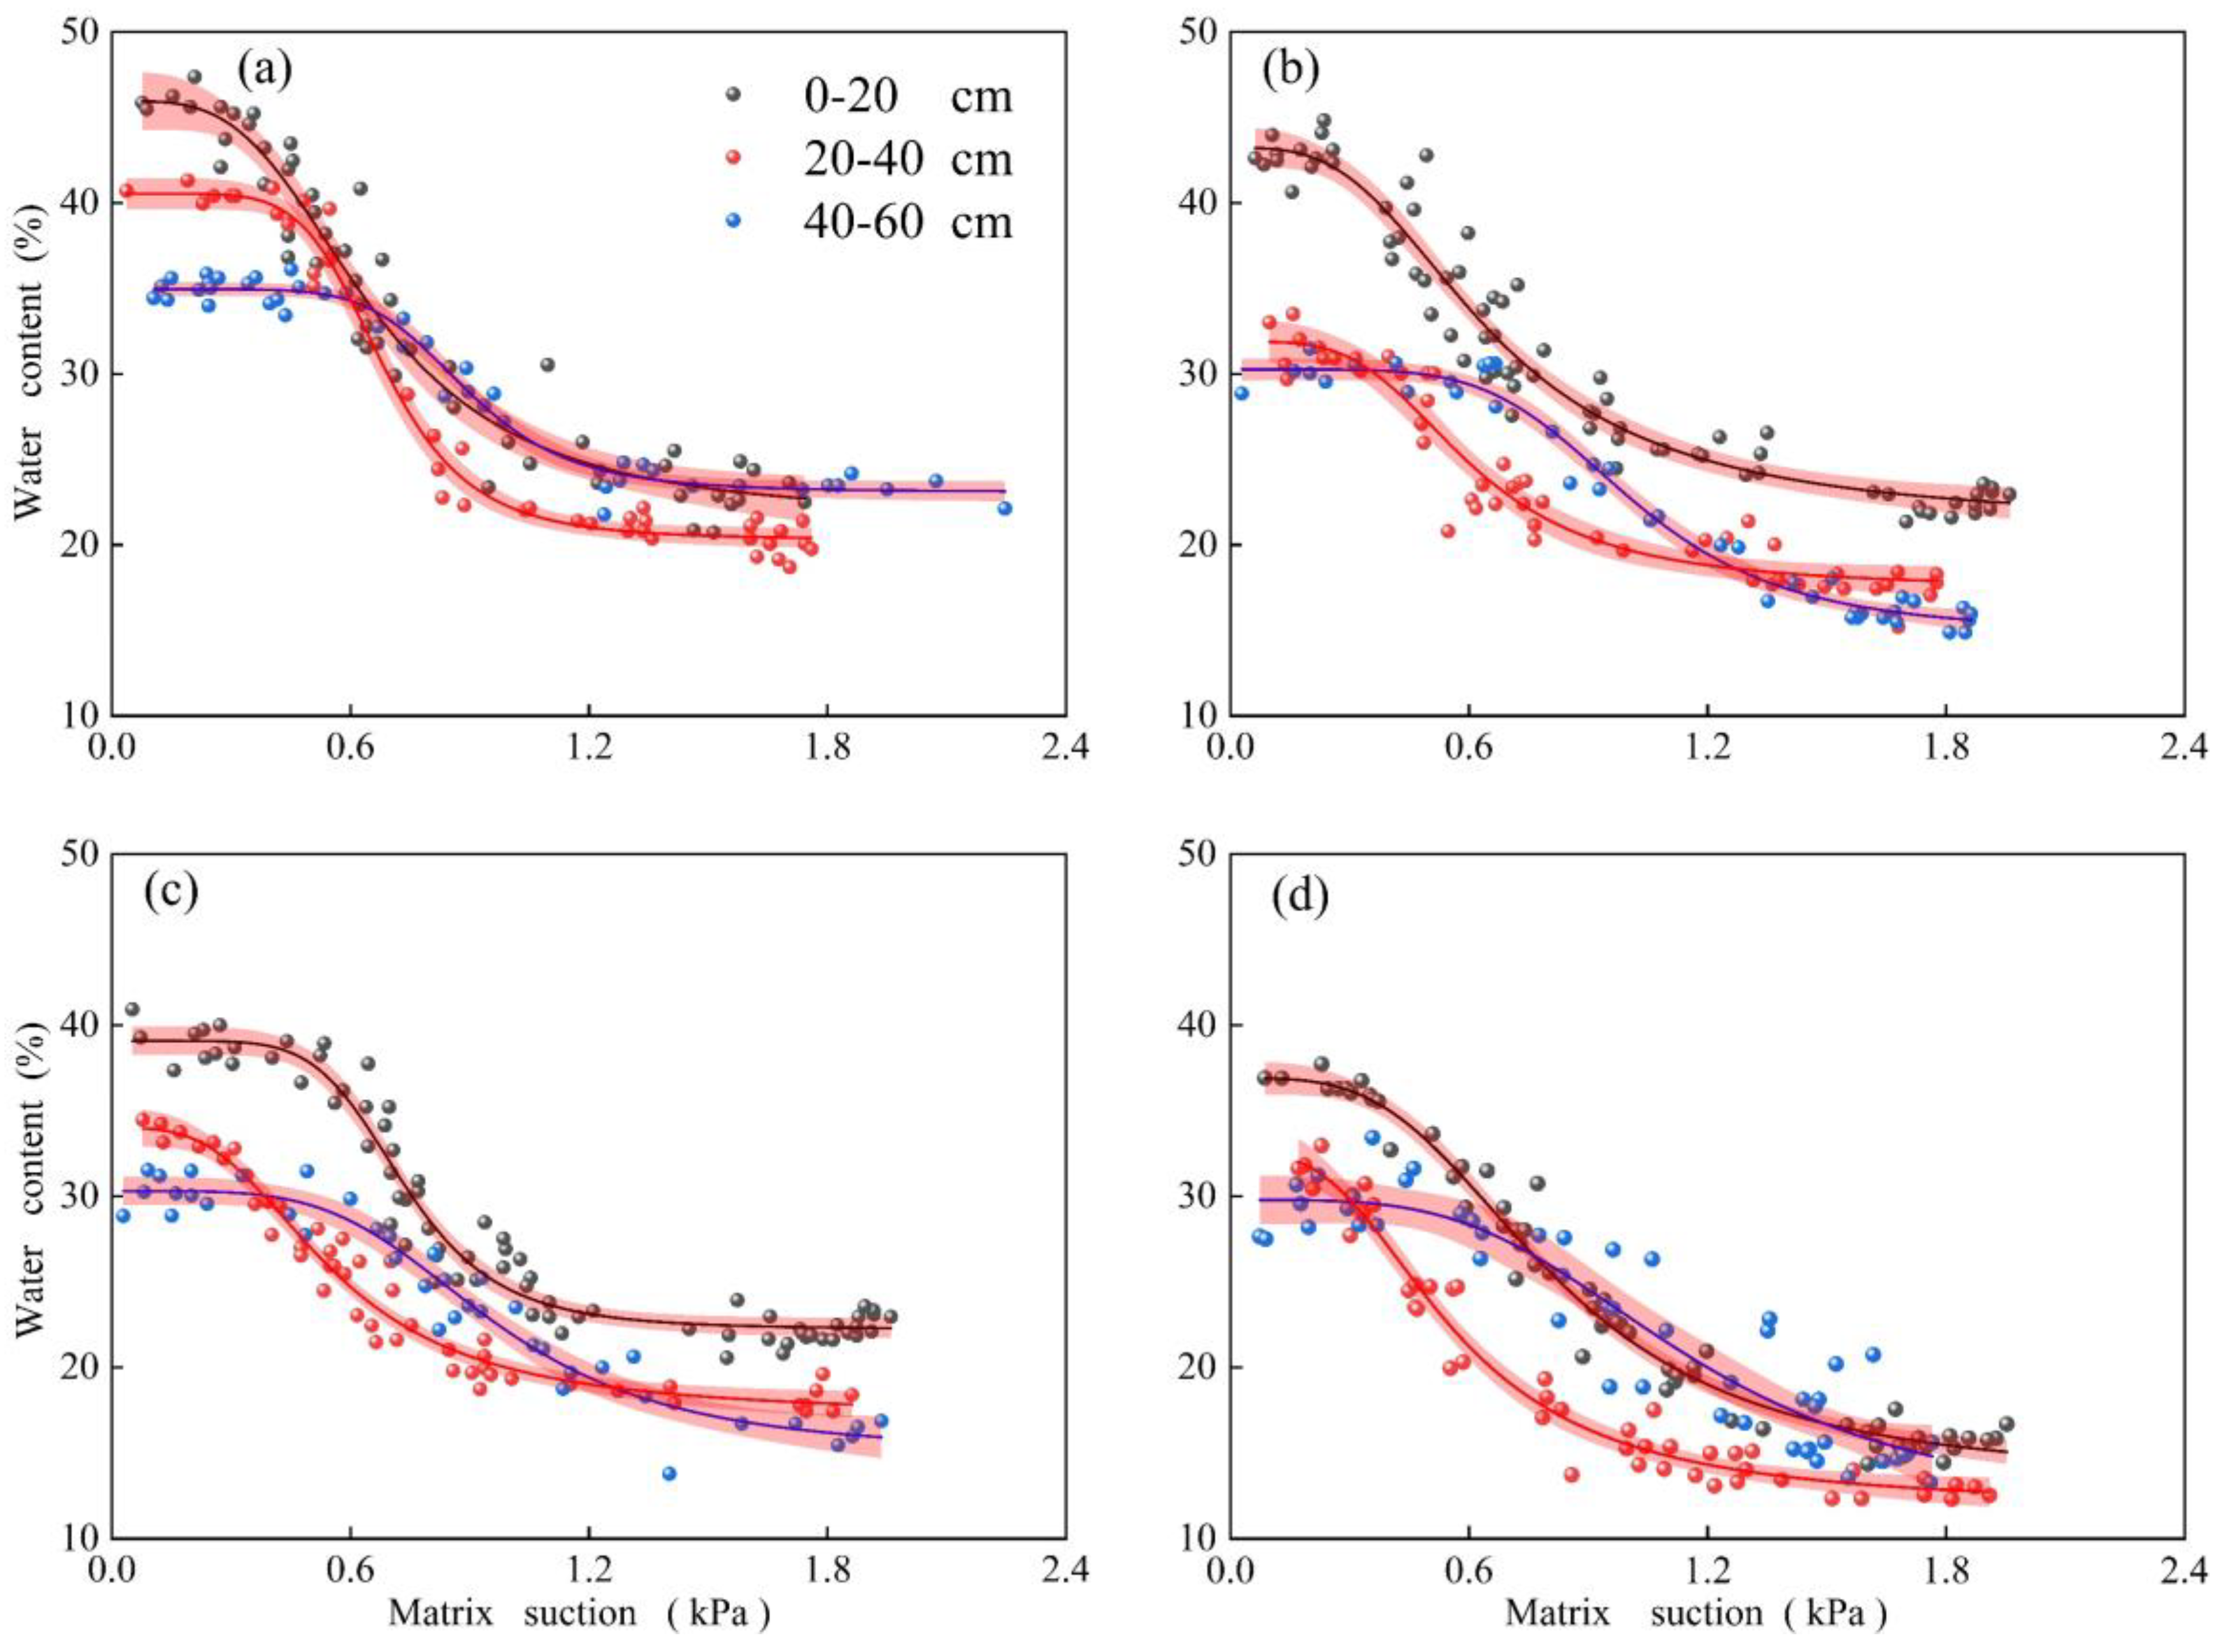
3.5. Analysis of Soil Water Distribution

A total of 20 variable elements related to the influence of soil water distribution were selected, and the Pearson correlation analysis was conducted on all the relevant influencing factors. This analysis aimed to observe the relationships between each variable element and the relationship with the soil water distribution, as well as the correlations between each factor and root data (Figure 7). In Figure 7, SOM stands for soil organic matter; BD stands for bulk density; CP stands for capillary porosity; NCP stands for non-capillary porosity; TP stands for total porosity; MWHC stands for the maximum water-holding capacity; SWC stands for the soil water content; PC stands for the permeability coefficient; IPR stands for the initial infiltration rate; SPR stands for the steady infiltration rate; DR stands for the dyeing area ratio; WSA0.25 stands for >0.25 mm water stable aggregate content; MWD stands for the mean weight diameter; GMD stands for the geometric mean diameter; PAD stands for the disruption agglomerate rate; C stands for soil cohesion; IFA stands for the friction angle. RB stands for root biomass; RWD stands for root weight density; and RLD stands for root length density. Soil bulk density is significantly negatively correlated with various variable elements, except for the degree of fragmentation. While it exhibits a positive correlation with soil bulk density and the internal friction angle, most other correlations are negative. The relationship between non-capillary porosity, the internal friction angle, and other variables is weak. Concerning the correlation between the dyed area ratio and other variable elements, it showed a weak correlation with the internal friction angle, and it was negatively correlated with the degree of fragmentation and soil bulk density. Simultaneously, it demonstrated positive correlations with other variable elements to varying degrees. This paper further investigates the relationships among the root and soil mechanical properties, water distribution, and other indicators. The results reveal significant correlations, with root biomass (RB) showing a strong connection with the root diameter (DR) and cohesion (c). Root length density (RLD) exhibits strong correlations with soil organic matter (SOM), bulk density (BD), capillary porosity (CP), total porosity (TP), water-stable aggregates larger than 0.25 mm (WSA0.25), the mean weight diameter (MWD), and geometric mean diameter (GMD). Root weight density (RWD) demonstrates strong correlations with SOM and the internal friction angle (IFA).
Principal component analysis was performed for each index, with the soil and root traits as explanatory variables (Figure 8). The x- and y-axes represent the unit-less eigenvectors, elucidating the magnitude of variance explained in a certain direction by the principal components, irrespective of their positive or negative values [45,46]. The first two principal components explained 68.0% of the variation in the data. Principal component 1 explained 55.2% of the variation and was primarily associated with RLD, TP, MWD, and RWD. Principal component 2 explained 12.8% of the variation and was mainly associated with PAD. PC1 explained 39.96% of the variation in the dataset, and PC2 explained 17.30% of the variation in all stands. The point distribution of CBF and CF was scattered, while the point distribution of PF and FL was more concentrated. It was evident that different vegetation types exerted varying effects on soil water distribution. A significant positive relationship was found between RLD, MWD, and GMD. The soil dyeing area DR was positively correlated with PC and TP. The soil dyeing area DR was negatively correlated with PAD.
ANOVA single-factor analysis was performed on the root length density, total porosity, soil organic carbon, MWD, cohesion, root biomass, and specific root length, all of which affected the soil water distribution (Table 4). The root biomass exhibited the most significant influence on soil water distribution, accounting for 51.48%, followed by total root length density and total porosity, accounting for 17.49% and 17.09%, respectively. The root system played a substantial role in water distribution, accounting for 79.04%.

4. Discussion

4.1. Variation in Soil Aggregate and Shear Strength

“Red clay” is widely distributed in hilly and mountainous areas, with a deep weathering degree and sticky texture [47]. This is one of the reasons for the low water conservation ability and serious soil and water loss in the hilly and mountainous areas of south China [47]. Regarding two key indicators—the aggregates‘ stability and shear strength—the average indicators of shear strength (c and φ) are 17.28 kPa and 19.88° [48,49,50], and the average mean weight diameter (MWD) of red clay was 0.97 mm [36]. In our study, the shear strength c and φ values of plant-free-planted soil were 5.10 kPa and 29.34° compared to the above studies, where the c value tended to be smaller and the φ value larger [48,49,50]. And the aggregate stability (MWD) in our study was 0.28 mm, which was smaller compared to the above studies (0.97 mm in Cao et al., 2021 [37]). The observed differences in aggregate stability and shear strength in our study could be attributed to the lower clay content and soil organic matter compared to other studies. Compared with other soil types, for example, yellow soil (4.6 mm, 56 Kpa, and 29.5°) and purple soil (14.3 mm) [51] distributed in Jiangsu and Shanxi [52] were smaller. Although the mechanism of action is still unclear, previous studies have established that plant cultivation can significantly enhance soil aggregate stability [36] and soil shear strength [53], including a study by Cao et al. [37], which demonstrated that citrus cultivation can improve aggregate stability by 54.6%, which is close to the value of aggregate stability within CF in this paper. And the study by Liu et al. [53] also proved that the planting of Medicago sativa L., Elymus nutans Griseb., Puccinellia distanx (L.), and Poa pratensis L.) could effectively improve the shear strength of soil, increasing soil cohesion by 100.56% and the internal friction angle increased by 25.25%. The soil shear strength c and φ values in this study for soil-containing plants were 17.26 kPa and 35.16°, the cohesion of the soil increased by 239.2%, and the angle of internal friction increased by 1.5% due to planting. Compared with other studies, the reason for the larger c is that the plants in this study have a long planting year and more roots.
Aggregates‘ stability and soil shear strength showed large variability within the different vegetation types and different soil horizons (Figure 4). Consistent with prior studies, our findings indicate that areas with plant cover exhibit significantly greater aggregate stability compared to fallow land [54,55]. Various soil aggregate-binding agents (e.g., SOC, soil microbial biomass, and GRSPs), recovered with vegetation restoration, play a central role in the formation and stabilization of soil aggregates [56,57]. For our data, soil aggregates‘ stability in different horizons exhibited significant variations depending on the type of vegetation present, aligning with the observations made by Jiang W and Xie H [58]. More specifically, we found that the stability of soil aggregates within CF was higher than in PF (33.7%) and CBF (87.5%). This result is consistent with the idea that monocotyledons (e.g., CF) are superior to dicotyledons (e.g., CBF) for the stabilization of aggregates because the former contain a much larger root biomass (see Table 2, where the root length densities of CF and PF are 1.22 and 1.25 times higher than those of CBF, respectively) with more exudates present [59]. Also, the dead root system on the soil surface was transformed into organic matter due to its own death and decay, and the presence of organic matter has been shown to play an important role in the stabilization and formation of aggregates [60]. The variable best-explaining soil aggregate stability in the 0~20 cm horizon is the SOC and RLD of the finest roots, i.e., in the diameter class of 2 mm. Similar results were found by Angers [61], Pohl et al. [62] and Fattet et al. [48]. In general, the root length density and root weight density with a diameter < 2 had the greatest influence on the MWD of soil aggregates, followed by SOC. A finding similar to that of Fattet et al. [48] was identified where planted roots simultaneously secreted macromolecular secretions such as polysaccharides that promote the stability of aggregates [59].
Both in this study and in previous studies, it has been consistently observed that the cohesion is significantly greater in areas with vegetation cultivation compared to fallow or wasteland [3,63]. The cohesion and internal friction angles of different soil horizons differed significantly depending on the type of vegetation present, as found by Ali and Osman [64]. An analysis of our data showed that the cohesion of CBF was higher than that of CF (18.2%) and PF (25.3%), which is consistent with the findings of Liu et al. [53]. In contrast, the specific root lengths of CF and PF were 1.43 and 1.29 times higher than those of CBF, respectively. The reasons for this are as follows: CBF trees are older, and plant roots are thicker [65]. Among the vegetation types with dense root distribution, large-diameter roots have higher cohesion to provide better structural support [3,66]. In addition, CBF features a thicker and wider descending layer, which increases the soil organic matter content, and the presence of organic matter also increases soil cohesion [67]. An analysis of our data reveals the root length density and organic matter as the factors that best explain the impact on soil cohesion, which is a finding similar to that of Wang et al. [68]. We found a significant positive relationship between soil cohesion and MWD, both of which are affected by plant root length density and organic matter, and the effects on them are both positively correlated. Plant roots with a high tensile strength can increase the cohesion of the soil. Additionally, the roots can secrete root secretions that increase organic matter content and improve aggregate stability. This result is consistent with the findings by Sun et al. [69].

4.2. Multiple Effects of Plants on Soil Water Distribution

The hydrological parameters and infiltration properties of soil are influenced by the pore structure of the soil, which is affected by a number of factors, such as the type of plants, the structure of the soil, and the composition of soil particulate matter [70,71]. The cultivation of different plants can lead to significant differences in the physicochemical properties of the soil [72], consequently impacting the hydrological properties of the soil [73]. Firstly, the presence of plants can modulate the external forces to which the soil is subjected. For example, because of the trampling of more humans and animals, the compaction process of fallow land soil leads to resetting of the soil structure, a reduction in soil porosity [74], and eventually the increase in the soil capacity (Table 3, e.g., Pulido et al. [75]; Yi et al. [76]). The presence of plants reduces the amount of rain that hits the soil directly, and the presence of plants reduces the amount of human and animal passage that compacts the soil directly. This allows the soil to hold more pores and reduces its bulk density [77]. This phenomenon was clearly confirmed in our study. For example, the bulk density of the FL was 1.57 g/cm3, which was 17.2% higher than that of the vegetation types, while the porosity and MWHC of the FL were less than those of the sample plot with vegetation by 28.3%, and 71.8% at this time.
The soil and water characteristic curve Is one of the most important characteristics of soil hydrological properties. It not only directly reflects the water-holding performance of the soil but also indirectly reflects the shear strength and permeability performance of the soil. Compared with other soil types, the water-holding characteristics of red clay are generally considered to be poor, and the saturated water content is generally about 40% [78]. Among them, the saturated water content of surface horizons (depth < 30 cm) in yellow soil is usually measured at 40–50% (e.g., Tu et al. [79], 40%; Wang et al. [80], 45% and Zhao et al. [81], 51%). The saturated water content of surface horizons of black soil in northeast China is usually about 45% [82]. Purple soil surface horizons (depth < 30 cm), similar to the red clay in this study, are generally 40% (e.g., Li et al. [83]; Zhen et al. [84]). In our study, we observed that the maximum water content of red clay ranged from 18% to 51%. This variation is not only related to the soil horizon but also indicates that the deeper the soil horizons are, the lower the saturated water content [80]. Additionally, the type of planted vegetation plays a role, with original mixed forests demonstrating the best soil water retention performance [85,86]. Differences in the soil water-holding properties of different soil horizons have been revealed by many studies [79,80], which show a strong correlation with the porosity and structure of the soil itself (Figure 7 R2(TP and SWC = 0.96)). Previous researchers also believe that the soil porosity ratio degree is the ultimate and most direct factor affecting SWCC [87]. The soil-saturated water content exhibited a negative correlation with sediment content, while it was significantly positively correlated with the soil bulk density, clay content, and organic matter content [88]. The process of soil aggregates also increases the porosity and pore connectivity of the soil, which ultimately affects the saturated water content of the soil. [89] The density and morphological characteristics of plant roots play a direct or indirect role in creating soil voids, thereby altering the soil–water characteristic curve of soil. Our data also confirmed that there was a strong positive correlation between saturated water content and RLD (Figure 7).
Apart from external forces, the increase in the soil organic matter content resulting from rhizosphere secretions of different plants and soil defoliation [90] contributes to soil aggregate formation. This, in turn, augments soil porosity and pore connectivity, ultimately enhancing soil infiltration properties. More specifically, soil organic matter promotes the formation of soil aggregates, thus generating a large number of macropores and increasing soil porosity [89]. Infiltration is typically regulated by the soil structure and aggregates stability [91]: aggregates stability increases soil porosity and, therefore, improves soil infiltration properties [92], thus increasing the dyed area ratio. In contrast, it has also been suggested that the increase in root secretions and the SOC content in the soil during planting changes the geometry of the soil pore network, leading to more tortuous and thin water flow paths [19]. This can hinder soil water distribution. However, in our study, the infiltration performance of the soil was positively correlated with organic matter and aggregates. Soil organic matter promoted the formation of large pores in aggregates, consequently increasing the water infiltration capacity (Figure 7: R2(MWD and DR) = 0.40, p < 0.05, R2(PC and SOC = 0.72, p < 0.01)).
The physical properties of the soil are influenced by external forces, changes in soil organic matter, and, more importantly, by the activity of subsoil organisms and the root system [93]. For example, the results of a series of studies by Jiang et al. [20,25,94] found that the infiltration performance parameters of soil are significantly influenced by the root system of soil plants. Firstly, the influence of plants on both the physicochemical properties and hydrological parameters of the soil decreases with the depth of the soil. And, in this study, the correlation between the root length density and porosity was 0.8, 0.78, and 0.6 in the 0~20 cm, 20~40 cm, and 40~60 cm soil horizons, respectively, as the activity of plant roots and microorganisms decreased with the depth of the soil [95]. In our study, the porosity, saturated water content, maximum water-holding capacity, and permeability coefficient all exhibited a decrease with the decreasing soil horizon (Figure 4, Table 3). It is worth noting that because the higher density of fine roots with D ≤ 2 mm is the largest in PF, the porosity, saturated water content, maximum water-holding capacity, infiltration coefficient, and initial infiltration rate were larger in PF. The finding that fine roots have a greater effect on soil physicochemical properties and hydrological parameters is consistent with Farahnak’s conclusion [22]. It is also important to note that the PF has the greatest impact on the deeper horizons of the soil.
Secondly, although many research results have revealed the direct influence of the presence of plant roots on soil hydrological properties, especially preferential flow phenomena, fewer studies have been able to quantify the influence of roots on soil hydrological properties through dyeing tests. First, and similar to past studies [96], this study confirmed that the total porosity, capillary porosity, and non-capillary porosity of the soil positively correlated with the infiltration of soil water, with the total porosity factor having the strongest correlation. Then, this study showed that the presence of roots had a large effect on the infiltration performance output, with roots with a diameter of ≤2 having the greatest effect [22]. Compared with the porosity of the soil, the root system had less influence on the soil water distribution. And the root length density and root biomass had the greatest effect on the soil water distribution, with a 79.04% contribution of the principal component (Figure 8) and ANOVA analysis (Table 4), while the contribution of water distribution by changing the physical and chemical properties of the soil was 20.96%. Taken together, the root system directly influenced the soil water distribution, and its impact was less influential in changing the soil physicochemical properties and, consequently, the water distribution.
There were significant differences in infiltration among different vegetation types (p < 0.05). The dyeing area of CF was the largest, and the dyeing depth of CF was the deepest, but the distribution of the staining area was not uniform enough. This result was similar to the experimental results of Zhang et al. [97]; the specific root length of coniferous forests was the smallest at 0.7, their root systems were thin, and their root length density was the largest at ≤2 mm in diameter. Preferential flow is the mechanism by which water bypasses a large portion of the matrix porous network along some preferred path, which may result in most of the permeate water passing through these pores at a significantly faster rate than the rest of the permeate water [98]. The presence of preferential flow improves infiltration because the water flows through at a faster rate [99]. In the 0~20 cm soil horizon, PF had the highest root length density of ≤2 mm in diameter, and the specific root length of PF was 0.64, which was smaller than that of CF, and the porosity of PF was the largest, and these factors led to the most uniform dyeing and relatively deep dyeing in PF. Li et al. [9] found that fine roots (≤0.5 mm in diameter) and medium roots (0.5 mm~2 mm in diameter) are the preferred flow formation. Good porosity also facilitated water infiltration. The CBF had the smallest dyeing area, but the largest dyeing area in the 40~60 cm soil horizon had a specific root length of 0.49 and the greatest density of root lengths > 2 mm in diameter. This thicker root system and thicker roots mainly changed the porosity of the soil [97], and water flow could penetrate 40~60 cm deep, resulting in the largest dyeing area in this horizon. The CBF selected for this study was a natural forest, and Zhang et al. [97] concluded that artificial planting can lead to higher soil porosity. Therefore, the dyeing area was less than that of artificially planted forests. The distribution of the dyed area in fallow land was extremely uneven, and the dyed area was mainly concentrated at 0~40 cm. The dyed area at 40~60 cm was less because there was no plant root system in the FL, and the soil porosity was minimal, which led to the absence of preferential flow in the FL. It is also worth mentioning that the influencing factors vary in different soil horizons. In the 0~20 cm soil horizon, fine roots (D ≤ 2 mm) were mainly distributed, and their presence caused preferential soil flow, with the greatest effect on fine roots. While in the 20~40 cm soil horizon, the role of thick roots (D > 10 mm) was greatest (R2 (RLD (D > 10 mm) and DR) = 0.85), thick roots led to increased porosity and promoted water infiltration. In the 40~60 cm soil horizon, the mechanism of action was similar to that of 20~40 cm.

4.3. Research Limitations

One first limitation of this study is that it lacked long-term data monitoring in the field experiment, and the dynamic changes in the data could not be observed due to financial limitations. However, in order to overcome this limitation, we conducted a static analysis of soil water distribution with reference to Nespoulous [35] and tried to consider all relevant aspects. Also, only four typical vegetation types in one study area were selected as research objects in this study (second limitation). In future experiments, more studies should be carried out on other areas, other vegetation types, and different tree ages of the same vegetation to increase the number of research objects so as to improve the general applicability of the research results.
The southern Jiangxi hilly area is an important component of the hilly area of the southern China barrier belt and plays an important role in the ecosystem services of the southern hilly mountain barrier belt. Therefore, for future theoretical research, we can include research from the macroscopic perspective and use experimental data to link the macroscopic changes in spatial and temporal dimensions. This approach aims to provide scientific guidance for understanding and managing ecosystem service functions in the southern Jiangxi hilly area in the future.

5. Conclusions

We conducted measurements on the mechanical and hydrological parameters of soils under four different forest types in the hilly mountainous region of southern China, as well as the distribution characteristics of plant root systems. Our aim was to elucidate the impact mechanisms of soil-related parameters and the presence of plant root systems on soil stability and soil moisture infiltration. In this study, we not only confirmed that the presence of plant root systems has a significant positive effect on soil stability parameters (aggregated stability and shear strength) and infiltration parameters (infiltration systems, infiltration area, etc.) but we also revealed the primary driving factors and mechanisms behind the interactions between soil and plant parameters. For instance, we found that, relative to the soil total porosity and root length density, the parameter with the greatest influence on the soil moisture infiltration area is the root weight (contributed to 51.48%). Therefore, the results of this study can contribute to a deeper understanding of the mechanisms of soil moisture infiltration in the red soil region and provide valuable insights for the formulation of regional soil and water conservation strategies.

Author Contributions

For research articles with several authors, writing—original draft preparation, D.W. and J.Z. (Jinqi Zhu); writing—review and editing, D.W., J.Z. (Jinqi Zhu) and B.Z.; conducting an experiment, D.W., Y.C., Y.J., F.H., L.X. and J.Z. (Jihong Zhang). All authors have read and agreed to the published version of the manuscript.

Funding

This study was supported by the National Natural Science Foundation of China (32201626) and the Key Research and Development Program of Jiangxi Province (Grant No. 20223BBG74S01; 20223BBG71013).

Data Availability Statement

Data are contained within the article.

Conflicts of Interest

The authors declare no conflict of interest.

References

  1. Alvarez, R.; Steinbach, H.S. A review of the effects of tillage systems on some soil physical properties, water content, nitrate availability and crops yield in the Argentine Pampas. Soil Tillage Res. 2009, 104, 1–15. [Google Scholar] [CrossRef]
  2. Barzegar, A.R.; Hashemi, A.M.; Herbert, S.J.; Asoodar, M.A. Interactive effects of tillage system and soil water content on aggregate size distribution for seedbed preparation in Fluvisols in southwest Iran. Soil Tillage Res. 2004, 78, 45–52. [Google Scholar] [CrossRef]
  3. Deljouei, A.; Cislaghi, A.; Abdi, E.; Borz, S.A.; Majnounian, B.; Hales, T.C. Implications of hornbeam and beech root systems on slope stability: From field and laboratory measurements to modelling methods. Plant Soil 2023, 483, 547–572. [Google Scholar] [CrossRef]
  4. Norris, J.E.; Di Iorio, A.; Stokes, A.; Nicoll, B.C.; Achim, A. Species selection for soil reinforcement and protection. In Slope Stability and Erosion Control: Ecotechnological Solutions; Springer: Berlin/Heidelberg, Germany, 2008; pp. 167–210. [Google Scholar] [CrossRef]
  5. Demenois, J.; Rey, F.; Stokes, A.; Carriconde, F. Does arbuscular and ectomycorrhizal fungal inoculation improve soil aggregate stability? A case study on three tropical species growing in ultramafic Ferralsols. Pedobiologia 2017, 64, 8–14. [Google Scholar] [CrossRef]
  6. Osman, N.; Barakbah, S.S. The effect of plant succession on slope stability. Ecol. Eng. 2011, 37, 139–147. [Google Scholar] [CrossRef]
  7. Faxing, S.; Chongjun, T.; Jichao, Z.; Ronggang, Y.; Taihui, Z.; Dekui, N. Water erosion control of undisturbed soil cores by near s-oil surface factors after 5-year vegetation restoration in red sandstone area from subtropical China. J. Soil Sediment 2023, 23, 1356–1369. [Google Scholar] [CrossRef]
  8. Karimi, Z.; Abdi, E.; Deljouei, A.; Cislaghi, A.; Shirvany, A.; Schwarz, M.; Hales, T.C. Vegetation-induced soil stabilization in coastal area: An example from a natural mangrove forest. CATENA 2022, 216, 106410. [Google Scholar] [CrossRef]
  9. Li, J.; Wang, X.; Jia, H.; Liu, Y.; Zhao, Y.; Shi, C.; Zhang, F.; Wang, K. Assessing the soil moisture effects of planted vegetation on slope stability in shallow land slide-prone areas. J. Soil Sediment 2021, 21, 2551–2565. [Google Scholar] [CrossRef]
  10. Grose, P. Composted soil conditioner and mulch promote native plant establishment from seed in a constructed seasonal wetland complex. Ecol. Manag. Restor. 2011, 12, 151–154. [Google Scholar] [CrossRef]
  11. Van Stan, J.T.; Doe. Precipitation Partitioning by Vegetation; Springer International Publishing: Berlin/Heidelberg, Germany, 2020. [Google Scholar] [CrossRef]
  12. Ball, B.C.; Bingham, I.; Rees, R.M.; Watson, C.A.; Litterick, A. The role of crop rotations in determining soil structure and crop growth conditions. Can. J. Soil Sci. 2005, 85, 557–577. [Google Scholar] [CrossRef]
  13. Adams, H.D.; Luce, C.H.; Breshears, D.D.; Allen, C.D.; Weiler, M.; Hale, V.C.; Smith, A.M.S.; Huxman, T.E. Ecohydrological consequences of drought- and infestation- triggered tree die-off: Insights and hypotheses. Ecohydrology 2012, 5, 145–159. [Google Scholar] [CrossRef]
  14. Bengough, A.G.; Croser, C.; Pritchard, J. A biophysical analysis of root growth under mechanical stress. Plant Soil 1997, 189, 107–116. [Google Scholar] [CrossRef]
  15. Dexter, A.R. Compression of soil around roots. Plant Soil 1987, 97, 401–406. [Google Scholar] [CrossRef]
  16. Zhou, B.Z.; Zhang, S.G.; Fu, M.Y. Minirhizotron, a new technique for plant root system research: Its invention, development and application. Chin. J. Ecol. 2007, 26, 253. [Google Scholar]
  17. Grayston, S.J.; Vaughan, D.; Jones, D. Rhizosphere carbon flow in trees, in comparison with annual plants: The importance of root exudation and its impact on microbial activity and nutrient availability. Appl. Soil Ecol. 1997, 5, 29–56. [Google Scholar] [CrossRef]
  18. Traore, O.; Groleau-Renaud, V.; Plantureux, S.; Tubeileh, A.; Boeuf-Tremblay, V. Effect of root mucilage and modelled root exudates on soil structure. Eur. J. Soil Sci. 2000, 51, 575–581. [Google Scholar] [CrossRef]
  19. Fu, Z.; Hu, W.; Beare, M.; Thomas, S.; Carrick, S.; Dando, J.; Langer, S.; Muller, K.; Baird, D.; Lilburne, L. Land use effects on soil hydraulic properties and the contribution of soil organic carbon. J. Hydrol. 2021, 602, 13. [Google Scholar] [CrossRef]
  20. Jiang, X.J.; Liu, W.; Chen, C.; Liu, J.; Yuan, Z.; Jin, B.; Yu, X. Effects of three morphometric features of roots on soil water flow behavior in three sites in China. Geoderma 2018, 320, 161–171. [Google Scholar] [CrossRef]
  21. Gong, Y.W.; Yu, H.J.; Tian, P.; Guo, W.Z.; Chen, L.; Shen, D.T. Field experiments on quantifying the contributions of Coreopsis canopies and roots to controlling runoff and erosion on steep loess slopes. J. Mt. Sci. 2023, 20, 1402–1423. [Google Scholar] [CrossRef]
  22. Farahnak, M.; Mitsuyasu, K.; Hishi, T.; Katayama, A.; Chiwa, M.; Jeong, S.; Kume, A. Relationship between very fine root distribution and soil water content in pre-and post-harvest areas of two coniferous tree species. Forests 2020, 11, 1227. [Google Scholar] [CrossRef]
  23. Materechera, S.A.; Alston, A.M.; Kirby, J.M.; Dexter, A.R. Field evaluation of laboratory techniques for predicting the ability of roots to penetrate strong soil and of the influence of roots on water sorptivity. Plant Soil 1993, 149, 149–158. [Google Scholar] [CrossRef]
  24. Wu, G.; Yang, Z.; Cui, Z.; Liu, Y.; Fang, N.; Shi, Z. Mixed artificial grasslands with more roots improved mine soil infiltration capacity. J. Hydrol. 2016, 535, 54–60. [Google Scholar] [CrossRef]
  25. Jiang, X.J.; Chen, C.; Zhu, X.; Zakari, S.; Singh, A.K.; Zhang, W.; Zeng, H.; Yuan, Z.; He, C.; Yu, S.; et al. Use of dye infiltration experiments and HYDRUS-3D to interpret preferential flow in soil in a rubber-based agroforestry systems in Xishuangbanna, China. CATENA 2019, 178, 120–131. [Google Scholar] [CrossRef]
  26. Czarnes, S.; Hiller, S.; Dexter, A.R.; Hallett, P.D.; Bartoli, F. Root: Soil adhesion in the maize rhizosphere: The rheological approach. Plant Soil 1999, 211, 69–86. [Google Scholar] [CrossRef]
  27. Nciizah, A.D.; Wakindiki, I.I.C. Physical indicators of soil erosion, aggregate stability and erodibility. Arch. Agron. Soil Sci. 2015, 61, 827–842. [Google Scholar] [CrossRef]
  28. Ghorbani, M.; Amirahmadi, E.; Neugschwandtner, R.W.; Konvalina, P.; Kopecky, M.; Moudry, J.; Perna, K.; Murindangabo, Y.T. The impact of pyrolysis temperature on biochar properties and its effects on soil hydrological properties. Sustainability 2022, 14, 14722. [Google Scholar] [CrossRef]
  29. Wei, H.; Deng, Y.; Huang, J.; He, L.; Tang, Q.; Xiao, Y. A quantitative study of the influence of soil organic carbon and pore characteristics on the stability of aggregates of the karst peak-cluster depression area in Southwest China. J. Soil Sediment. 2023, 23, 312–330. [Google Scholar] [CrossRef]
  30. Zuazo, V.H.D.; Pleguezuelo, C.R.R. Soil-erosion and runoff prevention by plant covers. A review. Agron. Sustain. Dev. 2008, 28, 785–811. [Google Scholar] [CrossRef]
  31. Novotný, J.; Klimeš, J. Grain size distribution of soils within the Cordillera Blanca, Peru: An indicator of basic mechanical properties for slope stability evaluation. J. Mt. Sci. 2014, 11, 563–577. [Google Scholar] [CrossRef]
  32. Alderfer, R.B. Influence of seasonal and cultural conditions on aggregation of Hagerstown soil. Soil Sci. 1950, 69, 93–204. [Google Scholar] [CrossRef]
  33. He, Y.F.; Xie, H.L.; Peng, C.Z. Analyzing the behavioural mechanism of farmland abandonment in the hilly mountainous areas in China from the perspective of farming household diversity. Land Use Policy 2020, 99, 104826. [Google Scholar] [CrossRef]
  34. Xu, H.; Song, Y.; Tian, Y. Simulation of land-use pattern evolution in hilly mountainous areas of North China: A case study in Jincheng. Land Use Policy 2022, 112, 105826. [Google Scholar] [CrossRef]
  35. ISO N. 11465; Soil quality- Determination of pH. International Organization for Standardization (ISO): Geneva, Switzerland, 1994.
  36. Nespoulous, J.; Merino-Martín, L.; Monnier, Y. Tropical forest structure and understorey determine subsurface flow through biopores formed by plant roots. Catena 2019, 181, 104061. [Google Scholar] [CrossRef]
  37. Cao, S.; Zhou, Y.; Zhou, Y.; Zhou, X.; Zhou, W. Soil organic carbon and soil aggregate stability as sociated with aggregate fractions in a chronosequence of citrus or chards plantations. J. Environ. Manag. 2021, 293, 8. [Google Scholar] [CrossRef]
  38. Wei, J.; Shi, B.L.; Li, J.L.; Li, S.S.; He, X.B. Shear strength of purple soil bunds under different soil water contents and dry densities: A case study in the Three Gorges Reservoir Area, China. Catena 2018, 166, 124–133. [Google Scholar] [CrossRef]
  39. Zhang, G.L.; Gong, Z.T. Soil Survey Laboratory Methods; China Science Publishing & Media Ltd.: Beijing, China, 2012. [Google Scholar]
  40. Verbist, K.; Torfs, S.; Cornelis, W.M. Comparison of single-and double-ring infiltrometer methods on stony soils. Vadose Zone J. 2010, 9, 462–475. [Google Scholar] [CrossRef]
  41. Elliott, E.T. Aggregate Structure and Carbon, Nitrogen, and Phosphorus in Native and Cultivated Soils. Soil Sci. Soc. Am. J. 1986, 50, 627–633. [Google Scholar] [CrossRef]
  42. Zhu, G.; Shangguan, Z.; Deng, L. Variations in soil aggregate stability due to land use changes from agricultural land on the Loess Plateau, China. CATENA 2021, 200, 105181. [Google Scholar] [CrossRef]
  43. Defossez, P.; Veylon, G.; Yang, M.; Bonnefond, J.M.; Garrigou, D.; Trichet, P.; Danjon, F. Impact of soil water content on the overturning resistance of young Pinus Pinaster in sandy soil. For. Ecol. Manag. 2021, 480, 118614. [Google Scholar] [CrossRef]
  44. Van Genuchten, M.T. A closed-form equation for predicting the hydraulic conductivity of unsaturated soils. Soil Sci. Soc. Am. J. 1980, 44, 892–898. [Google Scholar] [CrossRef]
  45. Kent, M.G.; Schiavon, S.; Jakubiec, J.A. A dimensionality reduction method to select the most representative daylight illuminance distributions. J. Build. Perform. Simul. 2020, 13, 122–135. [Google Scholar] [CrossRef]
  46. Zhao, L.; Yang, Y.H. Theoretical analysis of illumination in PCA-based vision systems. Pattern Recognit. 1999, 32, 547–564. [Google Scholar] [CrossRef]
  47. Zhao, Q.G.; Huang, G.Q.; Ma, Y.Q. The problems in red soil ecosystem in southern of China and its countermeasures. Acta Ecol. Sin. China 2013, 33, 7615–7622. [Google Scholar]
  48. Fattet, M.; Fu, Y.; Ghestem, M.; Ma, W.; Foulonneau, M.; Nespoulous, J.; Le Bissonnais, Y.; Stokes, A. Effects of vegetation type on soil resistance to erosion: Relationship between aggregate stability and shear strength. Catena 2011, 87, 60–69. [Google Scholar] [CrossRef]
  49. Wang, Q.; Chen, J.; Liu, J.; Yu, M.; Geng, W.; Wang, P.; Wu, Z. Relationships between shear strength parameters and microstructure of alkaline-contaminated red clay. Environ. Sci. Pollut. Res. 2020, 27, 33848–33862. [Google Scholar] [CrossRef] [PubMed]
  50. Zhang, Y.; Zhong, X.; Lin, J.; Zhao, D.; Jiang, F.; Wang, M.; Ge, H.; Huang, Y. Effects of fractal dimension and water content on the shear strength of red soil in the hilly granitic region of southern China. Geomorphology 2020, 360, 1. [Google Scholar] [CrossRef]
  51. Chong-Feng, B.U.; Gale, W.J.; Qiang-Guo, C.A.I.; Shu-Fang, W.U. Process and mechanism for the development of physical crusts in three typical Chinese soils. Pedosphere 2013, 23, 321–332. [Google Scholar] [CrossRef]
  52. Liu, J.; Shi, B.; Jiang, H.; Huang, H.; Wang, G.; Kamai, T. Research on the stabilization treatment of clay slope topsoil by organic polymer soil stabilizer. Eng. Geol. 2011, 117, 114–120. [Google Scholar] [CrossRef]
  53. Liu, Y.; Hu, X.; Yu, D.M.; Zhu, H.L.; Li, G.R. Influence of the roots of mixed-planting species on the shear strength of saline loess soil. J. Mt. Sci. 2021, 18, 806–818. [Google Scholar] [CrossRef]
  54. Duchicela, J.; Sullivan, T.S.; Bontti, E.; Bever, J.D. Soil aggregate stability increase is strongly related to fungal community succession along an abandoned agricultural field chronosequence in the Bolivian Altiplano. J. Appl. Ecol. 2013, 50, 1266–1273. [Google Scholar] [CrossRef]
  55. Zhang, Y.; Niu, J.; Zhang, M.; Xiao, Z.; Zhu, W. Interaction between plant roots and soil water flow in response to preferential flow paths in northern China. Land Degrad. Dev. 2017, 28, 648–663. [Google Scholar] [CrossRef]
  56. Luna, L.; Miralles, I.; Andrenelli, M.C.; Gispert, M.; Pellegrini, S.; Vignozzi, N.; Sole-Benet, A. Restoration techniques affect soil organic carbon, glomalin and aggregate stability in degraded soils of a semiarid Mediterranean region. Catena 2016, 143, 256–264. [Google Scholar] [CrossRef]
  57. Six, J.; Bossuyt, H.; Degryze, S.; Denef, K. A history of research on the link between (micro)aggregates, soil biota, and soil organic matter dynamics. Soil Tillage Res. 2004, 79, 7–31. [Google Scholar] [CrossRef]
  58. Jiang, W.; Li, Z.; Xie, H.; Ouyang, K.; Yuan, H.; Duan, L. Land use change impacts on red slate soil aggregates and associated organic carbon in diverse soil layers in subtropical China. Sci. Total Environ. 2023, 856, 11. [Google Scholar] [CrossRef] [PubMed]
  59. Fageria, N.K.; Stone, L.F. Physical, Chemical, and Biological Changes in the Rhizosphere and Nutrient Availability. J. Plant Nutr. 2006, 29, 1327–1356. [Google Scholar] [CrossRef]
  60. Larsbo, M.; Koestel, J.; Kotterer, T.; Jarvis, N. Preferential Transport in Macropores is Reduced by Soil Organic Carbon. Vadose Zone J. 2016, 15, 7. [Google Scholar] [CrossRef]
  61. Angers, D.A. Changes in soil aggregation and organic-carbon under corn and alfalfa. Soil Sci. Soc. Am. J. 1992, 56, 1244–1249. [Google Scholar] [CrossRef]
  62. Pohl, M.; Alig, D.; Koerner, C.; Rixen, C. Higher plant diversity enhances soil stability in disturbed alpine ecosystems. Plant Soil 2009, 324, 91–102. [Google Scholar] [CrossRef]
  63. Tan, H.; Chen, F.; Chen, J.; Gao, Y. Direct shear tests of shear strength of soils reinforced by geomats and plant roots. Geotext. Geomembr. 2019, 47, 780–791. [Google Scholar] [CrossRef]
  64. Ali, F.H.; Osman, N. Shear strength of a soil containing vegetation roots. Soils Found. 2008, 48, 587–596. [Google Scholar] [CrossRef]
  65. John, B.; Pandey, H.N.; Tripathi, R.S. Vertical distribution and seasonal changes of fine and coarse root mass in Pinus kesiya Royle Ex. Gordon forest of three different ages. Acta Oecol. 2001, 22, 293–300. [Google Scholar] [CrossRef]
  66. Schmidt, K.M.; Roering, J.J.; Stock, J.D.; Dietrich, W.E.; Montgomery, D.R.; Schaub, T. The variability of root cohesion as an influence on shallow landslide susceptibility in the Oregon Coast Range. Can. Geotech. J. 2001, 38, 995–1024. [Google Scholar] [CrossRef]
  67. Kemper, W.D.; Rosenau, R.C.; Dexter, A.R. Cohesion development in disrupted soils as affected by clay and organic-matter content and temperature. Soil Sci. Soc. Am. J. 1987, 51, 860–867. [Google Scholar] [CrossRef]
  68. Wang, J.; Feng, S.; Ni, S.; Wen, H.; Cai, C.; Guo, Z. Soil detachment by overland flow on hillslopes with permanent gullies in the Granite area of southeast China. Catena 2019, 183, 9. [Google Scholar] [CrossRef]
  69. Sun, Y.; Li, H.; Cheng, Z.; Dong, J.; Wang, Y. Experimental and Numerical Simulation Study on Mechanical Properties of Shallow Slope Root-soil Composite in Qinghai Area. KSCE J. Civ. Eng. 2023, 27, 2834–2852. [Google Scholar] [CrossRef]
  70. Belnap, J. The potential roles of biological soil crusts in dryland hydrologic cycles. Hydrol. Process. 2006, 20, 3159–3178. [Google Scholar] [CrossRef]
  71. Skorobogatov, A.; He, J.; Chu, A.; Valeo, C.; van Duin, B. The impact of media, plants and their interactions on bioretention performance: A review. Sci. Total Environ. 2020, 715, 14. [Google Scholar] [CrossRef]
  72. Quesada, C.A.; Lloyd, J.; Schwarz, M.; Baker, T.R.; Phillips, O.L.; Patino, S.; Czimczik, C.; Hodnett, M.G.; Herrera, R.; Arneth, A.; et al. Regional and large-scale patterns in Amazon forest structure and function are mediated by variations in soil physical and chemical properties. Biogeosci. Discuss. 2009, 6, 3993–4057. [Google Scholar] [CrossRef]
  73. Cosby, B.J.; Hornberger, G.M.; Clapp, R.B.; Ginn, T.R. A statistical exploration of the relationships of soil-moisture characteristics to the physical-properties of soils. Water Resour. Res. 1984, 20, 682–690. [Google Scholar] [CrossRef]
  74. Alaoui, A.; Lipiec, J.; Gerke, H.H. A review of the changes in the soil pore system due to soil deformation: A hydrodynamic perspective. Soil Tillage Res. 2011, 115, 1–15. [Google Scholar] [CrossRef]
  75. Pulido, M.; Schnabel, S.; Contador, J.F.L.; Lozano-Parra, J.; Gomez-Gutierrez, A.; Brevik, E.C.; Cerda, A. Reduction of the frequency of herbaceous roots as an effect of soil compaction induced by heavy grazing in rangelands of SW Spain. Catena 2017, 158, 381–389. [Google Scholar] [CrossRef]
  76. Yi, J.; Qiu, W.; Hu, W.; Zhang, H.; Liu, M.; Zhang, D.; Wu, T.; Tian, P.; Jiang, Y. Effects of cultivation history in paddy rice on vertical water flows and related soil properties. Soil Tillage Res. 2020, 200, 12. [Google Scholar] [CrossRef]
  77. Shah, A.N.; Tanveer, M.; Shahzad, B.; Yang, G.; Fahad, S.; Ali, S.; Bukhari, M.A.; Tung, S.A.; Hafeez, A.; Souliyanonh, B. Soil compaction effects on soil health and crop productivity: An overview. Environ. Sci. Pollut. Res. 2017, 24, 10056–10067. [Google Scholar] [CrossRef] [PubMed]
  78. Kaixi, X.; Beena, A.; Binod, T.; Yanxiang, H. Effect of long duration rainstorm on stability of Red-clay slopes. Geoenviron. Disasters 2016, 3, 12. [Google Scholar] [CrossRef]
  79. Tu, X.B.; Kwong, A.K.L.; Dai, F.C.; Tham, L.G.; Min, H. Field monitoring of rainfall infiltration in a loess slope and analysis of failure mechanism of rainfall-induced landslides. Eng. Geol. 2009, 105, 134–150. [Google Scholar] [CrossRef]
  80. Wang, Z.; Li, X.; Shi, H.; Li, W.; Yang, W.; Qin, Y. Estimating the water characteristic curve for soil containing residual plastic film based on an improved pore-size distribution. Geoderma 2020, 370, 114341. [Google Scholar] [CrossRef]
  81. Zhao, W.; Liu, Y.; Hu, J.; Li, Z. Spatiotemporal variability of soil-water characteristic curve model parameters of Lanzhou collapsible loess. Water Supply 2022, 22, 1770–1780. [Google Scholar] [CrossRef]
  82. Jiang, H.; Niu, F.; Zhang, H.; Wang, E.; Ma, Q. Study on Soil Water Characteristics of Black Soil, Northeast China. J. Civ. Eng. 2014, 1010–1012, 1153–1157. [Google Scholar] [CrossRef]
  83. Li, D.; Wang, S.J.; Li, X.; Chen, H.K.; Liang, G.C.; Jiang, W.J. Soil-water characteristic curve of sandy clayey purple soil under different overburden pressures. Chin. J. Geotech. 2021, 43, 1950–1956. [Google Scholar] [CrossRef]
  84. Zhen, W.J.; Wei, J.; Tang, J.L.; He, Y. Soil-water Characteristics and Shear Strength of Root-soil Composites from Purple-soiled Bunds. J. Soil Water Conserv. 2023, 37, 75–82. [Google Scholar] [CrossRef]
  85. Zheng, X.; Chen, L.; Gong, W.; Yang, X.; Kang, Y. Evaluation of the water conservation function of different forest types in Northeastern China. Sustainability 2019, 11, 4075. [Google Scholar] [CrossRef]
  86. Gong, C.; Tan, Q.; Liu, G.; Xu, M. Impacts of mixed forests on controlling soil erosion in China. Catena 2022, 213, 106147. [Google Scholar] [CrossRef]
  87. Han, Z.S.; Vanapalli, K. Stiffness and shear strength of unsaturated soils in relation to soil-water characteristic curve. Géotechnique 2016, 66, 627–647. [Google Scholar] [CrossRef]
  88. Bai, Z.; Duan, X.; Ding, J.; Liu, G.; Shi, X.; Feng, D.; Han, X. An Experience estimation model of soil available water-holding capacity: A case study of black soil. Chin. Agric. Sci. Bull. 2015, 31, 153–159. [Google Scholar]
  89. Kay, B.D. Soil structure and organic carbon: A review. In Soil Processes Carbon Cycle; CRC Press: Boca Raton, FL, USA, 2018; pp. 169–197. [Google Scholar]
  90. Panchal, P.; Preece, C.; Penuelas, J.; Giri, J. Soil carbon sequestration by root exudates. Trends Plant Sci. 2022, 27, 9. [Google Scholar] [CrossRef]
  91. Boxell, J.; Drohan, P.J. Surface soil physical and hydrological characteristics in Bromus tectorum L. (cheatgrass) versus Artemisia tridentata Nutt. (big sagebrush) habitat. Geoderma 2009, 149, 305–311. [Google Scholar] [CrossRef]
  92. Bronick, C.J.; Lal, R. Soil structure and management: A review. Geoderma 2005, 124, 3–22. [Google Scholar] [CrossRef]
  93. Nair, P.K.R.; Nair, V.D.; Kumar, B.M.; Showalter, J.M. Carbon sequestration in agroforestry systems. Adv. Agron. 2010, 108, 237–307. [Google Scholar] [CrossRef]
  94. Jiang, X.J.; Liu, S.; Zhang, H. Effects of different management practices on vertical soil water flow patterns in the Loess Plateau. Soil Tillage Res. 2017, 166, 33–42. [Google Scholar] [CrossRef]
  95. Noguchi, S.; Nik, A.R.; Sammori, T.; Tani, M.; Tsuboyama, Y. Rainfall characteristics of tropical rain forest and temperate forest: Comparison between Bukit Tarek in Peninsular Malaysia and Hitachi Ohta in Japan. Trop. For. Sci 1996, 9, 206–220. [Google Scholar]
  96. Cui, Z.; Wu, G.; Huang, Z.; Liu, Y. Fine roots determine soil infiltration potential than soil water content in semi-arid grassland soils. J. Hydrol. 2019, 578, 8. [Google Scholar] [CrossRef]
  97. Zhang, W.; Wang, L.; Tang, Z.; Zhang, Y. Effects of the Root System Architecture of Pinus taeda and Phyllostachys edulis on the Index of Hydrological Connectivity in Subtropical Forest Ecosystems. Forests 2022, 13, 2008. [Google Scholar] [CrossRef]
  98. Hendrickx, J.M.H.; Flury, M. Uniform and preferential flow mechanisms in the vadose zone. conceptual models of flow and transport in the fractured vadose zone. In Conceptual Models of Flow and Transport in the Fractured Vadose Zone; National Academies Press: Washington, DC, USA, 2001; pp. 149–187. [Google Scholar]
  99. Allison, G.B.; Hughes, M.W. The use of natural tracers as indicators of soil-water movement in a temperate semi-arid region. J. Hydrol. 1983, 60, 157–173. [Google Scholar] [CrossRef]
Figure 1. Location of the experimental site.
Water 16 00350 g001
Figure 2. Field dyeing experiment.
Water 16 00350 g002
Figure 3. Typical soil water characteristic curve for different vegetation types and soil horizons. (a): CBF. (b): CF. (c): PF. (d): FL.
Water 16 00350 g003
Figure 4. Boxplots of indices under different vegetation types and soil depths. (a): Bulk density; (b): organic matter; (c): porosity; (d): capillary porosity; (e): maximum water holding capacity; (f): non-capillary porosity; (g): weight mean diameter; (h): geometric mean diameter; (i): saturated water content; (j): cohesion; and (k): friction angle. Each of the boxes was based on nine tests, as indicated by the circles, and their outliers are indicated by ‘·’. The blue horizontal dash lines highlight the fallow land along the y-axis.
Water 16 00350 g004
Figure 5. Permeability coefficient, initial infiltration rate, and steady infiltration rate of different vegetation types and different soil horizons. (a): initial infiltration rate, and steady infiltration rate; (b): permeability coefficient.
Water 16 00350 g005
Figure 6. Dyeing area ratio of different vegetation types and different soil horizons. (ac): Three plots of CBF; (df): three plots of CF; (gi): three plots of PF; and (jl): three plots of FL.
Water 16 00350 g006
Figure 7. Correlation analysis of each index. * Significant at the 0.05 level, ** significant at the 0.01 level, and *** significant at the 0.001 level.
Water 16 00350 g007
Figure 8. A biplot of principal component analysis of soil water distribution, soil aggregate stability, soil shear strength, physical and chemical soil properties, and root index.
Water 16 00350 g008
Table 1. The specific situation of the four vegetation types.
Vegetation TypeTree AgeTree Height
(m)
Slope (°)Aspect of
Slope
Altitude (m)Canopy Density (%)Diameter at Breast Height (cm)
CBF251313southeast22080114
CF81613southeast1408798
PF181212southeast1207555
FL5/9southeast100//
Table 2. Root distribution in the different vegetation types and soil horizons.
PlotSoil
Horizon/cm
Root Biomass/gSRLRoot Length Density/m·m−3Root Weight Density/kg·m−3
≤2 mm2~10 mm>1 mmSUM≤2 mm2~10 mm>10 mmSUM
CBF0~20235.310.09125.74548.1817.75691.674.6285.5227.52117.66
20~4053.170.21125.80128.326.93261.053.3517.445.8026.59
40~6032.640.20101.6495.420.00197.062.8313.490.0016.32
CF0~2099.470.21369.53303.511.48674.5112.4936.870.3849.74
20~4068.470.20244.06222.062.37468.498.2524.921.0634.24
40~6036.530.29151.59117.121.09269.803.8413.830.5918.26
PF0~2090.550.28406.46303.400.55710.4115.8129.390.0745.27
20~4079.200.16169.40318.890.00488.296.6832.920.0039.60
40~6046.120.20153.15138.060.78291.996.7116.410.0623.06
FL0~20235.880.000.000.000.000.000.000.000.000.00
20~40120.340.000.000.000.000.000.000.000.000.00
40~6045.030.000.000.000.000.000.000.000.000.00
Table 3. Soil physical and chemical properties under different vegetation types and soil horizons.
PlotSoil
Horizon/cm
Particle Size Distribution/(%)Bulk Density/(g/cm3)Organic Matter/(g/kg)Soil Water Content/(%)Saturated Water Content/(%)Maximum Water Retention/(%)Porosity/(%)
Sand
2 mm~50 μm
Silt
50 μm~2 μm
Clay
<2 μm
CBF0~205.4663.2731.271.38 ± 0.1923.26 ± 1.9012.34 ± 4.8939.74 ± 6.5931.04 ± 6.7847.86 ± 7.21
20~406.7065.3927.911.49 ± 0.8417.07 ± 3.6710.67 ± 3.1834.63 ± 5.4428.68 ± 4.3643.84 ± 3.16
40~605.8364.0430.131.66 ± 0.966.37 ± 2.409.75 ± 3.8728.43 ± 6.7525.52 ± 6.5237.46 ± 3.63
CF0~202.6950.1747.141.27 ± 0.1438.78 ± 3.4820.60 ± 8.6238.45 ± 7.7835.30 ± 7.2252.00 ± 5.17
20~404.4463.4232.141.34 ± 0.1214.89 ± 4.1918.78 ± 5.9235.79 ± 6.4833.30 ± 6.4549.17 ± 4.50
40~605.2071.0223.781.48 ± 0.0810.59 ± 4.7018.21 ± 7.8232.55 ± 6.3130.66 ± 5.9244.13 ± 2.87
PF0~205.0652.5042.441.02 ± 0.1321.98 ± 9.6821.46 ± 5.7655.86 ± 8.8251.24 ± 7.4761.37 ± 4.74
20~405.6754.4939.841.20 ± 0.1513.22 ± 5.5917.89 ± 6.6147.24 ± 6.8345.66 ± 6.4154.76 ± 5.50
40~606.4456.4437.121.30 ± 0.087.80 ± 4.4716.05 ± 7.1643.48 ± 5.1942.91 ± 5.4150.82 ± 2.92
FL0~201.5520.5477.921.53 ± 0.086.45 ± 2.0411.75 ± 4.2131.80 ± 6.3524.93 ± 4.3942.10 ± 3.07
20~401.2319.9778.801.58 ± 0.044.81 ± 1.979.32 ± 3.9227.83 ± 5.8720.95 ± 6.6240.57 ± 1.35
40~600.9520.1778.891.61 ± 0.042.79 ± 1.026.63 ± 3.7525.34 ± 5.7117.90 ± 7.7739.29 ± 1.62
Table 4. Contribution of main factors to the soil dyeing area via ANOVA.
FactorContribution to Soil Dyeing Area
Root length density
(D ≤ 2 mm)
6.89%
Root length density
(SUM)
17.49%
Total porosity17.09%
Soil organic carbon1.15%
Mean weight diameter0.48%
Soil cohesion2.24%
Root biomass51.48%
Specific root length3.18%
Disclaimer/Publisher’s Note: The statements, opinions and data contained in all publications are solely those of the individual author(s) and contributor(s) and not of MDPI and/or the editor(s). MDPI and/or the editor(s) disclaim responsibility for any injury to people or property resulting from any ideas, methods, instructions or products referred to in the content.

