Article

Characteristics of Greenhouse Gas Emissions from Constructed Wetlands Vegetated with Myriophyllum aquatic: The Effects of Influent C/N Ratio and Microbial Responses

1
College of Resources, Hunan Agricultural University, Changsha 410128, China
2
Key Laboratory of Agro-Ecological Processes in Subtropical Regions, Changsha Research Station for Agricultural & Environmental Monitoring, Institute of Subtropical Agriculture, Chinese Academy of Sciences, Changsha 410125, China
3
Institute of Natural Resources Monitoring and Comprehensive Land Improvement of Henan Province, Zhengzhou 450016, China
4
University of Chinese Academy of Sciences, Beijing 100039, China
*
Authors to whom correspondence should be addressed.
Water 2024, 16(2), 308; https://doi.org/10.3390/w16020308
Submission received: 27 November 2023 / Revised: 14 January 2024 / Accepted: 15 January 2024 / Published: 17 January 2024

Abstract

:
This study designed surface flow constructed wetlands (SFCWs) with Myriophyllum aquaticum (M. aquaticum) to evaluate how different influent C/N ratios (0:1 (C0N), 5:1 (C5N), 10:1 (C10N), and 15:1 (C15N)) affect pollutant removal, greenhouse gas (GHG) emissions, and microbial communities. The results showed that effluent ammonia nitrogen ( N H 4 + -N), nitrate nitrogen ( N O 3 -N), and total nitrogen (TN) concentrations decreased, but effluent chemical oxygen demand (COD) concentration increased with increasing influent C/N ratios. The highest removal rates of TN (73.17%) and COD (74.56%) were observed with C5N. Regarding GHG emissions, a few changes in CO2 fluxes were caused by the influent C/N ratio, whereas CH4 fluxes obviously increased with the increasing influent C/N ratio. The highest N2O emission occurred with C0N (211.03 ± 44.38 mg-N·m−2·h−1), decreasing significantly with higher C/N ratios. High-throughput sequencing revealed that different influent C/N ratios directly influenced the microbial distribution and composition related to CH4 and N2O metabolism in SFCWs. The highest abundance (46.24%) of denitrifying bacteria (DNB) was observed with C5N, which helped to achieve efficient nitrogen removal with a simultaneous reduction in N2O emissions. Methanogen abundance rose with higher C/N ratios, whereas methanotrophs peaked under C5N and C10N conditions. Additionally, the random forest model identified influent C/N ratio and Rhodopseudomonas as primary factors influencing CH4 and N2O emissions, respectively. This highlights the importance of the influent C/N ratio in regulating both pollutant removal and GHG emissions in constructed wetlands.

1. Introduction

Constructed wetlands (CWs) are commonly used for their cost-effectiveness and easy management [1]. However, CWs emit 2–10 times more GHGs per unit area than natural wetlands [2], including carbon dioxide (CO2), methane (CH4), and nitrous oxide (N2O), which contribute significantly to global warming and ozone layer destruction [3]. With the ongoing promotion and development of CWs for wastewater treatment, assessing their potential atmospheric impact is essential [4]. The GHG emissions from CWs are affected by factors such as operation duration, the carbon and nitrogen load of the influent water, and the plant species used [5,6,7]. The influent C/N ratio has been found to be a critical factor in determining nitrogen conversion, as it can either promote or inhibit microbial activity, affecting both pollutant removal and GHG emissions [6,8]. Many studies have investigated the impact of the influent C/N ratio on pollutant removal performance in CWs, with some reporting better results for ratios of 5 [9,10], 10 [11], and 12 [12]. Lower ratios may hinder denitrification, reducing nitrogen removal efficiency [13]. Higher pollutant removal rates improve pollutant removal but may deplete dissolved oxygen (DO) due to excess organic matter decomposition, creating anoxic conditions that inhibit aerobic microbial activity [14]. Therefore, determining an appropriate influent C/N ratio range is essential for the efficient operation of CWs.
The microbial transformation process in CWs emits three main GHGs: CO2, CH4, and N2O [11]. When evaluating the pollutant removal performance of CWs with different influent C/N ratios, it is important to consider the impact on GHG emissions. Several studies have shown that N2O emissions from CWs are lowest with influent C/N ratios of 10 or 12, compared to ratios of 0, 1, 3, and 6 [11,14]. Higher influent C/N ratios have also been found to generally reduce N2O emissions. In contrast, CH4 emissions from CWs have been shown to increase with increasing influent C/N ratios [4,15]. Additionally, CO2 emissions have been found to be affected by the influent C/N ratio. Yan et al. [16] observed an increase in CO2 gas flux when increasing the C/N ratio from 2.5 to 10 by increasing the influent carbon load, while changing the C/N ratio with an increase in influent nitrogen load resulted in a decreasing trend in CO2 gas flux. Therefore, proper regulation of the influent C/N ratio is crucial for controlling GHG emissions from CWs.
GHG emissions in CWs are primarily driven by microorganisms, and the influent C/N ratio plays a critical role in determining the composition and distribution of functional microorganisms in these systems. Methanogens and methanotrophs are functionally important microorganisms for CH4 metabolism and carbon cycling in CWs [17], with the former being able to produce CH4 using simple inorganic (e.g., H2 and CO2) and organic compounds (acetate, etc.) as substrates, and the latter being able to oxidize CH4 in aerobic or anoxic environments [18]. N2O emissions in CWs are intimately related to the composition and abundance of nitrifying bacteria and DNB [19]. Incomplete nitrification and denitrification processes can both produce N2O, a potent greenhouse gas. Proper regulation of the influent C/N ratio can create suitable environments for functional microorganisms to reduce the emission of CH4 and N2O, thus decreasing the contribution of CWs to the Earth’s global warming potential (GWP) [20].
This study aims to investigate the pollutant removal efficiency and GHG emission characteristics of M. aquaticum SFCWs under different influent C/N ratios, determine the optimal influent C/N ratio, reveal the mechanism behind C/N ratio regulation on pollutant removal and GHG emission, and provide theoretical references for the high-efficiency and environmentally friendly operation of these systems. The objectives are as follows: (1) to evaluate the effect of influent C/N ratio on the removal efficiency of pollutants ( N H 4 + -N, N O 3 - -N, TN, and COD) and emission fluxes of GHGs (CO2, CH4, and N2O) in M. aquaticum SFCWs, (2) to analyze the effect of influent C/N ratio on the abundance and composition of microorganisms associated with CH4 and N2O emissions, and (3) to determine the critical drivers that affect CH4 and N2O emissions.

2. Materials and Methods

2.1. Construction and Operation of SFCWs

The experiment was conducted in a shelter at the Changsha Research Station for Agricultural & Environmental Monitoring of the Chinese Academy of Sciences to ensure the necessary light and temperature conditions while avoiding the effects of rainfall and other environmental factors. Crates with a length, width, and height of 50 × 32 × 30 cm were used to simulate SFCWs. The main substrate used was red soil with a pH of 5.85, TN content of 0.21 g·kg−1, TP content of 0.25 g·kg−1, and soil organic carbon (SOC) content of 2.24 g·kg−1. The substrate depth was approximately 10 cm, and each CW was planted with 500 g (fresh weight) of 20 cm long M. aquaticum. The schematic diagram of an M. aquaticum SFCW is shown in Figure 1.
After a one-month acclimatization period, during which tap water was continuously supplied [9,14], the experiment was started by feeding the CW with synthetic wastewater. This was prepared by mixing and dissolving glucose, (NH4)2SO4, and KH2PO4 with tap water. To determine the effect of the C/N ratio on pollutant removal and GHG emission, the influent TN and TP concentrations were kept constant while the influent COD concentration was controlled by varying the amount of glucose added, resulting in four influent treatments with different C/N ratios (0:1 (C0N), 5:1 (C5N), 10:1 (C10N), and 15:1 (C15N)). Each treatment was replicated three times, resulting in a total of 12 M. aquaticum SFCWs. Table S1 shows the water quality characteristics of the different influent waters. The CW was operated with intermittent influent flow (water inflowed time is from 6:00 a.m. to 9:00 a.m. and 6:00 p.m. to 9:00 p.m. every day), with a hydraulic load of 3.6 L·d−1 and a hydraulic retention time of 7 days. The M. aquaticum SFCW was operated and monitored from September 2018 to December 2018, with an average temperature of 18.7 ± 5.7 °C.

2.2. Sample Collection and Analysis

Water samples were collected weekly from the outlet and analyzed immediately in the laboratory. Each water sample was divided into two parts, with one part being filtered through the 0.45 µm membrane for determination of N H 4 + -N and N O 3 - -N and the other part being used for direct determination of TN and COD. The concentrations of N H 4 + -N and N O 3 - -N in the water samples were analyzed using a fully automated flow-injection system (AA3, SEAL, Norderstedt), while TN and COD were quantified using the alkaline potassium persulfate digestion-UV spectrophotometric method and potassium dichromate titration, respectively [21]. Other forms of nitrogen in the water samples were calculated by subtracting the concentrations of N H 4 + -N and N O 3 -N from the TN concentration [22]. The water temperature, pH, and DO levels were measured on site using a portable multiparameter water quality meter (SG68-SevenGo, Mettler Toledo, Zurich) on a weekly basis.
Surface sediment samples (0–5 cm depth) were collected and homogenized using a cylindrical stainless auger (diameter: 2 cm) from various sampling points within the same system on days 30, 60, and 90 during the experimental period. After the extraction of fresh sediments with a 0.5 M K2SO4 solution, the SOC and dissolved organic carbon (DOC) contents in the sediments were determined using the previously described methods [9,21].
To determine GHG fluxes in CWs, gas collection was performed weekly using floating boxes (49 cm × 31 cm × 55 cm, polymethylmethacrylate (PMMA)). The sampling was conducted with the box placed on the water surface and containing vegetation. Five gas samples were collected from each system at sampling times of 0, 10, 20, 30, and 40 min between 9:00 and 11:00 a.m. on sampling days. The concentrations of CH4, CO2, and N2O were determined using the gas chromatograph (Agilent 7890A, Palo Alto, Hong Kong, Santa Clara, CA, USA) equipped with an electron capture detector (ECD) and an auto-sampling system. The gas fluxes were then calculated according to the method described by Zhang et al. [23]. In this study, CO2 fluxes were not considered in the calculation of GWP as they only represent the respiration of the CW. The GWP of GHG emissions in CWs can be calculated using the following formula [24]:
G W P = 26 × F C H 4 + 265 × F N 2 O
where GWP is the global warming potential of CH4 and N2O emissions (g·m−2·d−1); F(CH4) and F(N2O) are the CH4 and N2O fluxes (g·m−2·d−1), respectively; and 26 and 265 are constants used to convert CH4 and N2O into CO2-equivalent emissions over a 100-year time horizon.

2.3. Illumina MiSeq Sequencing Analysis

During the experimental period, sediment samples were collected on days 30, 60, and 90. DNA was extracted from 0.5 g of each sediment sample using the Fast DNA® SPIN Kit for Soil 9 (MP Biomedicals, LLC, Santa Ana, CA, USA).

2.4. Statistical Analysis

A one-way analysis of variance (ANOVA) and Pearson correlation analyses were performed using SPSS 25.0 with a significance level of 0.05 for statistical tests, which means that differences and correlations are statistically significant when p < 0.05. In addition, this study used the random forest package in R 4.3.0 (version 4.7-1.1) to analyze the relative importance of environmental factors and functional microbial abundance on CH4 versus N2O emissions.

3. Results and Discussion

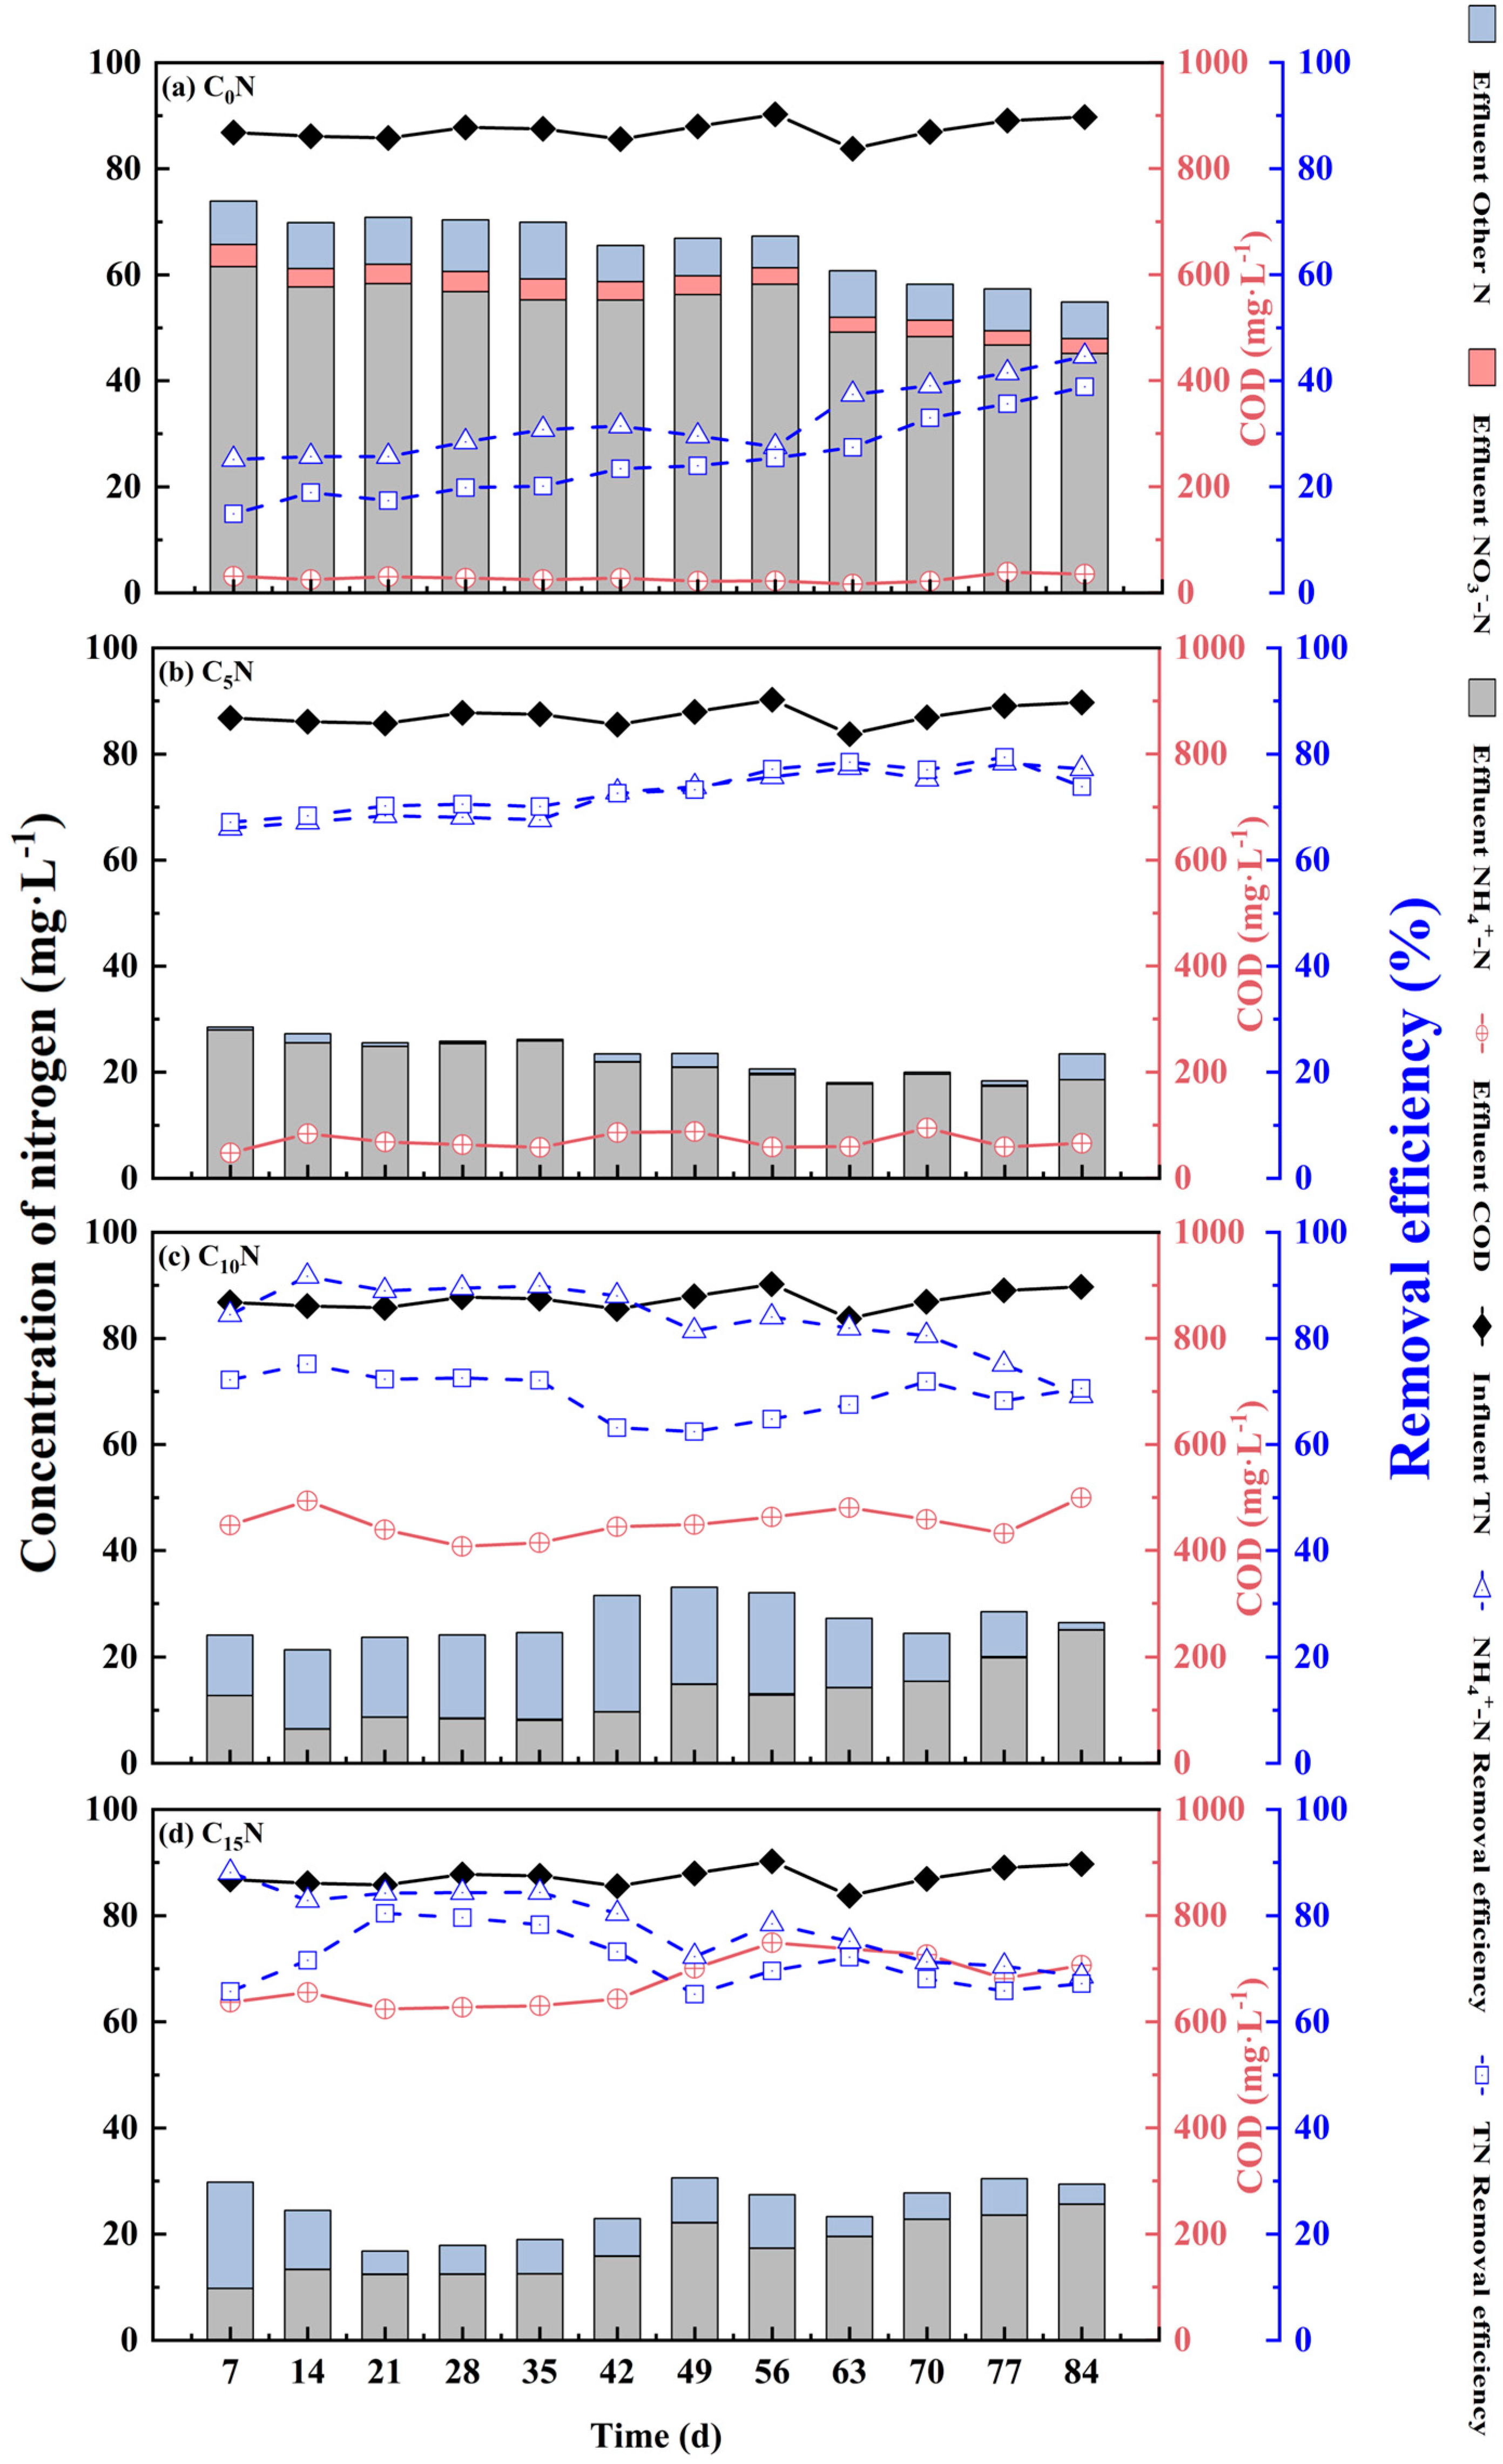
3.1. Effect of Influent C/N Ratio on Pollutant Removal from SFCWs

Effluent N H 4 + -N, N O 3 -N, TN, and COD concentrations as well as N H 4 + -N and TN removal rates of the M. aquaticum SFCWs under four influent C/N ratios were shown in Figure 2. The effluent concentrations of N H 4 + -N, N O 3 - -N, and TN were significantly lower (p < 0.05) in CWs (C5N, C10N, and C15N) with added carbon sources compared to the CWs (C0N) without added carbon sources. The effluent COD concentrations with C0N and C5N were significantly lower (16.09–98.38 mg·L−1) than C10N and C15N (407.60–748.82 mg·L−1). Additionally, the effluent COD concentrations (26.72 ± 6.26 mg·L−1) were higher than the influent concentrations (8.27 ± 3.91 mg·L−1) with C0N.
The main nitrogen removal pathways in CWs are microbial nitrification and heterotrophic denitrification, and the influent C/N ratio plays a crucial role in these pathways [13]. As the influent C/N ratio increased, the N H 4 + -N and TN removal rates in CWs also increased from 33.0 ± 1.9% and 25.7 ± 2.1% to 82.6 ± 2.1% and 73.1 ± 1.1%, respectively. This suggests that adding a carbon source to adjust the C/N ratio can effectively enhance nitrogen removal in CWs [25,26]. The effluent of C0N had a noticeable buildup of N O 3 -N (3.27 ± 0.17 mg·L−1), which was attributed to the lack of organic carbon inhibiting denitrification [27]. Increasing the C/N ratio to 5:1 significantly reduced the accumulation of N O 3 -N and improved TN removal. However, after the C/N ratio exceeded 5:1, there was no significant difference in TN removal among treatments, and TN removal even showed a slight decrease. This may be because, at this point, the DO level is more favorable for microbial nitrogen transformation than the availability of carbon sources [9]. Higher C/N ratios (10:1 and 15:1) were accompanied by lower DO levels (<2.0 mg·L−1) (Table S2), and this excess of organic carbon in CWs led to an overconsumption of DO, ultimately limiting the rate of nitrification and negatively impacting TN removal. For C0N, the effluent COD concentration was higher than the influent concentration, potentially due to the release of root secretions from wetland plants [28]. Our study found that the optimum influent C/N ratio for pollutant removal in M. aquaticum SFCWs was 5, resulting in the highest TN (73.17%) and COD (72.78%) removal, which is similar to the optimum C/N ratio for horizontal submerged CWs vegetated with Phragmites australis and Calamagrostis angustifolia [29]. Regarding the optimal C/N ratio for pollutant removal in constructed wetlands, several other studies have shown different results [13,15], and the reason for the discrepancy may be that the design parameters of constructed wetlands affect the appropriate C/N ratio required for microbial colonization and nitrogen removal, such as the structure and size of the constructed wetlands, the plant species, and the type of substrate [30].

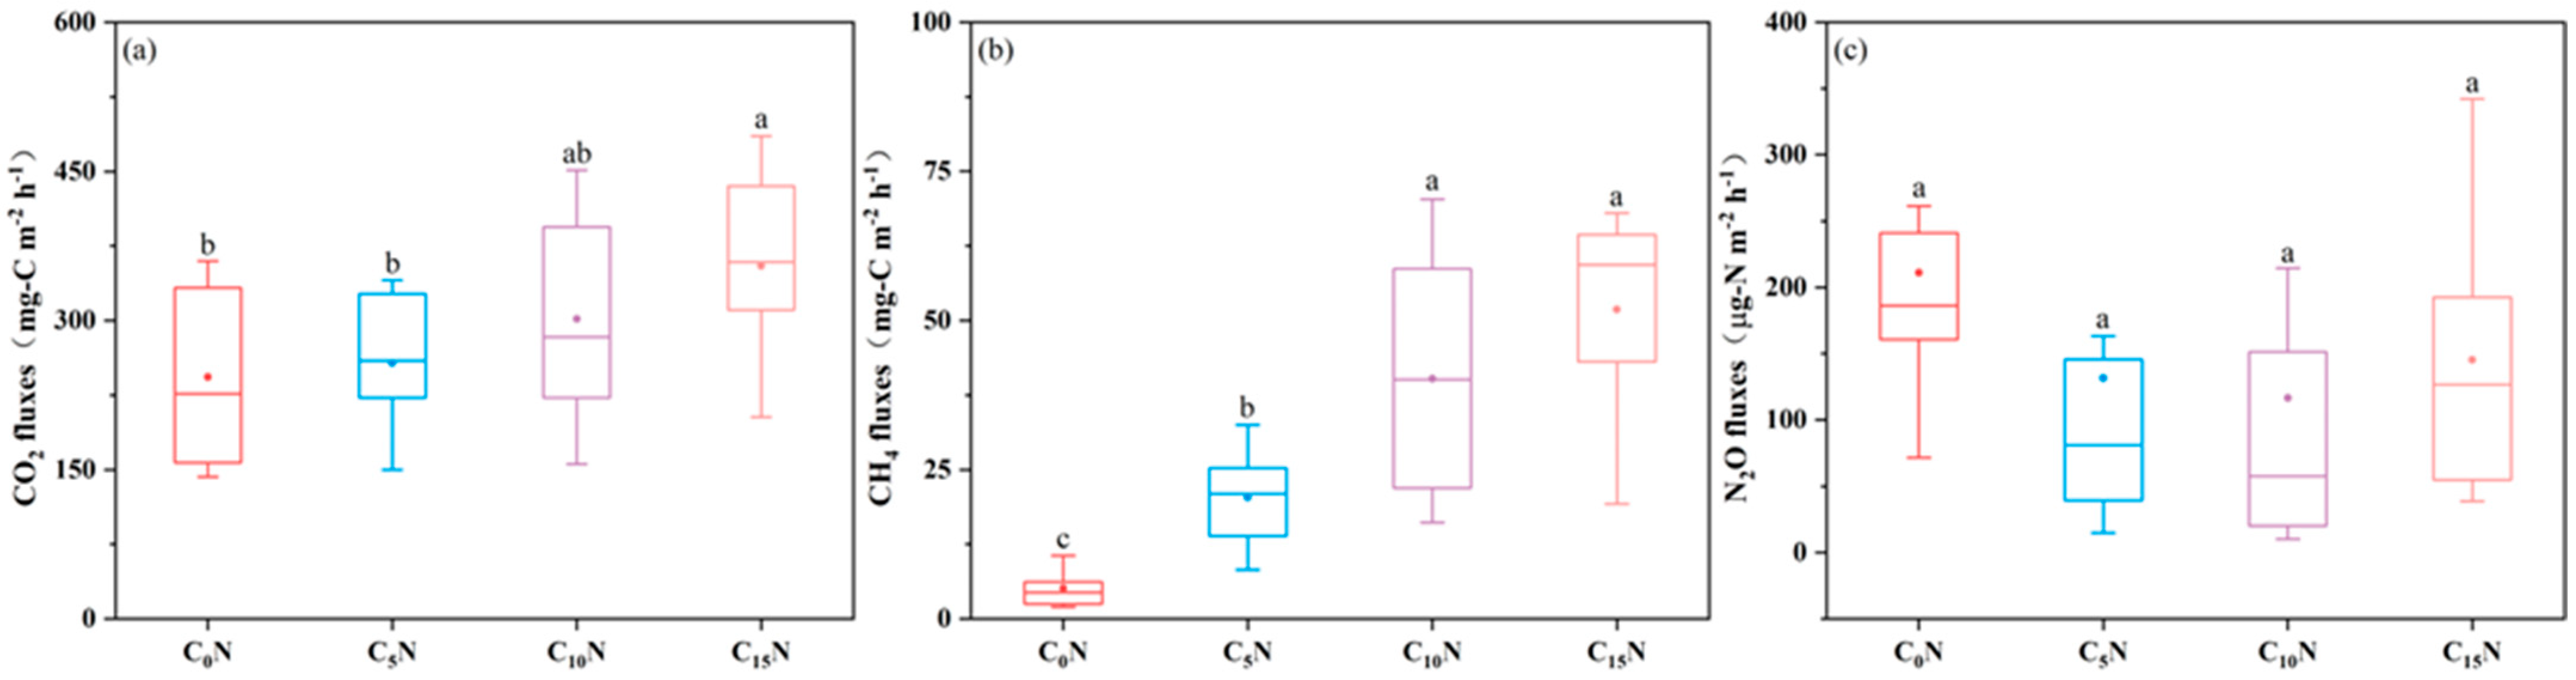
3.2. Effect of C/N Ratio on GHG Emissions from SFCWs

Figure 3a presents the range of CO2 emission fluxes in M. aquaticum SFCWs under four influent C/N ratios. With an increasing influent C/N ratio, the average CO2 emission flux increased from 243.13 ± 25.49 mg-C·m−2·h−1 to 355.03 ± 27.74 mg-C·m−2·h−1. Similarly, Yan et al. [16] observed an increase in CO2 emission flux from 283.57 ± 2.48 to 457.34 ± 3.16 mg·m−2·h−1 in vertical subsurface flow CWs treating synthetic municipal wastewater as the influent C/N ratio increased from 2.5:1 to 10:1. In another study, Wang et al. [14] found that the CO2 emission flux from microbial fuel cell-constructed wetlands increased about 4.6 times as the influent COD concentration increased from 50 mg·L−1 to 360 mg·L−1. These results demonstrate that CO2 emissions in CWs are positively correlated with the inflow load of organic carbon, as the increase in organic load can enhance microbial activity, growth, and metabolism in the CWs, resulting in increased CO2 emissions.
The average CH4 emission fluxes in SFCWs under four influent C/N ratios ranged from 5.16 ± 0.83 mg-C·m−2·h−1 to 51.85 ± 4.80 mg-C·m−2·h−1 (Figure 3b), indicating a significant impact of the influent C/N ratio on CH4 emission. For C10N and C15N, the average CH4 emission fluxes were 40.24 ± 5.67 mg-C·m−2·h−1 and 51.85 ± 4.99 mg-C·m−2·h−1, respectively, which were significantly higher than those for C0N (5.16 ± 0.86 mg-C·m−2·h−1) and C5N (20.36 ± 2.28 mg-C·m−2·h−1) (p < 0.05). This trend is consistent with previous studies showing a strong correlation between CH4 emissions with CWs and the inflow load of organic carbon [15,31,32]. In this study, the addition of glucose to adjust the influent C/N ratio provides a direct energy source for microorganisms to meet their metabolic needs [33]. Additionally, the excess organic matter in the system caused a depletion of DO, creating an anoxic environment in the CW that promoted the growth of methanogens and subsequently increased CH4 emissions. In the absence of added carbon sources, microorganisms in CW sediments can decompose cellulose and hemicellulose from plant roots to produce organic acids, which can be utilized by methanogens to support their growth and produce CH4 [34,35].
The N2O fluxes ranged from 10.18 to 342.13 µg-N·m−2·h−1, which is similar to the range reported by Chen et al. (−17.26–330.76 µg·m−2·h−1) [11]. As demonstrated in Figure 3c, the N2O emission fluxes of C5N, C10N, and C15N were relatively lower than that of C0N (211.03 ± 44.38 mg-N·m−2·h−1), among which the lowest average N2O flux (116.39 ± 41.40 mg-N·m−2·h−1) was observed in C10N, which was in agreement with the results of Li et al. [14]. There are two possible reasons for the higher N2O emissions without the addition of a carbon source (C0N): (1) the lack of a carbon source and higher DO limit denitrification in CWs (manifested as N O 3 -N accumulation in the effluent); (2) the microbial community involved in nitrogen transformation in CWs was altered with the increase in C/N ratio [11]. Higher organic carbon content in the presence of relatively high C/N ratios promotes complete denitrification, which leads to a reduction in N2O emissions [36].
The high GHG fluxes do not represent high greenhouse effects, and GWP is a more representative index of the greenhouse effect than GHG fluxes, representing the ability of GHGs to enhance the greenhouse effect. Table 1 shows the GWP of the four influent C/N ratios and the GWP produced to remove a unit mass of TN and COD. CH4 is the main greenhouse gas contributing to GWP elevation with CWs, which is supported by the studies of Chen et al. [37] and Xu et al. [38]. C10N and C15N had significantly higher (p < 0.05) GWP than the other two treatments. Taking into account both pollutant removal and GWP, C5N had the best performance (lowest GWP per unit mass of TN and COD removed with the highest TN and COD removal). Therefore, regulating the influent C/N ratio to 5:1 is more favorable for achieving greater ecological and environmental benefits.

3.3. Effect of C/N Ratio on Microbial Community from SFCWs

The relative abundance of wetland sediment microorganisms at the phylum level (top 10) under four influent C/N ratios is shown in Figure 4a. Proteobacteria (16.09–54.07%), Firmicutes (3.13–42.17%), and Actinobacteria (2.49–27.5%) were the three most dominant phyla in M. aquaticum SFCWs. For C0N, C5N, and C10N, the abundance of Proteobacteria and Actinobacteria was relatively similar among treatments, while for C15N, the relative abundance of Proteobacteria decreased significantly, while the relative abundance of Actinobacteria increased. The relative abundance of Firmicutes also increased, with C15N having the highest relative abundance (42.17%) of this bacterial phylum, replacing Proteobacteria (16.09%) as the most abundant in that phylum. This is in line with previous studies [39,40], which have shown that Proteobacteria is the dominant phylum in CWs, containing a variety of species involved in denitrification, CH4 oxidation, and other metabolic processes. The high relative abundance of Proteobacteria may contribute to the efficient removal of COD and TN from CWs [41,42]. On the other hand, Firmicutes have been linked to CH4 production in CWs, as they have the ability to break down volatile fatty acids (such as butyrate and propionate) into hydrogen, acetate, and carbon dioxide, which are substrates for CH4 production [43,44]. This may also explain the lower pH (Table S2) in C15N and the higher CH4 emission fluxes (Figure 3b) observed in that treatment.
The abundance and composition of methanogens and methanotrophs are important factors in determining CH4 emissions in CWs [17,45]. In this study, Methanosarcina was the only genus of methanogen detected (Table S3), and this group of microorganisms utilizes acetate as a carbon and energy source to produce CH4 [46]. CWs with higher C/N ratios exhibited an increased abundance of methanogens. This is attributed to glucose’s rapid conversion into various organic acids under anoxic conditions, supplying nutrients essential for methanogen growth and metabolism [10]. The abundance of methanotrophs under CWs with four influent C/N ratios varied slightly (Table S3), possibly due to differences in DO levels. CH4 can be oxidized through aerobic or anaerobic pathways [47], with aerobic methane oxidation being a faster process compared to anoxic methane oxidation [17]. The highest total relative abundance of methanotrophs was observed in C0N, which could explain the lower CH4 emission fluxes in that treatment.
The relative abundance of nitrification- and denitrification-related genera in CWs under four influent C/N ratios was evaluated, and the results are shown in Figure 4b. Four genera associated with the nitrification process were detected: Nitrospira, unclassified_c_Betaproteobacteria, Nitrosomonas, and Rudaea [9,48]. The relative abundance of Nitrospira, unclassified_c_Betaproteobacteria, and Nitrosomonas was extremely negatively correlated with influent C/N ratio, which can be attributed to the fact that high organic carbon concentrations enhance the ability of heterotrophic bacteria to utilize a variety of resources, including nitrogen, phosphorus, and dissolved oxygen, creating an unfavorable nitrifying environment [49]. Nitrospira is mainly associated with the nitrite oxidation pathway, and some of its bacteria are thought to have the ability to comammox [50], a process that can directly convert N H 4 + -N and N O 2 -N to N O 3 -N without producing N2O. Denitrification is considered to be the main source of N2O emission from CWs in most situations [51], and the influent C/N ratio significantly affected the composition and distribution of DNB in CWs. Among all the influent C/N ratios, C0N had the lowest abundance of DNB (14.20%) and C5N had the highest (46.24%), which explains why C0N had the lowest nitrogen removal efficiency and C5N had the highest. Thiomonas, Chlorobaculum, Desulfovibrio, and Clostridium_sensu_stricto_1 were the dominant DNBs in C0N, C5N, C10N, and C15N, respectively. Among them, Thiomonas is a facultative autotrophic sulfur-oxidizing bacterium [52], which is capable of autotrophic denitrification using reduced sulfide as an electron donor in CWs lacking carbon sources [53]. In addition, a variety of genera associated with aerobic denitrification, such as Flavobacterium, Rhodanobacter, and Pseudomonas, were detected in C0N [47,54]. Although aerobic denitrifying bacteria accounted for a relatively small fraction of the total microorganisms, some of the products of aerobic denitrification were only N2O, rather than N2, and thus may have contributed to systemic N2O production [3].

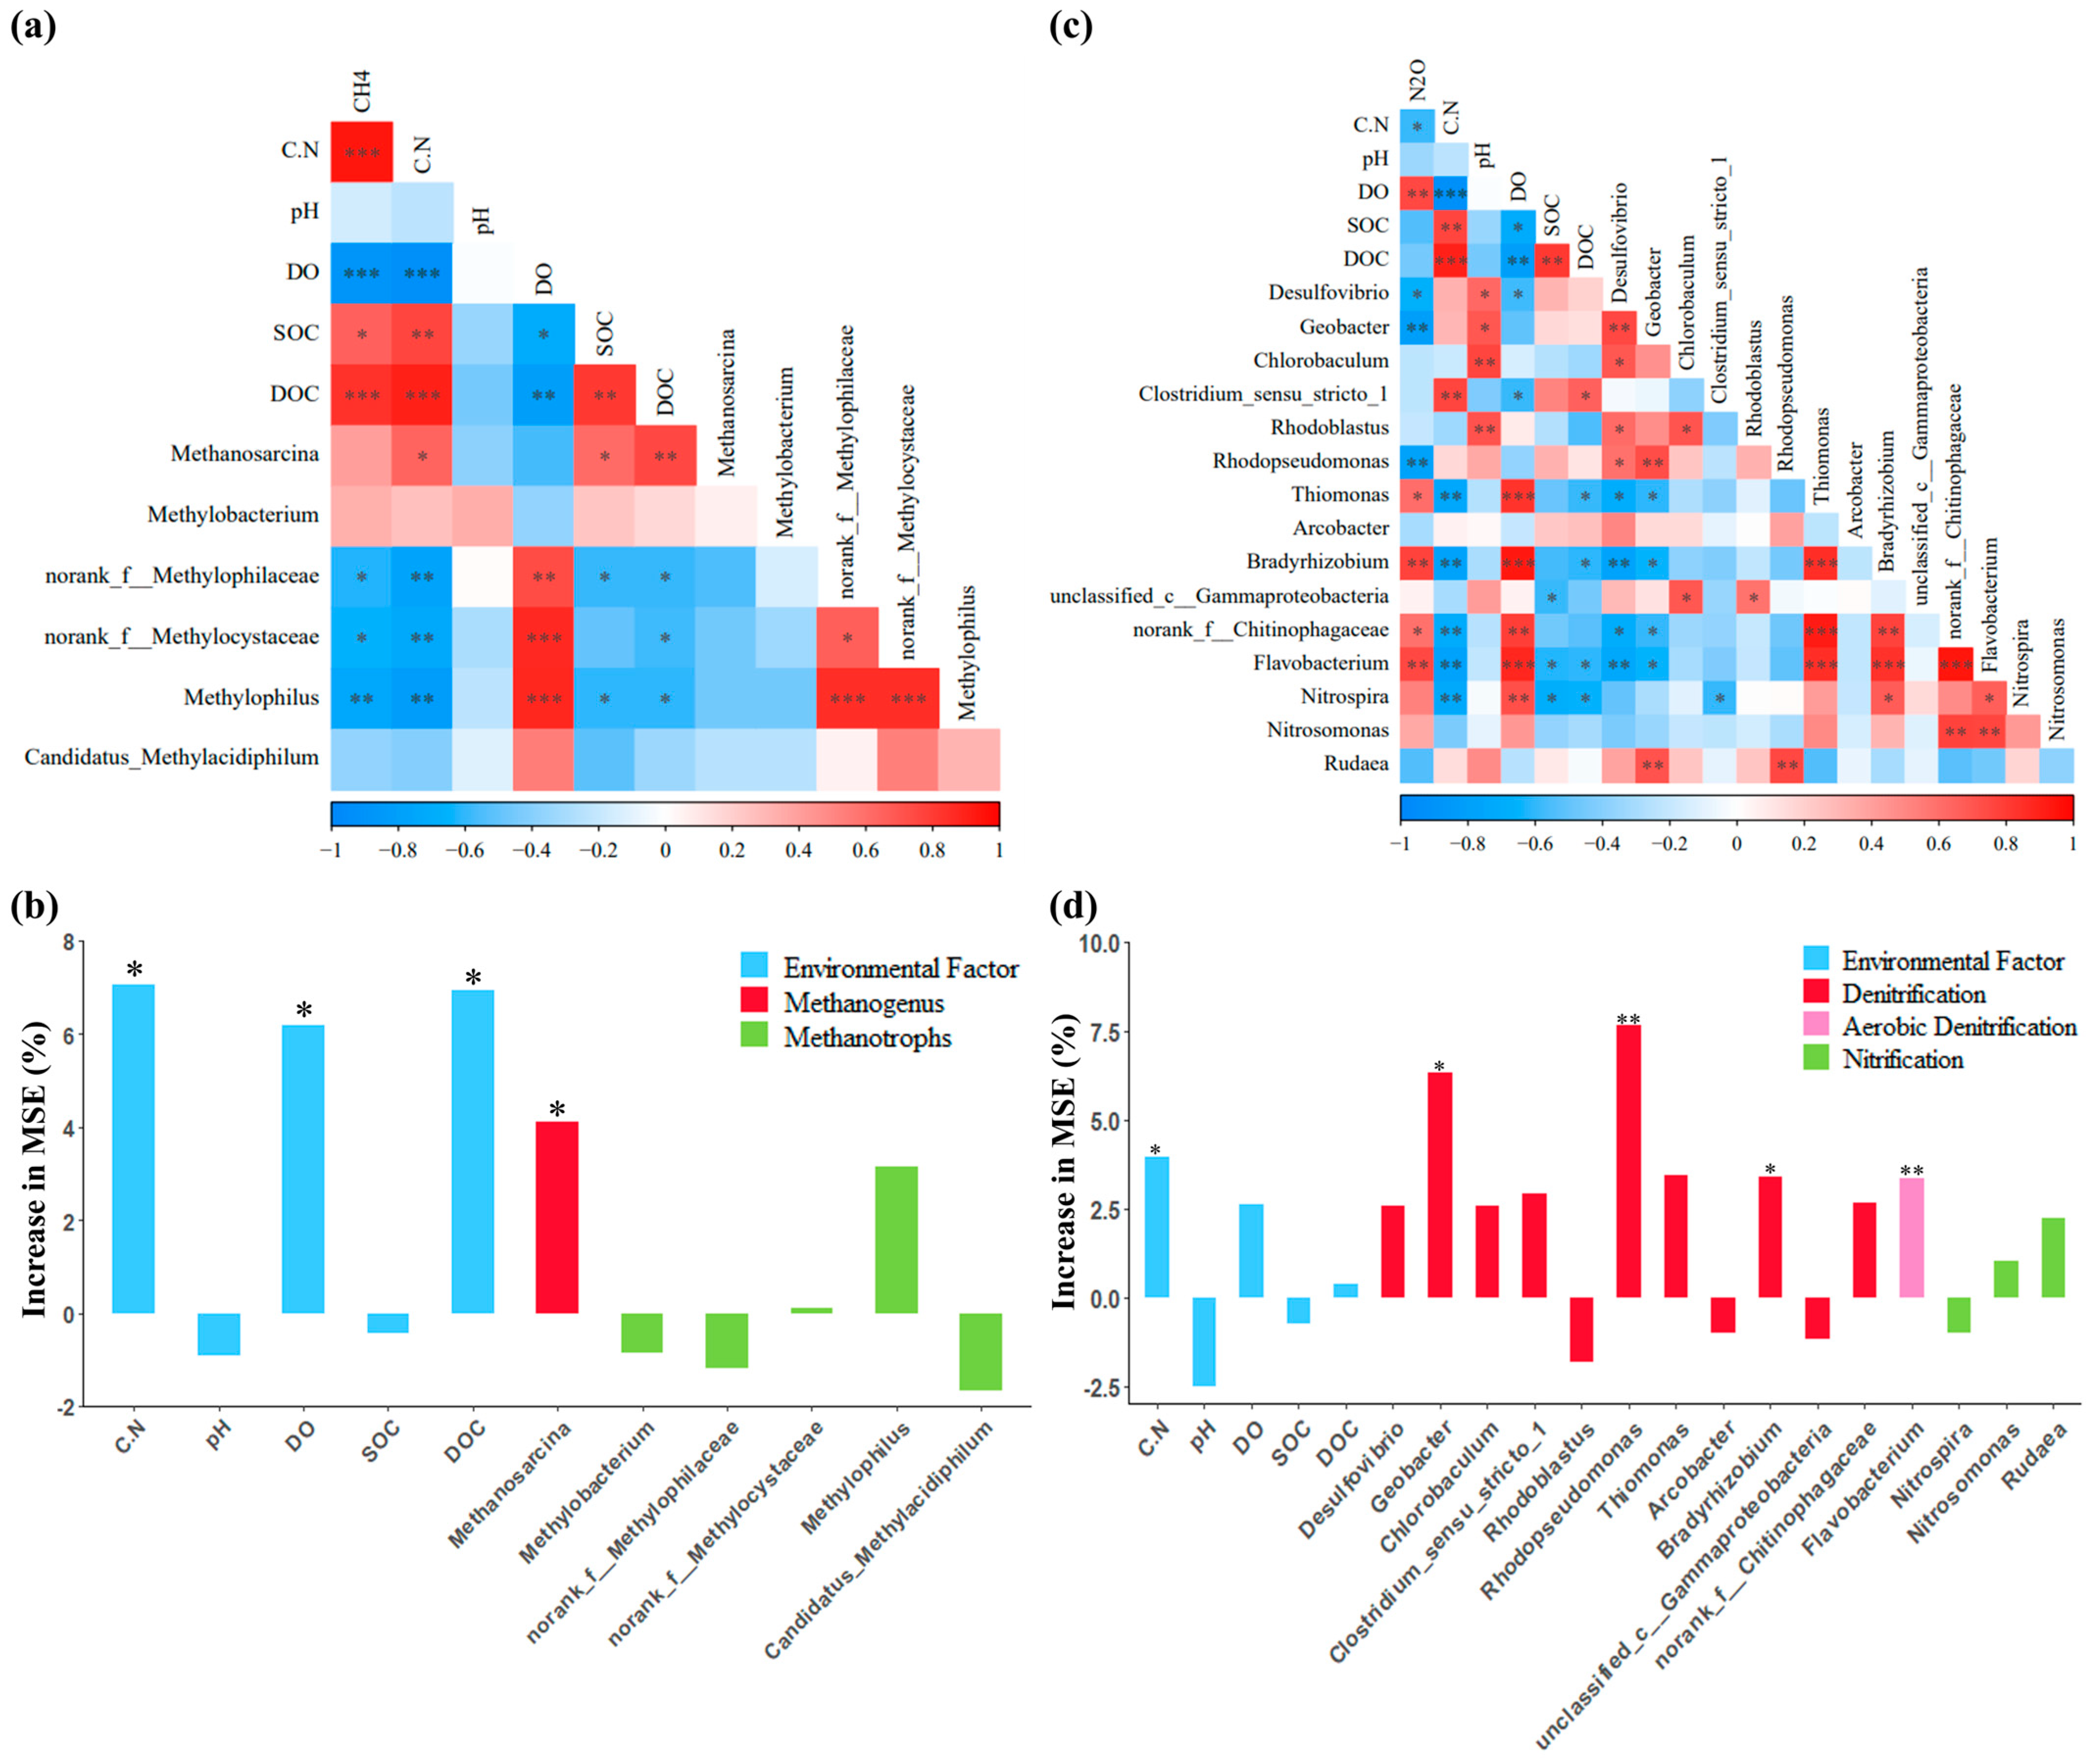
3.4. Drivers of CH4 and N2O Emissions

The influence and importance of environmental factors and GHG emission-related functional microorganisms on CH4 and N2O emissions were analyzed by Pearson’s correlation analysis and the random forest model. CH4 emission was extremely significantly negatively correlated (p < 0.01) with DO and Methylophilus abundance and extremely significantly positively correlated (p < 0.01) with influent C/N ratio and soil DOC (Figure 5a), while the influent C/N ratio was the most important factor influencing CH4 emission (Figure 5b), followed by sediment DOC content. In this study, the influent C/N ratio was mainly regulated by the addition of glucose, which effectively increased the sediment DOC content and the availability of carbon in the CWs, providing more substrates for the methanogens. At the same time, the higher DOC content stimulated the bacteria responsible for the decomposition of organic matter and methane production, while significantly decreasing the level of DO in the CWs and inhibiting the activity of aerobic methane-oxidizing bacteria, thus promoting CH4 emissions [55]. For N2O, its emission was extremely significantly negatively correlated (p < 0.01) with Geobacter and Rhodopseudomonas abundance, and extremely significantly positively correlated (p < 0.01) with DO, Bradyrhizobium, and Flavobacterium abundance (Figure 5c). The random forest results indicated that Rhodopseudomonas abundance was the most important factor influencing N2O emissions from M. aquaticum SFCWs (Figure 5d). Rhodopseudomonas is a typical anaerobic photosynthetic bacterium that can denitrify using organic carbon [56]. It possesses the nosZ gene [57], which implies that it is capable of complete denitrification under suitable environmental conditions. Additionally, Rhodopseudomonas is also capable of nitrate-dependent anaerobic iron oxidation (Equation (2)) utilizing Fe2+ in the sediment as an electron donor for denitrification [58], indicating its potential to reduce N2O emissions from CWs. The relative abundance of Rhodopseudomonas is higher in C5N and C10N and lower in C0N and C15N due to the lack of sufficient carbon source in C0N, which is unfavorable for Rhodopseudomonas growth and metabolism. On the other hand, the high concentration of organic carbon in C15N stimulates the reproduction and metabolism of a large number of heterotrophic microorganisms. However, the thick biofilm may prevent Rhodopseudomonas from being exposed to sunlight, potentially inhibiting its metabolism and growth [59].
10 F e 2 + + 2 N O 3 + 24 H 2 O N 2 + 10 F e O H 3 + 18 H +
In summary, this study recommends the C/N ratio of 5:1 for the influent water of constructed wetlands, which not only enhances pollutant removal, but also contributes to a reduction in greenhouse gas emissions and the improvement of energy recovery. While based on a small-scale simulation, these results offer a foundation for developing environmentally friendly constructed wetlands.

4. Conclusions

This study clarified the effects of the influent C/N ratio on pollutant removal, GHG emissions, and microbial community in M. aquaticum SFCWs. Regulating the influent C/N ratio significantly improved the removal of N H 4 + -N and TN in CWs. The influent C/N ratio had a greater effect on GHG emission, and the increase in the influent C/N ratio could reduce N2O emission but promote CO2 and CH4 emissions. M. aquaticum SFCWs showed the highest nitrogen removal (TN 73.17%) with the highest eco-environmental benefit when the influent C/N ratio was 5:1, along with a lower greenhouse effect. The increase in the C/N ratio altered the distribution and composition of the microbial community, with the highest abundance of denitrifying bacteria at C5N (46.24%) and the lowest at C0N (14.20%). In addition, the influent C/N ratio and Rhodopseudomonas abundance were the most important influences on CH4 and N2O emissions from M. aquaticum SFCWs, respectively, according to Pearson correlation analysis and the random forest model.

Supplementary Materials

The following supporting information can be downloaded at: https://www.mdpi.com/article/10.3390/w16020308/s1, Table S1: Characteristics of influents; Table S2. Physicochemical parameters of water and sediment with four influent C/N ratios; Table S3: Abundance of methanogens and methanotrophs at the genus level.

Author Contributions

Conceptualization, F.L. and H.L.; methodology, B.W. and H.L.; software, B.W. and X.D.; validation, Y.C., H.L. and S.Z.; formal analysis, B.W.; investigation, B.W. and H.L.; resources, J.P.; data curation, B.W. and H.L.; writing—original draft preparation, B.W.; writing—review and editing, B.W., Y.C., F.L. and J.P.; visualization, B.W.; supervision, F.L.; project administration, F.L. and S.Z.; funding acquisition, F.L. All authors have read and agreed to the published version of the manuscript.

Funding

This research was funded by the Guangxi Key Research and Development Program, grant number AB21220006, the National Natural Science Foundation of China, grant number 42077316, and the Youth Innovation Promotion Association of the Chinese Academy of Sciences, grant number 2022371.

Data Availability Statement

Data will be made available upon request.

Conflicts of Interest

The authors declare that they do not have any commercial or associative interest that represents a conflict of interest in connection with the work submitted.

References

  1. Wang, H.Y.; Xu, Y.X.; Chai, B.B. Effect of Temperature on Microorganisms and Nitrogen Removal in a Multi-Stage Surface Flow Constructed Wetland. Water 2023, 15, 1265. [Google Scholar] [CrossRef]
  2. Maltais-Landry, G.; Maranger, R.; Brisson, J.; Chazarenc, F. Greenhouse gas production and efficiency of planted and artificially aerated constructed wetlands. Environ. Pollut. 2009, 157, 748–754. [Google Scholar] [CrossRef] [PubMed]
  3. Yin, X.X.; Jiang, C.C.; Xu, S.J.; Yu, X.J.; Yin, X.L.; Wang, J.L.; Maihaiti, M.; Wang, C.; Zheng, X.X.; Zhuang, X.L. Greenhouse Gases Emissions of Constructed Wetlands: Mechanisms and Affecting Factors. Water 2023, 15, 2871. [Google Scholar] [CrossRef]
  4. Wu, H.M.; Wang, R.G.; Yan, P.H.; Wu, S.B.; Chen, Z.B.; Zhao, Y.Q.; Chen, C.; Hu, Z.; Zhuang, L.L.; Guo, Z.Z. Constructed wetlands for pollution control. Nat. Rev. Earth. Environ. 2023, 4, 218–234. [Google Scholar] [CrossRef]
  5. Jahangir, M.M.; Richards, K.G.; Healy, M.G.; Gill, L.; Müller, C.; Johnston, P.; Fenton, O. Carbon and nitrogen dynamics and greenhouse gas emissions in constructed wetlands treating wastewater: A review. Hydrol. Earth Syst. Sci. 2016, 20, 109–123. [Google Scholar] [CrossRef]
  6. Maucieri, C.; Barbera, A.C.; Vymazal, J.; Borin, M. A review on the main affecting factors of greenhouse gases emission in constructed wetlands. Agric. For. Meteorol. 2017, 236, 175–193. [Google Scholar] [CrossRef]
  7. Xu, D.; Sun, H.M.; Wang, J.; Wang, N.; Zuo, Y.J.; Mosa, A.A.; Yin, X.Q. Global trends and current advances regarding greenhouse gases in constructed wetlands: A bibliometric-based quantitative review over the last 40 years. Ecol. Eng. 2023, 193, 107018. [Google Scholar] [CrossRef]
  8. Zhi, W.; Ji, G.D. Quantitative response relationships between nitrogen transformation rates and nitrogen functional genes in a tidal flow constructed wetland under C/N ratio constraints. Water Res. 2023, 64, 32–41. [Google Scholar] [CrossRef]
  9. Li, H.F.; Liu, F.; Luo, P.; Chen, X.; Chen, J.L.; Huang, Z.R.; Peng, J.W.; Xiao, R.L.; Wu, J.S. Stimulation of optimized influent C:N ratios on nitrogen removal in surface flow constructed wetlands: Performance and microbial mechanisms. Sci. Total Environ. 2019, 694, 133575. [Google Scholar] [CrossRef]
  10. Niu, T.T.; Zhu, H.; Shutes, B.; Yu, J.; He, C.G.; Hou, S.N.; Cui, H.; Yan, B.X. Wastewater treatment performance and gaseous emissions in MFC-CWs affected by influent C/N ratios. Chem. Eng. J. 2023, 461, 141876. [Google Scholar] [CrossRef]
  11. Chen, X.; Zhu, H.; Yan, B.X.; Shutes, B.; Tian, L.P.; Wen, H.Y. Optimal influent COD/N ratio for obtaining low GHG emissions and high pollutant removal efficiency in constructed wetlands. J. Clean. Prod. 2020, 267, 122003. [Google Scholar] [CrossRef]
  12. Zhou, X.; Wu, S.B.; Wang, R.G.; Wu, H.M. Nitrogen removal in response to the varying C/N ratios in subsurface flow constructed wetland microcosms with biochar addition. Environ. Sci. Pollut. Res. 2019, 26, 3382–3391. [Google Scholar] [CrossRef] [PubMed]
  13. Yao, D.D.; Dai, N.; Hu, X.J.; Cheng, C.; Xie, H.J.; Hu, Z.; Liang, S.; Zhang, J. New insights into the effects of wetland plants on nitrogen removal pathways in constructed wetlands with low C/N ratio wastewater: Contribution of partial denitrification-anammox. Water Res. 2023, 243, 120277. [Google Scholar] [CrossRef]
  14. Li, M.; Wu, H.M.; Zhang, J.; Ngo, H.H.; Guo, W.S.; Kong, Q. Nitrogen removal and nitrous oxide emission in surface flow constructed wetlands for treating sewage treatment plant effluent: Effect of C/N ratios. Bioresour. Technol. 2017, 240, 157–164. [Google Scholar] [CrossRef] [PubMed]
  15. Wang, X.O.; Tian, Y.M.; Liu, H.; Zhao, X.H.; Peng, S. The influence of incorporating microbial fuel cells on greenhouse gas emissions from constructed wetlands. Sci. Total Environ. 2019, 656, 270–279. [Google Scholar] [CrossRef] [PubMed]
  16. Yan, C.; Zhang, H.; Li, B.; Wang, D.; Zhao, Y.J.; Zheng, Z. Effects of influent C/N ratios on CO2 and CH4 emissions from vertical subsurface flow constructed wetlands treating synthetic municipal wastewater. J. Hazard. Mater. 2012, 203, 188–194. [Google Scholar] [CrossRef] [PubMed]
  17. Bridgham, S.D.; Cadillo-Quiroz, H.; Keller, J.K.; Zhuang, Q.L. Methane emissions from wetlands: Biogeochemical, microbial, and modeling perspectives from local to global scales. Global. Chang. Biol. 2013, 19, 1325–1346. [Google Scholar] [CrossRef] [PubMed]
  18. Yu, G.L.; Chen, J.D.; Wang, G.L.; Chen, H.F.; Huang, J.J.; Li, Y.F.; Wang, W.M.; Song, F.M.; Ma, Y.J.; Wang, Q. Recent advances in constructed wetlands methane reduction: Mechanisms and methods. Front. Microbiol. 2023, 14, 1106332. [Google Scholar] [CrossRef]
  19. Mander, Ü.; Tournebize, J.; Espenberg, N.; Chaumont, C.; Torga, R.; Garnier, J.; Muhel, M.; Maddison, M.; Lebrun, J.; Uher, E. High denitrification potential but low nitrous oxide emission in a constructed wetland treating nitrate-polluted agricultural run-off. Sci. Total Environ. 2021, 779, 146614. [Google Scholar] [CrossRef]
  20. Lyu, W.L.; Huang, L.; Xiao, G.Q.; Chen, Y.C. Effects of carbon sources and COD/N ratio on N2O emissions in subsurface flow constructed wetlands. Bioresour. Technol. 2017, 245, 171–181. [Google Scholar] [CrossRef]
  21. Liu, F.; Zhang, S.N.; Wang, Y.; Li, Y.; Xiao, R.L.; Li, H.F.; He, Y.; Zhang, M.M.; Wang, D.; Li, X. Nitrogen removal and mass balance in newly-formed Myriophyllum aquaticum mesocosm during a single 28-day incubation with swine wastewater treatment. J. Environ. Manag. 2016, 166, 596–604. [Google Scholar] [CrossRef] [PubMed]
  22. Luo, P.; Liu, F.; Zhang, S.N.; Li, H.F.; Yao, R.; Jiang, Q.W.; Xiao, R.L.; Wu, J.S. Nitrogen removal and recovery from lagoon-pretreated swine wastewater by constructed wetlands under sustainable plant harvesting management. Bioresour. Technol. 2018, 258, 247–254. [Google Scholar] [CrossRef] [PubMed]
  23. Zhang, S.N.; Liu, F.; Xiao, R.L.; Li, Y.; He, Y.; Wu, J.S. Effects of vegetation on ammonium removal and nitrous oxide emissions from pilot-scale drainage ditches. Aquat. Bot. 2016, 130, 37–44. [Google Scholar] [CrossRef]
  24. Du, Y.Y.; Pan, K.X.; Yu, C.C.; Luo, B.; Gu, W.L.; Sun, H.Y.; Min, Y.; Liu, D.; Geng, Y.; Han, W.J. Plant diversity decreases net global warming potential integrating multiple functions in microcosms of constructed wetlands. J. Clean. Prod. 2018, 184, 718–726. [Google Scholar] [CrossRef]
  25. Shen, Z.Q.; Zhou, Y.X.; Liu, J.; Xiao, Y.; Cao, R.; Wu, F.P. Enhanced removal of nitrate using starch/PCL blends as solid carbon source in a constructed wetland. Bioresour. Technol. 2015, 175, 239–244. [Google Scholar] [CrossRef]
  26. Huang, L.; Wang, N.; Deng, C.R.; Liang, Y.K.; Wang, Q.H.; Liu, M.L.; Chen, Y.C. Interactive effect of carbon source with influent COD/N on nitrogen removal and microbial community structure in subsurface flow constructed wetlands. J. Environ. Manag. 2019, 250, 109491. [Google Scholar] [CrossRef]
  27. He, Y.; Wang, Y.H.; Song, X.S. High-effective denitrification of low C/N wastewater by combined constructed wetland and biofilm-electrode reactor (CW–BER). Bioresour. Technol. 2016, 203, 245–251. [Google Scholar] [CrossRef]
  28. Xu, J.; Huang, X.X.; Luo, P.; Zhang, M.M.; Li, H.F.; Gong, D.L.; Liu, F.; Xiao, R.L.; Wu, J.S. Root exudates release from Myriophyllum aquaticum and effects on nitrogen removal by constructed wetlands. J. Clean. Prod. 2022, 375, 134095. [Google Scholar] [CrossRef]
  29. Zhu, H.; Yan, B.X.; Xu, Y.Y.; Guan, J.N.; Liu, S.Y. Removal of nitrogen and COD in horizontal subsurface flow constructed wetlands under different influent C/N ratios. Ecol. Eng. 2014, 63, 58–63. [Google Scholar] [CrossRef]
  30. Rhaman, M.E.; Halmi, M.I.E.B.; Samad, M.Y.B.A.; Uddin, M.K.; Mahmud, K.; Shukor, M.Y.A.; Abdullah, S.R.S.; Shamsuzzaman, S.M. Design, Operation and Optimization of Constructed Wetland for Removal of Pollutant. Int. J. Environ. Res. Public Health 2020, 17, 8839. [Google Scholar] [CrossRef]
  31. Mander, Ü.; Dotro, G.; Ebie, Y.; Towprayoon, S.; Chiemchaisri, C.; Nogueira, S.F.; Jamsranjav, B.; Kasak, K.; Truu, J.; Tournebize, J. Greenhouse gas emission in constructed wetlands for wastewater treatment: A review. Ecol. Eng. 2014, 66, 19–35. [Google Scholar] [CrossRef]
  32. Zhao, Y.J.; Zhang, Y.J.; Ge, Z.G.; Hu, C.W.; Zhang, H. Effects of influent C/N ratios on wastewater nutrient removal and simultaneous greenhouse gas emission from the combinations of vertical subsurface flow constructed wetlands and earthworm eco-filters for treating synthetic wastewater. Environ. Sci.-Proc. Imp. 2014, 16, 567–575. [Google Scholar] [CrossRef] [PubMed]
  33. Liu, S.T.; Xue, H.P.; Wang, M.X.; Feng, X.J.; Lee, H. The role of microbial electrogenesis in regulating methane and nitrous oxide emissions from constructed wetland-microbial fuel cell. Int. J. Hydrogen Energy 2022, 47, 27279–27292. [Google Scholar] [CrossRef]
  34. Wu, H.M.; Zhang, J.; Ngo, H.H.; Guo, W.S.; Liang, S. Evaluating the sustainability of free water surface flow constructed wetlands: Methane and nitrous oxide emissions. J. Clean. Prod. 2017, 147, 152–156. [Google Scholar] [CrossRef]
  35. Liu, S.T.; Feng, X.J.; Li, X.N. Bioelectrochemical approach for control of methane emission from wetlands. Bioresour. Technol. 2017, 241, 812–820. [Google Scholar] [CrossRef]
  36. Zhou, X.; Liang, C.L.; Jia, L.X.; Feng, L.K.; Wang, R.G.; Wu, H.M. An innovative biochar-amended substrate vertical flow constructed wetland for low C/N wastewater treatment: Impact of influent strengths. Bioresour. Technol. 2018, 247, 844–850. [Google Scholar] [CrossRef] [PubMed]
  37. Chen, X.; Zhu, H.; Yan, B.X.; Shutes, B.; Xing, D.F.; Banuelos, G.; Chen, R.; Wang, X.Y. Greenhouse gas emissions and wastewater treatment performance by three plant species in subsurface flow constructed wetland mesocosms. Chemosphere 2020, 239, 124795. [Google Scholar] [CrossRef]
  38. Xu, G.M.; Li, Y.; Hou, W.H.; Wang, S.; Kong, F.L. Effects of substrate type on enhancing pollutant removal performance and reducing greenhouse gas emission in vertical subsurface flow constructed wetland. J. Environ. Manag. 2021, 280, 111674. [Google Scholar] [CrossRef]
  39. Mu, X.Y.; Lv, X.Y.; Liu, W.; Qiu, C.H.; Ma, Y.; Zhang, S.H.; Jeppesen, E. Biofilms attached to Myriophyllum spicatum play a dominant role in nitrogen removal in constructed wetland mesocosms with submersed macrophytes: Evidence from 15N tracking, nitrogen budgets and metagenomics analyses. Environ. Pollut. 2020, 266, 115203. [Google Scholar] [CrossRef]
  40. Jia, W.; Yang, Y.C.; Yang, L.Y.; Gao, Y. High-efficient nitrogen removal and its microbiological mechanism of a novel carbon self-sufficient constructed wetland. Sci. Total Environ. 2021, 775, 145901. [Google Scholar] [CrossRef]
  41. Chen, D.Y.; Gu, X.S.; Zhu, W.Y.; He, S.B.; Huang, J.C.; Zhou, W.L. Electrons transfer determined greenhouse gas emissions in enhanced nitrogen-removal constructed wetlands with different carbon sources and carbon-to-nitrogen ratios. Bioresour. Technol. 2019, 285, 121313. [Google Scholar] [CrossRef] [PubMed]
  42. Cheng, C.; Sun, T.Y.; Li, H.J.; He, Q.; Pavlostathis, S.G.; Zhang, J. New insights in correlating greenhouse gas emissions and microbial carbon and nitrogen transformations in wetland sediments based on genomic and functional analysis. J. Environ. Manag. 2021, 297, 113280. [Google Scholar] [CrossRef]
  43. Bernardes, F.S.; Herrera, P.G.; Chiquito, G.M.; Morales, M.F.; Castro, A.P.; Paulo, P.L. Relationship between microbial community and environmental conditions in a constructed wetland system treating greywater. Ecol. Eng. 2019, 139, 105581. [Google Scholar] [CrossRef]
  44. Zhang, J.; Jiao, S.; Lu, Y.H. Biogeographic distribution of bacterial, archaeal and methanogenic communities and their associations with methanogenic capacity in Chinese wetlands. Sci. Total Environ. 2018, 622, 664–675. [Google Scholar] [CrossRef] [PubMed]
  45. Ji, B.H.; Chen, J.Q.; Li, W.; Mei, J.; Yang, Y.; Chang, J.J. Greenhouse gas emissions from constructed wetlands are mitigated by biochar substrates and distinctly affected by tidal flow and intermittent aeration modes. Environ. Pollut. 2021, 271, 116328. [Google Scholar] [CrossRef]
  46. Le Mer, J.; Roger, P. Production, oxidation, emission and consumption of methane by soils: A review. Eur. J. Soil Biol. 2001, 37, 25–50. [Google Scholar] [CrossRef]
  47. Guerrero-Cruz, S.; Vaksmaa, A.; Horn, M.A.; Niemann, H.; Pijuan, M.; Ho, A. Methanotrophs: Discoveries, environmental relevance, and a perspective on current and future applications. Front. Microbiol. 2021, 12, 678057. [Google Scholar] [CrossRef]
  48. Wang, J.W.; Long, Y.N.; Yu, G.L.; Wang, G.L.; Zhou, Z.Y.; Li, P.Y.; Zhang, Y.M.; Yang, K.; Wang, S.T. A review on microorganisms in constructed wetlands for typical pollutant removal: Species, function, and diversity. Front. Microbiol. 2022, 13, 845725. [Google Scholar] [CrossRef]
  49. Tan, X.; Yang, Y.L.; Liu, Y.W.; Li, X.; Zhu, W.B. Quantitative ecology associations between heterotrophic nitrification-aerobic denitrification, nitrogen-metabolism genes, and key bacteria in a tidal flow constructed wetland. Bioresour. Technol. 2021, 337, 125449. [Google Scholar] [CrossRef]
  50. Daims, H.; Lücker, S.; Wagner, M. A new perspective on microbes formerly known as nitrite-oxidizing bacteria. Trends Microbiol. 2016, 24, 699–712. [Google Scholar] [CrossRef]
  51. Huang, L.; Gao, X.; Guo, J.S.; Ma, X.X.; Liu, M. A review on the mechanism and affecting factors of nitrous oxide emission in constructed wetlands. Environ. Earth Sci. 2013, 68, 2171–2180. [Google Scholar] [CrossRef]
  52. Fu, C.X.; Li, J.; Lv, X.M.; Song, W.; Zhang, X.L. Operation performance and microbial community of sulfur-based autotrophic denitrification sludge with different sulfur sources. Environ. Geochem. Health 2020, 42, 1009–1020. [Google Scholar] [CrossRef] [PubMed]
  53. Wang, R.Z.; Zhang, X.W.; Yang, S.Y.; Xu, Z.H.; Feng, C.Y.; Zhao, F.X. Enhanced nitrogen removal driven by S/Fe2+ cycle in a novel hybrid constructed wetland. J. Clean. Prod. 2023, 426, 139113. [Google Scholar] [CrossRef]
  54. Pishgar, R.; Dominic, J.A.; Sheng, Z.Y.; Tay, J.H. Denitrification performance and microbial versatility in response to different selection pressures. Bioresour. Technol. 2019, 281, 72–83. [Google Scholar] [CrossRef]
  55. Chen, M.L.; Chang, L.; Zhang, J.M.; Guo, F.C.; Vymazal, J.; He, Q.; Chen, Y. Global nitrogen input on wetland ecosystem: The driving mechanism of soil labile carbon and nitrogen on greenhouse gas emissions. Environ. Sci. Ecotechnol. 2020, 4, 100063. [Google Scholar] [CrossRef] [PubMed]
  56. Du, L.; Trinh, X.T.; Chen, Q.R.; Wang, C.; Wang, H.H.; Zhou, Q.H.; Xu, D.; Wu, Z.B. Enhancement of microbial nitrogen removal pathway by vegetation in Integrated Vertical-Flow Constructed Wetlands (IVCWs) for treating reclaimed water. Bioresour. Technol. 2018, 249, 644–651. [Google Scholar] [CrossRef] [PubMed]
  57. Orellana, L.H.; Rodriguez-R, L.M.; Higgins, S.; Chee-Sanford, J.C.; Sanford, R.A.; Ritalahti, K.M.; Löffler, F.E.; Konstantinidis, K.T. Detecting nitrous oxide reductase (nosZ) genes in soil metagenomes: Method development and implications for the nitrogen cycle. Mbio 2014, 5, e01193. [Google Scholar] [CrossRef]
  58. Peng, Y.Y.; He, S.B.; Gu, X.S.; Yan, P.; Tang, L. Zero-valent iron coupled plant biomass for enhancing the denitrification performance of ecological floating bed. Bioresour. Technol. 2021, 341, 125820. [Google Scholar] [CrossRef]
  59. Zhang, M.Z.; Xu, D.; Bai, G.L.; Cao, T.T.; Liu, W.; Hu, Z.; Chen, D.S.; Qiu, D.R.; Wu, Z.B. Changes of microbial community structure during the initial stage of biological clogging in horizontal subsurface flow constructed wetlands. Bioresour. Technol. 2021, 337, 125405. [Google Scholar] [CrossRef]
Figure 1. Schematic diagram of an M. aquaticum SFCW.
Water 16 00308 g001
Figure 2. Variation of effluent pollutant concentration and removal rate in M. aquaticum SFCWs under four influent C/N ratios.
Water 16 00308 g002
Figure 3. CO2 (a), CH4 (b), and N2O (c) fluxes from SFCWs at different C/N ratios during the experiment operation. Different letters (a, b and c) indicate significant differences between treatments.
Water 16 00308 g003
Figure 4. Changes in the relative abundance of microorganisms at the phylum and genus levels in sediments of M. aquaticum SFCWs under four influent C/N ratios. (a) Changes in microbial abundance at the phylum level (top 10). (b) Heatmap showing the changes in nitrification and denitrification genera during the experiment.
Water 16 00308 g004
Figure 5. Pearson correlations (a,b) and relative importance (c,d) of environmental factors and GHG emission-associated functional microorganisms on CH4 and N2O emissions. Increase in MSE (increase in mean square error) represents the relative importance of the factor on CH4 and N2O emissions. In Figures (a,b), ***, **, and * indicate significant correlation at the 0.001, 0.01, and 0.05 levels (two-sided), respectively; in Figures (c,d), ** and * indicate significance at the 0.01 and 0.05 levels, respectively.
Water 16 00308 g005
Table 1. The average fluxes of CH4 and N2O as well as the GWP, GWP/TN, and GWP/COD (GWP to remove a unit mass of TN or COD of CWs) for SFCWs with four influent C/N ratios. a, b, and c indicate statistically significant differences under different influent C/N ratio treatments (p < 0.05).
C/NCH4 Flux
(g·m−2·d−1)
N2O Flux
(mg·m−2·d−1)
GWP
(g·m−2·d−1)
GWP/TNGWP/COD
0:10.17 ± 0.037.95 ± 1.676.12 ± 0.80 c11.79 ± 1.37 b
5:10.65 ± 0.074.96 ± 1.9418.25 ± 2.13 b12.85 ± 1.60 b2.39 ± 0.31 b
10:11.29 ± 0.184.39 ± 1.5634.77 ± 4.87 a25.58 ± 3.39 a3.87 ± 0.57 a
15:11.66 ± 0.165.48 ± 1.0842.91 ± 4.15 a30.68 ± 3.05 a4.36 ± 0.50 a
Disclaimer/Publisher’s Note: The statements, opinions and data contained in all publications are solely those of the individual author(s) and contributor(s) and not of MDPI and/or the editor(s). MDPI and/or the editor(s) disclaim responsibility for any injury to people or property resulting from any ideas, methods, instructions or products referred to in the content.

