Abstract
The pervasive challenge of heavy metal pollution in water necessitates urgent interventions to mitigate chromium contamination. It poses significant threats to human health, aquatic ecosystems, and the environment. This research delves into the potential of date palm waste as a precursor of adsorbent for extraction of chromium from contaminated water, underscoring its potential in heavy metal remediation. Date palm waste, traditionally regarded as agricultural waste, underwent modification employing N-(3-chloro-2-hydroxypropyl) trimethylammonium chloride resulting in quaternized date palm waste (QDPW) as a prospective adsorbent for chromium extraction. The characterization techniques, including FTIR, SEM/EDX, BET, XRD, TGA/DTA, and element analysis, were employed to examine the structural and surface properties of both DPW and QDPW fibers. Optimal chromium uptake was achieved at a solution pH 6.5 over two hours, with a peak removal efficiency of 88% and an adsorption capacity of 22.26 mg/g. The equilibrium isotherms studies are consistent with Langmuir, Redlich-Peterson, and Sips isotherms, presenting a coefficient of determination (R2) of 0.989, 0.981, and 0.983, respectively. Moreover, the pseudo-second-order model was mostly aligned with the kinetics data with R2 value of 0.999. These findings showed that the quaternized date palm waste can be considered a good option to recycle the date palm waste and reduce the environmental threats in aqueous solution.
1. Introduction
Chromium is a common pollutant in aquatic environments, primarily existing in two stable oxidation states: hexavalent chromium (Cr6+) and trivalent chromium (Cr3+) [1,2,3]. Various industrial sectors, from leather production to metal refinement, frequently use compounds containing chromium, resulting in wastewater enriched with this harmful element [2,3]. Numerous studies reported the adverse effects of chromium entering the human body through respiratory pathways and the skin, highlighting its potent carcinogenic and mutagenic properties [1,3]. Notably, Cr6+ exhibits significantly higher toxicity levels compared to Cr3+, with an approximate 100 times increased solubility and tendency to accumulate in organs such as the kidneys, liver, and stomach [3]. Additionally, exposure to chromium through inhalation, ingestion, dermal absorption, or contact can lead to various health issues, including dermatitis, hypersensitivity reactions, epistaxis, and irritations. Prolonged contact with Cr6+ has been reported to correlate with weakened immune function, respiratory abnormalities, and an increased risk of lung carcinoma, ultimately resulting in mortality [4,5]. These potential threats to the environment and human health necessitate the removal of chromium from contaminated water sources. Resultantly, globally recognized health organizations such as the World Health Organization and US-EPA restrict the acceptable concentration of Cr6+ in potable water to 0.05 mg/L and 0.1 mg/L, respectively [3,6].
Several chemical and physical techniques are available for removing metals, including chromium. These include but are not limited to solvent extraction, ion exchange, electrochemical reduction, chemical precipitation, reverse osmosis, and electrodialysis. However, it is worth noting that many of these methods are associated with significant operational expenses and consequently, they are not extensively utilized in practice [5,7,8]. In contrast, adsorption has gained widespread recognition due to its various attributes, including simplicity, cost-effectiveness, and efficiency [5,7,8,9]. The utilization of biomaterials with chemical treatment in the process of adsorption presents a viable and efficient option for the removal of chromium owing to its economical operational expenses, effectiveness, and environmentally friendly operation [5,10,11]. To optimize Cr6+ extraction via biomaterial-based adsorbents, scholars have delved into interpreting the underlying mechanism. They reported the pivotal roles of electrostatic affinity and complexation with activated functional sites [4,12]. Nevertheless, numerous techniques encounter economic or technological constraints, such as inadequate elimination of chromium, the complicated configuration of the facility, high operations and maintenance expenses, and a substantial requirement for knowledge [10,13]. Certain procedures also produce hazardous secondary waste, such as precipitation, and chemical oxidation that involves the extensive use of acids/bases for pH adjustment and results in environmental contamination [11,14].
The utilization of bio-material-based adsorption is prevalent and holds significant potential to effectively eliminate chromium ions from contaminated water [9,14,15,16]. The bio-materials can be quaternized which involves a particular surface chemical treatment that introduces groups (R-NR’3+) onto lignocellulosic fibers. Herein, R denotes structures such as cellulose, lignin or hemicellulose, while R’ signifies an alkyl group. This modification can be achieved through epoxy substitution, enhancing the fiber’s tendency for cationic or anionic materials via ion-exchange adsorption mechanisms [9,15,17,18]. Cellulose, a linear natural polymer, comprises β-D-glucopyranose monomers interconnected covalently through β-1,4-glycocidic bonds. Despite the presence of numerous hydroxyl groups within a cellulose molecule, reactions predominantly occur at the hydroxyl group located in the C-6 structure [9,19].
Numerous quaternizing agents are available, each preferred based on the desired reaction mechanism. Notably, N-(3-chloro-2-hydroxypropyl) trimethylammonium chloride, abbreviated as CHMAC and trimethylamine, is frequently employed in research [9,19]. Trimethylamine and N, N-dimethylformamide termed DMF, prerequisite pyridine can be utilized as a catalyst. Given the carcinogenic nature and the high cost of these chemicals, CHMAC is often favored. This is because its reactions necessitate only sodium or potassium hydroxide, a relatively economical and benign chemical [7,9,19,20,21]. Typically, a quaternization reaction entails three stages: cellulose’s interaction with hydroxide, CHMAC’s epoxy generation, and the subsequent reaction between the epoxide and cellulose’s hydroxyl group, resulting in ether production [21,22]. Quaternized lignocellulosic fibers exhibit enhanced adsorptive capacity and affinity for anionic and cationic substrates. Such perfections can be attributed to the increased surface area, porosity, and chelating functional groups initiated by the quaternization process [21,22].
Date palm waste is abundantly available in many regions, particularly in Middle Eastern and Asian countries with extensive date cultivation [23]. This widespread availability makes it a cost-effective and sustainable option. In addition, date palm waste exhibits unique properties that make it effective for metal ion removal. Its fibrous structure and high cellulose content provide an excellent matrix for metal ion adsorption. Additionally, functional groups like hydroxyl, carboxyl, and phenolic compounds in date palm waste enhance its capacity to chelate metal ions. Many studies examined date palm waste-based biochar or activated carbon to remove metals and showed superior efficacy. Interestingly, based on our knowledge, no study has explored chromium removal using chemically modified fibers of date palm waste.
This research uses the quaternization procedure to synthesize date palm waste (DPW) as a precursor for a biomaterial-based adsorbent, employing CHMAC as the quaternizing agent. This study examines parameters such as solution pH, contact duration, sorbent dosage, initial concentrations, column study, adsorption isotherms, and kinetics, along with their subsequent modeling, to assess the suitability of these parameters for chromium removal from aqueous solutions using QDPW. This presents a credible solution for addressing the Cr6+ issue, offering a cost-effective and ecologically sustainable alternative to conventional water treatment techniques.
2. Materials and Methods
2.1. Synthesis of Quaternized Date Palm Waste
The date palm waste (DPW) bark is abundant in various regions, including Saudi Arabia. Initially, the DPW was washed with hot water, followed by rinsing with acetone to remove any remaining organic content. The washed DPW was then sun-dried for a period of 4–5 days [18,19]. Afterward, the unprocessed DPW underwent grinding and sieving, resulting in particle sizes ranging from 0.25 to 0.5 mm. The quaternization method employed for the synthesis of QDPW in which the fibrous DPW underwent mercerization using a 40 wt.% potassium hydroxide (KOH) (Aba Chemicals Corporation, Shanghai, China) solution for a duration of 2 h [22]. The mercerized DPW was then rinsed with distilled water and dried for 24 h at a temperature of 60 °C in an oven.
During the process of quaternization, a stoichiometric balance was maintained for the reactants, consisting of 5 M KOH and N-(3-chloro-2-hydroxypropyl) trimethylammonium chloride (CHMAC) procured at 40% purity (Sigma, Taufkirchen, Germany). CHMAC was known as the limiting reactant in this synthesis. The weight-to-weight ratio for the reactants—KOH, CHMAC, and water was set at 1:1:4 for every gram of mercerized DPW. This mixture was sealed in an airtight container at room temperature for an hour. After the reaction, the fiber/granular material was rinsed with 0.5% acetic acid (Aba Chemicals Corporation, Shanghai, China) to halt the reaction. This was followed by multiple washes with distilled water until achieving a neutral pH. The QDPW samples were subsequently dried at 60 °C in the oven for 24 h and stored in a desiccator. Figure 1a,b illustrate the methodology and proposed chain reaction to formulate QDPW, respectively. Figure 1b also demonstrates the proposed chemical structure/formula of QDPW.
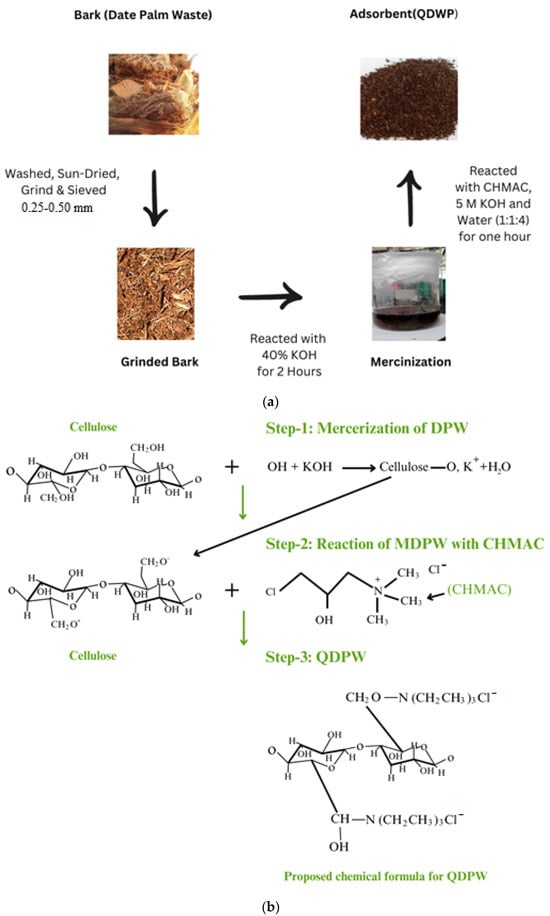
Figure 1.
(a) Schematic pathway for preparation of QDPW(Adsorbent); (b) Scientific pathway for the preparation of QDPW(Adsorbent) [24].
2.2. Characterization of DPW and QDPW
The characterization of DPW and QDPW was carried through various analytical techniques, including carbon, hydrogen, and nitrogen analysis (CHN analysis), scanning electron microscopy (SEM) equipped with energy dispersive X-ray analysis (EDX), Fourier transform infrared spectrometry (FTIR), Brunauer, Emmett, and Teller analysis (BET), thermogravimetric analysis (TGA), and X-ray diffraction (XRD).
The CHN analysis aimed to determine the proportion of nitrogen, hydrogen, and carbon present in the specimens. A sample with an approximate mass of 0.1 mg was weighed using a digital micro-balance and analyzed using LECO CHNS-932 (US) (EA Consumables, LLC, Marlton, NJ, USA).
SEM, coupled with an EDX accessory (Hitachi S-3400, Tokyo, Japan) was conducted at a voltage range of 20–30 kV. Before analysis, samples of DPW and QDPW were coated with a thin Au/Pd layer. Considering, the sample characteristics, EDX spectra were captured at magnifications ranging from 1000–5000×.
FTIR spectra were obtained using a Fourier-transform infrared spectrometer (Perkin Elmer, Waltham, MA, USA). The transmittance percentage was plotted against the wavenumber, spanning the 500 to 4000 cm−1 range, under ambient conditions. Analysis of the FTIR spectra facilitated the identification of functional groups in the samples.
The BET method was employed to analyze the surface area of DPW and QDPW. The BET surface area analyzer (Gemini analyzer, Micrometric, Sarasota, FL, USA) was used in this study. Determination of pore size (average), and average pore volume of the samples was observed using the Barrett, Johner, and Halenda (BJH) equation.
A thermogravimetric analyzer (Mettler Toledo, Columbus, OH, USA, TGA/SDTA851) was utilized in order to perform thermogravimetric analysis (TGA). About ten milligrams of the sample were utilized for the analysis, and it was heated at a rate of 10 °C per minute from 28 °C to 500 °C in a nitrogen atmosphere at a flow rate of twenty milliliters per minute. During the heating process, the weight loss was recorded for subsequent studies.
X-ray diffraction (XRD) analysis was performed to ascertain the structure of the substance and the percentage of crystallinity it possessed with help of Shimadzu XRD-6000 X-ray diffractometer (Kyoto, Japan). Nickel-filtered Cu Kα (λ = 1.542 Å) radiation with a wavelength of 1.542 Å was used for the X-ray beam, which was operated at 30 kV and 30 mA. The data obtained from diffraction were recorded at a rate of 2 degrees per minute, with scattering angles (2θ) ranging from 20 degrees to 90 degrees. The wood industry method was used to determine the proximate chemical composition of DPW and QDPW, including cellulose, hemicellulose, and lignin [9,24].
2.3. Preparation of Chromium Solution for Isotherms and Kinetics
A stock solution of chromium (Cr6+) was prepared by dissolving 2.8 g of potassium dichromate (K2Cr2O7) in one liter of distilled water. Subsequently, various concentrations were achieved through the process of diluting the stock solution with suitable amounts of distilled water. The Spectrophotometer (DR-900, Hach, Loveland, CO, USA) was used to verify the final concentrations. The batch studies were conducted employing 250-mL Erlenmeyer flasks. To ensure the prevention of leakage and evaporation, all flasks were appropriately sealed. The samples were mechanically agitated using a digital orbital shaker at a speed of 110 rpm (±2 rpm) and a temperature of 30 °C (±2 °C). The investigated adsorption parameters encompassed the starting pH, contact duration, QDPW doses, and initial chromium concentration. The column study and regeneration of the adsorbent was also conducted which is imperative for real-world applications.
2.4. Impact of pHpzc and pH on the Process
The pHpzc, also known as the isoelectric point, was observed by introducing 1 g/L of QDPW containing 0.01 M NaNO3 using the drift method. The pH of the chromium solution was observed within the range of 2–9 by the addition of either 0.1 N NaOH or 0.1 N HCl. The flasks were carefully closed and agitated for a duration of three days at ambient temperature [24]. The pH values of the chromium solutions were measured using a digital pH meter both before and after the shaking process.
The experimentation for evaluation of optimum pH for adsorption was also conducted at varying pH levels for chromium removal efficiency ranging from 2 to 9. The aqueous phase’s pH significantly influences chromium removal efficiency by bio-adsorbent [11,19,25]. Biomass-derived bio-adsorbents encompass bio-macromolecules characterized by the presence of thiol, carboxyl groups, amino, and phenol. The bio-sorption process is dependent upon the deprotonation and protonation of the functional groups [11,14].
2.5. Impact of Dosage and Initial Concentration
The impact of different dosages of QDPW was examined in a series of batch experiments. Numerous quantities of QDPW (1–6 g/L) were introduced into 100 mL of chromium solutions with a 25 mg/L concentration. The pH of the solutions was adjusted to the optimal pH level followed by agitation process for a duration of 2 h.
The impact of the initial concentration for the adsorption of chromium onto QDPW was investigated by employing 100 mL of a chromium solution. The solution had varying initial chromium concentrations (25 mg/L, 50 mg/L, 75 mg/L, 100 mg/L, 125 mg/L, and 150 mg/L). These experiments were also performed in 250 mL Erlenmeyer flasks, and each flask was correctly sealed after adding 4 g/L of QDPW. The samples underwent agitation for a duration of 2 h.
2.6. Adsorption Dynamics of Chromium Removal on QDPW
2.6.1. Kinetic Modeling for Chromium Removal on QDPW
Kinetic studies in the realm of adsorption shed light on the rate of removal, the underlying mechanisms, and the determinants of the adsorption process. The pseudo-first- and pseudo-second-order kinetic models stand as fit models to summarize adsorption reactions. Lagergren reported the maiden model tracing the rate of adsorption encompassing the adsorption capacity [9,26]. Later on, Ho (2006) developed the adsorption of divalent cations onto peat, emphasizing the fundamental role of chemical bonds between the functional groups and cations on peat [26]. His elucidation paved the path for what is known as the pseudo-second-order rate equation. This postulates that a proportionate relationship between the rate of occupation on adsorption sites and the square of the number of empty sites governs the kinetics of adsorption [7,9]. This frequently suggests the occurrence of chemisorption, which involves the interaction of valence forces through electron exchange or sharing between the adsorbent and adsorbate. Equations (1) and (2) manifest these two kinetic paradigms:
Here, qe is the quantity of adsorbate adsorbed at equilibrium (mg/g) and the variable “qt” represents the quantity of adsorbate that has been adsorbed at a certain time “t” in (mg/g). The symbol k1 signifies the rate constant related to the pseudo-first-order adsorption process, expressed in units of minutes to the power of a negative one.
In real-world adsorption circumstances, it is frequently observed that the second-order model may need to adequately account for all the intricacies, particularly when considering approaching equilibrium.
The symbol K2 represents the rate constant for pseudo-second-order adsorption, measured in grams per milligram per minute (g/mg·min).
In addition, the Elovich kinetic model is a mathematical model used to describe the kinetics of a chemical reaction. The Elovich equation (Equation (3)) is frequently employed in the characterization of chemisorption phenomena occurring between adsorbate and heterogeneous surfaces [9,25]. A higher α value indicates more rapid initial adsorption, which can be attributable to the greater abundance of active sites accessible at the onset of the process. It involves the determination of certain parameters that are essential for accurately representing the reaction.
The Weber–Morris equation suggests the prospect of diffusion governing the singular determinant of the adsorption rate. If the data unfolds a multi-linear trajectory, it signals the sorption being steered by multiple determinants (Equation (4)) [9,25].
2.6.2. Adsorption Isotherms
In addition, an adsorption isotherm offers a comprehensive view of the intricate linkage between the adsorbent and the adsorbate at equilibrium. This exploration unravels the essence of the adsorption sequence, whether it is a multilayer or singular layer adsorption, its optimum capacity, or the distinctions of its surface diversity. These revelations are instrumental in architecting an adept adsorption phenomenon. In this study, four distinguished isotherm paradigms, namely Langmuir, Freundlich, Redlich-Peterson, and Sips were employed to observe the data.
The Langmuir isotherm postulates the adsorption of a monolayer onto a surface that possesses a limited quantity of similar sites. Once a site has reached its capacity, no additional sorption can take place at that particular site [7,27]. The Langmuir equations can be expressed in a linearized form (Equations (5)–(7)).
Here, qe refers to the amount of solute adsorbed per unit weight of QDPW at equilibrium (mg/g), and Q0 is the maximum adsorption capacity corresponding to complete monolayer coverage on the surface (mg/g). In addition, KL denoted to Langmuir constant related to the energy of adsorption (L/mg). While Ce is the equilibrium concentration of the solute in the chromium solution (mg/L).
The Freundlich isotherm (Equation (8)) offers a narrative of multilayer adsorption on diversified patterns. If the value of “n” descends towards unity, the adsorption trajectory remains linear. A value less than one reflects a propensity towards chemisorption, while a value greater than 1 leans towards physisorption [7,15,27].
Here, kF (mg/g) and n are Freundlich constants, indicating adsorption capacity and heterogeneity factor or adsorption intensity, respectively.
The Redlich–Peterson isotherm (Equation (9)) is a blend of the Langmuir and Freundlich isotherm principles [9]. It offers a hybrid adsorption narrative that remains versatile across concentration gradients which is independent of the surface’s behavior.
The Sips isotherm is another hybrid model that at certain conditions, can be reduced to either the Langmuir or Freundlich isotherms [1,28]. It is given by (Equation (10)):
If β = 1, the Sips isotherm reduces to the Langmuir isotherm.
3. Results and Discussion
3.1. Characterization of DPW and QDPW
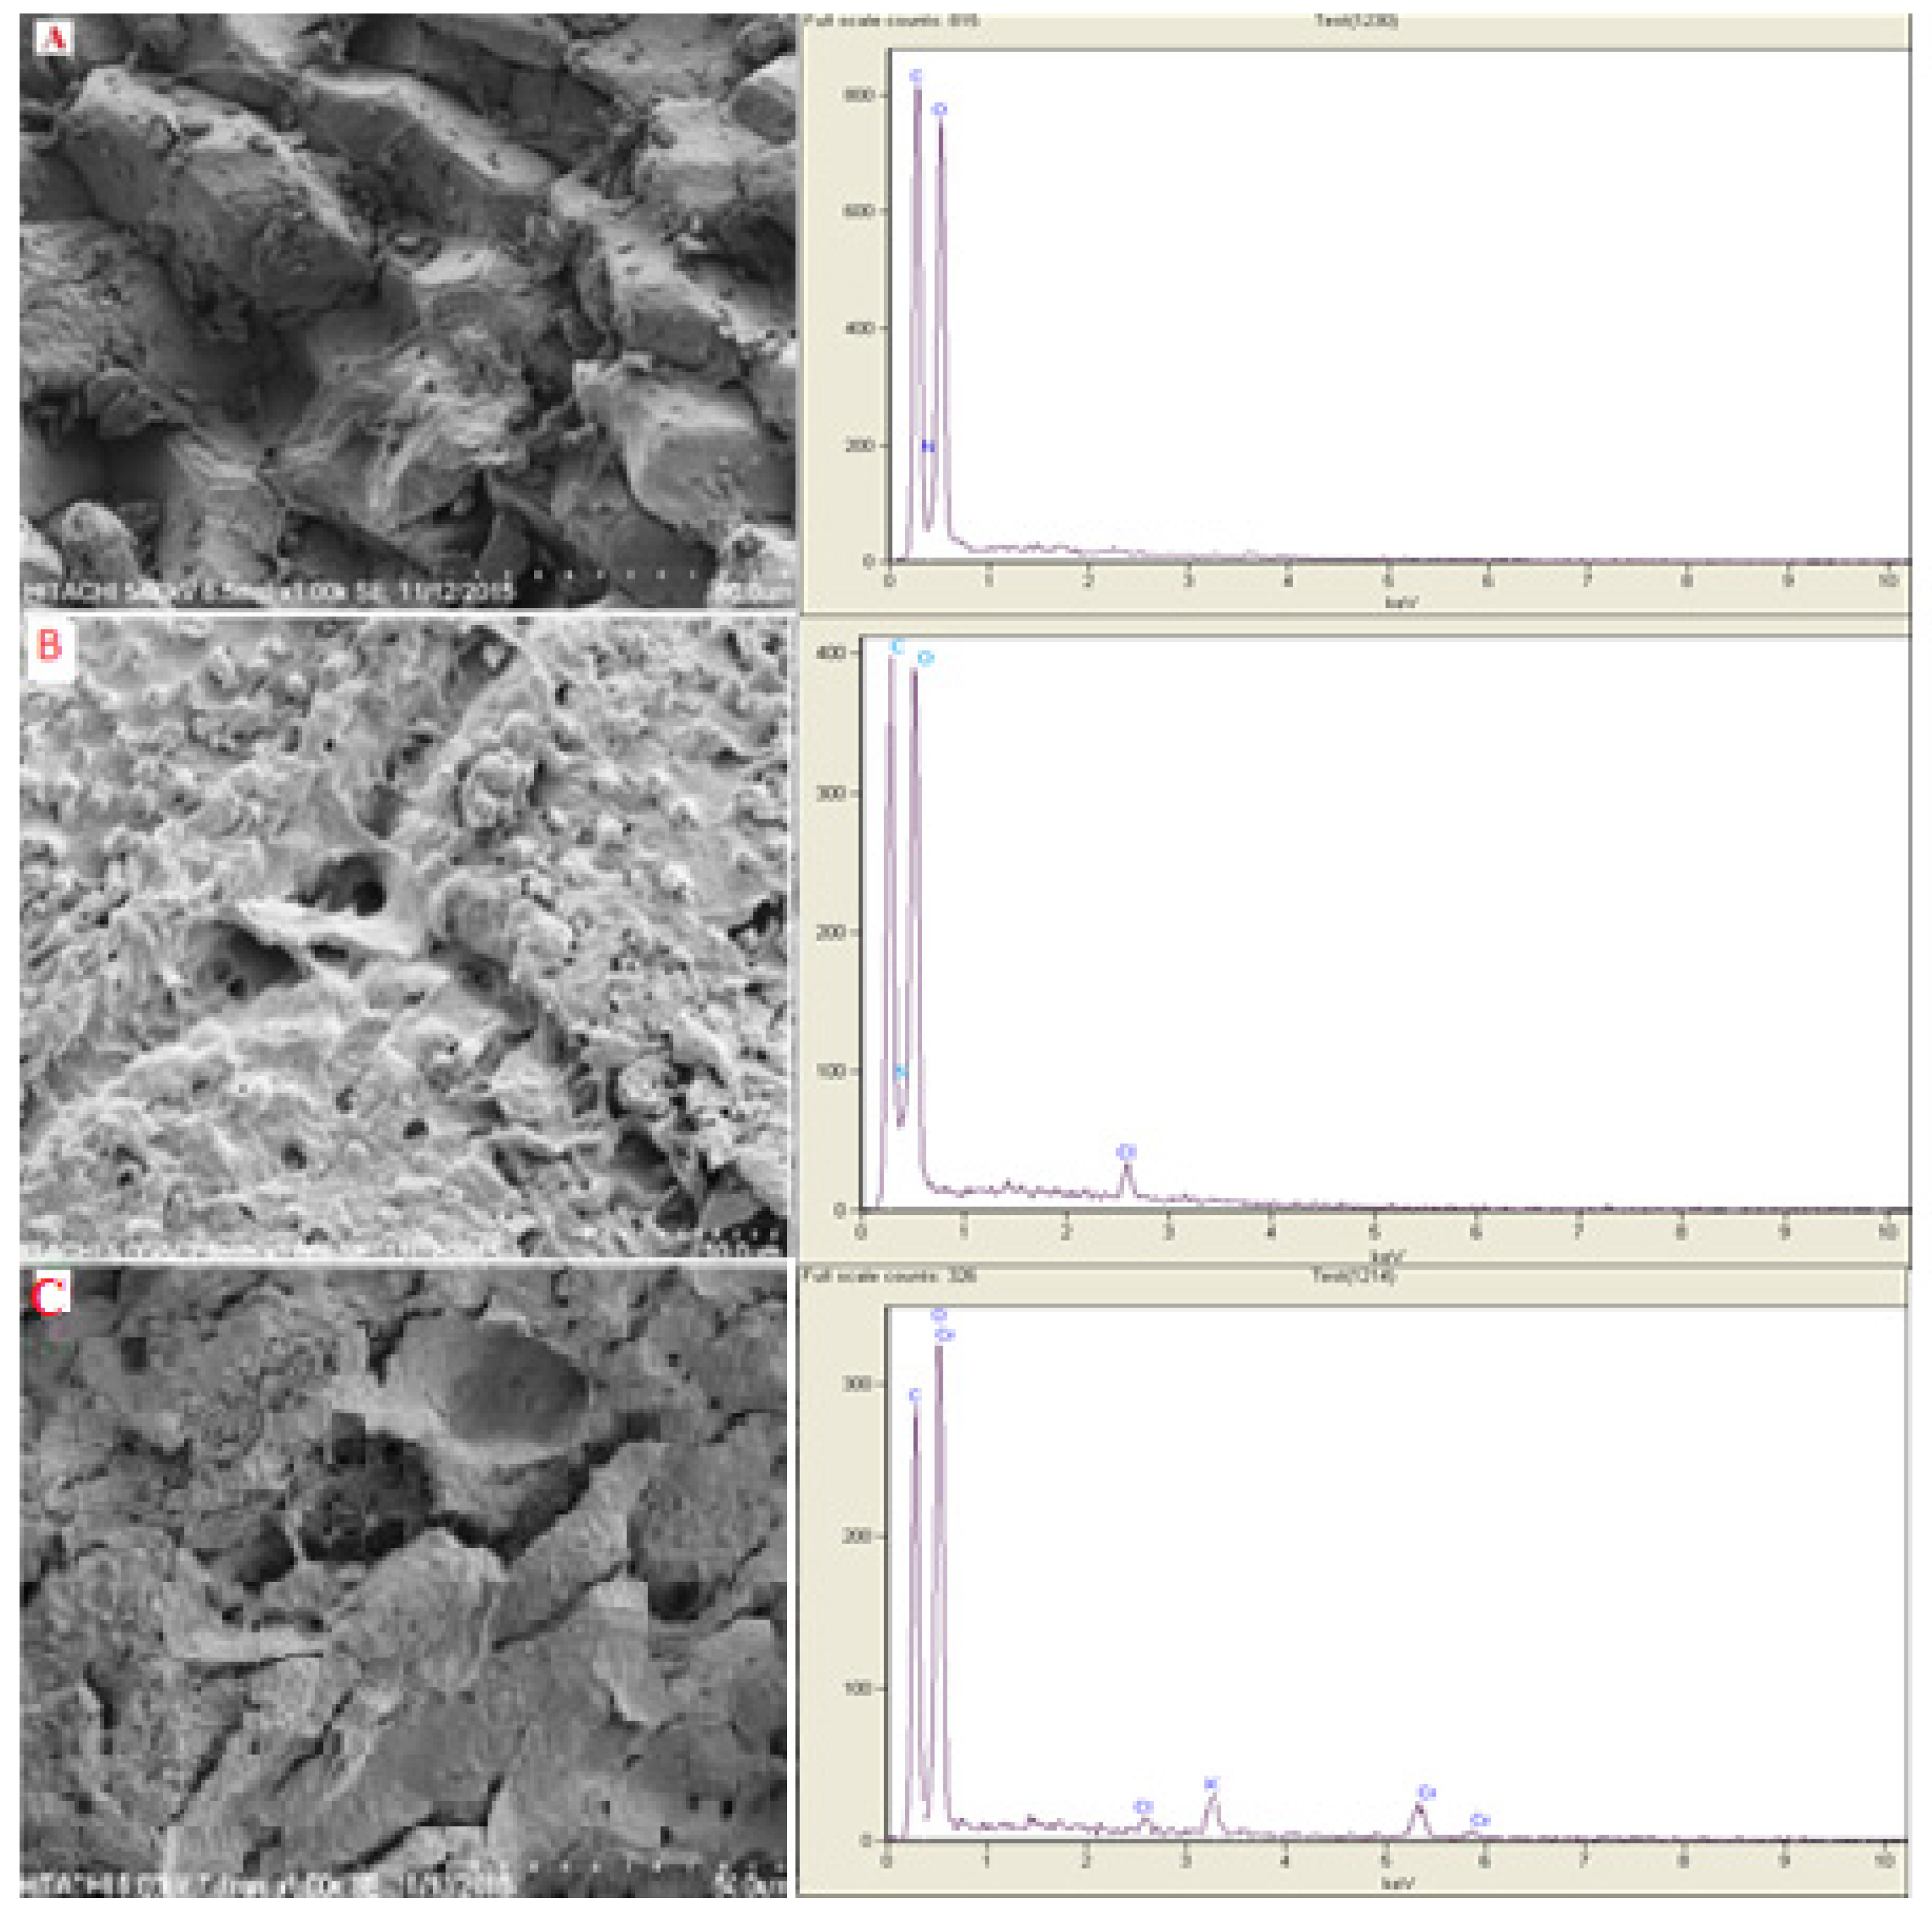
The SEM imagery of the DPW and QDPW was obtained, and an abundance of macropores was observed in QDPW, favoring the assimilation of immense molecules, contrasted against DPW, as depicted in Figure 2. In post-quaternization (QDPW), smooth refinements of the fibers resulted due to the elimination of impurities and lignin due to the caustic characteristics of KOH. Energy-dispersive X-ray elucidation reflects SEM (Figure 2), focusing on the superficial elements. In QDPW, spectral peaks (Figure 2B) revealed an attractive surge regarding nitrogen’s presence that is slightly absent in its DPW counterpart (Figure 2A). This analytical expedition reaffirms the symphony of the quaternary ammonia ensemble (NR4+) with QDPW, concluding in a harmonious synthesis. Subsequently, the EDX showed an increase in nitrogen content of 36.65% in QDPW (2.16% and 3.41% in DPW and QDPW, respectively), reflecting the high assertion of nitrogen that can perform as an active site for chromium removal (Table 1). One could thus postulate that the NR4+ ensemble primarily showed the superficial realm of the fiber.
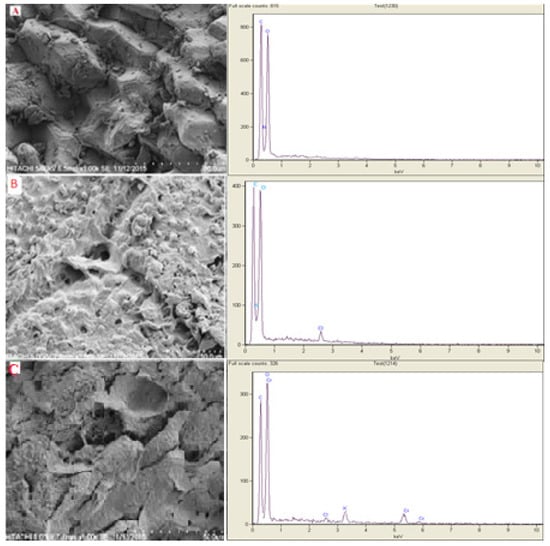
Figure 2.
SEM image with corresponding EDX Spectra (A) Raw DPW, (B) QDPW at resolution 3 K, and (C) Chromium Loaded QDPW.

Table 1.
EDX analysis of DPW, QDPW, and Chromium-loaded QDPW.
Table 2 elucidates that DPW boasted a median pore diameter of 13.34 nm, categorizing them into the mesopore realm. Contrastingly, QDPW exhibited a pore diameter averaging 98.68 nm, catapulting it into the macropore domain. This enlargement of pore magnitude owes its origins to the dissolution process of lignin and hemicellulose amidst the KOH that was imparted during the pre-treatment process of mercerization and subsequent quaternization. The smaller surface area of QDPW compared to other adsorbents such as AC or biochar, can be attributed to inherent structural characteristics of DPW and the effects of chemical modification (by CHMAC). Despite this, its efficiency in metal ion removal can supported by other factors, such as the presence of functional groups and the specific nature of the adsorption process.
Table 2.
BET analysis of DPW and QDPW.
Table 3 summarizes the revelations from CHN elemental separations, promising the achievement of the quaternization endeavor on DPW and QDPW. Nitrogen’s presence enhanced from 2.92% to 3.73% in the aftermath of quaternization. The CHN analysis further narrates a modest dip by 3.44% in the carbon constituency of QDPW, a degree attributed to the disintegration of lignin, hemicellulose, contaminants, and extracts amidst the dual process of mercerization and quaternized date palm waste both processed under alkaline conditions.
Table 3.
CHN-Analysis of date palm and quaternized date palm waste.
Figure 3 unfolds the FTIR spectral peaks of both DPW and QDPW. A passive upsurge at 965 cm−1 in the QDPW compared to 945 cm−1 in DPW, is an impression of C-N impacts, testifying to the accomplished quaternization of the NR4+ established in QDPW [7,9]. Additionally, peaks at 1440 and 1416 cm−1, of nearly consistent magnitudes, resonate the C-H oscillations of the tert-butyl ensemble, bearing witness to the liaison of the quaternary ammonia ensemble with QDPW. The intensity in the QDPW is greater than that in the DPW within the range of 945–1416 cm−1 due to the KOH pre-treatment that facilitated the development of oxygen-containing functional groups. The presence of a band observed at a wavenumber of 1681 and 1616 cm−1 in QDPW and DPW, respectively, can be attributed to the stretching vibrations of alkenyl C=C bonds. The observed spectra exhibited prominent absorption bands around 3640–3655 cm−1 which can also be attributed to the presence of hydroxyl groups. Moreover, the presence of hydroxyl, carboxyl, and amino groups is responsible for the observed effects and C-H impacts at 2922 and 2852 cm−1 in adsorbent (QDPW). The C-O pulse in the C-O-C cellulose linkages resonates at 873 cm−1 and 872 cm−1 for both DPW and QDPW. DPW’s spectral narrative further hints at passive harmonies between 1762 and 1416 cm−1, suggesting presence of an aromatic ring. Furthermore, upsurges at 1640 and 1416 cm−1 in the DPW indicates the presence of aromatic C=C oscillations [7,19,29].
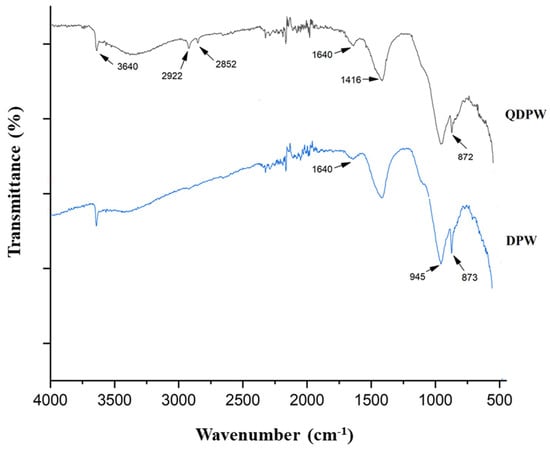
Figure 3.
FTIR spectra of date palm waste (DPW) and quaternized date palm waste (QDPW).
XRD patterns are characterized by peaks at specific angles, known as 2-theta (2θ), which correspond to the diffraction of X-rays by the crystal planes in the material. The position, intensity, and width of these peaks provide information about the crystalline structure, phase composition, and degree of crystallinity [9]. The XRD patterns of DPW and QDPW in this study indicate that the overall chemical structure and composition of fiber did not drastically change after the surface treatment because of the peak at around 23° in both DPW and QDPW (Figure 4). This indicates that the quaternary amine groups introduced during quaternization do not significantly change the overall crystalline framework of the fibers. On the other hand, additional peaks at 43° and 65° for QDPW sample could be indicative of new crystalline phases or changes in the material’s microstructure due to quaternization.
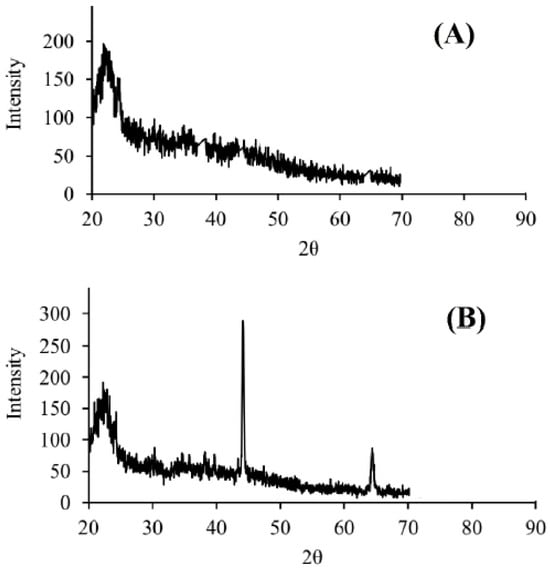
Figure 4.
XRD pattern of precursor and adsorbent, (A) DPW, (B) QDPW.
The percentages of cellulose, hemicellulose, and lignin in both DPW and QDPW are crucial. These components are biomass’s primary constituents, and their proportions can significantly influence thermal degradation behavior. DPW has higher cellulose (28.96%) and lignin (49.75%) contents compared to QDPW (cellulose: 20.15%, lignin: 38.25%). This suggests that DPW might have a more robust structure due to higher lignin content, known for its structural stability. The volatile matter content is slightly higher in DPW (54.49%) than QDPW (53.25%) (Table 4). On the other hand, the fixed carbon content (DPW: 33.05%, QDPW: 30.15%) indicates the amount of carbon remaining after the volatile components are expelled, which is essential for understanding the potential adsorption process (Table 4). In addition, differential thermal analysis (DTA) and thermogravimetric analysis (TGA) of DPW and QDPW revealed radical changes at various stages. The TGA curves (Figure 5) showed weight loss over temperature, providing insights into the biomass’s thermal stability and decomposition stages. The significant weight loss in organic matter is a crucial observation. Organic components like cellulose, hemicellulose, and lignin decompose at different temperature ranges, influencing the thermal degradation process. The cellulose decomposition occurred at peak temperatures around 350 °C and hemicellulose decomposition at around 300 °C are consistent with traditional biomass behavior [9,23]. Cellulose decomposes at higher temperatures due to its crystalline structure. In comparison, the lignin decomposition range is broader (260–475 °C), which reflects its complex and varied structure. The differences in thermal behavior between DPW and QDPW can be attributed to variations in their chemical composition. The higher lignin content in DPW suggests it might have a higher stability compared to QDPW. Consequently, it could impact its suitability for chromium adsorption on QDPW.
Table 4.
Chemical composition and proximate analysis of DPW and QDPW.
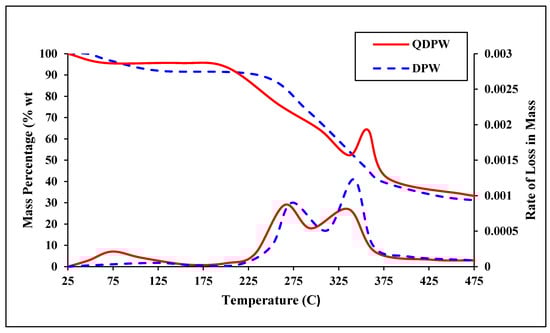
Figure 5.
TGA and DTG curves of DPW and QDPW.
3.2. Analysis of pHpzc and pH onto QDPW for Chromium
Figure 6 provides a visual presentation of pHpzc that is observed at a solution pH of 4.6 ± 0.2, at which ΔpH attained a null value. The phenomena of adsorption below the pHpzc threshold, one distinguishes a net positive adsorbent surface charge. The maximum value of ΔpH was captured at app. 1.4, the peak of the positive of positive manifests on the surface of the QDPW.
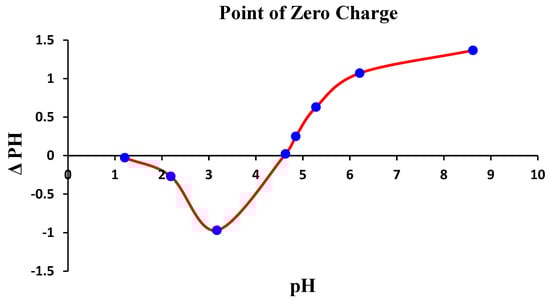
Figure 6.
Evaluation of pHpzc of QDPW (Adsorbent) (Chromium concentration = 25 mg/L, QDPW = 1 g/L).
Furthermore, the influence of pH on the removal of chromium was investigated using an adsorbent dosage of 0.4 g per 100 mL and a contact period of 120 min (Figure 7). The chromium extraction can be deeply influenced by the pH of the sample. Hence, the impact of pH on the basic solution of chromium was investigated in pH range from 2 to 9. The highest observed adsorption capacity was 19 mg/g at a pH of 2 that is hard and uneconomical to maintain on a commercial scale. This phenomenon can be attributed to an escalating OH− concentration, which attracts Cr6+ for adsorption. At moderated pH levels, the majority of protonated sites filled with Cr6+ [12]. The adsorption capacity exhibited a negative correlation with the pH level, as it reduced as the pH increased. In addition, the laboratory measurements indicated that the effective elimination also occurred at a pH of 6 ± 0.2, and pH 6.5 ± 0.2 which can be considered as the optimal pH level.
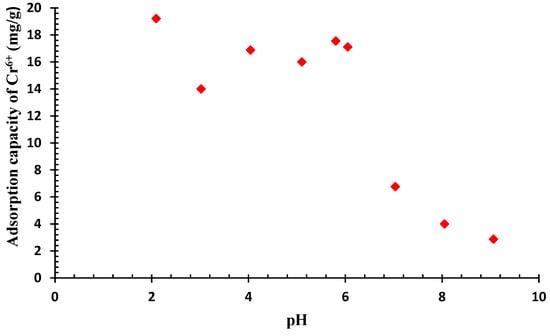
Figure 7.
Evaluation of pH on removal of chromium (Chromium concentration = 25 mg/L, QDPW = 4 g/L).
In short, the influence of solution pH on adsorption can be elucidated by considering both the surface charge of the adsorbent and the species distribution of chromium. The point of zero charge (pHpzc) plays a critical role in determining the surface charge of the QDPW (adsorbent). Depending on the pHpzc and the specific conditions, the adsorbent’s surface can become more positively or negatively charged. According to Geng et al. [13], a decrease in pH results in a reduction of electrostatic forces between the cationic chromium species and the adsorbent surface, leading to a decrease in removal effectiveness [10]. The adsorption capacity of chromium decreased with the increase in solution pH. On the other hand, this finding reveals that Cr6+ elimination primarily depends on the proton concentration. The higher the proton concentration, the higher the adsorption ability of QDPW for chromium. This dependence is also reported in other studies and can be explained by two probable mechanisms [30,31]. Firstly, the electrostatic affinity between chromate and positively charged amine groups enhances chromate adsorption in acidic conditions. Secondly, the reduction process of Cr6+ to Cr3+ requires a considerable amount of proton. Furthermore, it has been observed that hexavalent chromium has the potential to undergo a partial conversion into chromium (Cr3+), which subsequently interacts with hydroxyl ions that exist on the surface of QDPW [7].
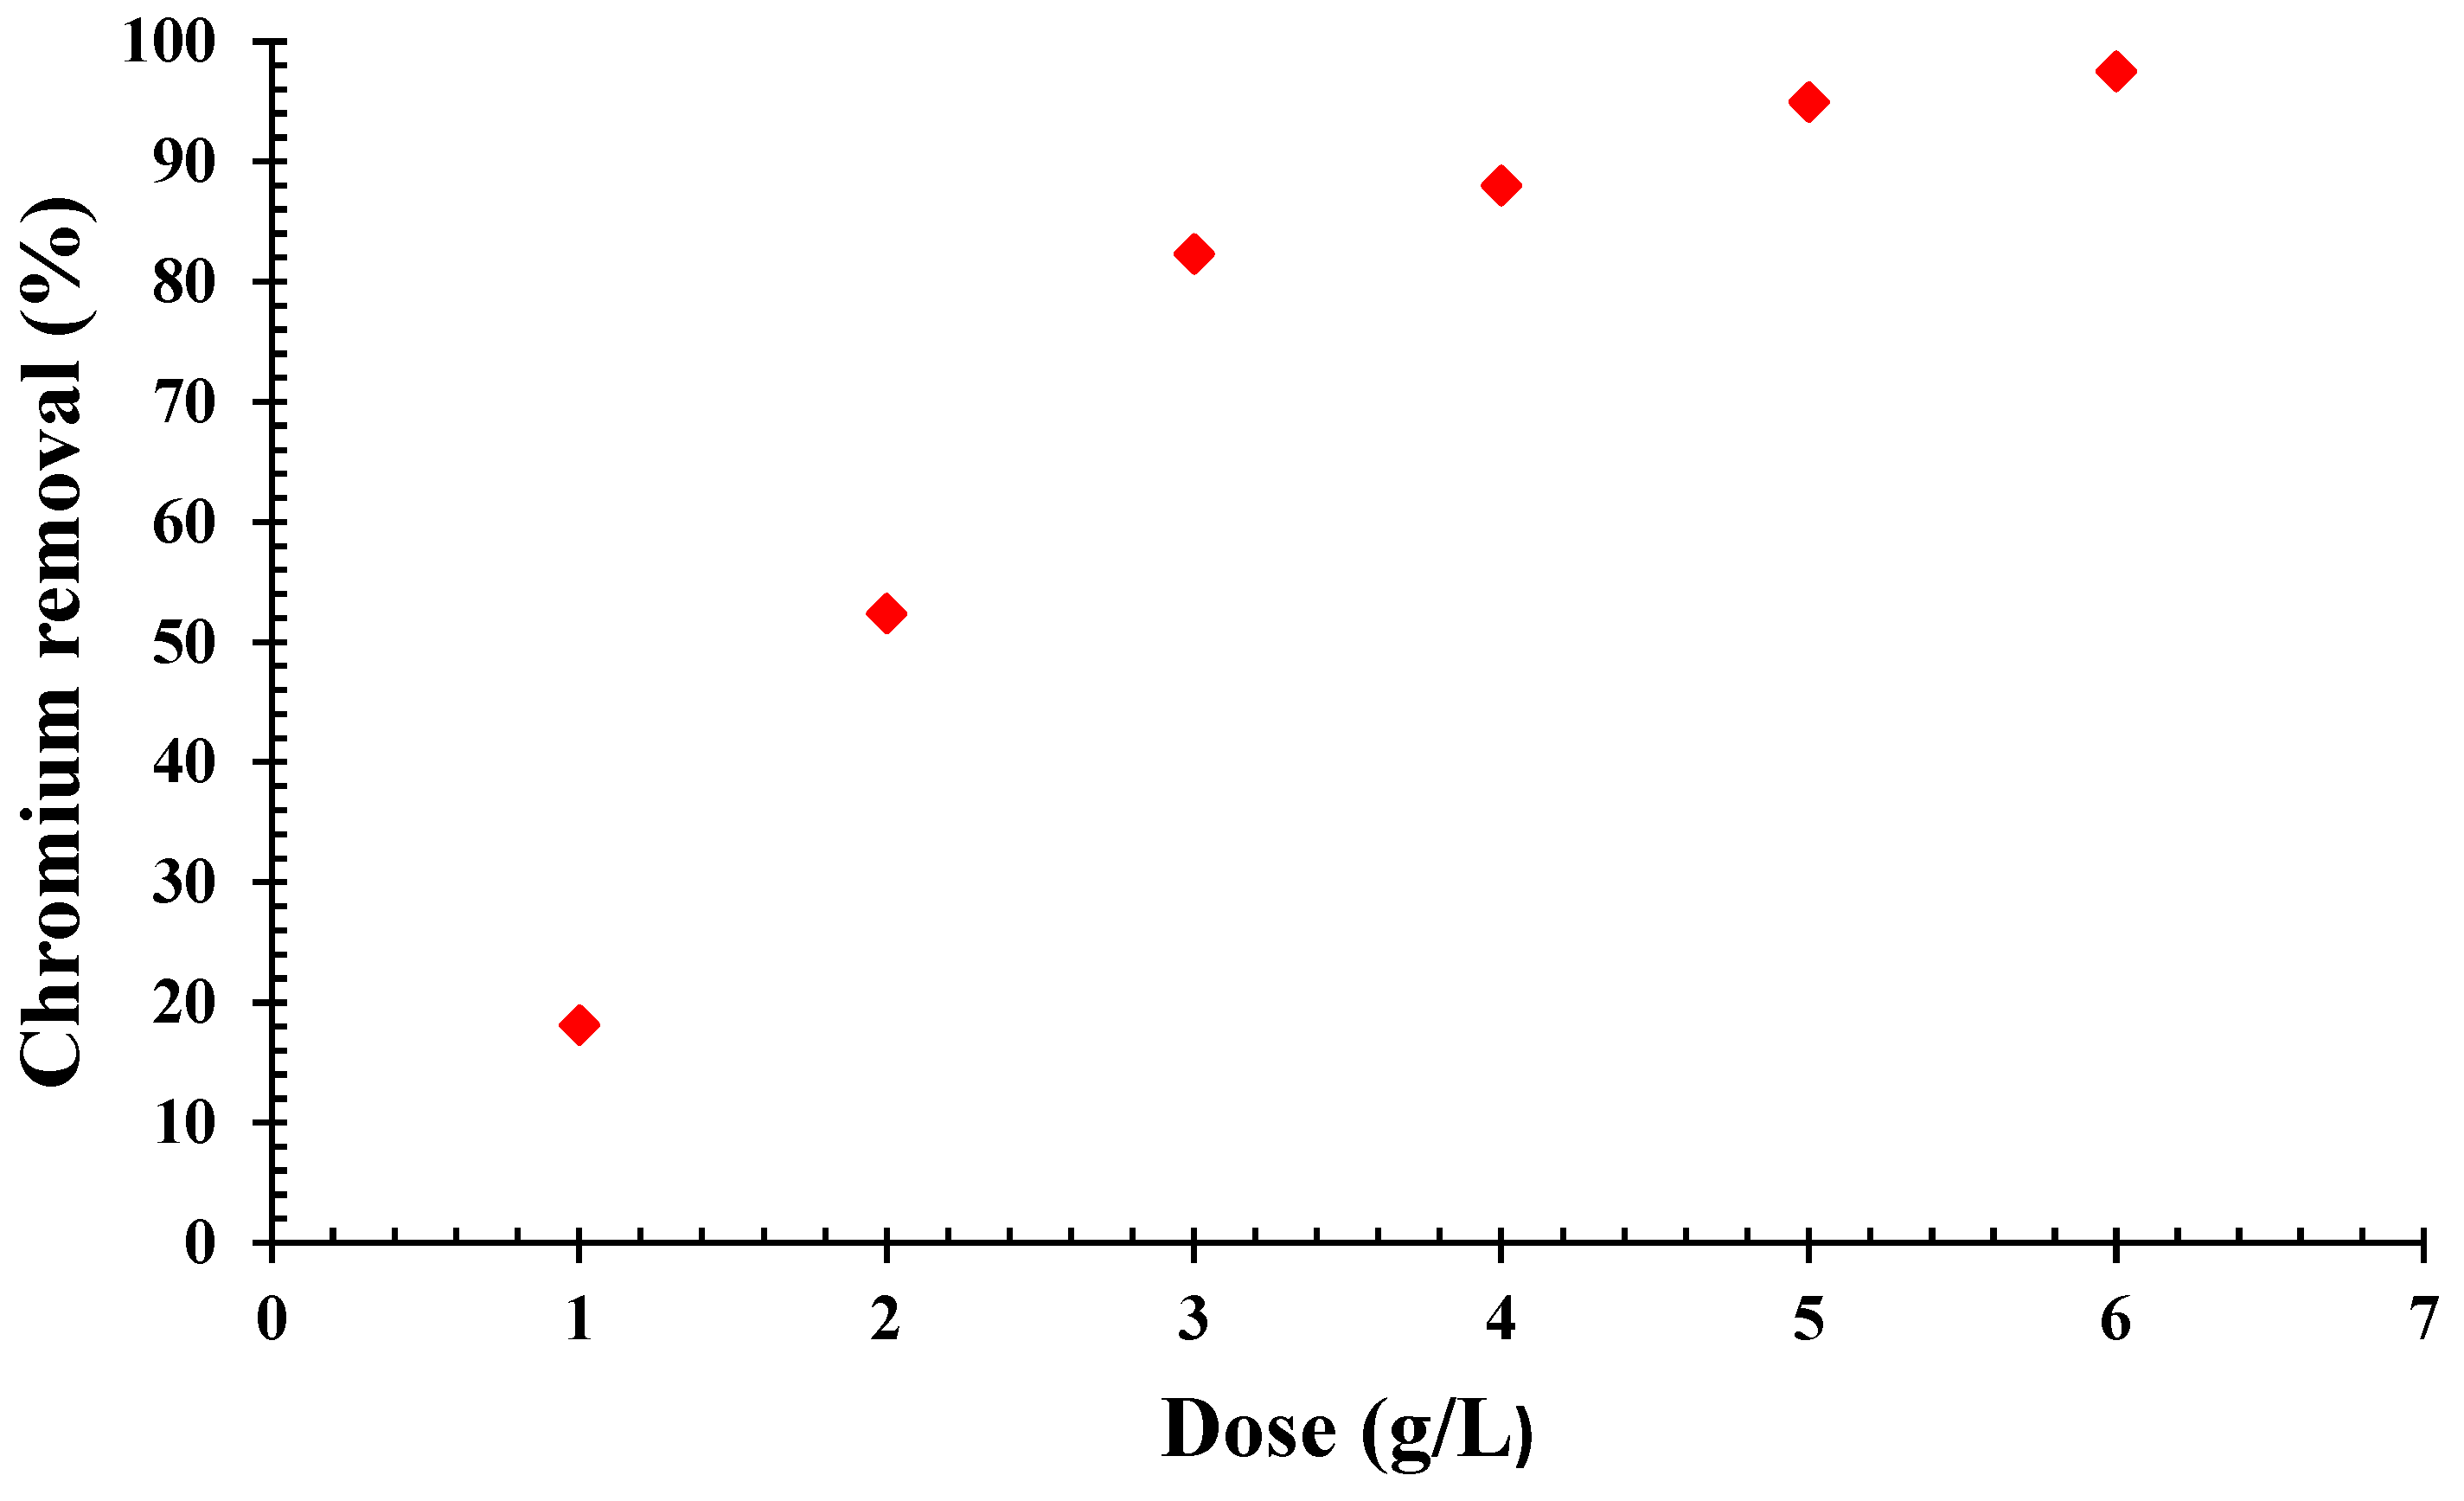
3.3. Dynamics of QDPW Dosage
Figure 8 shows the adsorbent dosage influence, ranging from 1 to 6 g/L, calibrated at the opted pH of 6.5 ± 0.2 and maintaining concentration of chromium solution as 25 mg/L. A linear ascent in chromium removal is observed with dosage increments, achieving stability at a dosage of 6 g/L. This study revealed that augmentations in the quantities of the QDPW led to a proportional increase in the removal of chromium, with the removal efficiency escalating from 18% to 96% with corresponding dose of QDPW (1–6 g/L), respectively, but slight increase in adsorption capacity was observed between 4 g/L to 6 g/L. This escalation in chromium adsorption capacity stems from the elevated chromium ion availability per unit mass of the QDPW (adsorbent), yielding a heightened chromium-to-QDPW ratio. However, further increase in mass of QDPW yields no tangible increase in chromium extraction, potentially due to the equilibrium of chromium concentration, rendering the adsorption driving force virtually insignificant [12,31].
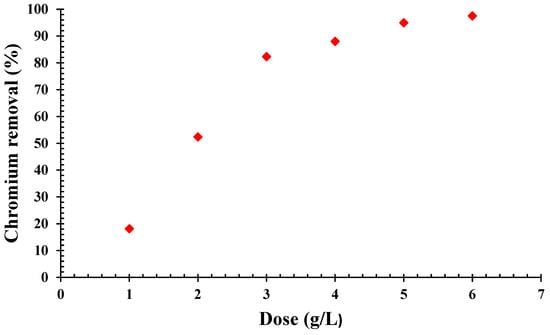
Figure 8.
Evaluation of QDPW dosage on removal (%) of chromium (Chromium concentration = 25 mg/L, pH = 6.5 ± 0.2).
3.4. Influence of Initial Concentration
Static studies are instrumental in interpreting the equilibration conditions in the adsorption. Chromium adsorption dynamics on QDPW across a range of initial chromium concentrations are illustrated in Figure 9A,B. The adsorption observations in Figure 9A are evident and continuous. Initial sharp chromium adsorption on QDPW, underscoring the chemical essence of the adsorption composition, eventually decelerates, culminating in an equilibrium [18,19,32]. The initial chromium concentration ranged between 25 to 150 mg/L, calibrated at the optimal solution pH (6.5 ± 0.2) and QDPW dosage, spanning a two-hour temporal spectrum. The chromium removal efficiency decreases from 88% to 52.67%. This can be attributed to the limited capacity of the adsorbent (QDPW) material, which is depleted as the initial chromium concentration increases. The observed phenomenon can be attributed to the rise in the number of ions competing for the limited number of available binding sites, as well as the scarcity of binding sites for the complex formation when initial chromium concentrations are higher. Furthermore, the present investigation demonstrated a positive correlation between the initial concentrations and corresponding adsorbed quantity of chromium that ranged from 5.5–19.75 mg/g. The chromium adsorption capacity on QDPW can be attributed to its surface functional groups that appeared as active sites in the post-quaternization stage and portray a tangible enhancement in adsorption. In addition, absorption of Cr6+ can be attributed to electrostatic bonding on active sites or through ion exchange. The oxidizing process of Cr6+ result in the oxidation reduced itself to Cr3+. In addition, two possible reduction mechanisms have been illustrated in Figure 10 that involve the direct conversion of Cr6+ to Cr3+ through the transfer of electrons from the adsorption site as well as an indirect reduction process in which a Cr6+ species adsorbed electrons from a neighboring site in order to promote the reduction [11,12,32].
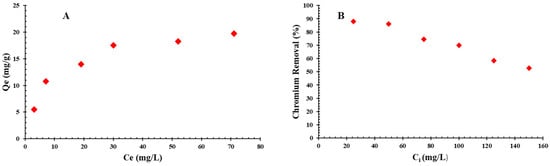
Figure 9.
Evaluation of chromium initial concentration, (A) Adsorption capacity (mg/g) and (B) Chromium removal (%) (QDPW = 4 g/L, pH = 6.5 ± 0.2).
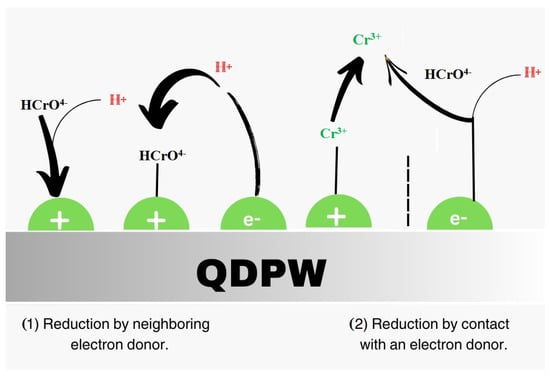
Figure 10.
Mechanism of adsorption illustrating reduction of Cr6+ onto QDPW.
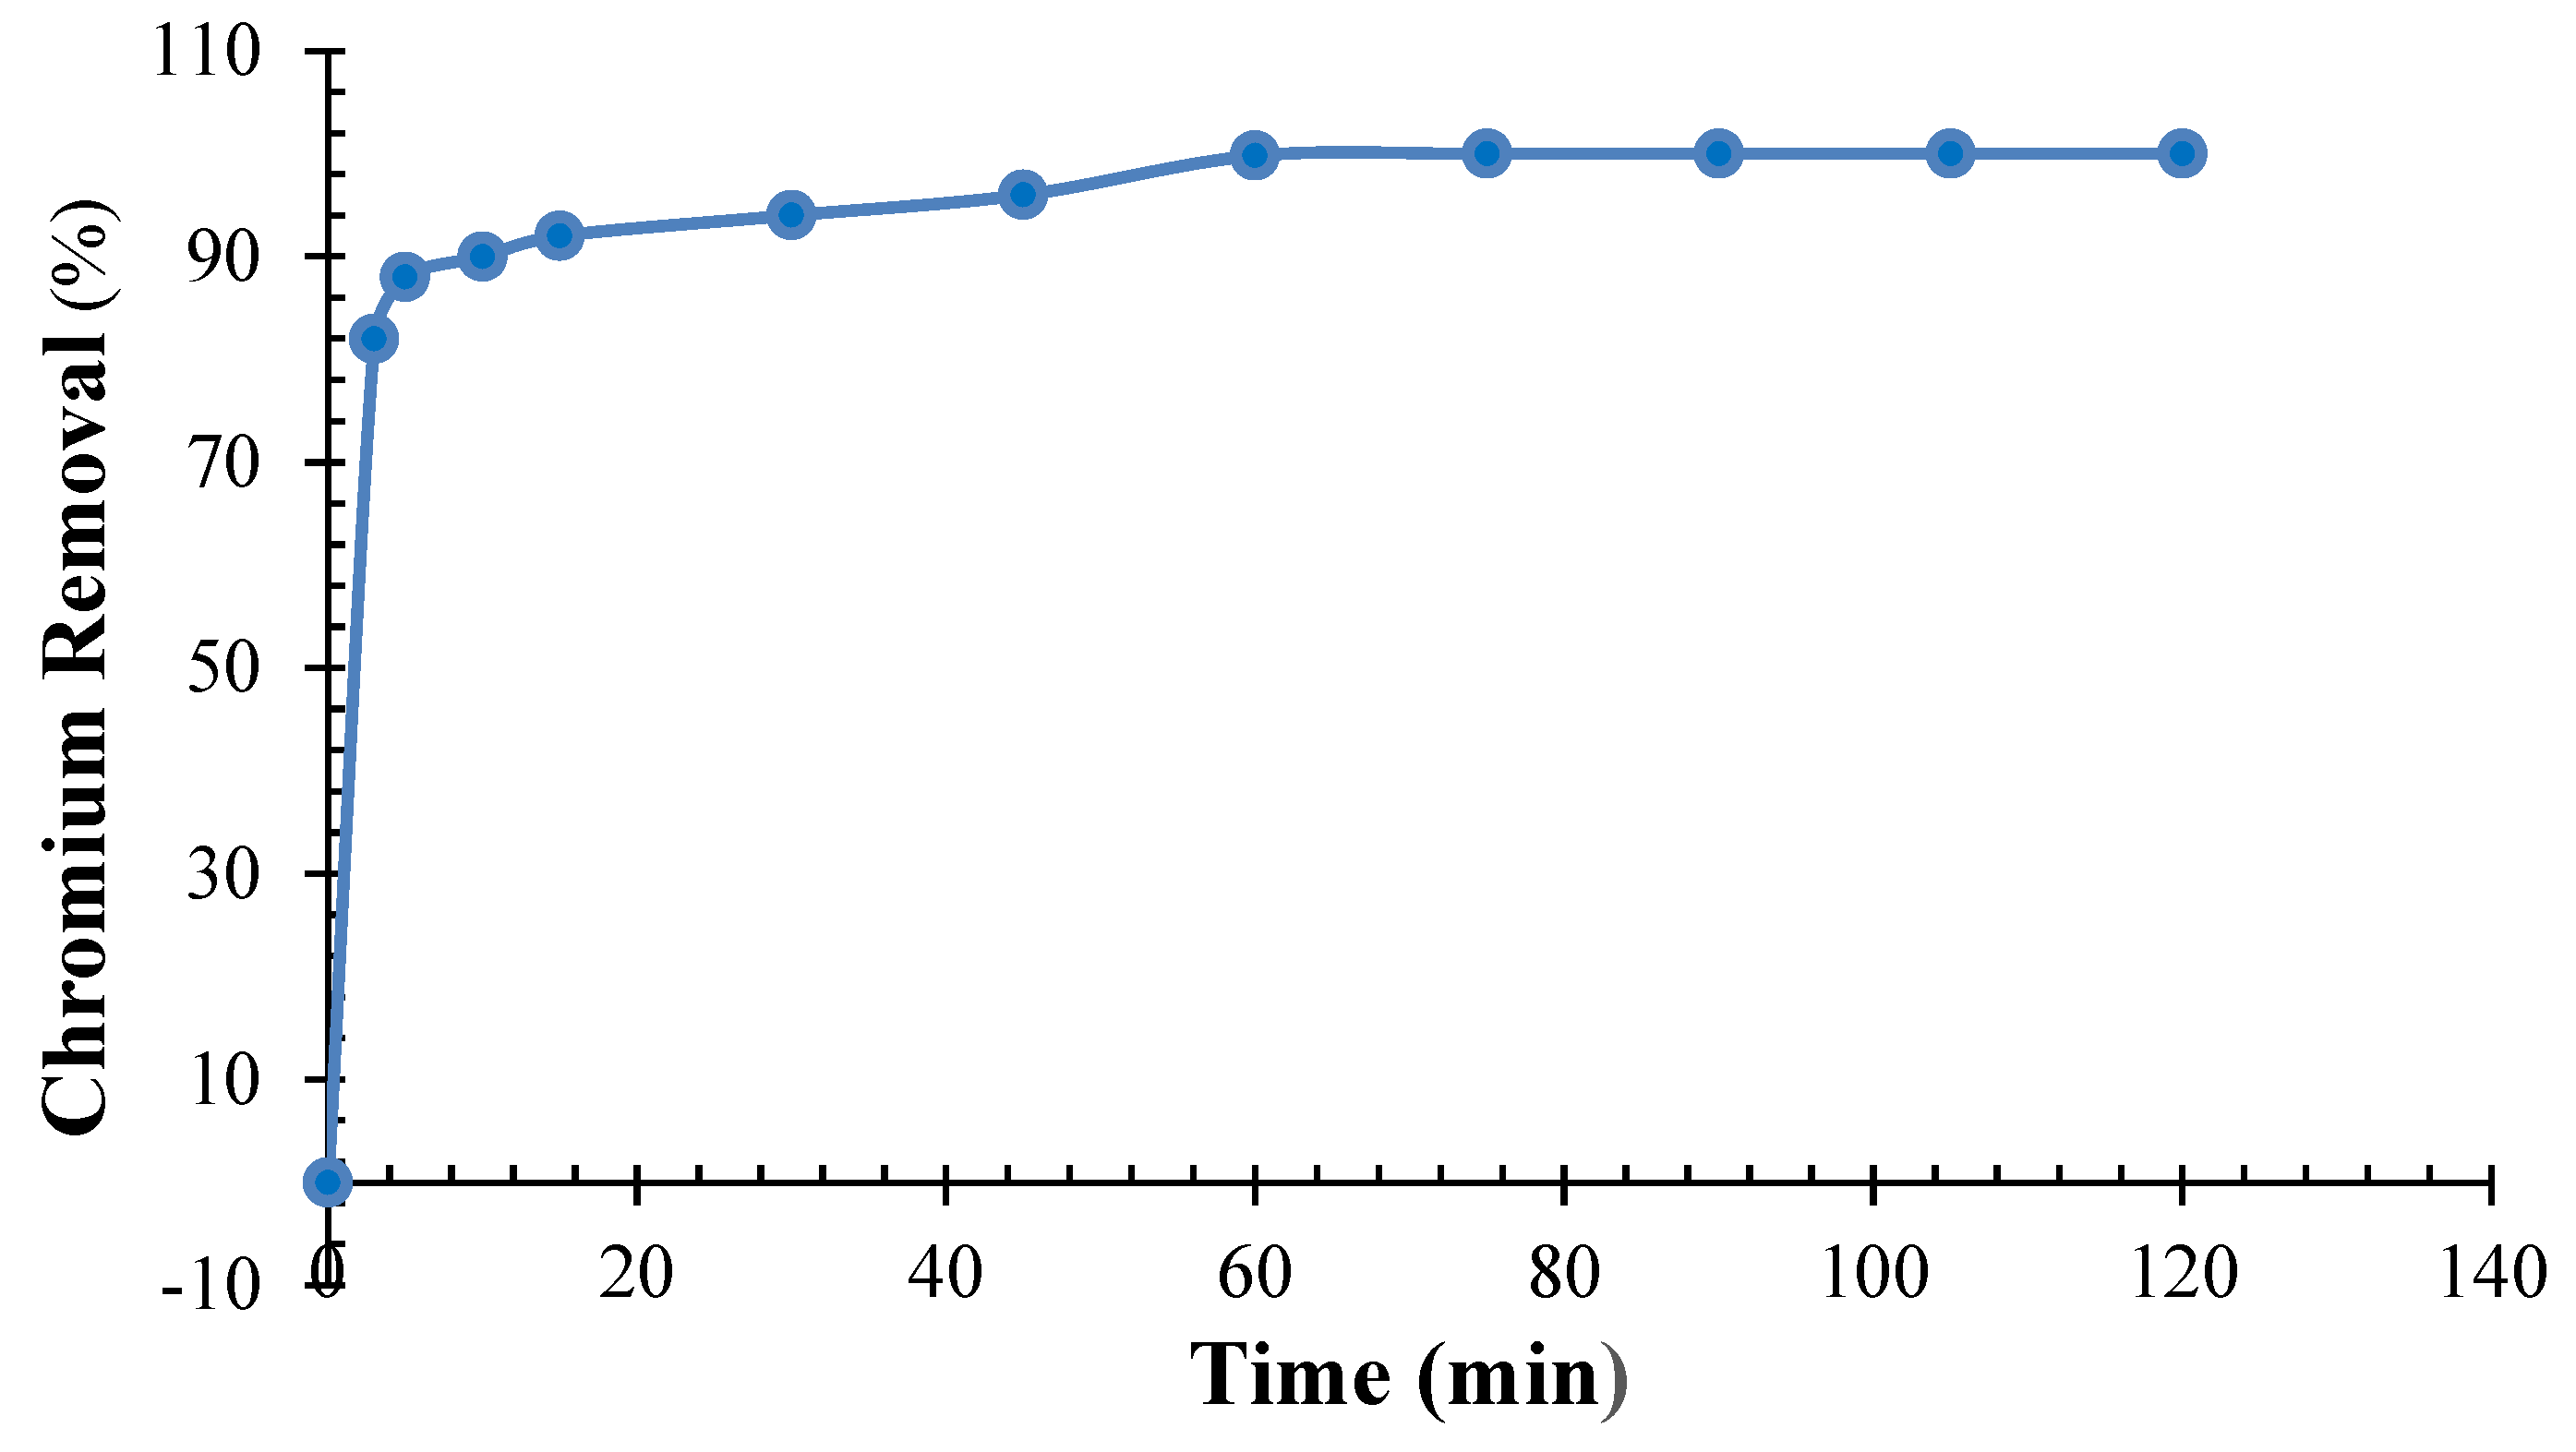
3.5. Impact of Chromium Kinetics onto QDPW
In this study, parameters for contact time were assessed (Figure 11) that delineate the influence of contact duration on chromium removal efficiency, maintaining a constant QDPW (4 g/L), pH (6.5 ± 0.2), and concentration (25 mg/L). A direct relationship was observed between contact time and chromium removal rate. However, this direct proportionality diminished at equilibrium, as evidenced by the percentage removal of chromium. An examination of Figure 11 reveals three distinct phases in the chromium removal process. The initial phase (0–5 min) was sharp in which the adsorbent rapidly sequestered chromium ions, particularly at a pH of 6.5 ± 0.2. Secondly, during the intermediate period, the rate of chromium removal decelerated. This slowdown is indicative of the saturation of active sites on the QDPW’s surface, signaling the impending approach to equilibrium [15,18,22]. Finally, the equilibrium phase commenced approximately 60 min into the process. This phase exhibited minimal chromium uptake, culminating in a cumulative removal efficiency of almost 100%.
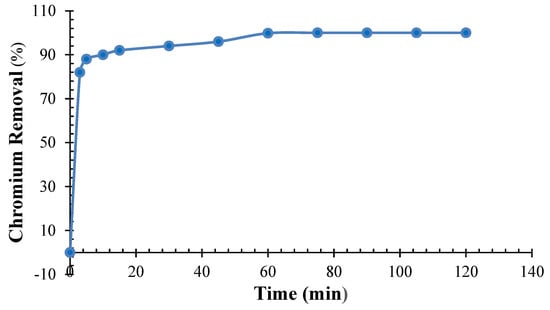
Figure 11.
Evaluation of contact duration for chromium adsorption onto QDPW (Chromium concentration = 25 mg/L, pH = 6.5 ± 0.2, QDPW = 4 g/L).
3.6. Kinetics Dynamics of Chromium onto QDPW
3.6.1. Pseudo-Order Kinetic Dynamics
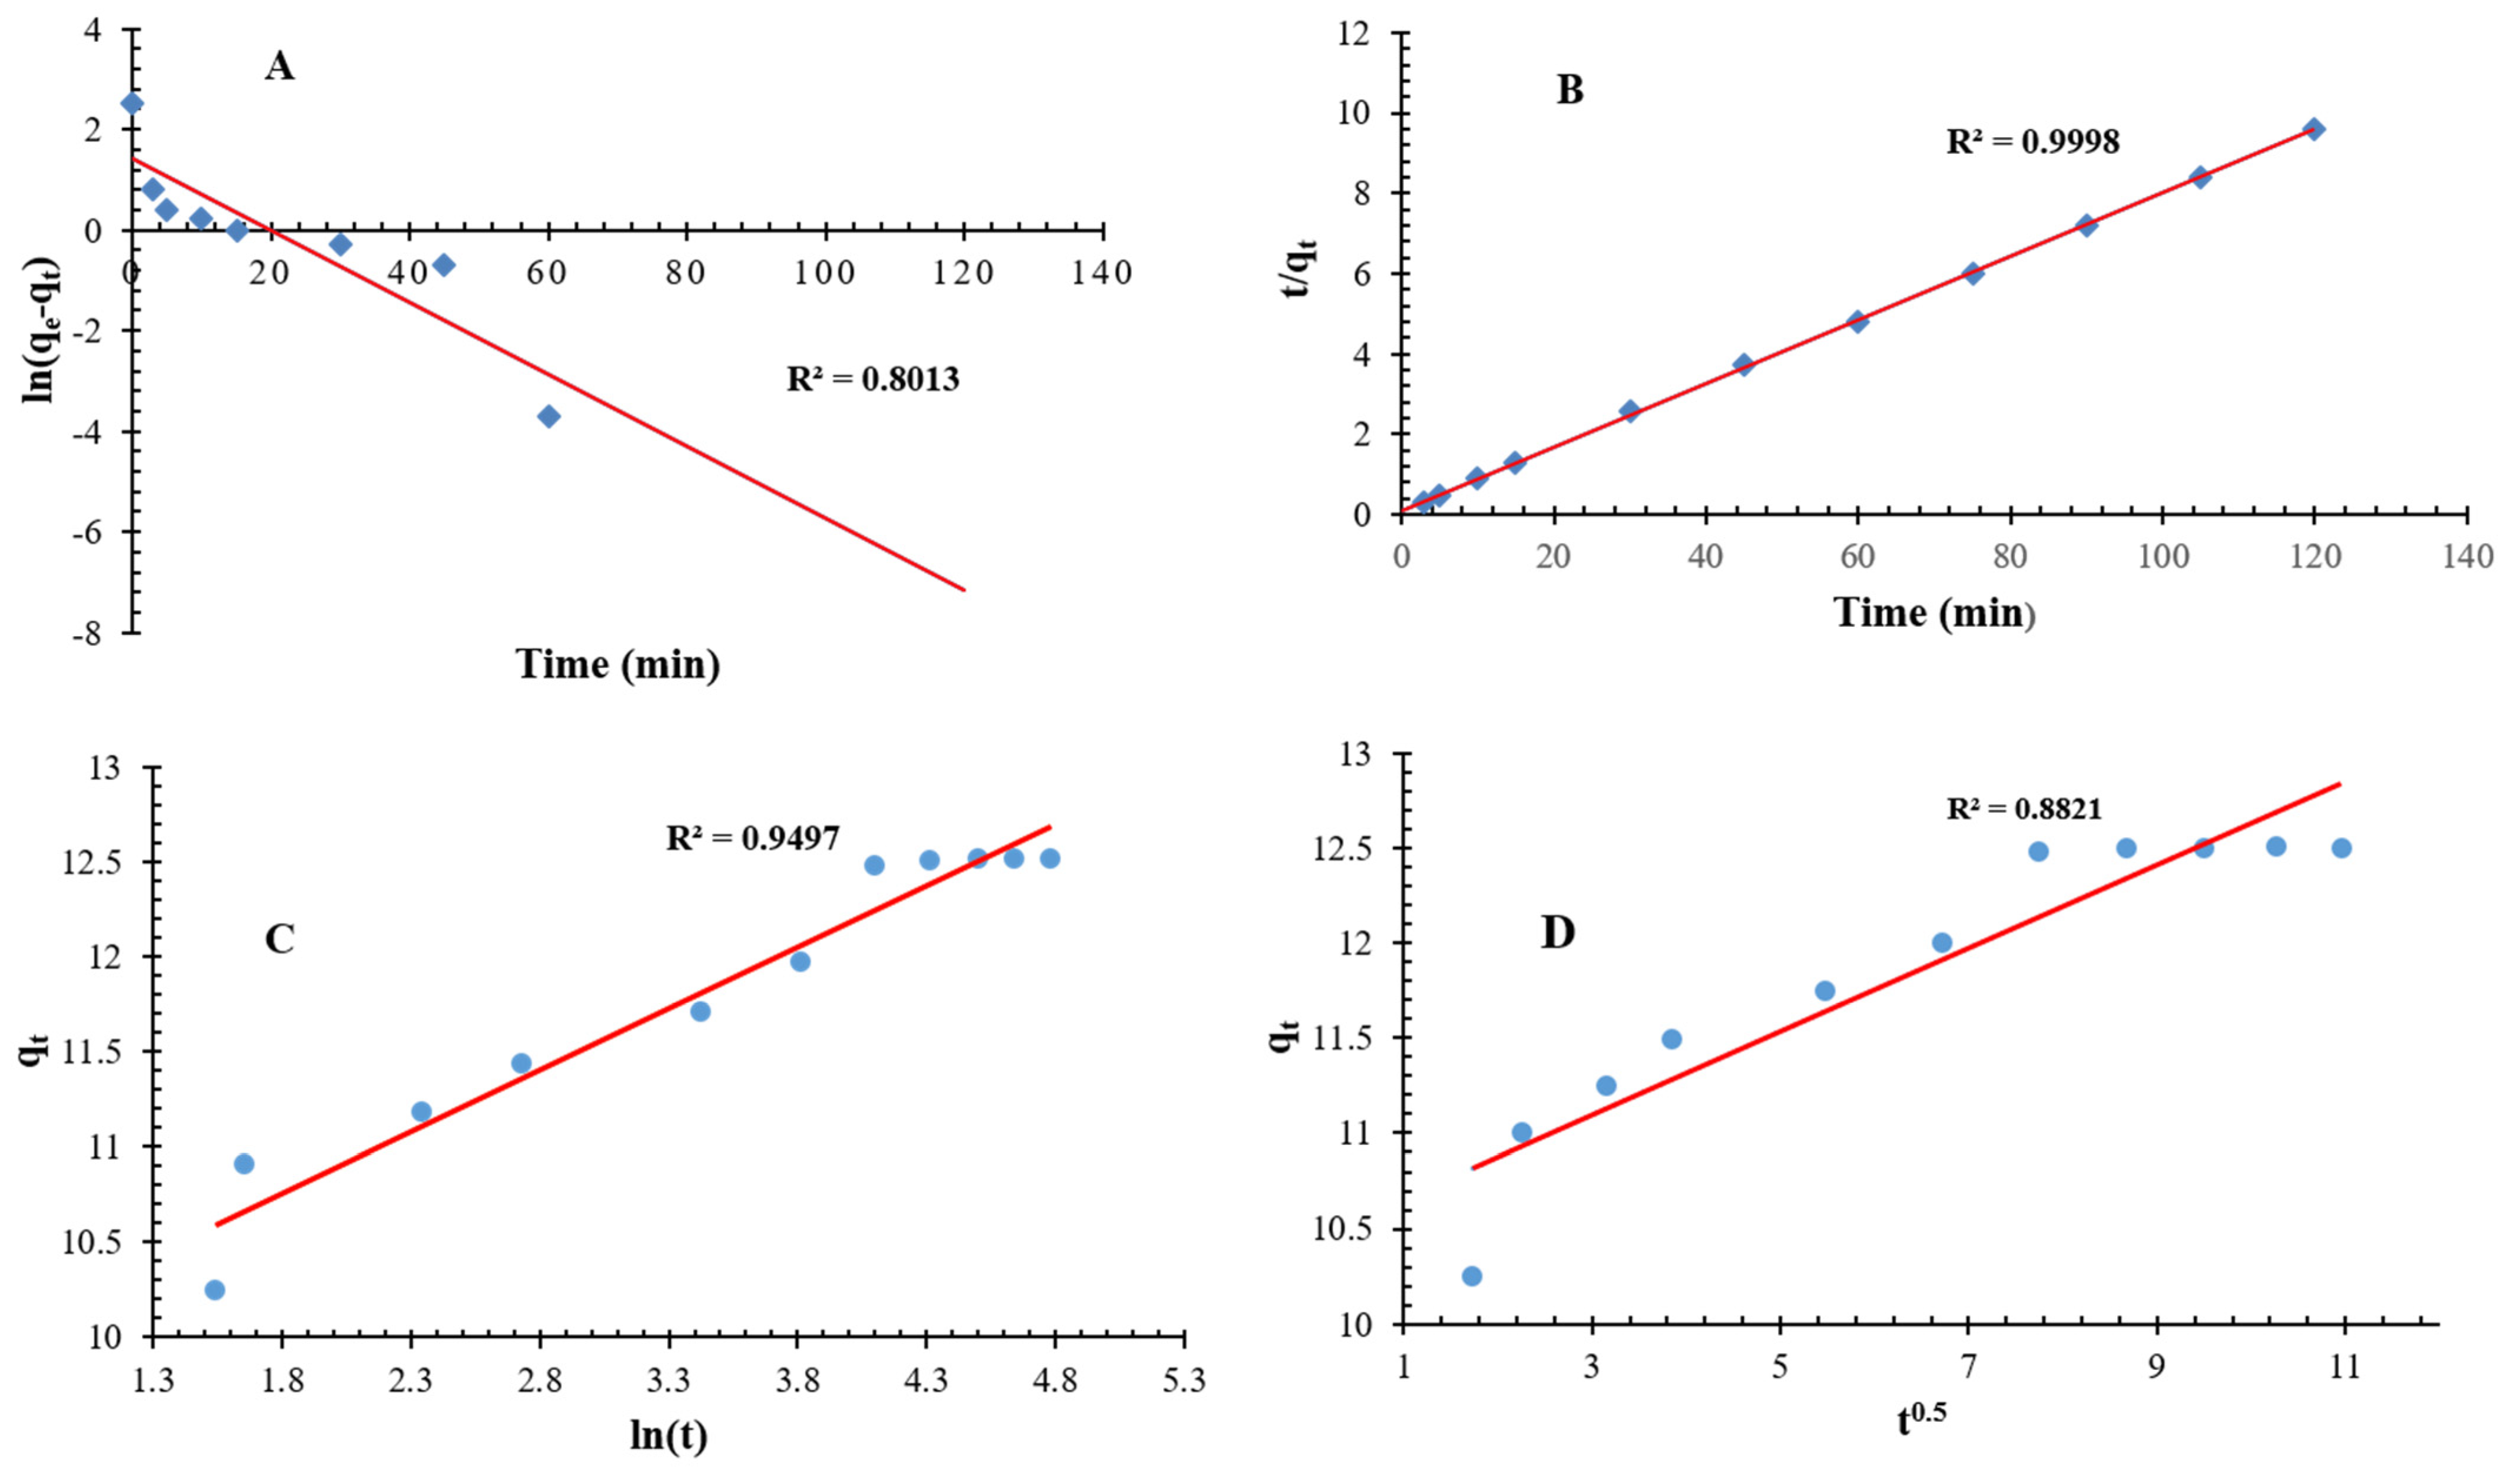
The kinetic data observed in contact study was fitted into pseudo-first and pseudo-second-order kinetic models to summarize adsorption reactions.
The value of K1 is 0.1829 m−1, and the quantity of qe is measured to be 0.403 mg/g. The R2 value observed is 0.801, which can be considered moderate and indicates that the model is capable of representing the adsorption process to a certain extent, although it may not be entirely fit (Table 5 and Figure 12). On the other hand, the value of K2 is determined to be 0.0611 g/mg-min, whereas the quantity qe (Equilibrium adsorption capacity of chromium) is measured to be 12.64 mg/g which is close experimental value (12.5 mg/g). The R2 value of 0.999 indicates a strong correlation between the model and the experimental data, suggesting a high level of accuracy in the fit (Table 5 and Figure 12). This observation suggests that the adsorption mechanism on QDPW is predominantly based on chemisorption. Moreover, the pseudo-second-order model is frequently observed to yield a more accurate representation of adsorption data compared to the pseudo-first-order model, particularly when the entire adsorption process encompassing the initial stages up to equilibrium, is considered. Hence, in terms of the coefficient of determination (R2 value), the pseudo-second-order model demonstrates a superior level of fit to the data when compared to the pseudo-first-order model. This observation implies that the step that controls the rate of the reaction may potentially be the chemisorption process, which entails the involvement of two or more species in the adsorption phenomenon [18,19].
Table 5.
Parameters of kinetic models for the adsorption of chromium on QDPW (Maximum experimental adsorption capacity at time “t”) = 12.5 mg/g).
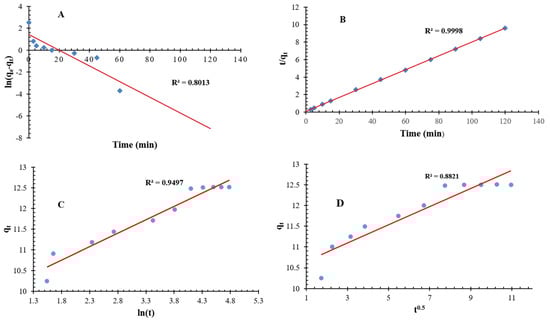
Figure 12.
Presentation of linearized curves of Kinetic models, (A) Pseudo-first-order, (B) Pseudo-second order, (C) Elovich model, (D) Intra-particle Diffusion Model.
3.6.2. Elovich Kinetic Model
The Elovich equation (Equation (3)) is employed to observe chemisorption phenomena occurring between adsorbate and heterogeneous surfaces in kinetic dynamics. The initial adsorption rate (α) was found to be 0.455 mg/g·min, and the desorption constant β is equal to 1.701 g/mg (Table 5 and Figure 12). In the present study, the obtained α value exhibits a considerable magnitude, suggesting a potentially swift initial adsorption process of chromium. The β parameter, commonly known as the desorption constant, is associated with the degree of surface covering and the activation energy involved in chemisorption. Within our dataset, it can be observed that the β value exhibits a significantly reduced magnitude. This finding possibly indicates that the desorption phenomenon exerts a limited influence on the entire process, hence, facilitating the retention of chromium ions subsequent to their binding by adsorption.
3.6.3. Intra-Particle Diffusion Model
The intra-particle diffusion rate constant, denoted as ki, is determined to be 0.136 mg/g·min0.5 (Table 5 and Figure 12). The thickness of the boundary layer, denoted as C, is measured to be 4.85 mg/g. The utilization of the intra-particle diffusion model facilitates the identification of the step that imposes the greatest limitation on the rate of the adsorption process. If the plot of the adsorption capacity (qt) against the square root of time (t0.5) intersects the origin, it suggests that the process of intra-particle diffusion is the only factor that limits the rate of the reaction. Nevertheless, it is worth noting that this study revealed a substantial y-intercept (C value-4.85 mg/g) in the plot, indicating that additional factors influence the rate of adsorption beyond the sole influence of intra-particle diffusion. The parameter ki provides insight into the rate at which intra-particle diffusion occurs and the result found in our study is indicative of a modest level of intra-particle diffusion.
In short, based on the observed kinetic data in different models, it can be established that the pseudo-second-order and Elovich models have the most substantial R2 values, indicating that the adsorption process on QDPW is dominantly chemisorption in nature but it possesses a complex nature, potentially including numerous phases or mechanisms. The pseudo-second-order model demonstrates a comparable equilibrium adsorption capacity compared to pseudo-first-order model, hence suggesting a greater potential for adsorption and reinforcing its overall validity. The relatively low coefficient of determination (R2) shown for the Intra-Particle Diffusion Model implies that although intra-particle diffusion may contribute to the adsorption process, some likely additional processes or mechanisms exert greater control over the overall rate of the process. Various systems may be concurrently operating, and it is unlikely that any singular model can encompass all the complexities [8,9].
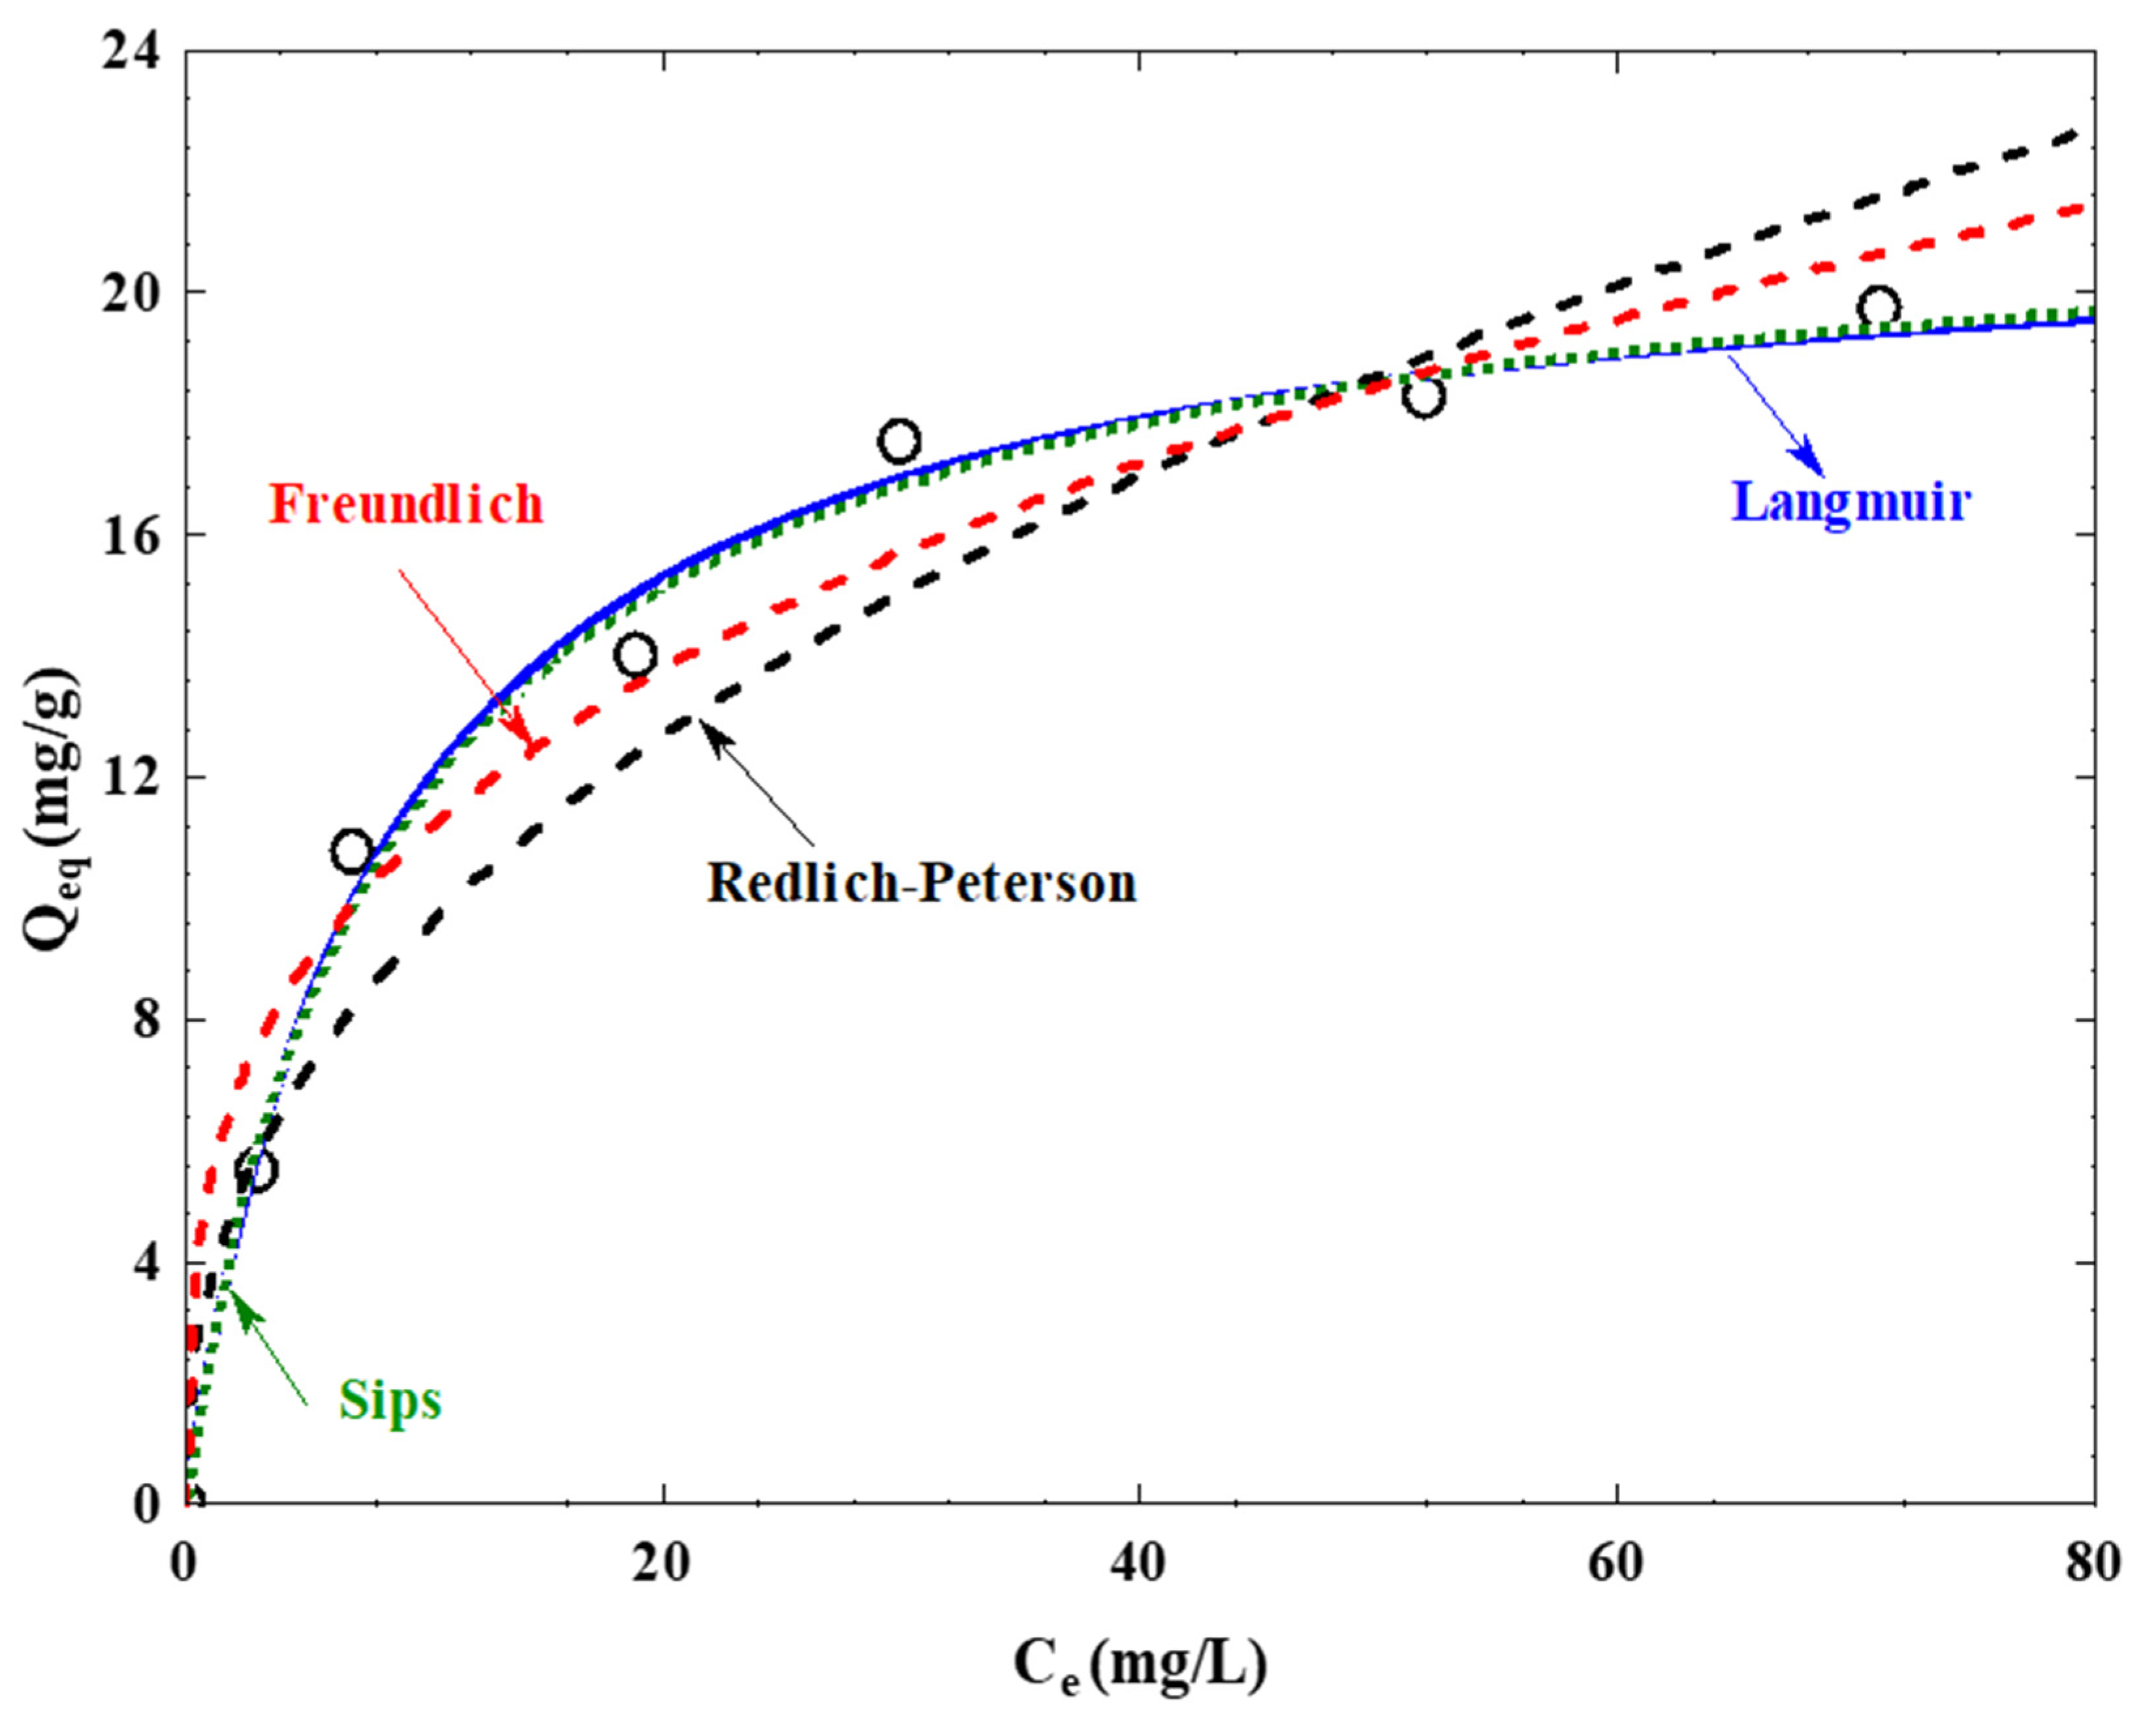
3.7. Analysis of Adsorption Isotherms
The observed adsorption data was fitted into isotherm models, including Langmuir, Freundlich, Redlich–Peterson, and Sips’ models using Equations (7)–(10), respectively.
Table 6 and Figure 13 present Langmuir isotherm constants and other parameters. A greater magnitude of the KL parameter signifies a more robust adsorption bond. In the present study, the KL value of 8.91 indicates a substantial level of interaction between the adsorbate and adsorbent. The observed maximum adsorption capacity of 22.22 mg/g indicates that it represents the point of saturation, beyond which further adsorption on the surface of the adsorbent is no longer possible.
Table 6.
Parameters and isotherm constants for adsorption of chromium onto QDPW (Maximum experimental adsorption capacity at equilibrium = 19.75 mg/g).
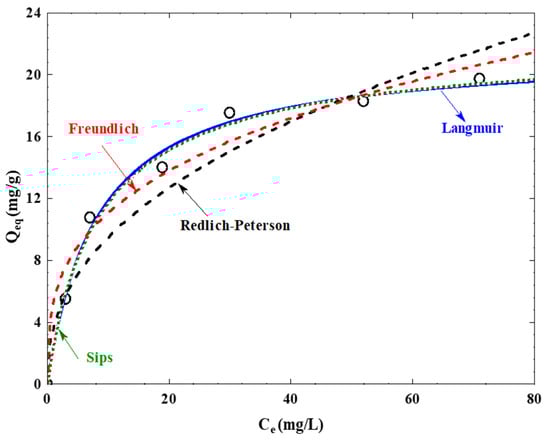
Figure 13.
Presentation of adsorption isotherm models for Cr6+ onto QDPW (T = 30 ± 0.2 °C, pH = 6.5 ± 0.2 and QDPW dosage = 4 g/L).
Freundlich isotherm constants and other parameters reveal that the R2 is 0.923 and the numerical value of n is 3.145, providing insight into the degree of favorability exhibited by the adsorption process (Table 6). The value of n is greater than 1, which demonstrates that the degree of surface heterogeneity is higher on the QDPW (Table 6). The variable KF is 4.30 mg/g; this numerical value signifies increased absorption capability.
The Redlich–Peterson isotherm principle (Equation (9) is a blend of the Langmuir and Freundlich isotherm principles [9]. In the present study, the value of g is observed to be close to 1 (0.952), indicating a resemblance in the system’s behavior to that of a Langmuir system. The values of AR, a Redlich-Peterson constant is 2.95 mg/g, and BR, an exponent that should lie between 0 and 1 is 0.153 L/mg, provide valuable insights into the adsorption capacity and intensity, respectively (Table 6 and Figure 13).
The fitting of adsorption by the Sips model is conducted by employing Equation (10), which reveals that the isotherm reduces to the Langmuir isotherm because the value of B is observed to be 0.931, suggesting that the system has tendencies similar to the Langmuir system but with some degree of heterogeneity. QS represents the maximum adsorption capacity, similar to Q0 in the Langmuir isotherm and Sips, and it is found to be 22.22 mg/g and 22.26 mg/g, respectively. In addition, ks, Sips constant related to adsorption capacity was observed to be 0.131 L/mg (Table 6 and Figure 13).
In summary, the various models, namely Langmuir, Freundlich, Redlich–Peterson, and Sips, exhibited satisfactory conformity with the empirical data. However, determining the most suitable model depends upon particular parameters, understanding the adsorbent and adsorbate characteristics, and a comprehensive evaluation of fit statistics. The utilization of numerous models, as employed in this study, facilitates a complete comprehension of the adsorption process and expedites the validation of outcomes across diverse theoretical frameworks. Subsequently, Langmuir, Redlich–Peterson, and Sips models emerged as more fit than the Freundlich model based on value R2 and RMSE (Table 6). The adsorbent’s surface displays pronounced heterogeneity, facilitating a robust bond between the adsorbate (Chromium) and the QDPW environment, imitating ionic agreements. The Sips isotherm’s value further affirms the heterogeneous nature of the QDPW surface adsorption.
3.8. Column Study for Chromium Sorption onto QDPW
Column studies are imperative in the analysis of adsorption processes. In this research, a column study was carried out in a burette with a diameter of 11 mm. Two initial concentrations of chromium (50 mg/L and 100 mg/L) were selected and then fed through the column at a flow rate of seven milliliters per minute under ambient temperature. The amount of QDPW that was used in this column study was one gram, which was sufficient for the selected diameter, and an analogous amount was used in previous studies [24,33]. In addition, pH values were maintained around neutral (pH = 6.5 ± 0.2). It was observed that the breakthrough point for a solution with a chromium concentration of 100 mg/L occurred significantly more quickly than the point for a solution with a concentration of 50 mg/L (Figure 14). Other researchers have reported similar findings in column sorption using various modified biomaterials [33,34]. On the other hand, the breakthrough curve at both values demonstrates a steeper form for both low and high concentrations. The results of this column investigation provided more evidence that QDPW effectively removes chromium from aqueous solutions. Figure 12 shows that the sorption capacities of QDPW were found to be 30.98 and 51.56 mg/g when treated with solutions containing 50 and 100 mg/L chromium solution, respectively.
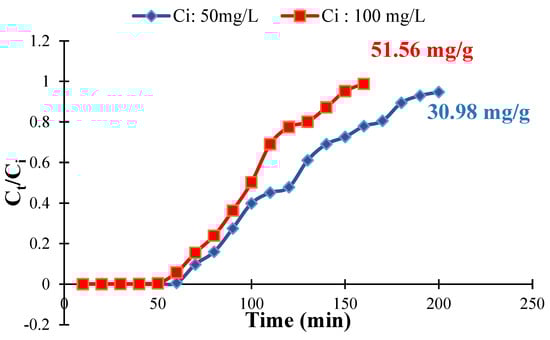
Figure 14.
Breakthrough curve for chromium sorption in column (QDPW = 1 g, pH = 6.5 ± 0.2).
3.9. Regeneration and Reusability of QDPW
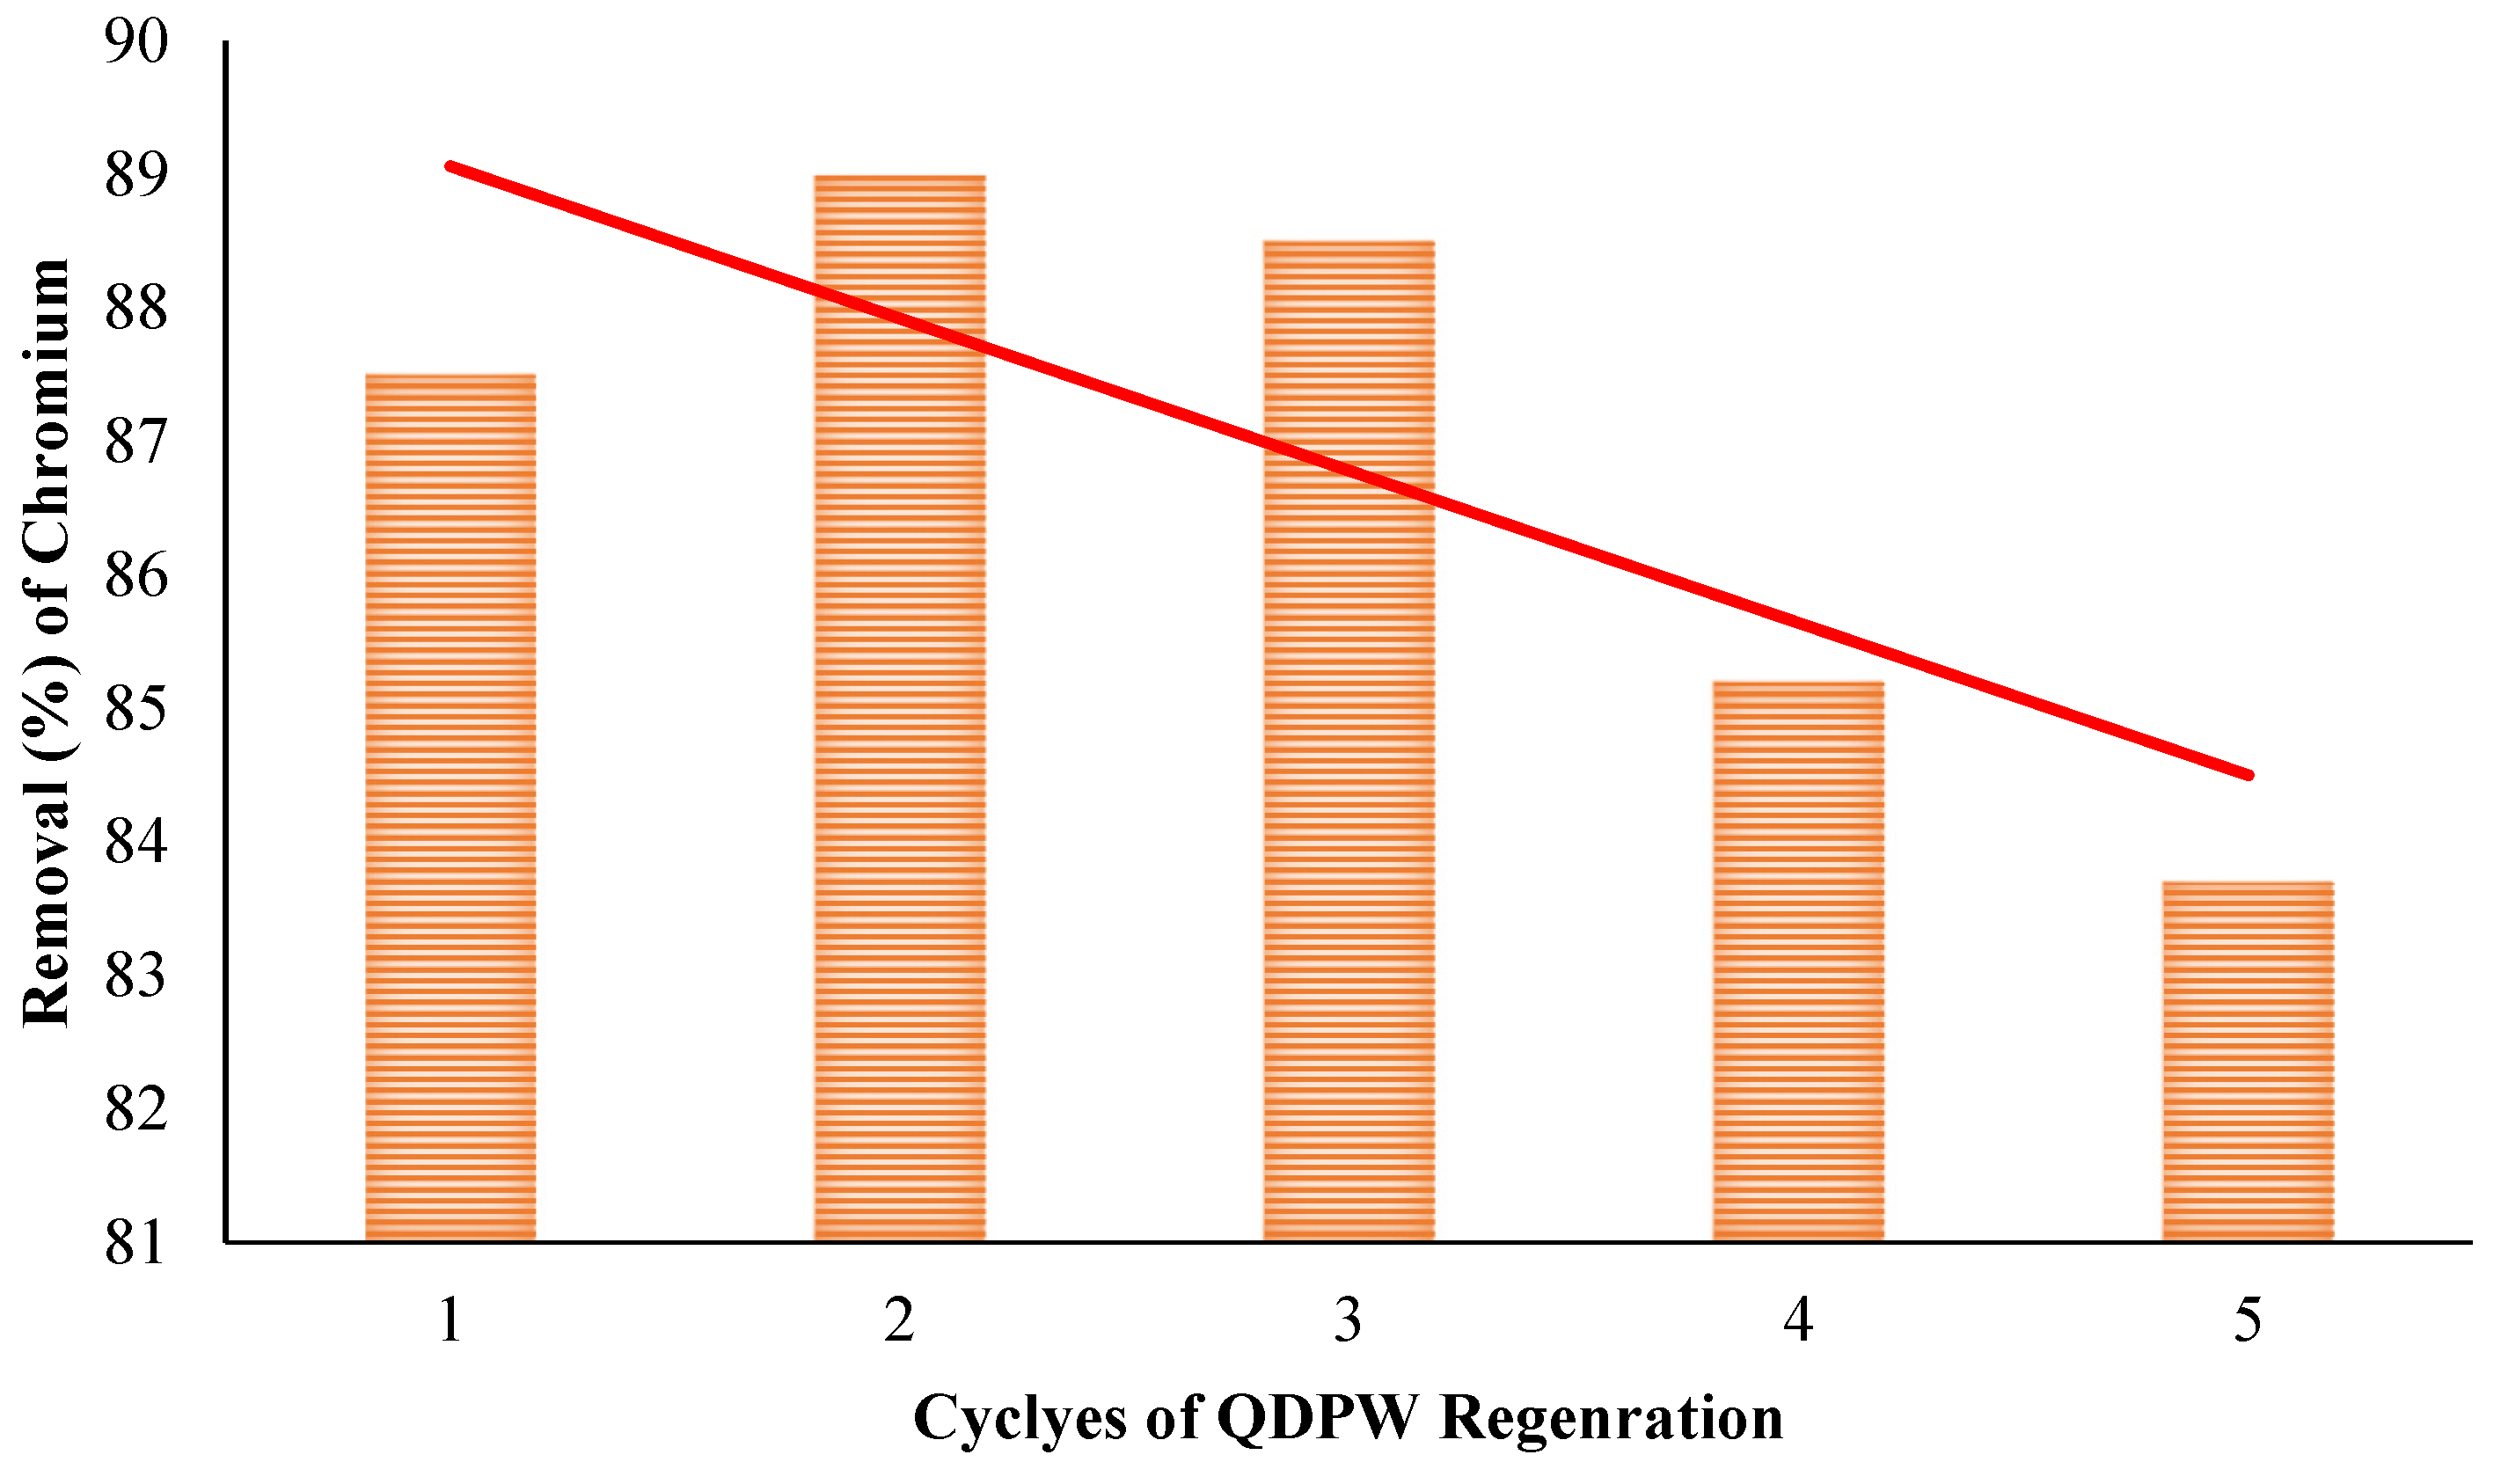
In maintaining economic viability, it is imperative that the adsorption capacity of an adsorbent is capable of being recovered, hence enabling the material to be reused multiple times. The QDPW was successfully regenerated and subsequently employed for five consecutive treatment cycles, exhibiting a notable capacity for chromium removal that improved with each successive cycle. During the second and third cycles of chromium removal, the QDPW had a chromium removal efficiency of 89%, and 88.5% which was found to be higher than that observed in the first cycle. During the fifth cycle, the removal efficiency was observed to be 83.7% and the system exhibited a retention rate of 95.7% for optimal chromium removal. Figure 15 displays the removal effectiveness of regenerated QDPW in each corresponding cycle. The results indicate that the regenerated QDPW exhibited higher effectiveness than the fresh adsorbent for chromium removal in the first two cycles. This suggests a significant ion exchange reaction occurring throughout the regeneration process. The observed phenomenon can be attributed to the partial substitution of hexavalent chromium (Cr6+) ions with chloride (Cl−) ions. Furthermore, it has the potential to eliminate any possible contaminants that may be present in the QDPW. Furthermore, there is a decrease in the concentration of OH−1. The results observed are analogous to phosphorous desorption as reported by Zhao et al. (2010) [35]. Additionally, the marginal decline observed in the fifth cycle could be attributed to the decomposition of assumed active sites that were present on the QDPW.
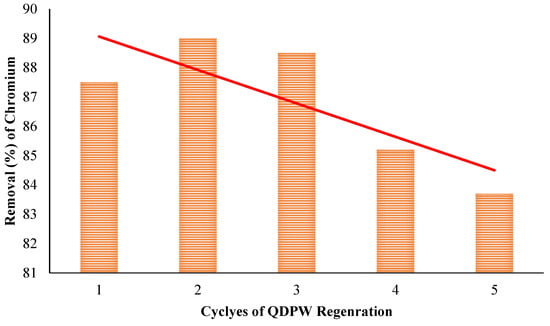
Figure 15.
Regeneration and reuse of QDPW for adsorption of chromium (Chromium concentration = 25 mg/L, pH = 6.5 ± 0.2).
3.10. Comparison Study for Chromium Adsorption
Chromium removal using other adsorbents reported in previous studies has been compared with this research (Table 7) and QPDW was observed better than many other adsorbents. This can be attributed to quaternization of DPW with CHMAC in presence of potassium hydroxide (KOH) which enhanced phenomena of ion exchange.
Table 7.
Efficacy and comparison of reported biomaterial based adsorbents for chromium removal.
4. Conclusions
This research explored the potential applications of QDPW as a promising substitute adsorbent for chromium extraction from aqueous solutions. The empirical results proved the viability of QDPW as a potent adsorbent, particularly for removing hexavalent chromium from liquid mediums. At a pH level of 6.5, QDPW facilitated efficient chromium extraction. The removal efficiency (88%) with a 22.22 mg/g extraction rate was recorded with a 4 g/L dosage, making it the most economical option.
The characterization techniques, including FTIR, SEM/EDX, BET, XRD, and element analysis, showed drastic changes in the structural and surface properties of both DPW and QDPW fibers. In addition, differential thermal analysis (DTA) and thermogravimetric analysis (TGA) of DPW and QDPW revealed radical changes at various stages. In the analysis of the adsorption equilibrium data using various isotherm models, it was evident that the Langmuir, Redlich–Peterson, and Sips models provided the most accurate representation with a coefficient of determination (R2) of 0.989, 0.981, and 0.983, respectively. Based on the value of RMSE (0.6245), which is the lowest among all applied isotherm models, Redlich–Peterson best describes the phenomena. On the other hand, values of g (0.952) and B (0.931) in the Redlich–Peterson and Sips models, respectively, are close to unity, which showed dominance of monolayer adsorption.
Moreover, the kinetics associated with chromium adsorption onto QDPW were most consistent with the pseudo-second-order model’s correlation coefficient, nearing 0.999, signifying the robustness of the adsorption process. This high correlation intimates a dominant role of either an electrostatic attraction or ion exchange in chemisorption phenomena. In addition, the column study also revealed the adsorption capacity of 51.56 mg/g in a continuous flow system which showed its applicability on a commercial scale.
Author Contributions
M.T.B., A.A.K., R.A., M.M.A.D. and I.A. conceived the original idea for the research, led the data analysis process. M.T.B., A.A.K., R.A., M.M.A.D., M.B. and I.A. contributed to the drafting and revising of the manuscript. M.T.B. also supervised the overall research process, providing critical feedback and insights to improve the final manuscript. M.T.B., R.A. and I.A. performed a significant amount of the experimentation, data collection, and analysis for the manuscript. M.B. also contributed to revising the analysis and English editing. All authors have read and agreed to the published version of the manuscript.
Funding
Ministry of Education in Saudi Arabia; project number 223202 (IF-JU-2-070).
Data Availability Statement
Data are contained within the article.
Acknowledgments
The authors extend their appreciation to the Deputyship for Research & Innovation, Ministry of Education in Saudi Arabia for funding this research work through the project number 223202 (IF-JU-2-070).
Conflicts of Interest
The authors declare no conflicts of interest.
References
- Cheng, W.; Ding, C.; Wang, X.; Wu, Z.; Sun, Y.; Yu, S.; Hayat, T.; Wang, X. Competitive Sorption of As (V) and Cr (VI) on Carbonaceous Nanofibers. Chem. Eng. J. 2016, 293, 311–318. [Google Scholar] [CrossRef]
- Shang, J.; Zong, M.; Yu, Y.; Kong, X.; Du, Q.; Liao, Q. Removal of Chromium (VI) from Water Using Nanoscale Zerovalent Iron Particles Supported on Herb-Residue Biochar. J. Environ. Manag. 2017, 197, 331–337. [Google Scholar] [CrossRef]
- Zou, H.; Zhao, J.; He, F.; Zhong, Z.; Huang, J.; Zheng, Y.; Zhang, Y.; Yang, Y.; Yu, F.; Bashir, M.A.; et al. Ball Milling Biochar Iron Oxide Composites for the Removal of Chromium (Cr (VI)) from Water: Performance and Mechanisms. J. Hazard. Mater. 2021, 413, 125252. [Google Scholar] [CrossRef]
- Atieh, M.A. Removal of Chromium (VI) from Polluted Water Using Carbon Nanotubes Supported with Activated Carbon. Procedia Environ. Sci. 2011, 4, 281–293. [Google Scholar] [CrossRef]
- Karimi-Maleh, H.; Ayati, A.; Ghanbari, S.; Orooji, Y.; Tanhaei, B.; Karimi, F.; Alizadeh, M.; Rouhi, J.; Fu, L.; Sillanpää, M. Recent Advances in Removal Techniques of Cr (VI) Toxic Ion from Aqueous Solution: A Comprehensive Review. J. Mol. Liq. 2021, 329, 115062. [Google Scholar] [CrossRef]
- WHO. Guidelines for Drinking-Water Quality, 4th ed.; Incorporating the 1st Addendum; WHO: Geneva, Switzerland, 2017; Available online: https://www.who.int/publications/i/item/9789241549950 (accessed on 2 July 2023).
- Alrowais, R.; Bashir, M.T.; Sikandar, M.A.; Khan, M.A. Synthesis and Performance Evaluation of Olive Fruit Waste Resin for Removal of Fluoride from Aqueous Solution: Batch and Column Modeling. Desalination Water Treat. 2022, 252, 261–275. [Google Scholar] [CrossRef]
- Pipíška, M.; Valica, M.; Partelová, D.; Horník, M.; Lesný, J.; Hostin, S. Removal of Synthetic Dyes by Dried Biomass of Freshwater Moss Vesicularia Dubyana: A Batch Biosorption Study. Environments 2018, 5, 10. [Google Scholar] [CrossRef]
- Bakar, A.H.B.A.; Koay, Y.S.; Ching, Y.C.; Abdullah, L.C.; Choong, T.S.Y.; Alkhatib, M.; Mobarekeh, M.N.; Zahri, N.A.M. Removal of Fluoride Using Quaternized Palm Kernel Shell as Adsorbents: Equilibrium Isotherms and Kinetics Studies. BioResources 2016, 11, 4485–4511. [Google Scholar]
- Geng, J.; Liang, Q.; Yu, W.; Chen, W.; Lu, G.; Luo, H. Enhanced Removal of Cr (VI) from Aqueous Solutions by Polymer-Mediated Nitrogen-Rich Reduced Graphene Oxide. J. Hazard. Mater. 2022, 436, 129184. [Google Scholar] [CrossRef]
- Pakade, V.E.; Tavengwa, N.T.; Madikizela, L.M. Recent Advances in Hexavalent Chromium Removal from Aqueous Solutions by Adsorptive Methods. RSC Adv. 2019, 9, 26142–26164. [Google Scholar] [CrossRef]
- Rehman, I.U.; Zahoor, M.; Bashir, M.T.; Ali, J.; Khan, F.A.; Sher, M. Removal of Cu2+ from Aqueous Solution by Activated Carbon Prepared from Sawdust and Nutshells. Desalination Water Treat. 2018, 126, 171–180. [Google Scholar] [CrossRef]
- Sergeev, V.; Balandinsky, D.; Romanov, G.; Rukin, G. Sorption Treatment of Water from Chromium Using Biochar Material. Arab J. Basic Appl. Sci. 2023, 30, 299–306. [Google Scholar] [CrossRef]
- Rajapaksha, A.U.; Selvasembian, R.; Ashiq, A.; Gunarathne, V.; Ekanayake, A.; Perera, V.O.; Wijesekera, H.; Mia, S.; Ahmad, M.; Vithanage, M.; et al. A Systematic Review on Adsorptive Removal of Hexavalent Chromium from Aqueous Solutions: Recent Advances. Sci. Total Environ. 2022, 809, 152055. [Google Scholar] [CrossRef]
- Bashir, M.; Salmiaton, A.; Idris, A.; Harun, R. Monitoring Kinetic and Thermodynamic Parameters of Fluoride Adsorption from Aqueous Solution by Pks-Based Anion Resins. J. Mech. Eng. Sci. 2018, 12, 3624–3632. [Google Scholar] [CrossRef]
- Low, W.-P.; Lim, W.-J.; Lee, H.-P.; Rahman, N.A. Removal of Copper, Chromium, and Nickel Ions from Aqueous Solution by Using Different Pre-Treated Orange Peel. In Proceedings of the IOP Conference Series: Earth and Environmental Science; IOP Publishing: Bristol, UK, 2023; Volume 1205, p. 12013. [Google Scholar]
- Bhatnagar, A.; Kumar, E.; Sillanpää, M. Fluoride Removal from Water by Adsorption—A Review. Chem. Eng. J. 2011, 171, 811–840. [Google Scholar] [CrossRef]
- Yadav, A.K.; Abbassi, R.; Gupta, A.; Dadashzadeh, M. Removal of Fluoride from Aqueous Solution and Groundwater by Wheat Straw, Sawdust and Activated Bagasse Carbon of Sugarcane. Ecol. Eng. 2013, 52, 211–218. [Google Scholar] [CrossRef]
- Bashir, M.T.; Ali, S.; Idris, A.; Harun, R. Kinetic and Thermodynamic Study of Nitrate Adsorption from Aqueous Solution by Lignocellulose-Based Anion Resins. Desalination Water Treat. 2017, 62, 20136. [Google Scholar] [CrossRef]
- Marshall, W.E.; Wartelle, L.H. An Anion Exchange Resin from Soybean Hulls. Journal of Chemical Technology & Biotechnology: International Research in Process. Environ. Clean Technol. 2004, 79, 1286–1292. [Google Scholar]
- de Lima, A.C.A.; Nascimento, R.F.; de Sousa, F.F.; Josue Filho, M.; Oliveira, A.C. Modified Coconut Shell Fibers: A Green and Economical Sorbent for the Removal of Anions from Aqueous Solutions. Chem. Eng. J. 2012, 185, 274–284. [Google Scholar] [CrossRef]
- Bashir, M.; Salmiaton, A.; Nourouzi, M.; Azni, I.; Harun, R. Fluoride Removal by Chemical Modification of Palm Kernel Shell-Based Adsorbent: A Novel Agricultural Waste Utilization Approach. Asian J. Microbiol. Biotechnol. Environ. Sci. 2015, 17, 533–542. [Google Scholar] [CrossRef]
- Alrowais, R.; Bashir, M.T.; Sikandar, M.A.; Khan, M.H.; Alwushayh, B.; Ghazy, A.; Uddin, A.; Iqbal, J. Synthesis and Characterization of Nanometal Oxide-Biochar Derived from Date Palm Waste for Adsorption of Manganese and Iron from Contaminated Water. Water 2023, 15, 3603. [Google Scholar] [CrossRef]
- Bashir, M.T. Nitrate and Fluoride Adsorption from Aqueous Solution by Chemically Modified Palm Kernel Shells; Universiti Putra Malaysia: Serdang, Malaysia, 2016. [Google Scholar]
- Weber Jr, W.J.; Morris, J.C. Kinetics of Adsorption on Carbon from Solution. J. Sanit. Eng. Div. 1963, 89, 31–59. [Google Scholar] [CrossRef]
- Ho, Y.-S. Second-Order Kinetic Model for the Sorption of Cadmium onto Tree Fern: A Comparison of Linear and Non-Linear Methods. Water Res. 2006, 40, 119–125. [Google Scholar] [CrossRef]
- Daffalla, S. Adsorption of Chromium (VI) from Aqueous Solution Using Palm Leaf-Derived Biochar: Kinetic and Isothermal Studies. Separations 2023, 10, 260. [Google Scholar] [CrossRef]
- Olalekan, A.P.; Olatunya, A.; Ekiti, A.; Dada, A.O. Langmuir, Freundlich, Temkin and Dubinin—Radushkevich Isotherms Studies of Equilibrium Sorption of Zn2+ Unto Phosphoric Acid Modified Rice Husk. IOSR J. Appl. Chem. 2012, 3, 38–45. [Google Scholar] [CrossRef]
- Singha, B.; Naiya, T.K.; Bhattacharya, A.K.; Das, S.K.; Ftir, K.; Vi, C.; Straw, R.; Roots, H.; Dust, S. Cr (VI) Ions Removal from Aqueous Solutions Using Natural Adsorbents–FTIR Studies. J. Environ. Prot. 2011, 2, 729–735. [Google Scholar] [CrossRef]
- Miretzky, P.; Cirelli, A.F. Cr (VI) and Cr (III) Removal from Aqueous Solution by Raw and Modified Lignocellulosic Materials: A Review. J. Hazard. Mater. 2010, 180, 1–19. [Google Scholar] [CrossRef]
- Xu, X.; Gao, B.-Y.; Tan, X.; Yue, Q.-Y.; Zhong, Q.-Q.; Li, Q. Characteristics of Amine-Crosslinked Wheat Straw and Its Adsorption Mechanisms for Phosphate and Chromium (VI) Removal from Aqueous Solution. Carbohydr. Polym. 2011, 84, 1054–1060. [Google Scholar] [CrossRef]
- Xu, Y.; Chen, J.; Chen, R.; Yu, P.; Guo, S.; Wang, X. Adsorption and Reduction of Chromium (VI) from Aqueous Solution Using Polypyrrole/Calcium Rectorite Composite Adsorbent. Water Res. 2019, 160, 148–157. [Google Scholar] [CrossRef]
- Keränen, A.; Leiviskä, T.; Hormi, O.; Tanskanen, J. Removal of Nitrate by Modified Pine Sawdust: Effects of Temperature and Co-Existing Anions. J. Environ. Manag. 2015, 147, 46–54. [Google Scholar] [CrossRef]
- Zhang, M.; Gao, B.; Yao, Y.; Xue, Y.; Inyang, M. Synthesis of Porous MgO-Biochar Nanocomposites for Removal of Phosphate and Nitrate from Aqueous Solutions. Chem. Eng. J. 2012, 210, 26–32. [Google Scholar] [CrossRef]
- Zhao, Y.; Yue, Q.; Li, Q.; Gao, B.; Han, S.; Yu, H. The Regeneration Characteristics of Various Red Mud Granular Adsorbents (RMGA) for Phosphate Removal Using Different Desorption Reagents. J. Hazard. Mater. 2010, 182, 309–316. [Google Scholar] [CrossRef]
- Chandana, L.; Krushnamurty, K.; Suryakala, D.; Subrahmanyam, C. Low-Cost Adsorbent Derived from the Coconut Shell for the Removal of Hexavalent Chromium from Aqueous Medium. Mater. Today Proc. 2020, 26, 44–51. [Google Scholar] [CrossRef]
- López-Téllez, G.; Barrera-Díaz, C.E.; Balderas-Hernández, P.; Roa-Morales, G.; Bilyeu, B. Removal of Hexavalent Chromium in Aquatic Solutions by Iron Nanoparticles Embedded in Orange Peel Pith. Chem. Eng. J. 2011, 173, 480–485. [Google Scholar] [CrossRef]
- Kar, S.; Equeenuddin, S.M. Adsorption of Hexavalent Chromium Using Natural Goethite: Isotherm, Thermodynamic and Kinetic Study. J. Geol. Soc. India 2019, 93, 285–292. [Google Scholar] [CrossRef]
- Espinoza-Sanchez, M.A.; Arevalo-Nino, K.; Quintero-Zapata, I.; Castro-Gonzalez, I.; Almaguer-Cantu, V. Cr (VI) Adsorption from Aqueous Solution by Fungal Bioremediation Based Using Rhizopus sp. J. Environ. Manag. 2019, 251, 109595. [Google Scholar] [CrossRef]
- Niam, A.C.; Fenelon, E.; Ningsih, E.; Mirzayanti, Y.W.; Kristanti, E. High-Efficiency Adsorption of Hexavalent Chromium from Aqueous Solution by Samanea Saman Activated Carbon. Adsorpt. Sci. Technol. 2022, 2022, 8960379. [Google Scholar] [CrossRef]
- Tripathy, S.; Sahu, S.; Patel, R.K.; Panda, R.B.; Kar, P.K. Efficient Removal of Cr (VI) by Polyaniline Modified Biochar from Date (Phoenix Dactylifera) Seed. Groundw. Sustain. Dev. 2021, 15, 100653. [Google Scholar] [CrossRef]
- Gupta, G.K.; Mondal, M.K. Mechanism of Cr (VI) Uptake onto Sagwan Sawdust Derived Biochar and Statistical Optimization via Response Surface Methodology. Biomass Convers. Biorefinery 2023, 13, 709–725. [Google Scholar] [CrossRef]
- Sallau, A.B.; Aliyu, S.; Ukuwa, S. Biosorption of Chromium (VI) from Aqueous Solution by Corn Cob Powder. Int. J. Environ. Bioenergy 2012, 4, 131–140. [Google Scholar]


Disclaimer/Publisher’s Note: The statements, opinions and data contained in all publications are solely those of the individual author(s) and contributor(s) and not of MDPI and/or the editor(s). MDPI and/or the editor(s) disclaim responsibility for any injury to people or property resulting from any ideas, methods, instructions or products referred to in the content. |
© 2024 by the authors. Licensee MDPI, Basel, Switzerland. This article is an open access article distributed under the terms and conditions of the Creative Commons Attribution (CC BY) license (https://creativecommons.org/licenses/by/4.0/).