Abstract
Phosphorus, as a key nutrient, plays an essential role in both algal growth in surface waters and crop development on land. Its presence in inorganic fertilizers is crucial for maximizing crop yields. However, an excessive accumulation of phosphorus in soils can lead to its loss and exacerbate eutrophication in water bodies. This study highlights the complex interplay among phosphorus management, agricultural productivity, and environmental health, particularly in the context of climate change’s influence on sediment transport and water pollution. We focus on the Poyang Lake Basin (PLB) and use a sophisticated process-based phosphorus model to forecast phosphorus load trends from 2020 to 2049. Our predictions indicate a significant increase in the total phosphorus load of the PLB due to the impact of climate change. To address these challenges, we explore a novel strategy combining organic and inorganic phosphorus fertilizers. This approach aims to improve crop yields while reducing non-point source phosphorus pollution through adjusted anthropogenic inputs. Our findings reveal that a synergistic application of these fertilizers, coupled with a controlled use of inorganic phosphate, can reduce its usage by more than 2.5% annually. This method not only contributes to a 2.2% average annual increase in livestock and poultry production but also promotes a 0.6% yearly growth in grain output. Consequently, it effectively diminishes non-point source phosphorus pollution, offering a sustainable solution to the dual challenge of enhancing agricultural productivity and protecting environmental health.
1. Introduction
Today, as the world’s population continues to grow, and is expected to exceed 9 billion in the next 30 years, agriculture is increasingly challenged to secure global grain production [1,2]. China is one of the countries with the largest populations in the world, so it is a huge problem and challenge to provide enough food for a large number of people with limited arable land in China [3]. Therefore, grain producers need to use more phosphate fertilizer to increase crop yield, and this effect is likely to last for a long time [4]. Phosphate fertilizer is an essential element for the growth of plants, and inorganic phosphate fertilizer (IPF) plays a key role in increasing crop yield. In China, the contribution rate of fertilizer to crop yield once peaked at 57% [5]. China’s fertilizer application increased from 8.84 million tons in 1978 to 56.53 million tons in 2018 [6]. As one of the main limiting factors for plant growth in natural ecosystems, phosphorus is usually the most important nutrient in fresh water [7]. The low phosphorus of the soil greatly limits the growth of crops and reduces crop yield [8,9]. Therefore, in the traditional intensive agricultural production mode, phosphate fertilizer needs to be applied to the soil to obtain good crop yield [10,11].
However, this anthropogenic phosphorus input, which is mainly based on the application of agricultural phosphate fertilizer, has significantly changed the phosphorus cycle on the land in the basin, and has led to non-point source pollution of water and soil, increasing the phosphorus loading of rivers and lakes [12,13,14]. At the same time, it has also restricted the further improvement of crop yield, affecting the sustainable development of agriculture. Rao et al. reported that farmers have been highly dependent on fertilizer and chemicals, and that the government should effectively encourage farmers to implement eco-friendly agricultural technology and provide public agricultural technology support [15]. The application of phosphate fertilizer in the upper reaches of the Yongding River basin has been increasing, resulting in a total phosphorus (TP) loss of 900 kg/km2. This trend poses a significant challenge to the sustainability of local agricultural practices, undermining their long-term viability [16]. Therefore, finding a balance between increasing grain production efficiency and preserving the ecological environment is a critical and necessary path for sustainable development in the future.
On the other hand, climate change may also reshape the migration and transport mechanism of phosphorus from soil to water in the basin [12,17], affecting the TP loading of rivers and lakes through changes in water temperature and rainfall. Couture et al. found through a group of chain model studies including the catchment phosphorus model and climate model that future climate change will increase rainfall and runoff, thus transmitting more phosphorus loading to lakes [18]. Fang et al. showed that strong rainfall may aggravate the mobilization of residual nutrients in soil and enhance the input of receiving water through rainfall runoff [19]. Extremely high flow and changes in the size and frequency of floods have reduced the phosphorus retention capacity of rivers and reduced the net loss of phosphorus in rivers under eutrophication conditions [20]. Crossman et al. revealed that changes in rainfall and temperature may lead to a 30% increase in the phosphorus loading of Simcoe Lake. Therefore, the increase in phosphorus was offset by improved agricultural practices [21].
The PLB is a traditional agricultural area in Jiangxi Province, with 1.9 million square kilometers of arable land and a total grain output of nearly 18 million tons. Rice is the main food crop. It has always been one of the major grain-producing areas in China and has assumed an important responsibility for ensuring national grain production [22]. As the population and economy in the basin continue to expand, the prevalent use of IPF and pesticides in the paddy field-dominated agricultural system has resulted in the eutrophication of water bodies and a decline in water quality. This has significantly impacted the environment. Consequently, the issue of sustainable food production has become increasingly critical and warrants urgent attention. In 2011, the average TP content of the Poyang Lake (PL) water body in the wet season was 0.067 mg/L [23]. This level substantially surpasses the threshold for phosphorus-induced eutrophication. [24]. From 2000 to 2012, the per capita rice output of Poyang Lake Wetland decreased significantly, and rice consumption as well as the assurance of grain production also showed a downward trend [22]. To avoid the limitation of the sustainability of grain production in PLB, it is necessary to take effective measures to prevent and control agricultural non-point source pollution of phosphorus. Liu et al. pointed out that TP loss in the planting process was the main factor leading to surface water eutrophication, and put forward three suggestions to reduce TP loss in the planting process, namely the promotion of scientific fertilization technology, the restriction of organophosphorus pesticides, and the promotion of water-saving irrigation technology [25]. Organic fertilizer (OF) has a high phosphorus content and is considered an ideal soil improver to provide phosphorus for crop growth [26]. It can also reduce the use of IPF and pesticides and strengthen the prevention and control of agricultural non-point source pollution. Iqbal et al. found that the combined application of 30% OF and 70% IPF can improve the grain yield of rice by 11% and 17% in the early and late seasons, respectively, through field trial evaluation [27]. Xu et al. revealed that the combined application of semi-IPF and semi-OF can increase crop yield and nutrient absorption compared with the application of full IPF [28]. However, compared with applying IPF, long-term application of OF improves soil quality, but reduces the adsorption strength of soil phosphorus among soil particles, thus increasing the concentration of dissolved phosphorus in soil water, resulting in a higher potential for phosphorus loss [29,30].
In this study, we use a parsimonious catchment-scale dynamic water quality model (SimplyP) (version 0.1), which can simulate daily runoff, suspended sediment (SS), and particulate and dissolved phosphorus, which reduces many unnecessary model parameters to pursue a simpler simulation process but a more appropriate simulation performance [31]. We explored and analyzed the transport mechanism of phosphorus from land to typical rivers of PLB and introduced the climate prediction of the Model for Interdisciplinary Research on Climate (MIROC5) based on the Coupled Model Intercomparison Project Phase 5 (CMIP5) into SimplyP. MIROC5 successfully simulates climate change caused by mean climate, variability, and anthropogenic radiative forcing [32], and it performs well in East Asia’s rainfall and temperature records [12,33]. In recent years, the Chinese government has put forward a series of policies on “reducing fertilizer and increasing efficiency” in terms of the sustainability of future agricultural development and ensuring food production. We flexibly matched them to the anthropogenic phosphorus input in PLB in the future as much as possible through SimplyP. We set up several possible scenarios, explored the characteristics and trends of phosphorus emission in PLB under the background of crop yield increase and climate change, and discussed the feasibility of “reducing fertilizer and increasing efficiency” and “replacing IPF with OF” in comprehensively promoting the treatment of agricultural non-point phosphorus pollution. This study aims to:
- (1)
- identify the spatial distribution characteristics of anthropogenic source phosphorus input intensity in PLB;
- (2)
- identify the impact of climate change on the TP loading of typical rivers in the PLB;
- (3)
- identify the characteristics of phosphorus transport in PLB under the premise of climate change and crop yield increase.
2. Materials and Methods
2.1. Study Area
Poyang Lake is located in the lower reaches of the Yangtze River in the north of Jiangxi Province, China (Figure 1A). It is an important lake with water flow, throughput, and seasonal characteristics in the Yangtze River Basin (YRB). PLB (E: 113°35′–118°29′, N: 24°29′–30°05′, Figure 1C) has an area of 16.22 × 10⁴ km2 [34], accounting for 9% of the total area of the YRB and about 97% of the total area of Jiangxi Province. It includes five important sub-catchments (the Ganjiang Basin (GB), Fuhe Basin (FB), Xinjiang Basin (XinB), Raohe Basin (RB), and Xiushui Basin (XiuB)) and PL, the largest freshwater lake in China [35]. The digital elevation model (DEM) of the basin reveals a substantial elevation gradient, ranging from a peak elevation of 2033 m in the upstream areas to a minimum of approximately 7 m in the downstream plains. (Figure 1C). The land cover types of the whole basin mainly include forests, shrubs, arable land, water areas, and urban areas, with a forest coverage rate of nearly 63%, followed by agricultural land (Figure 1B). PLB is dominated by a humid subtropical climate, with sufficient heat and rainfall, which has some good agricultural production conditions. The average annual temperature in PLB is about 17.5 °C, and the average annual rainfall is about 1600 mm. The rainy season is mainly from April to July, accounting for about 70% of the total annual rainfall [36].
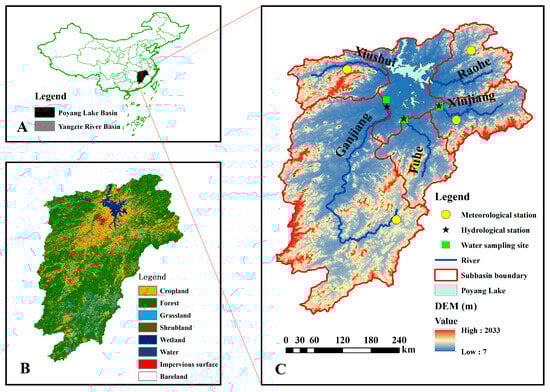
Figure 1.
(A) Location of PLB within the Yangtze River Basin in China; (B) the land cover types in the PLB; and (C) distribution of hydrological, water quality, and meteorological monitoring stations in PLB and display of the Digital Elevation Model.
2.2. Climate Change Scenarios
Hydrological processes on land are mainly controlled by climate, and climate change will affect the transfer process of soil phosphorus from land to rivers. We selected three typical concentration pathways (RCP2.6, RCP4.5, and RCP8.5) in MIROC5 to represent the future GHG emission scenarios. (Supplementary Scenario description of RCP). Then, we compared the extracted data with the historical meteorological data from 2006 to 2018, (Supplementary Figure S1) showing the monthly average changes of temperature, precipitation, and evaporation data predicted by the climate model under the three RCP concentration pathways from 2020 to 2049. In general, only in terms of temperature and precipitation, the annual average predicted data under the three RCP concentration pathways are higher than the annual average of historical observation data, of which RCP8.5 shows the largest annual average change in temperature and the smallest change in precipitation. Afterwards, we will use the data from 2020 to 2049 for future simulations. The temperature and precipitation data were subsequently bias corrected based on monitoring data in the PLB catchment, using the delta change approach [37]. These input data are summarized in the Supplementary Scenario description of RCP.
2.3. Spatial Set-Up of SimplyP and Model Input
We divided five sub-catchments according to the five rivers entering PL and determined the boundary of the sub-catchments according to the hydrological station closest to PL in each sub-catchment. We applied the SimplyP model to three sub-catchments with hydrological and water quality records (GB, FB, and XinB), and each sub-catchment was not further divided into river sections and sub-catchment areas. Then, we determined the appropriate model parameters for each sub-catchment through model calibration and verification. Model parameters of SS and phosphorus modules in GB and XinB were copied to XiuB and RB respectively.
The daily observation data of temperature, precipitation, and evaporation were used to drive the SimplyP hydrological module. We collected the historical data of the five meteorological monitoring stations of Ningdu, Nancheng, Guixi, Wuning, and Qimen in PLB from 2006 to 2018. We also obtained the daily monitoring flow and sediment concentration data of the three hydrological stations of Ganjiang Waizhou, Fuhe Lijiadu, and Xinjiang Meigang. Due to the scarcity of hydrochemical monitoring data, we only obtained monthly average TP concentration data from Ganjiang Shengmi, Fuhe Jiaoshiba, and Xinjiang Meigang water quality monitoring stations.
The period from 2006 to 2010 was regarded as the “warm-up period” of the model to eliminate the initial deviation generated during the operation of the model [12]. The model was calibrated based on the observation data of the hydrological and water quality monitoring station in PLB to fit the flow, sediment, and TP loading from 2011 to 2012, and then validated from 2017 to 2018. We checked the hydrologic modeling performance of the model through runoff and sediment concentration and checked the performance of the model in predicting river phosphorus through river TP loading. It was also necessary to estimate the initial TP of agricultural soil and forest soil (Supplementary Figure S2) and take them as the initial phosphorus value of the model in 2006. In our research, the TP content of the topsoil (0–28.9 cm) was extracted to the agricultural and forest soil of each sub-catchment through ArcGIS10.7 [38], and then the soil mass per square meter (Supplementary Figure S3) was calculated through the bulk density and depth of the topsoil.
Supplementary Figure S8 reveals the comparison between the observed and simulated values of hydrological and water quality data during the whole study period. The model adopts manual calibration instead of an automatic calibration algorithm, which is very time-consuming, and it is doubtful whether better or more robust results can be obtained compared with manual calibration [7]. R2 and the Nash–Sutcliffe efficiency (NSE) coefficient were used to evaluate the simulation performance of SimplyP. The NSE is mostly used to measure the simulation performance of hydrological models. The R2 value ranges from 0 to 1, and a higher value means that the error variance is small. It is generally considered that a value greater than 0.5 is acceptable [39,40,41]. NSE is in the range of −∞ to 1; NSE = 1 means that the modeling and observation values match perfectly; and NSE ≤ 0 means that the model prediction has the same or lower accuracy as the observation average [42]. Generally, NSE > 0.65 is required to be considered an acceptable model performance [43,44]. SimplyP successfully showed good consistency between the observed and simulated values of flow, SS, and TP loading at the outlet of the sub-catchment at the hydrological and water quality stations in PLB. The input data for the model and their sources are shown in Table 1.

Table 1.
A list of key input parameters, and associated sources of data required for the calibration of SimplyP.
2.4. Watershed P Management Scenarios
Through our research, we found that the inorganic phosphorus fertilizer used in the planting industry is the main non-point source of phosphorus in each sub-basin, which is related to national water resources and the assurance of grain production to a certain extent. Therefore, we need to pay high attention to TP (total phosphorus) loss during the planting process. [16,25]. In February 2015, the Ministry of Agriculture formulated an action plan for zero growth of fertilizer use by 2020. In terms of water resource security, we consider the combined application of OF and IPF as the focus of agricultural fertilizer application in PLB in the future [27,28]. Based on future policy guidance on IPF application, we will flexibly and truly adjust the proportion of the net anthropogenic phosphorus input (NAPI) from non-point in PLB in the next 30 years. In terms of ensuring food production, we can only reflect it by the phosphorus output of crops in the non-point source phosphorus component. Increased phosphorus production in food crops means less pressure to maintain food production.
3. Results and Discussion
3.1. Time Variation Characteristics of Anthropogenic Phosphorus Emission in PLB
As a basic parameter of the model, we analyzed the main anthropogenic phosphorus input into PLB through livestock and poultry breeding, rural domestic sewage, IPF application, straw returning to the field, and urban domestic sewage. Among them, only urban domestic sewage is regarded as a point source of phosphorus input (Supplementary Figure S4), which can be directly discharged into the river through urban sewage pipes. The other four phosphorus sources are regarded as non-point source phosphorus input in PLB. At the same time, in the process of analyzing the NAPI from non-point in PLB, it is necessary to deduct the phosphorus output of crops from the total non-point source input (Supplementary Figure S5). The data are taken from China Statistical Yearbook; the anthropogenic emissions are decomposed into different sub-basins by ArcGIS grid calculation method; and the grid calculation is carried out using the spatial distribution information of population, livestock and poultry breeding quantity distribution, land use type distribution, and other spatial distribution information of 1 km2 grid in the region. The output is the high-resolution GIS grid map of anthropogenic phosphorus from six main sources each year from 2006 to 2018.
It can be seen from Supplementary Table S2 that from 2006 to 2018, the average annual anthropogenic phosphorus emission flux in PLB was 163,759 ± 6200 tons, of which the application of IPF accounted for nearly 72.4% of the total, and the average annual emission flux was 118,471 ± 3807 tons, accounting for the largest proportion of 75.3% in 2006. It was followed by 34,975 ± 3639 tons (21.3%) of livestock and poultry breeding, 5065 ± 864 tons (3.1%) of straw returned to the field, 4418 ± 420 tons of rural domestic sewage (2.7%), and 830 ± 336 tons of urban domestic sewage (5.1‰). It can be seen from Figure 2b that the phosphorus emission flux of straw returning to the field increased from 3554 tons in 2006 to 6167 tons in 2018, with a growth rate of 73.5%, indicating that farmers in the basin have reliable technical support in increasing fertilizer and production through straw returning to the field. Subsequent to livestock and poultry breeding activities, there has been a discernible upward trend in the phosphorus emission flux from this sector, increasing from 29,372 tons in 2006 to 37,423 tons in 2018, with a growth rate of 27.4%. The flux of phosphorus in rural domestic sewage and urban domestic sewage showed a downward trend, decreasing by 26.0% and 65.2%, respectively. Since 2005, China has implemented various strategies for industrial and domestic sewage control, along with significant investments in environmental reforestation, leading to a substantial reduction in external nutrient loadings to aquatic systems [45,46].
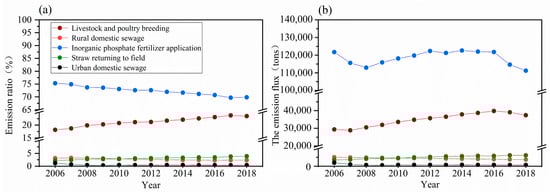
Figure 2.
Change characteristics of anthropogenic phosphorus emission flux ratio (a) and emission flux (b) of each emission unit in PLB from 2006 to 2018.
Figure 2a shows the change in the proportion of the component emission flux of the anthropogenic source phosphorus discharge unit in PLB. From the structure of anthropogenic source phosphorus, the proportion of livestock and poultry breeding, straw returning to the field, rural domestic sewage, and urban domestic sewage all show a similar change trend to their respective emission flux. Figure 2b shows that the emission flux of IPF application increased from 2008–2016, but its proportion of emission flux decreased continuously during 2006–2018 (Figure 2a), mainly because the growth rate of phosphorus emission flux of IPF application was lower than that of livestock and poultry farming and straw returning.
Considering the net anthropogenic phosphorus input (NAPI), the average input intensity in the PLB region is 721 ± 29 kgP/km2, significantly surpassing the national average in China (465 kgP/km2 in 2009) [47], and the input structure is mainly phosphate fertilizer application (72.4%). Since 2008, the NAPI in the basin has shown a significant growth trend, reaching a maximum of 754 kgP/km2 in 2016, and then declining for two consecutive years from 2016, which is in line with the changes in China’s fertilizer use, mainly because the Ministry of Agriculture reviewed and adopted in principle the “Action Plan for Zero Growth of Fertilizer Use” in 2015, which is a specific policy aimed at reducing the use of fertilizers, controlling damage, cutting costs, and enhancing efficiency.
3.2. Spatial Emission Characteristics of Anthropogenic Source Phosphorus in PLB
As shown in Figure 3, from the perspective of the spatial distribution of the NAPI, the lake area has the highest NAPI intensity, reaching 1409 ± 64 kgP/km2, mainly due to the high phosphate fertilizer application intensity in the lake area, reaching 1148 ± 37 kgP/km2 (annual average). The smallest is Xiu B, with an annual NAPI of 700 ± 27 kgP/km2, and its phosphate fertilizer application intensity is only 52.2% of that of the lake area. It is not difficult to find that the phosphorus emission intensity of each discharge unit in the sub-basin of the lake district is higher than that of other sub-basins, which is mainly caused by the high demand for inorganic phosphorus fertilizer from the large-scale growth of rice, wheat, and other crops in the lake district and the rapid development of livestock and poultry breeding and aquaculture industry in the lake district. At the same time, inorganic phosphorus fertilizer application and livestock and poultry breeding, as the two main emission units in the PLB, accounted for 93.7% of the total phosphorus emission flux, and livestock and poultry breeding and inorganic phosphorus fertilizer application are the main components of agricultural non-point source phosphorus input. For example, during 2006–2018, the average annual input of agricultural non-point source phosphorus in the GB was 98,526 ± 5029 tons, of which livestock and poultry breeding (emission intensity: 490 ± 50 kgP/km2) accounted for nearly 40.0%, and phosphate fertilizer application (emission intensity: 679 ± 22 kgP/km2) accounted for 55.5%. As a point source of phosphorus input, the phosphorus emission intensity of urban domestic sewage in each sub-watershed is almost completely maintained in the range of 1–10 kgP/km2, which is almost negligible. Therefore, it is urgent to solve the problem of agricultural non-point source pollution control in PLB.
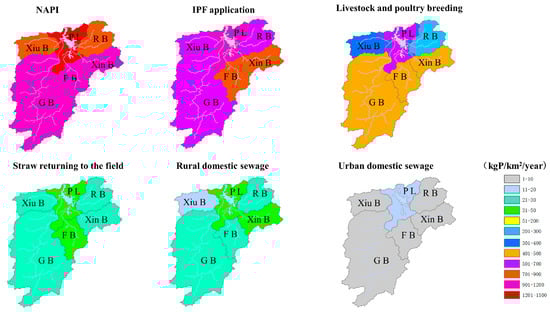
Figure 3.
Spatial distribution characteristics of the average NAPI and anthropogenic source phosphorus emission intensity of each emission unit in second-level sub-basins of PLB from 2006 to 2018.
3.3. Response Mechanism of the Phosphorus Transport Process to Climate Change in PLB
3.3.1. Effects of Climate Change on Agricultural Non-Point Source Phosphorus Flux into the River
The phosphorus pollution load from agricultural non-point sources enters the river with water as the transport carrier, which has different degrees of influence on the river ecosystem. Climate change mainly affects the regional water cycle, and the rise of temperature and the increase in precipitation intensity and frequency can indirectly affect the nutrient state of river channels to some extent. The SimplyP model was used to quantitatively analyze the temporal variation characteristics of agricultural soil phosphorus flux in the sub-basins of a typical river in PLB in the RCP concentration pathway.
Assuming that the net anthropogenic phosphorus emission from agricultural non-point sources in PLB during 2020–2049 is consistent with that in 2018, the net anthropogenic phosphorus emission flux from agricultural non-point sources (NAPId) in sub-basins named after typical rivers generally maintains 123,300 tons per year, with the NAPId reaching 868 kg/km2/year (Table 2). SimplyP can calculate the total active phosphorus storage in agricultural soil in sub-basins of typical rivers during the period 2020–2049, as shown in Supplementary Figure S6. The active phosphorus reserves in agricultural soil in the three concentration pathways of RCP showed a significant upward trend during 2020–2049, increasing from 2167–2199 million tons (annual mean) in 2020 to 3925–4195 million tons (annual mean) in 2049. The active phosphorus reserves in agricultural soil in the sub-basins of typical rivers increased by nearly 1.8 million tons on the whole, and the soil active phosphorus reserves in the RCP8.5 concentration path increased the most, with a growth rate of 91.5%.
Table 2.
NAPId statistics of sub-basins of typical rivers in 2018. The “d” in NAPId specifically denotes ‘non-point source’.
Using the NAPId and active phosphorus reserves in agricultural soil, the model can further calculate the total agricultural non-point source phosphorus flux into the river during 2020–2049 in a typical secondary river sub-basin (Figure 4). During 2020–2049, the agricultural soil phosphorus retention rate in the three RCP concentration pathways of typical secondary river subbasins was 41–48% (annual average), which was much lower than the average level in the historical period (2011–2018), and the agricultural soil phosphorus retention rate showed a slow decline from 46% to 53% (annual mean) in 2020–2034 to 33% to 43% in 2035–2049 (Figure 4). The results showed that under the influence of RCP climate change, the phosphorus retention rate of agricultural soil in PLB decreased significantly compared with the historical period, and the phosphorus release capacity of agricultural soil was significantly enhanced. As time went by, the active phosphorus of agricultural soil gradually reached the saturation point due to the accumulation of non-point source phosphorus in the soil. The retention capacity of soil for phosphorus from agricultural non-point sources was also gradually weakened. In the RCP2.6 and RCP4.5 concentration pathways, the phosphorus retention rate of agricultural soil takes a negative value in 2047 and 2048 respectively, that is, the point source phosphorus flux into the river is greater than the point source net phosphorus input, reflecting that the active phosphorus storage in agricultural soil has reached complete saturation, and the soil’s ability to release phosphorus is significantly enhanced.
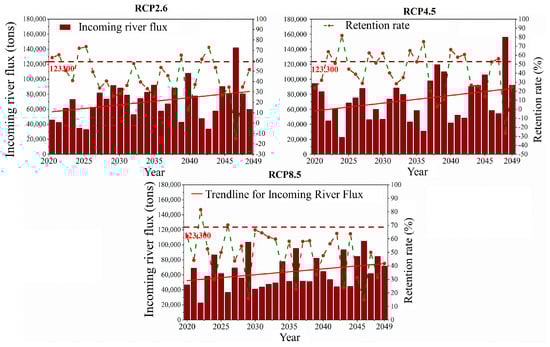
Figure 4.
Changes of agricultural non-point source phosphorus flux into the river through the RCP concentration pathway in PLB (excluding PL) from 2020 to 2049.
Under the influence of RCP climate change, the overall agricultural non-point source TP fluxes transported to rivers by typical secondary river sub-basins ranged from 64,000 to 73,000 tons (annual average), which was higher than the average level in the historical period (2011–2018) (22,000 tons), among which the TP fluxes in the RCP4.5 concentration pathway were the largest. According to the linear regression curve for the 2020–2049 TP fluxes, it can be seen that the TP fluxes in the river show a certain upward trend, increasing from 58–65,000 tons (annual average) in 2020–2034 to 7.0–81,000 tons (annual average) in 2035–2049, with an increase rate between 15.3% and 23.9%. In the RCP concentration pathway, the soil P retention ability was gradually weakened, resulting in the land soil P flux into the river gradually increasing.
3.3.2. Effects of Climate Change on the TP Fluxes at the Lake Inlets of Typical Rivers in the PLB
Through SimplyP’s prediction of the RCP concentration pathway, it has been observed that during the period of 2020–2049, the annual mean TP concentration at the lake inlets of the Ganjiang River, Fuhe River, Xinjiang River, Raohe River, and Xiushui River are 84 μg/L, 55 μg/L 54 μg/L, 32 μg/L, and 75 μg/L, respectively. The lake inlet TP concentration of five typical rivers has some spatial and temporal differences, and all of them meet the water quality standard of Class II surface rivers in China (100 μg/L, GB3838-2002). As shown in Supplementary Figure S7, in the context of the RCP scenarios, TP concentration in the typical rivers demonstrates a notable increasing trend, and the lake inlet TP concentration increases from 29–77 μg/L in 2020 to 36–90 μg/L in 2049, with an increased range of 5–39%. Among these, the concentration of total TP at the Xinjiang River lake inlet escalates from 45 μg/L in 2020 to 62 μg/L in 2049, marking the most substantial increase observed.
The river into the lake is the main channel for the input of exogenous phosphorus into the lake. An accurate understanding of the flux and spatial and temporal distribution of phosphorus into the lake (lake inlet phosphorus) is not only important content for the effective prevention and control of phosphorus pollution in the PLB but also has great significance for the study of the main source structure of phosphorus pollution in the PLB. In the RCP concentration pathway, the phosphorus flux into the lake of typical rivers in PLB during 2020–2049 was estimated by the model (Supplementary Figure S7). The results show that under the influence of RCP climate change, the TP flux transported by the five major rivers in the PLB through their lake inlets into the lake area exhibits a gradual upward trend from 2020–2030, with an annual average of about 14,293 tons (RCP2.6:14,071 tons, RCP4.5:15,193 tons, RCP8.5:13,615 tons) to an average annual rate of 15,616 tons (RCP2.6:15,889 tons, RCP4.5:16,402 tons, RCP8.5:14,557 tons) in 2040–2049, with an average increase of 9.3% (RCP2.6:12.9%, RCP4.5:8.0%, RCP8.5:6.9%). From the average level of 2020–2049, the average annual TP flux received by the lake district from typical rivers in the RCP concentration pathway is about 15,076 tons (RCP2.6:15,092 tons, RCP4.5:16,316 tons, RCP8.5:13,823 tons) (Figure 5).
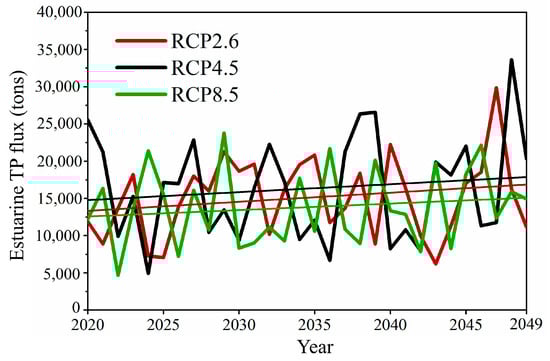
Figure 5.
Changes of TP inflow fluxes in typical rivers in the RCP concentration pathway from 2020 to 2049.
From the spatial distribution of TP fluxes into the lake, Ganjiang River, Fuhe River, Xinjiang River, Raohe River, and Xiushui River in the three RCP concentration pathways all increased significantly compared with the historical period (Table 3), among which Xiushui River showed the largest increase, from 790 tons in 2006–2018 (annual average) to about 1517 tons in 2020–2049 (RCP2.6:1514 tons, RCP4.5:1651 tons, RCP8.5:1386 tons), an increase of 75.4% to 109.0%. In terms of RCP concentration, Ganjiang River transported the largest TP flux from estuaries to lakes, reaching 8897–10,439 tons annually, accounting for about 64.2% of the TP flux from estuaries to lakes of all typical rivers. Because the annual runoff of the Ganjiang River mainstream is the largest, the TP flux of Ganjiang River into the lake plays a leading role in phosphorus pollution.
Table 3.
Comparison of the average annual TP fluxes of typical rivers into the lake during 2020–2049 and the historical period (2011–2018).
3.4. Assessment of Agricultural Non-Point Source Phosphorus Management Scenarios
The initial parameters of the model in 2020 remain the same as those in 2018. According to the China Agricultural Outlook Report 2020–2029, assuming that the annual average growth of phosphorus in livestock and poultry farming is 2.2%, and the annual average increase of crops is 0.6% (the main crop in Jiangxi Province is rice), then the annual average increase of rice phosphorus output is 0.6%. Then, we used zero growth IPF and a 2.5% annual average reduction IPF application as the IPF application intensity under the two phosphorus management scenarios during 2020–2049. Soil bulk density is a key physical characteristic of soil, denoting the mass of soil per unit volume, usually measured in 1 cubic centimeter or 1 cubic meter. This metric is frequently employed to evaluate the soil’s level of compaction, porosity, and capacity to retain water. Moreover, through a literature survey, we determined that soil bulk density (BD) decreased by 4.53% [48] on average due to the combined application of OF. Hence, we set up two scenarios (Scenario I and Scenario II) to explore the response mechanism of non-point source phosphorus pollution control and the assurance of grain production to combined fertilization in the Poyang Lake Basin (PLB) and introduced climate predictions of three concentration pathways of RCP to simulate the impact of climate change in each scenario (Table 4).
Table 4.
Based on the basic parameters and input data of SimplyP in 2018, the annual average change rate of non-point source phosphorus contribution value in NAPI and change in soil bulk density of SimplyP under two phosphorus management scenarios from 2020 to 2049.
In Scenario I, the overall average NAPId level of the PLB (excluding the PL) in 2020–2049 increases year by year, from 868 kgP/km2 in 2020 to 1227 kgP/km2 in 2049, with an increase of 41.4% and an average annual rate of 1027 kgP/km2. In the RCP concentration pathway, TP fluxes transported by five typical rivers through estuaries to lakes show a slow upward trend, increasing from 14,410 tons (annual mean) in 2020–2030 to 16,867 tons (annual mean) in 2040–2049. The overall average annual transport TP flux of a typical river is approximately 15,699 tons (RCP2.6:15,711 tons, RCP4.5:16,995 tons, RCP8.5:14,392 tons), an increase of 4.1% over the base period (average increase across the three concentration pathways of RCP) (Figure 6). Although the amount of inorganic phosphorus fertilizer applied remained constant from year to year, phosphorus emissions from livestock and poultry farming (with an average annual growth rate of 2.2%) contributed most of the NAPId to the PLB. In addition, the manure produced in the livestock and poultry breeding process is fermented to obtain organic fertilizer, which is combined with phosphate fertilizer to achieve an average annual increase of 0.6%. In Scenario I, although phosphate fertilizer maintains zero growth for a long time to come, phosphate fertilizer still plays an important role in increasing crop yields. Therefore, on the one hand, increasing rice yield consolidates the sustainability of food production; on the other hand, it also intensifies the agricultural non-point source phosphorus pollution in the PLB, which will further deepen the degree of eutrophication in the lake area.
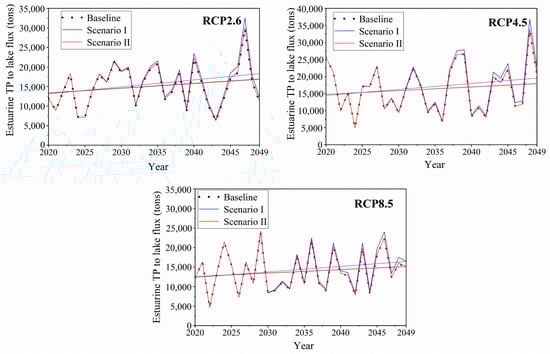
Figure 6.
Changes of TP fluxes in typical rivers in PLB under the management of agricultural non-point source phosphorus.
In Scenario II, the NAPId of the PLB (excluding the PL) during 2020–2049 shows a trend of first decreasing and then increasing, reaching an average annual value of 842 kgP/km2, which is between the base period and Scenario I. In the RCP concentration pathway, the TP fluxes transported by the five typical rivers through their estuaries to the lakes show a slow upward trend, increasing from 14,355 tons (annual mean) in 2020–2030 to 15,710 tons (annual mean) in 2040–2049. The overall average annual TP flux transported by a typical river is about 15,147 tons (RCP2.6:15,161 tons, RCP4.5:16,380 tons, RCP8.5:13,901 tons), and the average annual TP flux into the lake is reduced by 3.5% (the average decline in the three RCP concentration pathways) compared with Scenario I (Figure 6). Since the application of phosphate fertilizer decreased by 2.5% per year, the TP load transported by typical rivers to the lake area was reduced. To attain the goal of a 0.6% annual yield increase in rice, it is essential to enhance the proportion of organic phosphorus fertilizers and to boost the efficiency of organic fertilizer utilization. An analysis of Scenarios I and II reveals that, in the forthcoming period, diminishing the use of inorganic phosphate fertilizers can mitigate agricultural non-point source phosphorus pollution to some degree, while concurrently preserving the sustainability of agricultural production.
Although the average NAPId of PLB (excluding the PL) in Scenario II (annual decrease of phosphate fertilizer application by 2.5%) is 842 kgP/km2, which is a decrease of 3.0% based on the base period, it can be found from Figure 6 and Table 5 that under the influence of climate change, the average annual TP fluxes of typical rivers in 2020–2049 are almost the same in Scenario II and the base period. This is because the combined application of organic fertilizer in Scenario II improves soil quality, reduces the adsorption strength of soil phosphorus on soil particles, and weakens the soil’s ability to retain phosphorus, thus leading to a higher phosphorus loss potential [26,27]. The results showed that in the future, under the coupled constraints of climate and grain yield change (an annual increase of 0.6% of rice), the application of phosphorus fertilizer should be controlled by an annual decrease of at least 2.5% to effectively reduce the phosphorus pollution load from agricultural non-point sources in PLB. However, at the same time, it is necessary to ensure that the fertilization method is improved more effectively, the application structure of phosphate fertilizer is optimized, the application amount of different kinds of farm fertilizer is appropriately increased, and the efficiency of organic fertilizer combined with phosphate fertilizer is improved. Of course, the ability of soil to retain phosphorus from agricultural non-point sources cannot be ignored because of the combination of organic fertilizer application.
Table 5.
Comparison of annual average TP fluxes of typical rivers into the lake under the agricultural non-point source phosphorus management scenario in PLB from 2020 to 2049.
4. Conclusions
In this study, we utilized a simplified catchment-scale dynamic water quality model to explore the pathways and consequences of phosphorus movement within the PLB, taking into account the interwoven challenges presented by climate change and food production. In the RCP climate change scenario, the annual near-surface temperature and evaporation in the PLB will increase significantly during 2020–2049, and the rainfall intensity and frequency will also increase. The shifting climate conditions have led to a gradual decline in the phosphorus retention rate of agricultural soil, signaling a weakening phosphorus retention capacity in these areas. It is noteworthy that the TP flux transported by typical rivers to the lake area has experienced a significant surge when compared to the historical period spanning 2006 to 2018. The average annual TP flux received by the lake area from typical rivers was about 13,823 to 15,092 tons, which increased by nearly 54.3% to 82.1% compared with the average level of 8960 tons in the historical period. The problem of phosphorus pollution in the lake area is becoming more and more serious. From 2020 to 2049, the phosphorus simulation results coupled with RCP climate and grain yield change (an annual increase of 0.6% of rice) show that the application of inorganic phosphorus fertilizer should be controlled at least at an average annual rate of 2.5%, but at the same time, the application method should be improved more effectively. Only by optimizing the application structure of inorganic phosphorus fertilizer and appropriately increasing the application amount of organic fertilizer can the efficiency of organic fertilizer combined with inorganic phosphorus fertilizer be improved, to effectively alleviate and control agricultural non-point source phosphorus pollution in PLB and ensure the sustainable development of food production in PLB.
Supplementary Materials
The following supporting information can be downloaded at: https://www.mdpi.com/article/10.3390/w16020295/s1, Figure S1: Monthly means of the changes in temperature (A), precipitation (B) and evaporation (C) under three climate change scenarios (RCP2.6, RCP4.5, RCP8.5) during 2020–2049 relative to the historical monthly mean temperature, precipitation and evaporation from 2006 to 2018 (grey vertical bars). Figure S2. Initial soil TP concentrations in Poyang Lake Basin. Figure S3. Topsoil mass per m2 in Poyang Lake Basin. Figure S4. China’s urban domestic sewage phosphorus (point source) emission grid data set in 2018 (t). Figure S5. China’s agricultural non-point source phosphorus emission grid data set in 2018 (t). Figure S6. Overall changes in agricultural soil active phosphorus inventory during 2020–2049. Figure S7.Changes of TP concentration in a typical river in the RCP concentration pathway from 2020 to 2049. Figure S8. Comparisons between the observed and simulated river flow, SS, and TP loading in three typical rivers respectively during 2006–2018. Table S1: The historical annual mean temperature, precipitation and evaporation from 2006 to 2018 were 18.3 °C, 1794 mm yr−1 and 1157 mm yr−1 respectively in Poyang Lake Basin. The annual mean temperature, precipitation and evaporation under three RCP scenarios were compared with historical observations. Table S2. Statistics of anthropogenic source phosphorus emission flux from each discharge unit in PLB from 2006 to 2018. References [49,50] are cited in the Supplementary Materials.
Author Contributions
Conceptualization, Y.L.; Data curation, L.G., X.H., Z.C. and X.Z.; Methodology, L.G., Z.C. and Y.L.; Software, X.H.; Writing—original draft, L.G.; Writing—review & editing, Y.T., X.L. and Y.L. All authors have read and agreed to the published version of the manuscript.
Funding
This research received no external funding.
Data Availability Statement
The original contributions presented in the study are included in the article/Supplementary Materials. Further inquiries can be directed to the corresponding author.
Conflicts of Interest
The authors declare that the research was conducted in the absence of any commercial or financial relationships that could be construed as potential conflicts of interest.
References
- United Nations. World Population Prospects 2019: Highlights; United Nations: New York, NY, USA, 2009. [Google Scholar]
- Flowers, T.J. Improving crop salt tolerance. J. Exp. Bot. 2004, 55, 307–319. [Google Scholar] [CrossRef] [PubMed]
- Hou, Y.; Ma, L.; Gao, Z.; Wang, F.; Sims, J.; Ma, W.; Zhang, F. The driving forces for nitrogen and phosphorus flows in the food chain of China, 1980 to 2010. J. Environ. Qual. 2013, 42, 962–971. [Google Scholar] [CrossRef] [PubMed]
- Gallet, A.; Flisch, R.; Ryser, J.; Frossard, E.; Sinaj, S. Effect of phosphate fertilization on crop yield and soil phosphorus status. J. Plant Nutr. Soil Sci. 2003, 166, 568–578. [Google Scholar] [CrossRef]
- Yang, J.; Lin, Y. Spatiotemporal evolution and driving factors of fertilizer reduction control in Zhejiang Province. Sci. Total Environ. 2019, 660, 650–659. [Google Scholar] [CrossRef] [PubMed]
- Bai, X.; Zhang, T.; Tian, S. Evaluating Fertilizer Use Efficiency and Spatial Correlation of Its Determinants in China: A Geographically Weighted Regression Approach. Int. J. Environ. Res. Public Health 2020, 17, 8830. [Google Scholar] [CrossRef]
- Jackson-Blake, L.A.; Starrfelt, J. Do higher data frequency and Bayesian auto-calibration lead to better model calibration? Insights from an application of INCA-P, a process-based river phosphorus model. J. Hydrol. 2015, 527, 641–655. [Google Scholar] [CrossRef]
- Zhang, R.; Li, C.; Fu, K.; Li, C.; Li, C. Phosphorus Alters Starch Morphology and Gene Expression Related to Starch Biosynthesis and Degradation in Wheat Grain. Front. Plant Sci. 2018, 8, 2252. [Google Scholar] [CrossRef] [PubMed]
- Wang, J.; Qin, Q.; Pan, J.; Sun, L.; Sun, Y.; Xue, Y.; Song, K. Transcriptome analysis in roots and leaves of wheat seedlings in response to low-phosphorus stress. Sci. Rep. 2019, 9, 19802. [Google Scholar] [CrossRef]
- El Mazlouzi, M.; Morel, C.; Chesseron, C.; Robert, T.; Mollier, A. Contribution of External and Internal Phosphorus Sources to Grain P Loading in Durum Wheat (Triticum durum L.) Grown Under Contrasting P Levels. Front. Plant Sci. 2020, 11, 870. [Google Scholar] [CrossRef]
- Tilman, D.; Cassman, K.G.; Matson, P.A.; Naylor, R.; Polasky, S. Agricultural sustainability and intensive production practices. Nature 2002, 418, 671–677. [Google Scholar] [CrossRef]
- Yindong, T.; Ziwei, C.; Yingting, W.; Miao, Q.; Yuyi, W.; Mengshi, Z.; Yan, L.; Jian, S.; Hefeng, Z.; Ruonan, W.; et al. Exploring dynamics of riverine phosphorus exports under future climate change using a process-based catchment model. J. Hydrol. 2022, 605, 127344. [Google Scholar] [CrossRef]
- Elser, J.; Bennett, E. A broken biogeochemical cycle. Nature 2011, 478, 29–31. [Google Scholar] [CrossRef]
- Farkas, C.; Beldring, S.; Bechmann, M.; Deelstra, J. Soil erosion and phosphorus losses under variable land use as simulated by the INCA-P model. Soil Use Manag. 2013, 29, 124–137. [Google Scholar] [CrossRef]
- Rao, J.; Ji, X.; Ouyang, W.; Zhao, X.; Lai, X. Dilemma Analysis of China Agricultural Non-point Source Pollution Based on Peasants’ Household Surveys. Procedia Environ. Sci. 2012, 13, 2169–2178. [Google Scholar] [CrossRef]
- Guo, W.; Fu, Y.; Ruan, B.; Ge, H.; Zhao, N. Agricultural non-point source pollution in the Yongding River Basin. Ecol. Indic. 2014, 36, 254–261. [Google Scholar] [CrossRef]
- Ockenden, M.; Deasy, C.; Benskin, C.; Beven, K.; Burke, S.; Collins, A.; Evans, R.; Falloon, P.; Forber, K.; Hiscock, K.; et al. Changing climate and nutrient transfers: Evidence from high temporal resolution concentration-flow dynamics in headwater catchments. Sci. Total. Environ. 2016, 548–549, 325–339. [Google Scholar] [CrossRef]
- Couture, R.-M.; Moe, S.J.; Lin, Y.; Kaste, L.; Haande, S.; Solheim, A.L. Simulating water quality and ecological status of Lake Vansjø, Norway, under land-use and climate change by linking process-oriented models with a Bayesian network. Sci. Total Environ. 2018, 621, 713–724. [Google Scholar] [CrossRef]
- Fang, D.; Hao, L.; Cao, Z.; Huang, X.; Qin, M.; Hu, J.; Liu, Y.; Sun, G. Combined effects of urbanization and climate change on watershed evapotranspiration at multiple spatial scales. J. Hydrol. 2020, 587, 124869. [Google Scholar] [CrossRef]
- Withers, P.J.A.; Jarvie, H.P. Delivery and cycling of phosphorus in rivers: A review. Sci. Total Environ. 2008, 400, 379–395. [Google Scholar] [CrossRef]
- Crossman, J.; Futter, M.; Oni, S.; Whitehead, P.; Jin, L.; Butterfield, D.; Baulch, H.; Dillon, P. Impacts of climate change on hydrology and water quality: Future proofing management strategies in the Lake Simcoe watershed, Canada. J. Great Lakes Res. 2012, 39, 19–32. [Google Scholar] [CrossRef]
- Sun, C.; Zhen, L.; Giashuddin Miah, M. Comparison of the ecosystem services provided by China’s Poyang Lake wetland and Bangladesh’s Tanguar Haor wetland. Ecosyst. Serv. 2017, 26, 411–421. [Google Scholar] [CrossRef]
- Zhen, L.; Li, F.; Huang, H.; Dilly, O.; Liu, J.; Wei, Y.; Cao, X. Households’ willingness to reduce pollution threats in the Poyang Lake region, southern China. J. Geochem. Explor. 2011, 110, 5–22. [Google Scholar] [CrossRef]
- U.S. Environmental Protection Agency. National Lakes Assessment: A Collaborative Survey of the Nations Lakes; Office of Water and Office of Research and Development: Washington, DC, USA, 2009. [Google Scholar]
- Liu, L.; Zheng, X.; Wei, X.; Kai, Z.; Xu, Y. Excessive application of chemical fertilizer and organophosphorus pesticides induced total phosphorus loss from planting causing surface water eutrophication. Sci. Rep. 2021, 11, 23015. [Google Scholar] [CrossRef]
- Withers, P.J.A.; van Dijk, K.C.; Neset, T.-S.S.; Nesme, T.; Oenema, O.; Rubæk, G.H.; Schoumans, O.F.; Smit, B.; Pellerin, S. Stewardship to tackle global phosphorus inefficiency: The case of Europe. AMBIO 2015, 44, 193–206. [Google Scholar] [CrossRef]
- Iqbal, A.; He, L.; Ali, I.; Ullah, S.; Khan, A.; Akhtar, K.; Jiang, L. Co-incorporation of manure and inorganic fertilizer improves leaf physiological traits, rice production and soil functionality in a paddy field. Sci. Rep. 2021, 11, 10048. [Google Scholar] [CrossRef]
- Xu, M.-G.; Li, D.-C.; Li, J.-M.; Qin, D.-Z.; Kazuyuki, Y.; Hosen, Y. Effects of Organic Manure Application with Chemical Fertilizers on Nutrient Absorption and Yield of Rice in Hunan of Southern China. Agric. Sci. China 2008, 7, 1245–1252. [Google Scholar] [CrossRef]
- Shaheen, S.; Tsadilas, C. Phosphorus Sorption and Availability to Canola Grown in an Alfisol Amended with Various Soil Amendments. Commun. Soil Sci. Plant Anal. 2013, 44, 89–103. [Google Scholar] [CrossRef]
- Lu, Y.; Gao, Y.; Nie, J.; Liao, Y.; Zhu, Q. Substituting chemical P fertilizer with organic manure: Effects on double-rice yield, phosphorus use efficiency and balance in subtropical China. Sci. Rep. 2021, 11, 8629. [Google Scholar] [CrossRef]
- Jackson-Blake, L.A.; Sample, J.E.; Wade, A.J.; Helliwell, R.C.; Skeffington, R.A. Are our dynamic water quality models too complex? A comparison of a new parsimonious phosphorus model, SimplyP, and INCA-P. Water Resour. Res. 2017, 53, 5382–5399. [Google Scholar] [CrossRef]
- Watanabe, M.; Suzuki, T.; O’ishi, R.; Komuro, Y.; Watanabe, S.; Emori, S.; Takemura, T.; Chikira, M.; Ogura, T.; Sekiguchi, M.; et al. Improved Climate Simulation by MIROC5: Mean States, Variability, and Climate Sensitivity. J. Clim. 2010, 23, 6312–6335. [Google Scholar] [CrossRef]
- Chen, C.A.; Hsu, H.H.; Liang, H.C. Evaluation and comparison of CMIP6 and CMIP5 model performance in simulating the seasonal extreme precipitation in the Western North Pacific and East Asia—ScienceDirect. Weather. Clim. Extrem. 2021, 31, 100303. [Google Scholar] [CrossRef]
- Wang, R.N.; Peng, W.Q.; Liu, X.B.; Wu, W.Q.; Chen, X.K.; Zhang, S.J.; Jiang, C.L. Quantitative estimation of the impacts of climate change and anthropogenic activities on inflow variations in the Poyang Lake Basin during the last 55 years. IOP Conf. Ser. Earth Environ. Sci. 2018, 191, 012080. [Google Scholar] [CrossRef]
- Zhu, H.; Xu, L.; Jiang, J.; Fan, H. Spatiotemporal Variations of Summer Precipitation and Their Correlations with the East Asian Summer Monsoon in the Poyang Lake Basin, China. Water 2019, 11, 1705. [Google Scholar] [CrossRef]
- Zhang, L.; Chen, X.; Lu, J.; Fu, X.; Zhang, Y.; Liang, D.; Xu, Q. Precipitation projections using a spatiotemporally distributed method: A case study in the Poyang Lake watershed based on the MRI-CGCM3. Hydrol. Earth Syst. Sci. 2019, 23, 1649–1666. [Google Scholar] [CrossRef]
- Rojas, R.; Feyen, L.; Dosio, A.; Bavera, D. Improving pan-European hydrological simulation of extreme events through statistical bias correction of RCM-driven climate simulations. Hydrol. Earth Syst. Sci. 2011, 15, 2599–2620. [Google Scholar] [CrossRef]
- Wei, S.; Dai, Y.; Liu, B. A China data set of soil properties for land surface modeling. J. Adv. Model. Earth Syst. 2013, 5, 212–224. [Google Scholar]
- Lamontagne, J.R.; Barber, C.A.; Vogel, R.M. Improved estimators of model performance efficiency for skewed hydrologic data. Water Resour. Res. 2020, 56, e2020WR029001. [Google Scholar] [CrossRef]
- Clark, M.P.; Vogel, R.M.; Lamontagne, J.R.; Mizukami, N.; Knoben, W.J.M.; Tang, G.; Gharari, S.; Freer, J.E.; Whitfield, P.H.; Shook, K.R.; et al. The abuse of popular performance metrics in hydrologic modeling. Water Resour. Res. 2021, 57, e2020WR029001. [Google Scholar] [CrossRef]
- Renard, B.; Kavetski, D.; Kuczera, G.; Thyer, M.; Franks, S.W. Understanding predictive uncertainty in hydrologic modeling: The challenge of identifying input and structural errors. Water Resour. Res. 2010, 46, W05521. [Google Scholar] [CrossRef]
- Nguyen, D.A.; Duong, S.H.; Tran, P.A.; Cao, H.H.; Ho, B.Q. Combination of data-driven models and interpolation technique to develop of PM10 map for Hanoi, Vietnam. Sci. Rep. 2020, 10, 19268. [Google Scholar] [CrossRef]
- Jackson-Blake, L.A.; Wade, A.J.; Futter, M.N.; Butterfield, D.; Couture, R.-M.; Cox, B.A.; Crossman, J.; Ekholm, P.; Halliday, S.J.; Jin, L.; et al. The INtegrated CAtchment model of phosphorus dynamics (INCA-P): Description and demonstration of new model structure and equations. Environ. Model. Softw. 2016, 83, 356–386. [Google Scholar] [CrossRef]
- Moriasi, D.N.; Arnold, J.G.; van Liew, M.W.; Bingner, R.L.; Harmel, R.D.; Veith, T.L. Model evaluation guidelines for systematic quantification of accuracy in watershed simulations. Trans. ASABE 2007, 50, 885–900. [Google Scholar] [CrossRef]
- Tong, Y.; Zhang, W.; Wang, X.; Couture, R.-M.; Larssen, T.; Zhao, Y.; Li, J.; Liang, H.; Liu, X.; Bu, X.; et al. Decline in Chinese lake phosphorus concentration accompanied by shift in sources since 2006. Nat. Geosci. 2017, 10, 507–511. [Google Scholar] [CrossRef]
- Zhou, Y.; Ma, J.; Zhang, Y.; Qin, B.; Jeppesen, E.; Shi, K.; Brookes, J.D.; Spencer, R.G.; Zhu, G.; Gao, G. Improving water quality in China: Environmental investment pays dividends. Water Res. 2017, 118, 152–159. [Google Scholar] [CrossRef] [PubMed]
- Han, Y.; Yu, X.; Wang, X.; Wang, Y.; Tian, J.; Xu, L.; Wang, C. Net anthropogenic phosphorus inputs (NAPI) index application in Mainland China. Chemosphere 2013, 90, 329–337. [Google Scholar] [CrossRef]
- Liu, L.; Xu, Y.; Zhu, S.; Gao, Y.; Zheng, X. Meta-analysis on the responses of soil bulk density to supplementation of organic fertilizers in croplands in China. J. Agric. Resour. Environ. 2021, 38, 867–873. [Google Scholar]
- Irmak, S.; Irmak, A.; Allen, R.G.; Jones, J.W. Solar and net radiation-based equations to estimate reference evapotranspiration in humid climates. J. Irrig. Drain. Eng. 2003, 129, 336–347. [Google Scholar] [CrossRef]
- Yang, Y.; Chen, R.; Han, C.; Liu, Z.; Wang, X. Optimal Selection of Empirical Reference Evapotranspiration Method in 36 Different Agricultural Zones of China. Agronomy 2022, 12, 31. [Google Scholar] [CrossRef]
Disclaimer/Publisher’s Note: The statements, opinions and data contained in all publications are solely those of the individual author(s) and contributor(s) and not of MDPI and/or the editor(s). MDPI and/or the editor(s) disclaim responsibility for any injury to people or property resulting from any ideas, methods, instructions or products referred to in the content. |
© 2024 by the authors. Licensee MDPI, Basel, Switzerland. This article is an open access article distributed under the terms and conditions of the Creative Commons Attribution (CC BY) license (https://creativecommons.org/licenses/by/4.0/).