Article

Investigation of the Recent Ice Characteristics in the Bohai Sea in the Winters of 2005–2022 Using Multi-Source Data

1
North China Sea Marine Forecasting Center of State Oceanic Administration, Qingdao 266000, China
2
Shandong Key Laboratory of Marine Ecological Environment and Disaster Prevention and Mitigation, Qingdao 266000, China
3
State Key Laboratory of Coastal and Offshore Engineering, Dalian University of Technology, Dalian 116024, China
*
Authors to whom correspondence should be addressed.
Water 2024, 16(2), 290; https://doi.org/10.3390/w16020290
Submission received: 19 November 2023 / Revised: 3 January 2024 / Accepted: 6 January 2024 / Published: 15 January 2024
(This article belongs to the Special Issue Cold Regions Ice/Snow Actions in Hydrology, Ecology and Engineering)

Abstract

:
The safety of winter activities in the Bohai Sea requires more detailed information on ice characteristics and a more refined ice zone division. In the present study, 1/12°-resolution sea ice characteristic data were obtained based on the NEMO-LIM2 ice–ocean coupling model that assimilated MODIS satellite sea ice observations from the years of 2005 to 2022 to acquire new sea ice hindcasting data. On this basis, the ice period, ice thickness, ice concentration, ice temperature, ice salinity, and design ice thickness for different return periods in the 1/4°-resolution refined zoning were analyzed, which were then compared with the sea ice characteristics in the previous 21-ice-zone standard. The distribution of ice temperature and ice salinity was closely related to the distribution of ice thickness. The results of ice period, ice thickness, and ice concentration, as well as design ice thickness for different return periods, and the comparison with the previous 21-ice-zone standards, showed that the ice condition on the west coast of the Bohai Sea has significantly reduced.

1. Introduction

The Bohai Sea, the inland sea in the northern China, has a cold winter climate and is the southern boundary of the frozen waters in the Northern Hemisphere [1]. In winter, sea ice in the Bohai Sea poses severe threats to port transportation, offshore oil and gas exploration, marine fisheries, etc. [2]. To ensure the security of human activities in the Bohai Sea during winter, it is necessary to know the characteristics of sea ice in the Bohai Sea in winter [3].
In order to facilitate distinguishing the differences in the ice characteristics in a large-scale sea area, the target sea area needs to be zoned according to various ice conditions [4]. Unlike the ice in the Arctic Ocean, all the ice in the Bohai Sea is first-year ice. Under the influence of local thermal and dynamic factors, the sea ice in the Bohai Sea is mainly drift ice, with significant interannual variations [5]. The engineering sea ice zone division in the Bohai Sea is primarily based on a series of sea ice parameters, such as ice concentration, ice thickness, ice type, ice period, etc. In 1984, the ARCTIC Corporation of the USA first divided the Bohai Sea into three ice zones: the Bohai Bay Ice Zone, the Bozhong Ice Zone, and the Laizhou Bay Ice Zone [6]. A few years later, Liu et al. divided Liaodong Bay into the northern and southern ice zones, considering the different sea ice properties and climatic conditions [7]. Afterward, Shen conducted an ocean survey to investigate China’s sea ice intensity division in 1992 [6]. He divided the Bohai Sea into nine ice zones, considering the prospects for offshore oil and gas development. Entering the 21st century, Wu et al. divided the nearshore areas of the Bohai Sea and the northern Yellow Sea into 21 ice zones based on the fundamental characteristics of the distribution and changes of the sea ice in China, considering the convenience of engineering design and production departments [8]. The 21-ice-zone scheme is currently the most commonly used standard [4,9].
The engineering ice-resistance designs are based on the sea ice characteristic parameters [10]. In recent years, the overall ice condition in the Bohai Sea has been milder, but extreme meteorological events, especially the strong cold waves, have gradually increased in winter [2]. Along the Bohai coast, the seasonal resources of wind energy [11], solar thermal energy [12], and wave energy [13] are abundant. With increased economic activity in the Bohai Sea in winter, potential sea ice disasters have become increasingly prominent. For the safe operation of industrial activities in Bohai, it is necessary to consider the impact of sea ice [1,3].
Ice engineering in the Bohai Sea has developed since the 1980s, and Chinese scholars and engineers have conducted many studies on sea ice problems [14,15]. Li et al. [16] proposed a division of ice engineering sub-areas based on the ice physical and mechanical parameter distributions in Bohai. Li et al. [2] studied the effect of porosity on the uniaxial compressive strength of Bohai sea ice. With global warming, the ice season shortens, the ice thickness decreases, and the drift ice occupies most of the existing sea ice in winter in the Bohai Sea [17,18]. The sea ice characteristic parameters and ice zone division obtained based on marine environmental survey data from decades ago cannot meet the current engineering ice-resistance designs. There is an urgent need for more detailed information on ice characteristics to ensure the safety of activities in the Bohai Sea in winter.
In the present study, ice characteristics with a resolution of 1/4° in the Bohai Sea in the winters of 2005–2022 were evaluated using ice–ocean coupling model data that assimilated satellite data. Firstly, sea ice characteristic data with a resolution of 1/12° were obtained based on the Nucleus for European Modelling of the Ocean, version 3.6 (NEMO3.6) and the large-scale Louvain-la-Neuve Sea Ice Model, version 2 (LIM2), which assimilated sea ice satellite remote sensing observations from the Moderate Resolution Imaging Spectroradiometer (MODIS) from 2005 to 2022 to acquire new sea ice hindcasting data. The hindcasting data were then compared and validated using long-term sea ice observations from coastal ocean stations and the oil platform in the Jinzhou area of Liaodong Bay from 2010 to 2018. Based on the long-time-series hindcasting data, the ice period, ice thickness, ice concentration, ice temperature, ice salinity, and design ice thickness for different return periods in the 1/4°-resolution refined zoning were analyzed and compared with the sea ice characteristics of 21 ice zones in the China National Offshore Oil Corporation (CNOOC) standard “Regulations for offshore ice condition and application in China sea (Q/HSn 3000-2002)” [19].

2. Materials and Methods

2.1. Study Area

The Bohai Sea is located in the mid-latitude monsoon region of the Northern Hemisphere (37°07ʹ N–41°00ʹ N; 117°35ʹ E–121°10ʹ E). From a geomorphological perspective, the Bohai Sea is a large bay that extends inland from the Yellow Sea. The Bohai Sea is mainly composed of five parts: the Liaodong Bay in the north, the Bohai Bay in the west, the Laizhou Bay in the south, the shallow sea basin in the center, and the Bohai Strait connected to the Yellow Sea. The Bohai Sea has a coastline length of approximately 3.80 × 10³ km, an area of approximately 8.00 × 10⁴ km2, and an average depth of 18 m. In the Bohai Sea, it is controlled by the Asian continental high pressure and is dominated by northerly winds in winter. The changes in water temperature in the Bohai Sea are mainly influenced by the continental climate. Due to the shallow water in the Bohai Sea, the water temperature responds quickly to the air temperature. The water temperature in January is lower than in February, and the water temperature at the top of the three major bays is below 0 °C.
In general, the Bohai Sea freezes from north to south in late November or early December, starting from shallow water areas on the shore to deep water areas. In mid- to late-February of the following year, it melts from deep water areas to shallow water areas from south to north. The ice period is 3–4 months, and by mid-March, all sea ice disappears. The severe ice period in various sea areas generally occurs from mid-January to mid-February. Due to significant differences in ice period, ice thickness, ice drift speed and direction, ice cover range, and geographical environment among different sea areas, there are significant differences in ice conditions among different sea areas.
To distinguish the differences in the severity of ice conditions for marine engineering designs, the ice zone division in the Bohai Sea has been conducted in the past few decades [6,7,8,9]. The previously used ice zone division was proposed in the CNOOC standard “Regulations for offshore ice condition and application in China Sea (Q/Hsn 3000-2002)”. Based on the actual situation in the Bohai Sea, the design and operation experience of 15 oil and gas fields in the Bohai Sea during 1968–1998 were summarized. The coastal place names were used as the division names, and the values of general sea ice conditions, such as ice days and ice thicknesses during ice periods, were set using the survey statistics of shore stations. The ice zone division in the standard is too rough, and the guidance and refinement of the zone for offshore platforms and other engineering projects need to be improved.
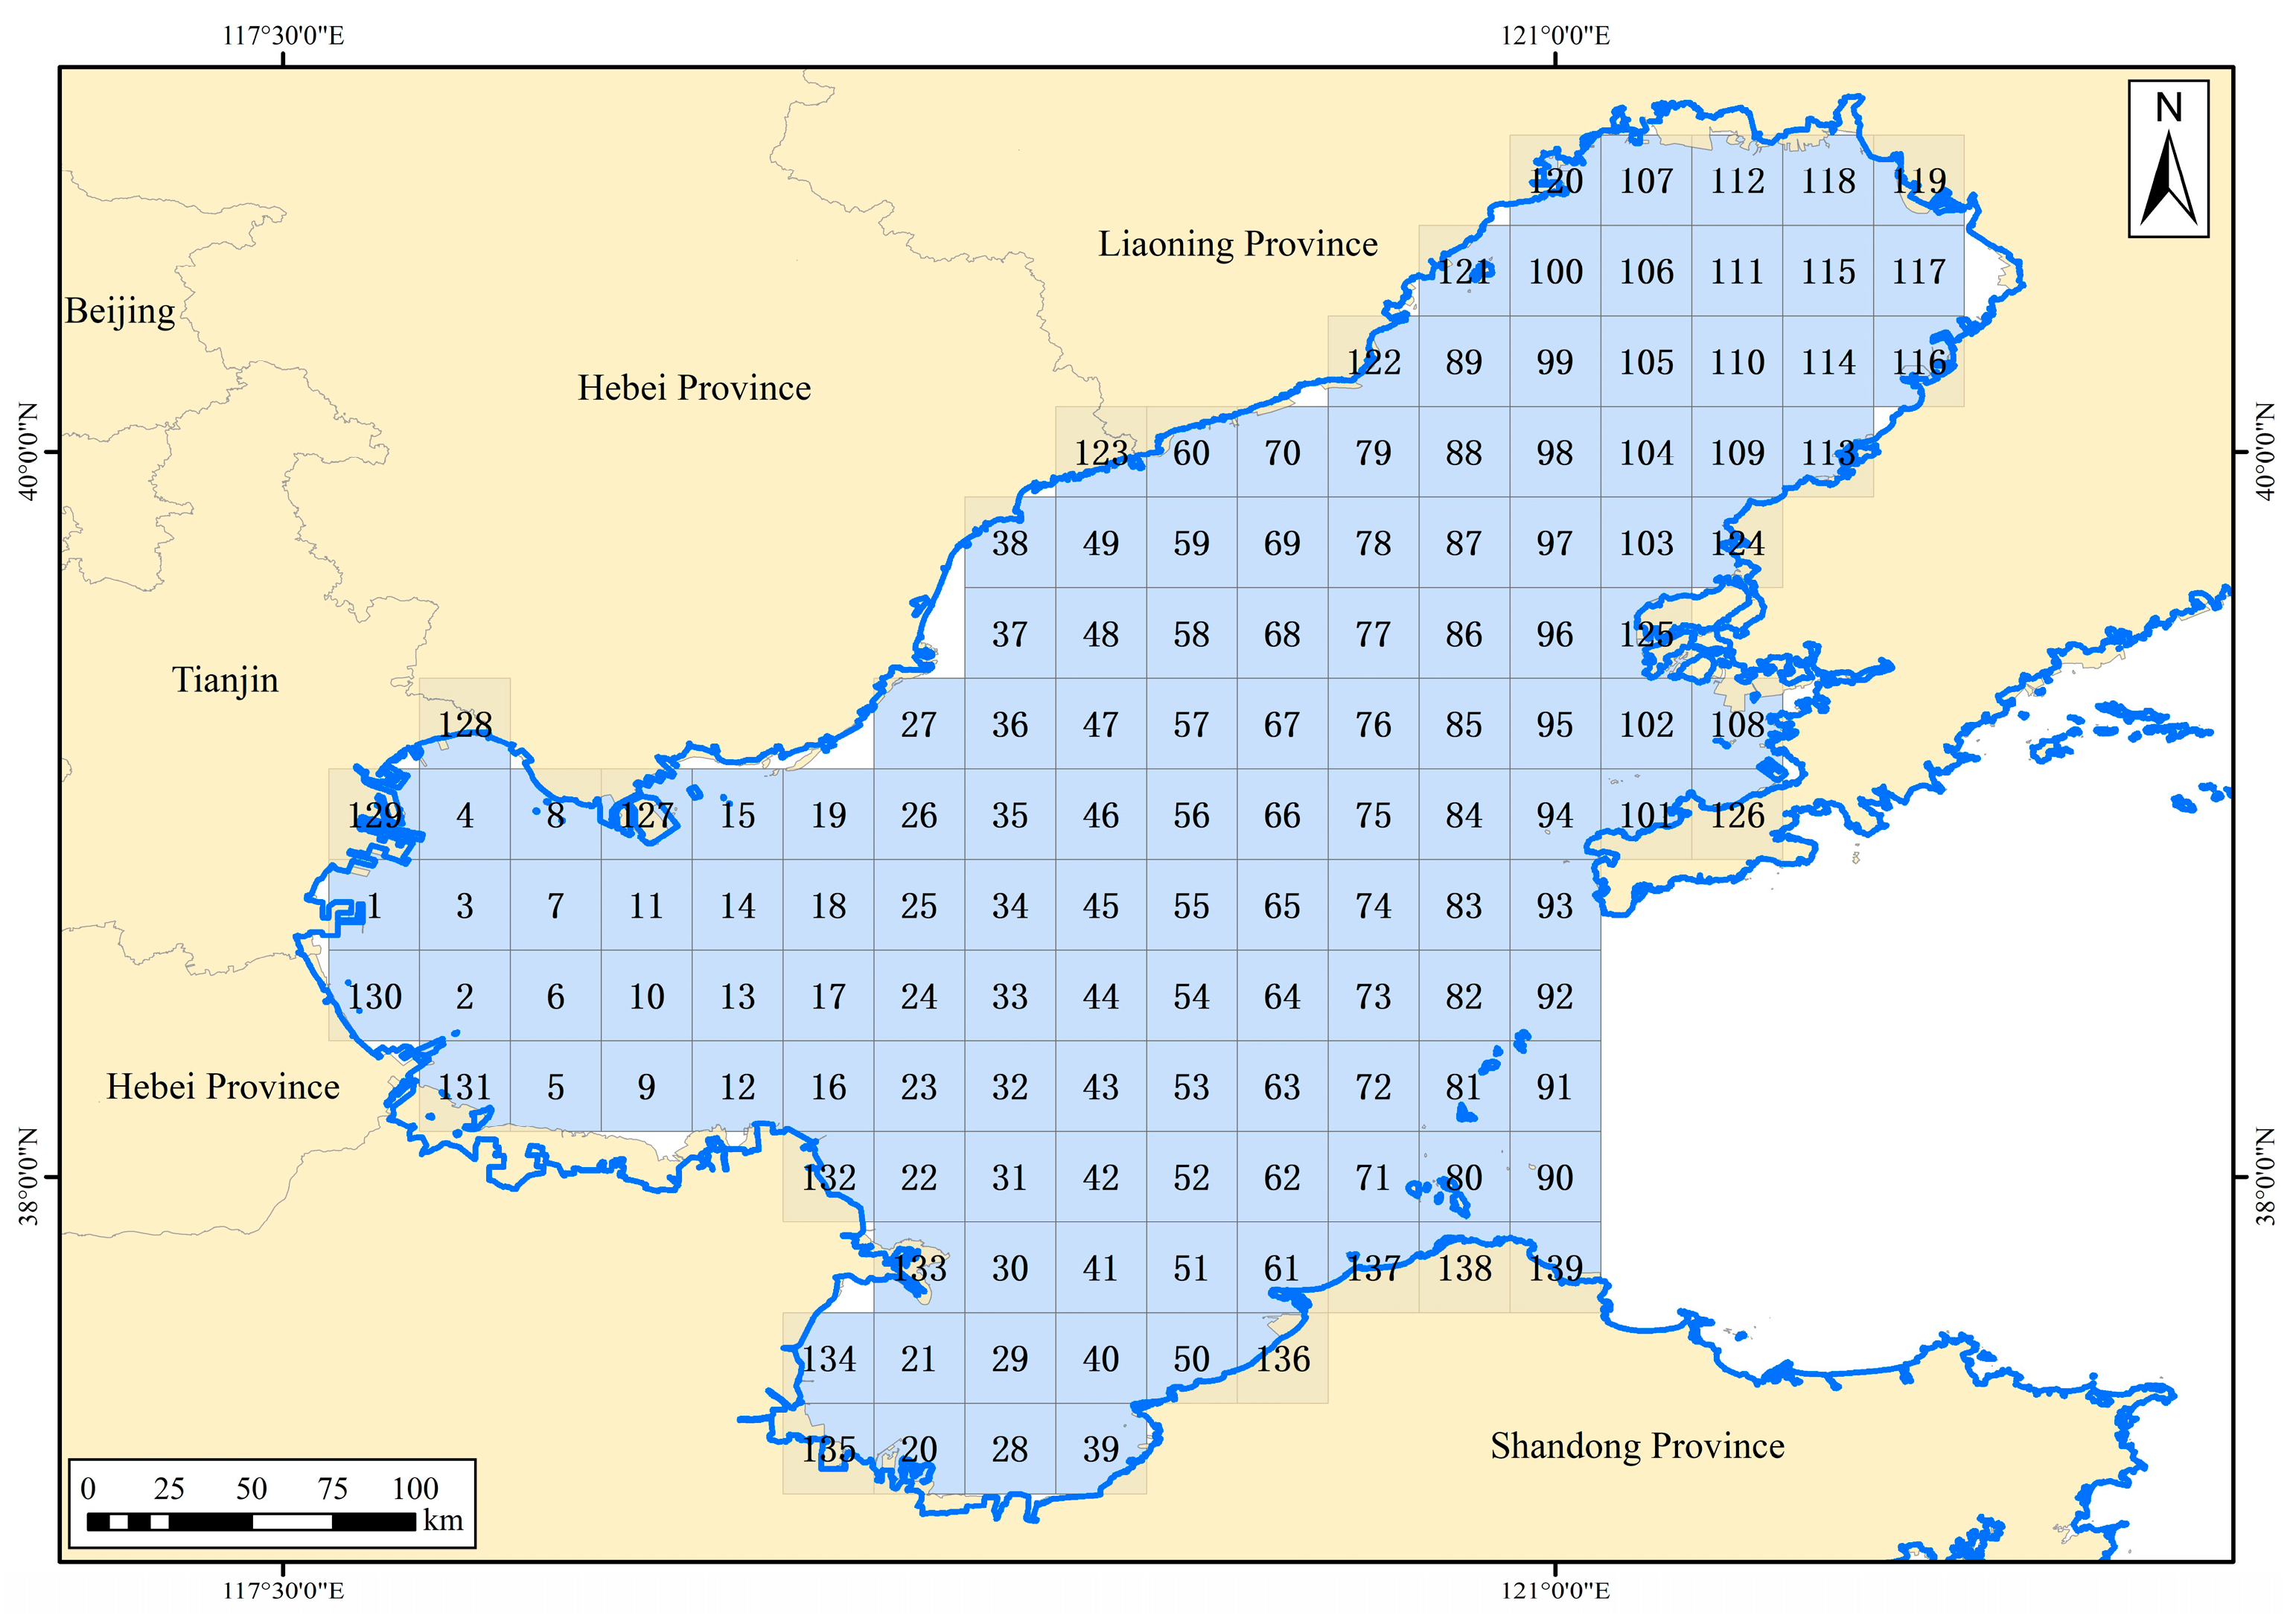
Based on completing the hindcasting data from 2005 to 2022, the present study provides a new division of the sea ice zones in the Bohai Sea area. Figure 1 depicts the new division scheme. The Bohai Sea (37.125° N–40.875° N and 117.625° E–122.125° E) is divided into a total of 139 ice zones with a spatial resolution of 1/4°.

2.2. Sea Ice Hindcasting Modelling

The sea ice hindcasting data used in the current study were acquired from a sea ice prediction model for the Bohai Sea established based on the NEMO3.6 ocean model in the ORCA configuration coupling the LIM2 sea ice model [20,21].
The model domain is located in a spatial range of 35° N–41° N, 117° E–127° E, covering the entire Bohai Sea and the Northern Yellow Sea with a spatial resolution of 1/12°. The topographic data in the NEMO model uses the ETOPO1 public data set, with a spatial resolution of 1 km, which is interpolated into the NEMO model grid through bilinear interpolation [22]. The ice–ocean coupling model can finely simulate the ocean and sea ice environments near complex islands and shorelines.
The ocean module is vertically divided into 36 layers along the z-axis, using the GLS framework and the k-ε turbulent closure scheme to calculate the vertical vortex viscosity and diffusion coefficient. The viscosity coefficient in the horizontal direction is set to 50 m2·s−1, and the side boundary is set to a non-sliding boundary. The bottom friction coefficient varies with space, with a minimum value of 5 × 10⁻⁴. The sea ice module includes two calculation components: sea ice thermodynamics and dynamics, using the elastic-plastic viscosity (EVP) sea ice rheology calculation concept. The sea ice module includes a snow layer and two sea ice layers in the vertical direction. The sea ice module and ocean module perform real-time coupling calculations, exchanging data every 360 s. To accurately simulate the Bohai sea ice, the sea ice generation parameter is set to 0.3 m. The sea ice boundary is a non-sliding condition. The model is driven by wind speed, air temperature, relative humidity, longwave radiation, shortwave radiation, precipitation, and snow from the National Centers for Environmental Prediction (NCEP) Climate Forecast System Reanalysis (CFSR) reanalysis data. The initial field and open boundary conditions are interpolated using data such as seawater temperature, salinity, sea surface height, and flow velocity in each layer from the global forecast data of the European Copernicus Marine Environment Monitoring Service (CMEMS).
In order to improve the reliability of the sea ice hindcasting data, satellite remote sensing observations of sea ice concentration from the MODIS were assimilated into the NEMO3.6 ocean model using the Ensemble Adjustment Kalman Filter (EAKF) method. The EAKF method uses the dependency relationship and spatial correlation between variables in the model to estimate the optimal state variables of the model from a probabilistic and statistical perspective [23]. 
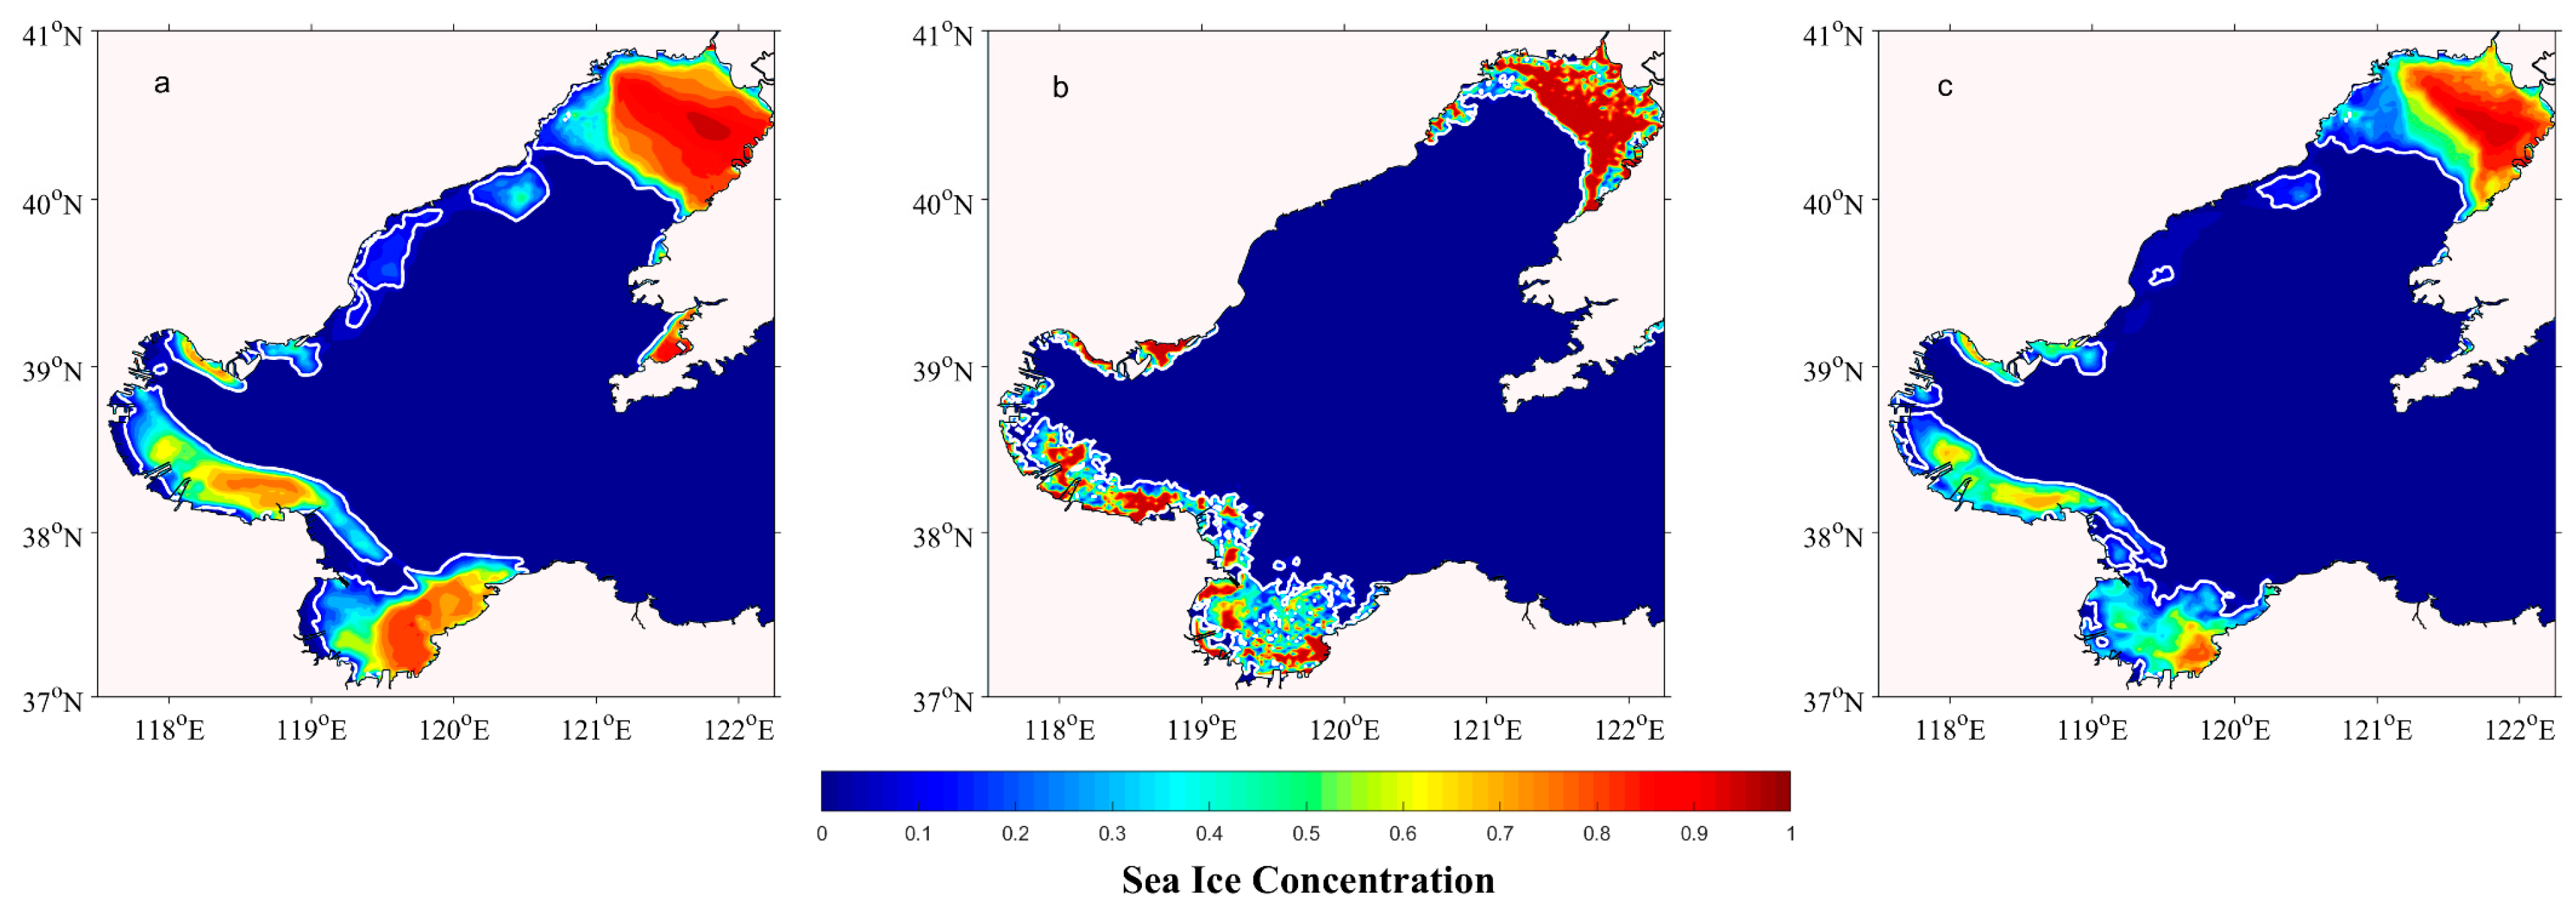
Figure 2 shows that the modeled sea ice concentration is closer to the satellite observation after EAKF assimilation. From the distribution map of sea ice concentration difference and assimilation adjustment amount (Figure 3), it can be seen that the assimilation adjustment of sea ice effectively compensates for the relative observation bias of the model, indicating that the sea ice assimilation method is correct and the assimilation effect is obvious.
The assimilation frequency was once a week during the freezing period. Figure 4 compares errors in sea ice concentration before and after the assimilation of MODIS data into the NEMO3.6 ocean model in the Bohai Sea in the winter of 2021/2022. After assimilating the MODIS data, model prediction accuracy was significantly improved, with an average error of 6.7% in sea ice concentration.
In order to improve the accuracy of evaluation and reduce the impact of model errors on evaluation results, the adjacent grids are usually combined on the basis of subdivision grids, and several fine-grid data covered by coarse grids are evaluated by means of average or extreme value. In this paper, the sea ice data of nine 1/12° grids of the NEMO model covered by a 1/4° grid are used to evaluate the sea ice data of the 1/4° grid. That is, the maximum ice thickness of the nine 1/12° grids is selected to represent the ice thickness in the 1/4° grid.

2.3. Design Sea Ice Parameters

Sea ice temperature refers to the temperature inside the ice sheet. In actual natural ice sheets, the type of ice and its vertical temperature distribution are very complex, influenced by factors such as air temperature, water temperature, ice thickness, and ice heat transfer coefficient. In engineering designs, it is necessary to determine a single ice temperature design value under the most severe condition, i.e., the effective ice temperature. The effective ice temperature is the average temperature of the ice sheet under the lowest air temperature. Assuming no phase change occurs in the ice, the effective ice temperature can be calculated according to the following formula [10]:
T i = ( T ia + T iw ) / 2
where Ti is the effective ice temperature (°C); Tia is the upper surface temperature of the ice sheet (°C); and Tiw is the lower surface temperature of the ice sheet (°C). Tia and Tiw are related to sea ice thickness, salinity, and air temperature.
Sea ice salinity mainly depends on the salinity and freezing speed of seawater before freezing. The effective salinity of sea ice can be calculated as follows [24]:
S i = 19.007 H 0.387
where Si is the effective ice salinity (‰); H is the sea ice thickness (cm).
The determination of design ice thickness used the average of estimates by the Pearson-III (P-III) distribution and the Weibull distribution. When determining the design ice thickness, an excessively small estimate may lead to damage to marine structures, while an excessively large estimate can result in increased costs. The biggest advantage of the P-III distribution is its large elasticity. In most cases, it can be fitted well with the theoretical curve and empirical frequency points by repeatedly fitting the line or adjusting the coefficient of variation and mean appropriately.
The probability density function of P-III distribution is:
f ( x ) = β α Γ ( α ) ( x x 0 ) α 1 exp [ β ( x x 0 ) ]  
where Γ(α) is the gamma function, and α, β as well as x0 are the shape, scale and position coefficients, respectively, related to the statistical parameters of the random variables:
α = 4 C s 2
β = 2 x ¯ C v C s
x 0 = x ¯ ( 1 2 C v C s )
where Cs is skewness coefficient, Cv is variation coefficient, and x ¯ is the average.
Therefore, the determination of the probability density function of the P-III distribution is transformed into the determination of the statistical parameters. In general, the observations of ice conditions are not long enough; the empirical distribution based on observations must be extended to determine the design ice thickness. The preliminary values of the statistical parameters can be obtained using the observation data, and an empirical distribution curve is depicted. Afterwards, the statistical parameters are adjusted until the corresponding empirical distribution curve fits well with the observations. The statistical parameters after adjustment are selected to determine the final P-III distribution, and the design ice thickness is determined from the corresponding cumulative frequency density curve according to the return period.
The probability density function of the Weibull distribution is:
f ( x ) = β α ( x μ α ) β 1 exp [ ( x μ α ) β ]  
where α, β, and μ are scale, shape, and position coefficients, respectively.
The parameters of the Weibull distribution are determined using the maximum likelihood estimates. After determining the parameters, the design ice thickness is determined from the corresponding cumulative frequency density curve according to the return period.

3. Results

3.1. Model Verification

The JZ9-3 and JZ20-2 oil platforms are located in the northern waters of Liaodong Bay in the Bohai Sea, where ice conditions are severe in winter. Figure 5 shows the sea ice thickness monitoring data from the two oil platforms and the hindcasting sea ice thickness data from 2010 to 2018. At the location of the JZ9-3 platform, the correlation coefficient between the hindcasting sea ice thickness and observations is 0.64, with an absolute error of 3.15 cm. At the location of the JZ20-2 platform, the correlation coefficient between the hindcasting sea ice thickness and observation is 0.71, with an absolute error of 3.69 cm. The hindcasting data can better reflect different ice conditions between mild and severe ice years.
A comparative analysis of ice periods was conducted in Figure 6 using sea ice observations from three artificial observation stations along the coast of the Bohai Sea and hindcasting data from the nearest grid cells. The overall length of the monitoring ice period at each station is greater than that obtained by the numerical model. It mainly considers that the sea ice during the initial ice period mainly forms in the shallow shoals and semi-enclosed bays near the shore and eventually melts in these nearshore areas after warming up in spring. Therefore, the length of the artificial monitoring ice period conducted near the shore is generally slightly longer than that reported by the numerical model. At locations such as Bayuquan Ocean Station and Wentuozi Ocean Station, which are located to the north, data from ocean stations with longer ice periods are continuous, and the hindcasting results are consistent with the monitoring of ice periods. The hindcasting data can better reflect the distribution of ice periods in mild and severe ice years.
Sea ice temperature and salinity were not verified in this study because these two parameters are calculated by sea ice thickness and air temperature. Therefore, we focused our verification efforts on the ice thickness, which plays a key role in the estimation of sea ice temperature and salinity. According to the current standard used for sea ice observation in China, the sea ice concentration in the conventional shore station is mainly determined as the proportion of ice in the total observation area, which is different from the calculation of sea ice concentration in the numerical model (the proportion of ice units to the total number of units). Therefore, no validation was carried out for sea ice concentration. There is a good consistency between ice thickness and concentration, so the validation effect of ice thickness can also represent the accuracy of other sea ice parameters to a certain extent.

3.2. Ice Period, Thickness, and Concentration

Figure 7 plots the average severe ice period in the Bohai Sea from 2005 to 2022. The average severe ice period in Liaodong Bay was the longest, which is consistent with the phenomenon of sea ice accumulation on the east coast caused by the winter northwest monsoon. Moreover, influenced by the warm current of the Yellow Sea, the water temperature on the south coast of Bohai Bay is lower than that on the north coast, resulting in a longer severe ice period in the south of Bohai Bay compared to the north [25]. The average severe ice period in Laizhou Bay is shorter than that in Liaodong Bay and Bohai Bay, with only 10 to 20 days.
Figure 8 shows the maximum sea ice thickness, average sea ice thickness, maximum sea ice concentration, and average sea ice concentration in the Bohai Sea from 2005 to 2022. The maximum and average ice thickness show relatively consistent spatial distribution characteristics. The sea ice thickness in the northeast of Liaodong Bay is the largest, and in the central area of the Bohai Sea it is the smallest. The sea ice thickness at the bottom of the bays is larger than that at the bay mouth. The sea ice thickness shows the characteristics of Liaodong Bay are large in the east and small in the west; those of Bohai Bay are large in the south and small in the north; and those of Laizhou Bay are large in the east and small in the west, which is consistent with the distribution of water depth.
The spatial distribution characteristics of sea ice concentration and thickness are relatively consistent. The sea ice in Liaodong Bay has the largest freezing range and slowest heat exchange with the outer sea. In addition, the thermal effect of the cold continent in winter is conducive to ice growth [26]. Under the influence of the northwest monsoon, sea ice accumulates towards the east. When the northward and eastward monsoons blow continuously in winter, under the action of clockwise reflux, drift ice can always exist in the areas of Bayuquan and Changxing Island [27].
Figure 9 plots the difference in the average severe ice period between the present study and the 21-ice-zone standard. Compared with the original 21-ice-zone standard, the latest average severe ice period in most areas of the Bohai Sea decreased, with the southern and western coast of the Bohai Sea experiencing more significant shortening, while the eastern part of Liaodong Bay increased slightly. Both the latest result and the old standard showed that there was no severe ice period in the central Bohai Sea.
Figure 10 shows the differences in the sea ice thickness and concentration between the present study and the 21-ice-zone standard. Compared with the original standard values of the 21 ice zones, the maximum ice thickness in most areas of the Bohai Sea decreased, while the maximum ice thickness on the eastern side of Liaodong Bay increased, with an overall increase of about 10 cm. The decrease in sea ice thickness is most significant near the No. 43 zone in the central Bohai Sea. The average thickness and maximum thickness distribution of sea ice were similar, except for the eastern part of Liaodong Bay; there was also a slight increase in the central part of Bohai Bay.
For the sea ice concentration, there were four significantly higher ice zones in the eastern area of Laizhou Bay, which had a maximum sea ice concentration of 18.5% in the No. 20 ice zone in the original standard. By contrast, the maximum sea ice concentration of the four ice zones was between 80.3% and 97.2% in the latest results, with an average sea ice concentration of 4.8–9.5%. In extreme years, the ice condition is severe, and there is some accumulation of sea ice in the eastern part of Laizhou Bay, with a maximum sea ice concentration of 97.2% occurring in 1969.

3.3. Ice Temperature and Salinity

Figure 11 plots the results of the average ice temperature and salinity in the Bohai Sea from 2005 to 2022, calculated using Equations (1) and (2). The lower surface temperature of sea ice is equal to the freezing temperature of seawater. The difference in the lower surface temperature of sea ice in different ice zones is not significant, and the temperature of the upper surface of sea ice is mainly affected by air temperature. The average effective ice temperature of each ice zone in the Bohai Sea showed that the southern ice zone was higher than the northern ice zone, which is consistent with the air temperature distribution. The average effective ice temperature at the bottom of Liaodong Bay was the lowest. Because sea ice salinity is a function of sea ice thickness, the salinity of sea ice is lower in areas with thicker sea ice. The distribution of average effective salinity showed that the ice zones in the eastern part of Liaodong Bay, the southern part of Bohai Bay, and the southern part of Laizhou Bay were lower than other ice zones.

3.4. Design Ice Thickness

Figure 12 depicts the design ice thickness for different return periods in the Bohai Sea. The design ice thickness in Liaodong Bay was the thickest, followed by Bohai Bay and Laizhou Bay. There was no distribution of sea ice in the central area of the Bohai Sea. The largest design ice thickness for a 100-year return period in the Bohai Sea appeared in the No. 119 ice zone in the northeast of Liaodong Bay, reaching 62.5 cm. In Bohai Bay and Laizhou Bay, the largest design ice thicknesses were larger than 40 cm. For design ice thickness for a 10-year return period in the Bohai Sea, the largest value was larger than 50 cm in Liaodong Bay while smaller than 30 cm in Bohai Bay and Laizhou Bay.
Figure 13 depicts differences in design ice thickness for different return periods between the present study and the 21-ice-zone standard. Compared with the design ice thickness for different return periods in the original 21-ice-zone standard, the latest results showed an overall decreasing trend in the Bohai Sea. The design ice thickness for 100-year and 50-year return periods significantly decreased along the west coast of the Bohai Sea compared to the original 21-ice-zone standard. The maximum decrease in coastal ice zones was 15 cm, and the zones with the largest decrease were mainly distributed in the coastal areas of Tianjin, Tangshan, Qinhuangdao, Jinzhou, and the west coast of Laizhou Bay.
Compared with the design ice thickness for different return periods in the original 21-ice-zone standard, the eastern sea area of Liaodong Bay increased slightly. There are two main reasons for the increase in design ice thickness for different return periods in this area. Firstly, the increasing trend of distribution of sea ice in Liaodong Bay was mild in the west and severe in the east, which is caused by the drift and accumulation of sea ice from west to east [18]. Secondly, the ice zone division in the CNOOC standard often uses coastal ice conditions to represent the ice conditions of the entire ice zone, and the new refined zoning method can more prominently depict the changes and differences between coastal and offshore ice zones.

4. Discussion and Conclusions

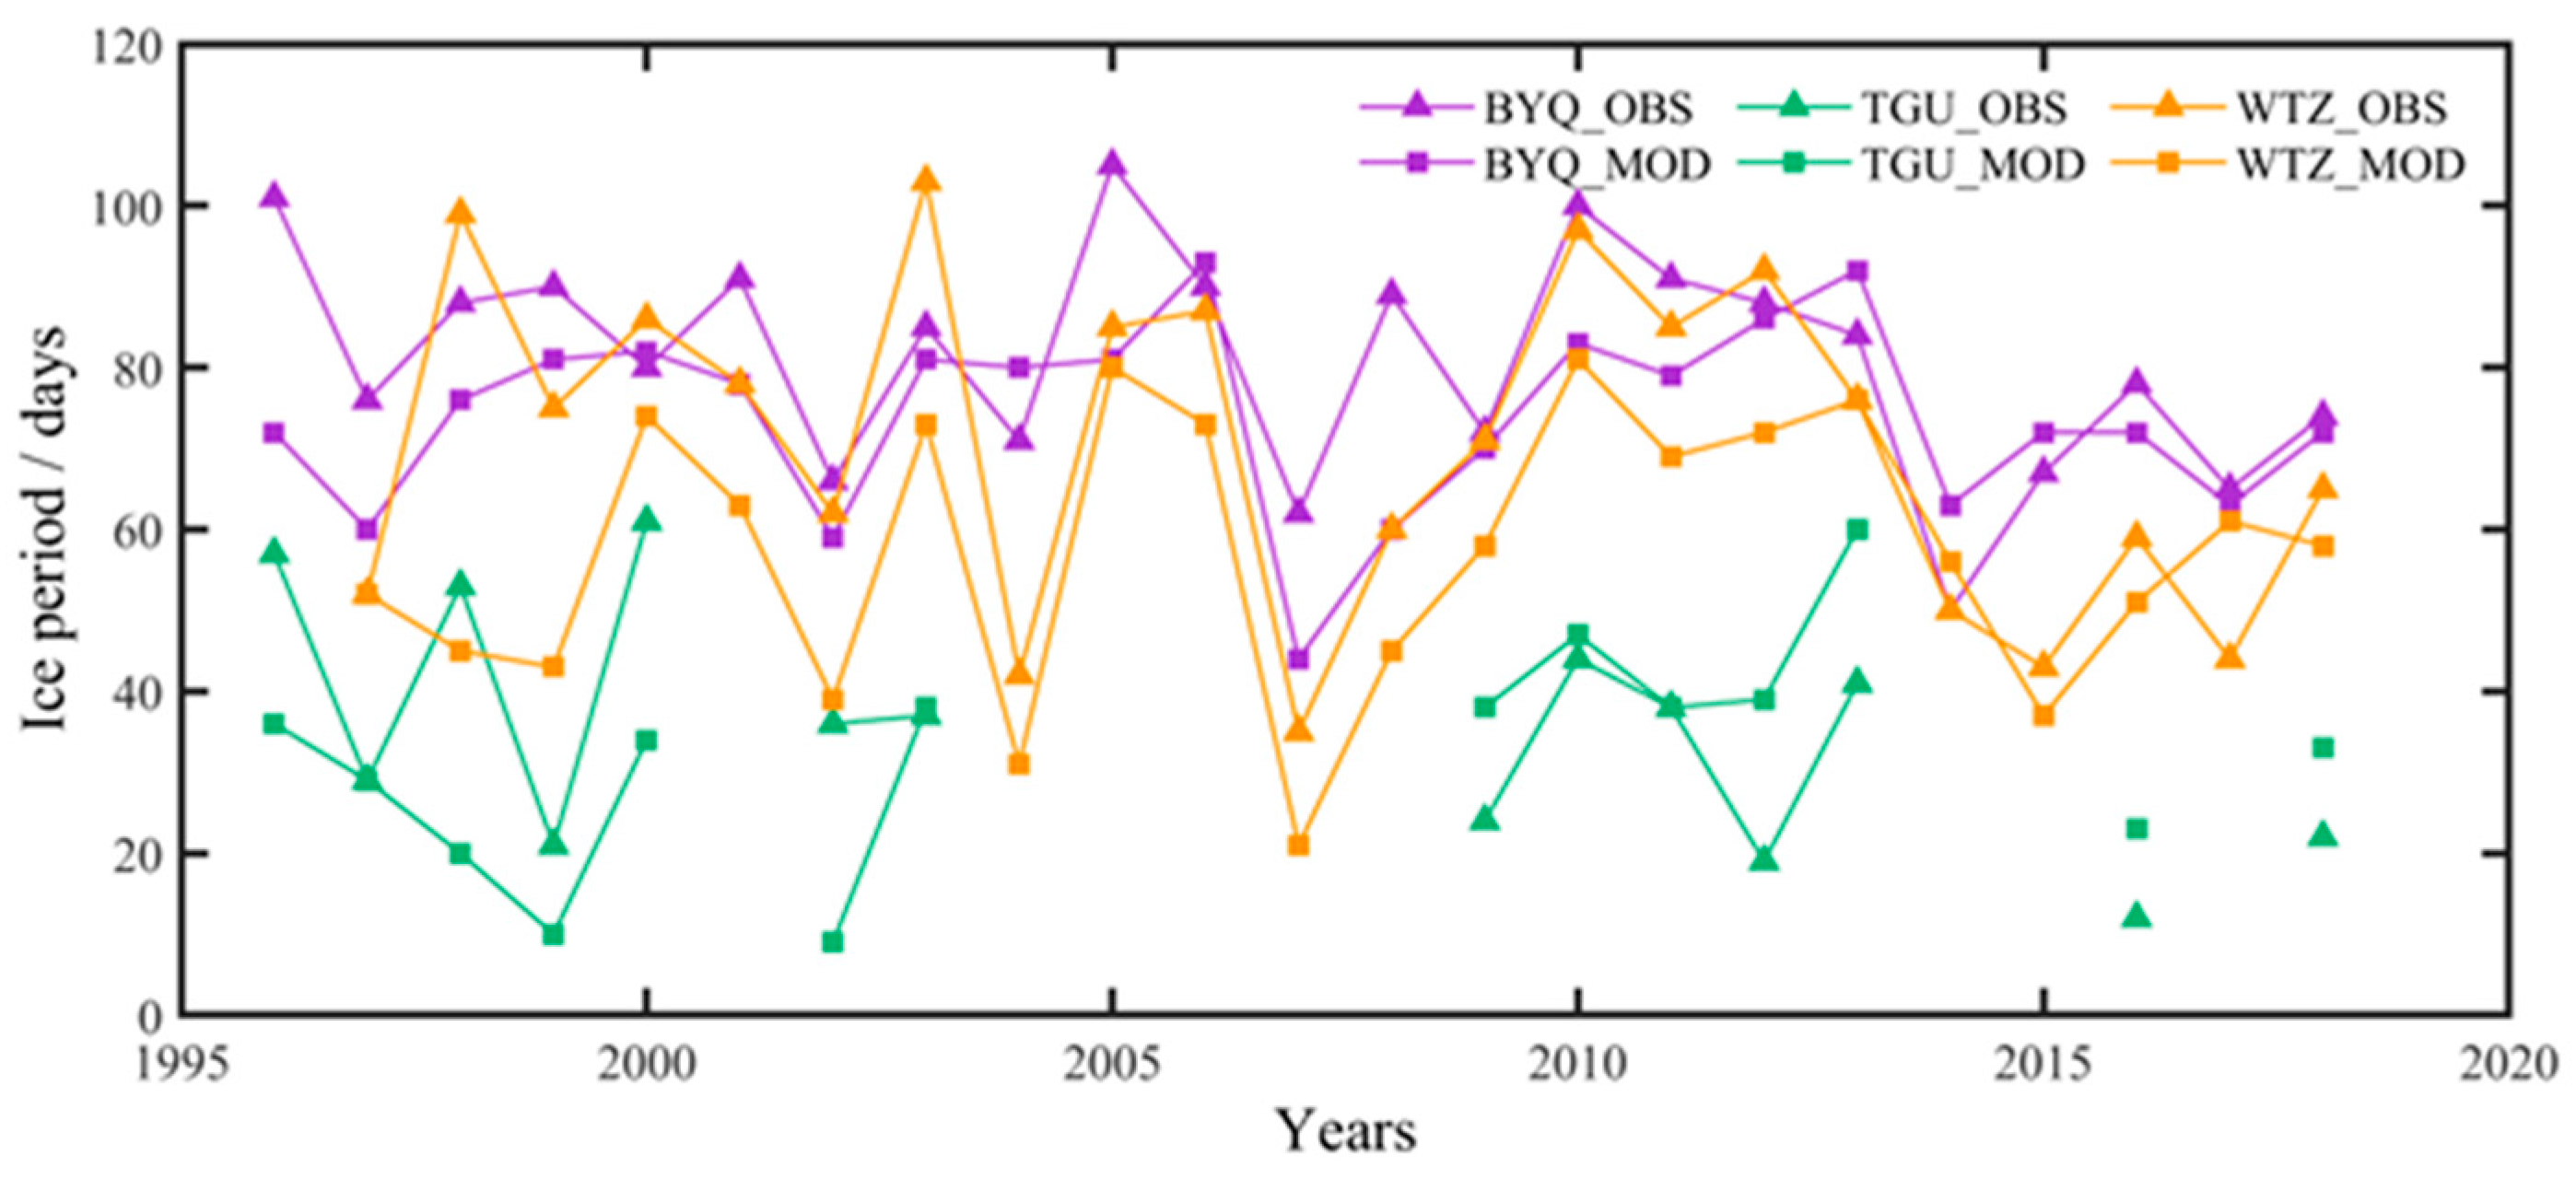
In this study, the ice conditions predicted by the numerical modeling were compared with the information observed at the ocean stations along the coast. As shown in Figure 6, the agreements between hindcasting data and observations were good in general, but the ice periods provided by the hindcasting data were shorter than the observed ice periods. One reason is that, as mentioned earlier, sea ice in the shallow shoals forms earlier and melts later. The difference also reflects the low applicability of such hindcasting numerical models for predicting ice conditions in shallow coastal waters. For sea ice forecasts in the vicinity of ocean stations with long-term observations, the method of artificial intelligence analysis can be considered, which may be more suitable for modeling the development of sea ice in shallow areas with complex topography, depth, and tide.
It is also noteworthy from Figure 2 that the sea ice development on the west coast of the Bohai Sea provided by hindcasting data was later and lighter than the information drawn from satellite observations. The reason is that the west coast of the Bohai Sea is the first affected area after the invasion of cold air from Siberia into the Bohai Sea. Therefore, this area is prone to the growth of large areas of sea ice in the short term. It is necessary to further adjust the parameter setting of the numerical model on the west coast of the Bohai Sea in future research work.
Sea ice modeling research is very dependent on the observation of ice conditions for validation, especially ice thickness. While the accuracy of the sea ice thickness derived from the satellite images is difficult to validate. In future research, the EM-31 aboard the ship in ice will be used to accumulate observational data on ice thickness, which is finally used to improve the accuracy of hindcasting data.
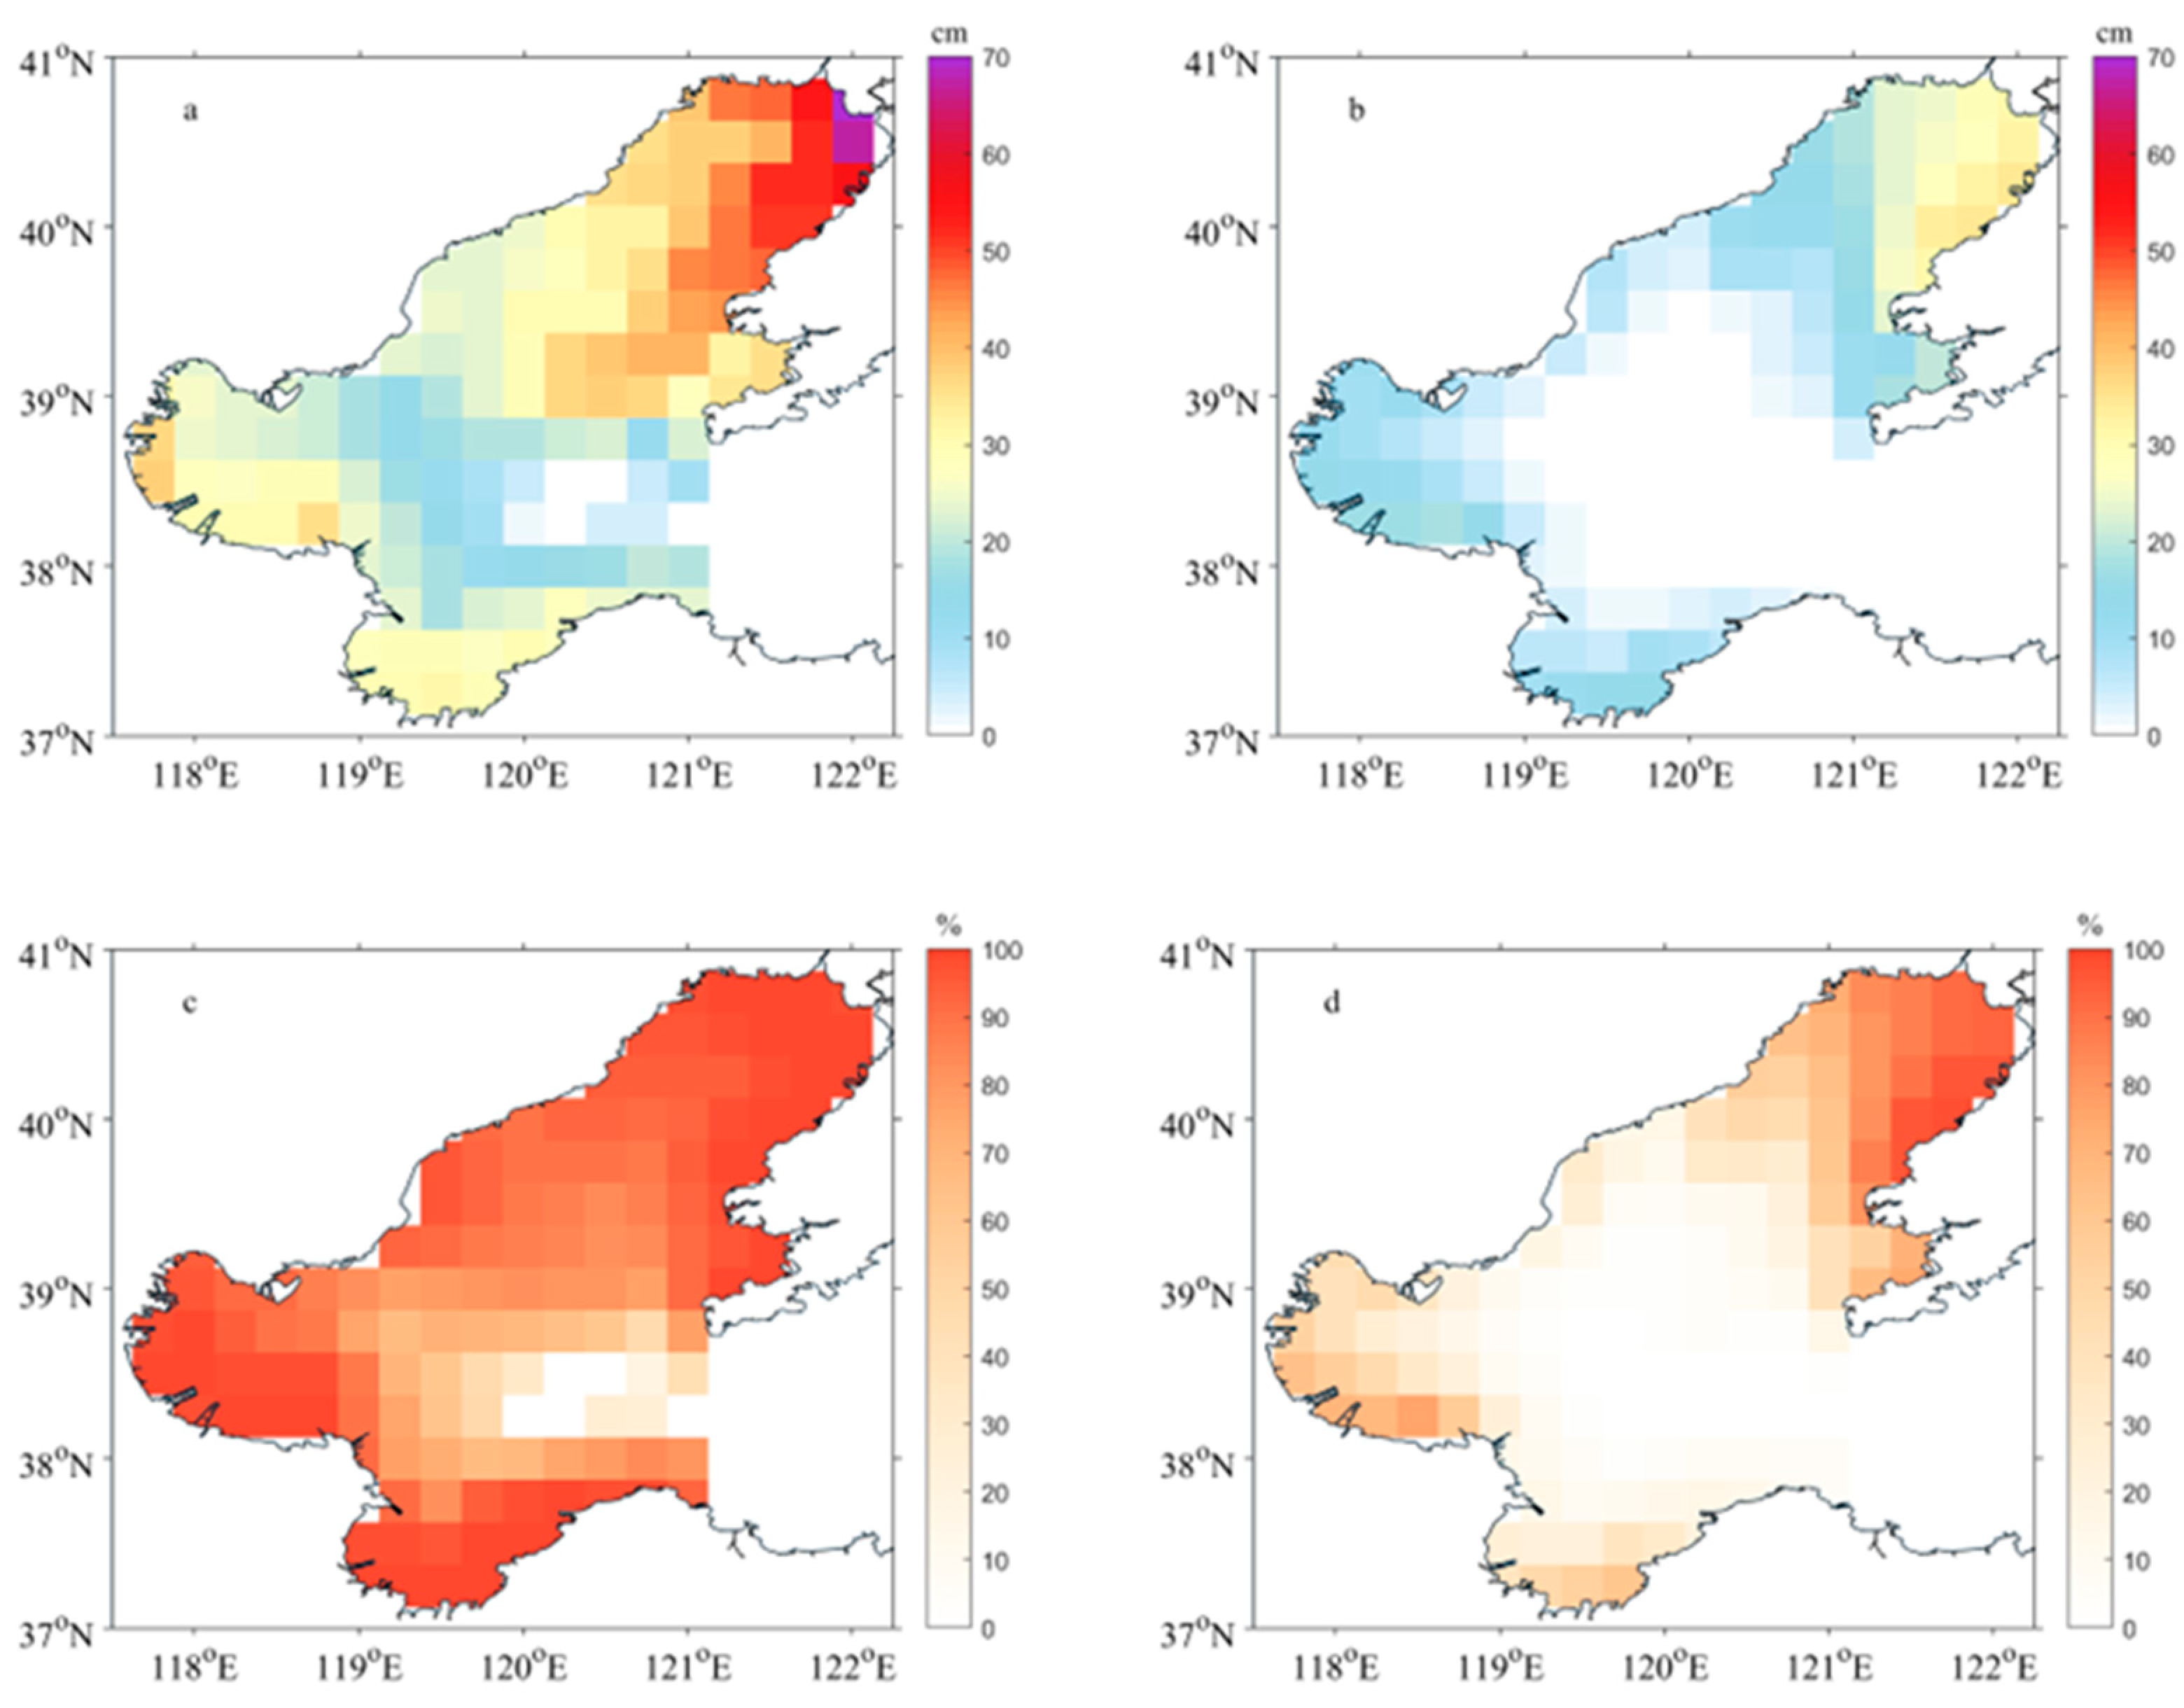
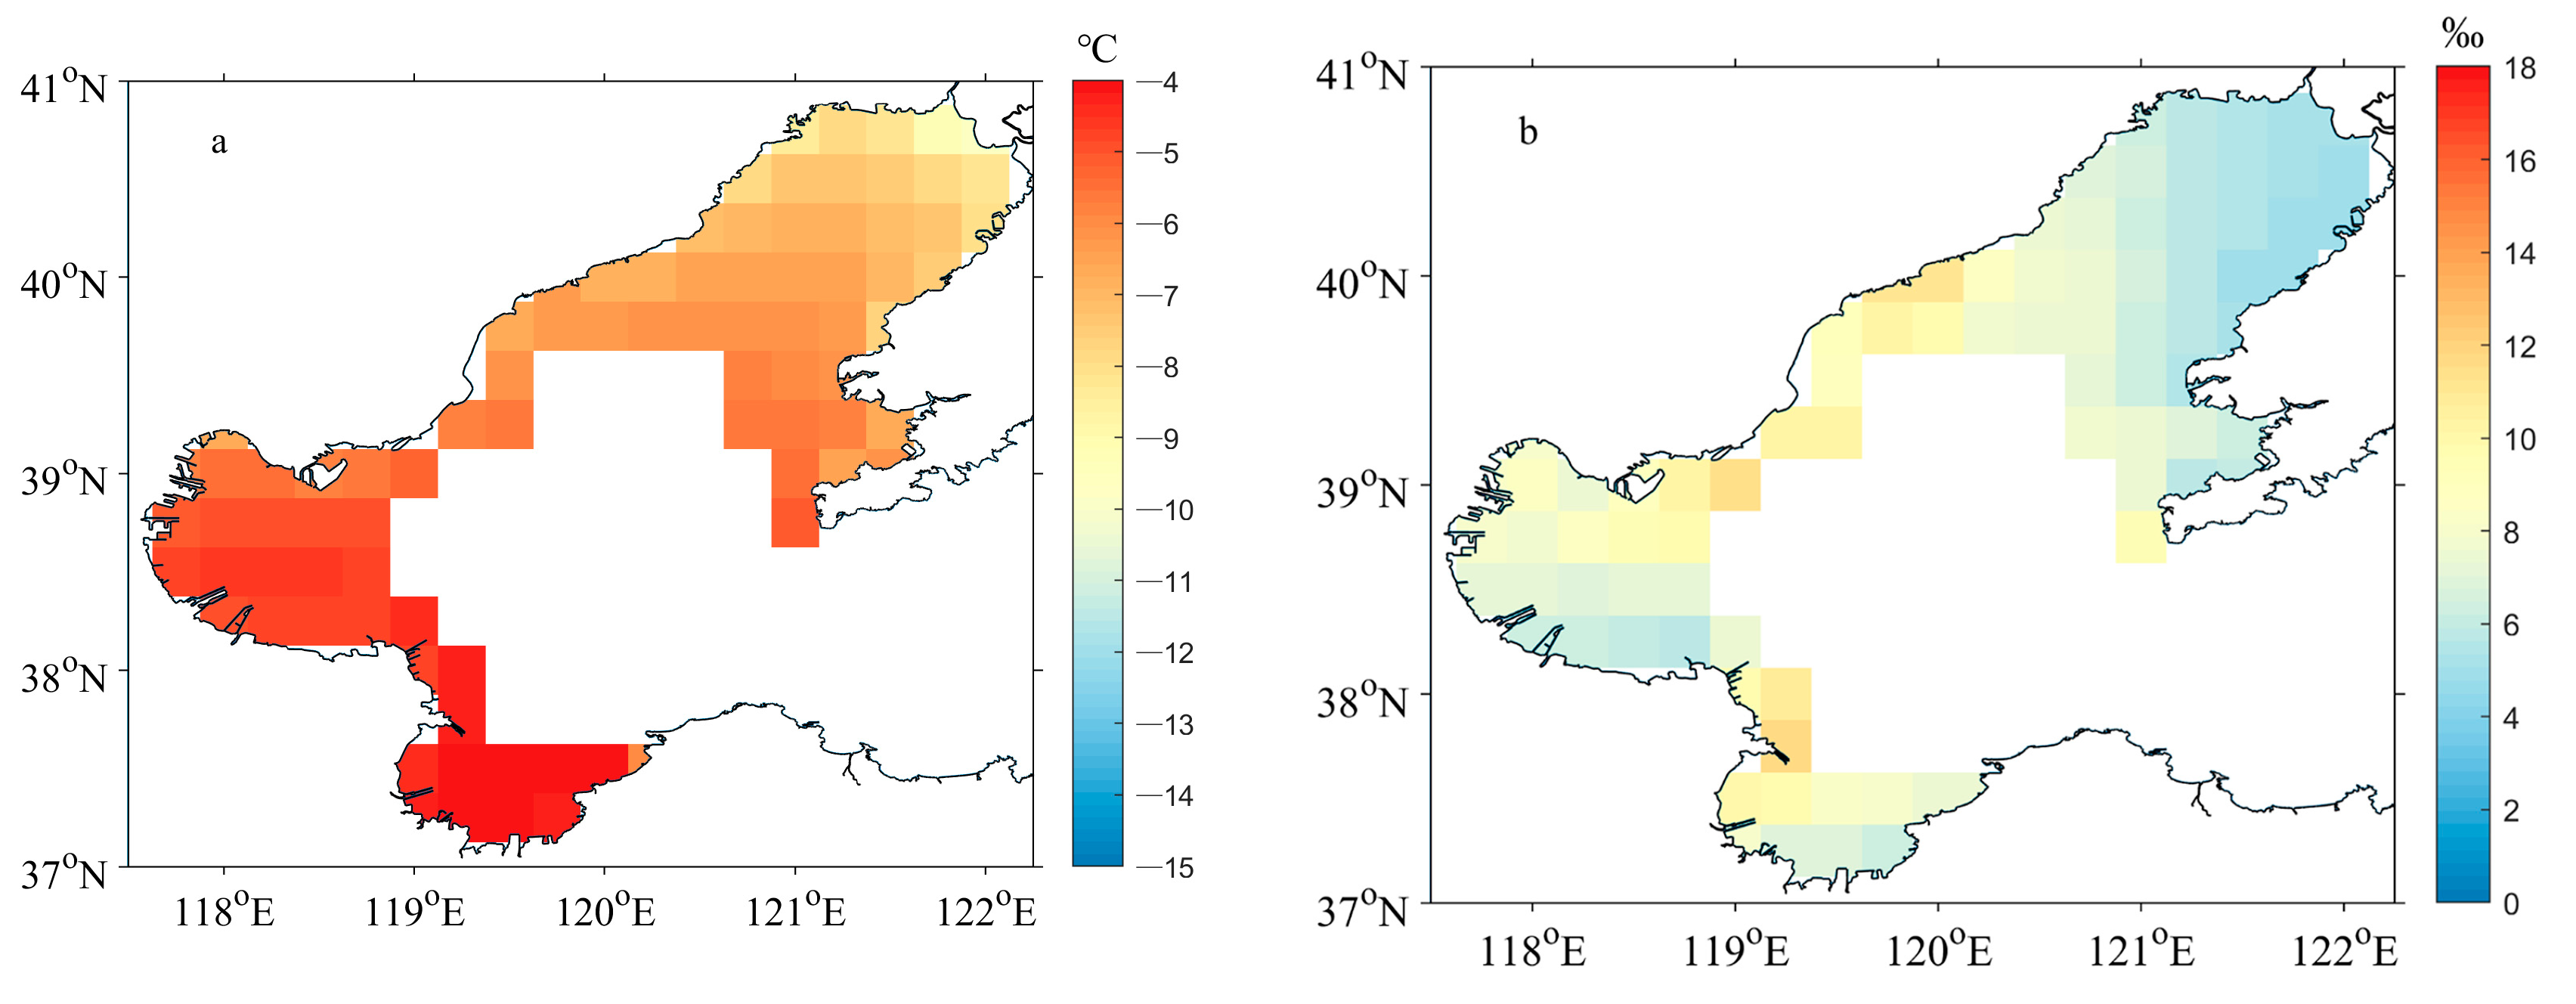
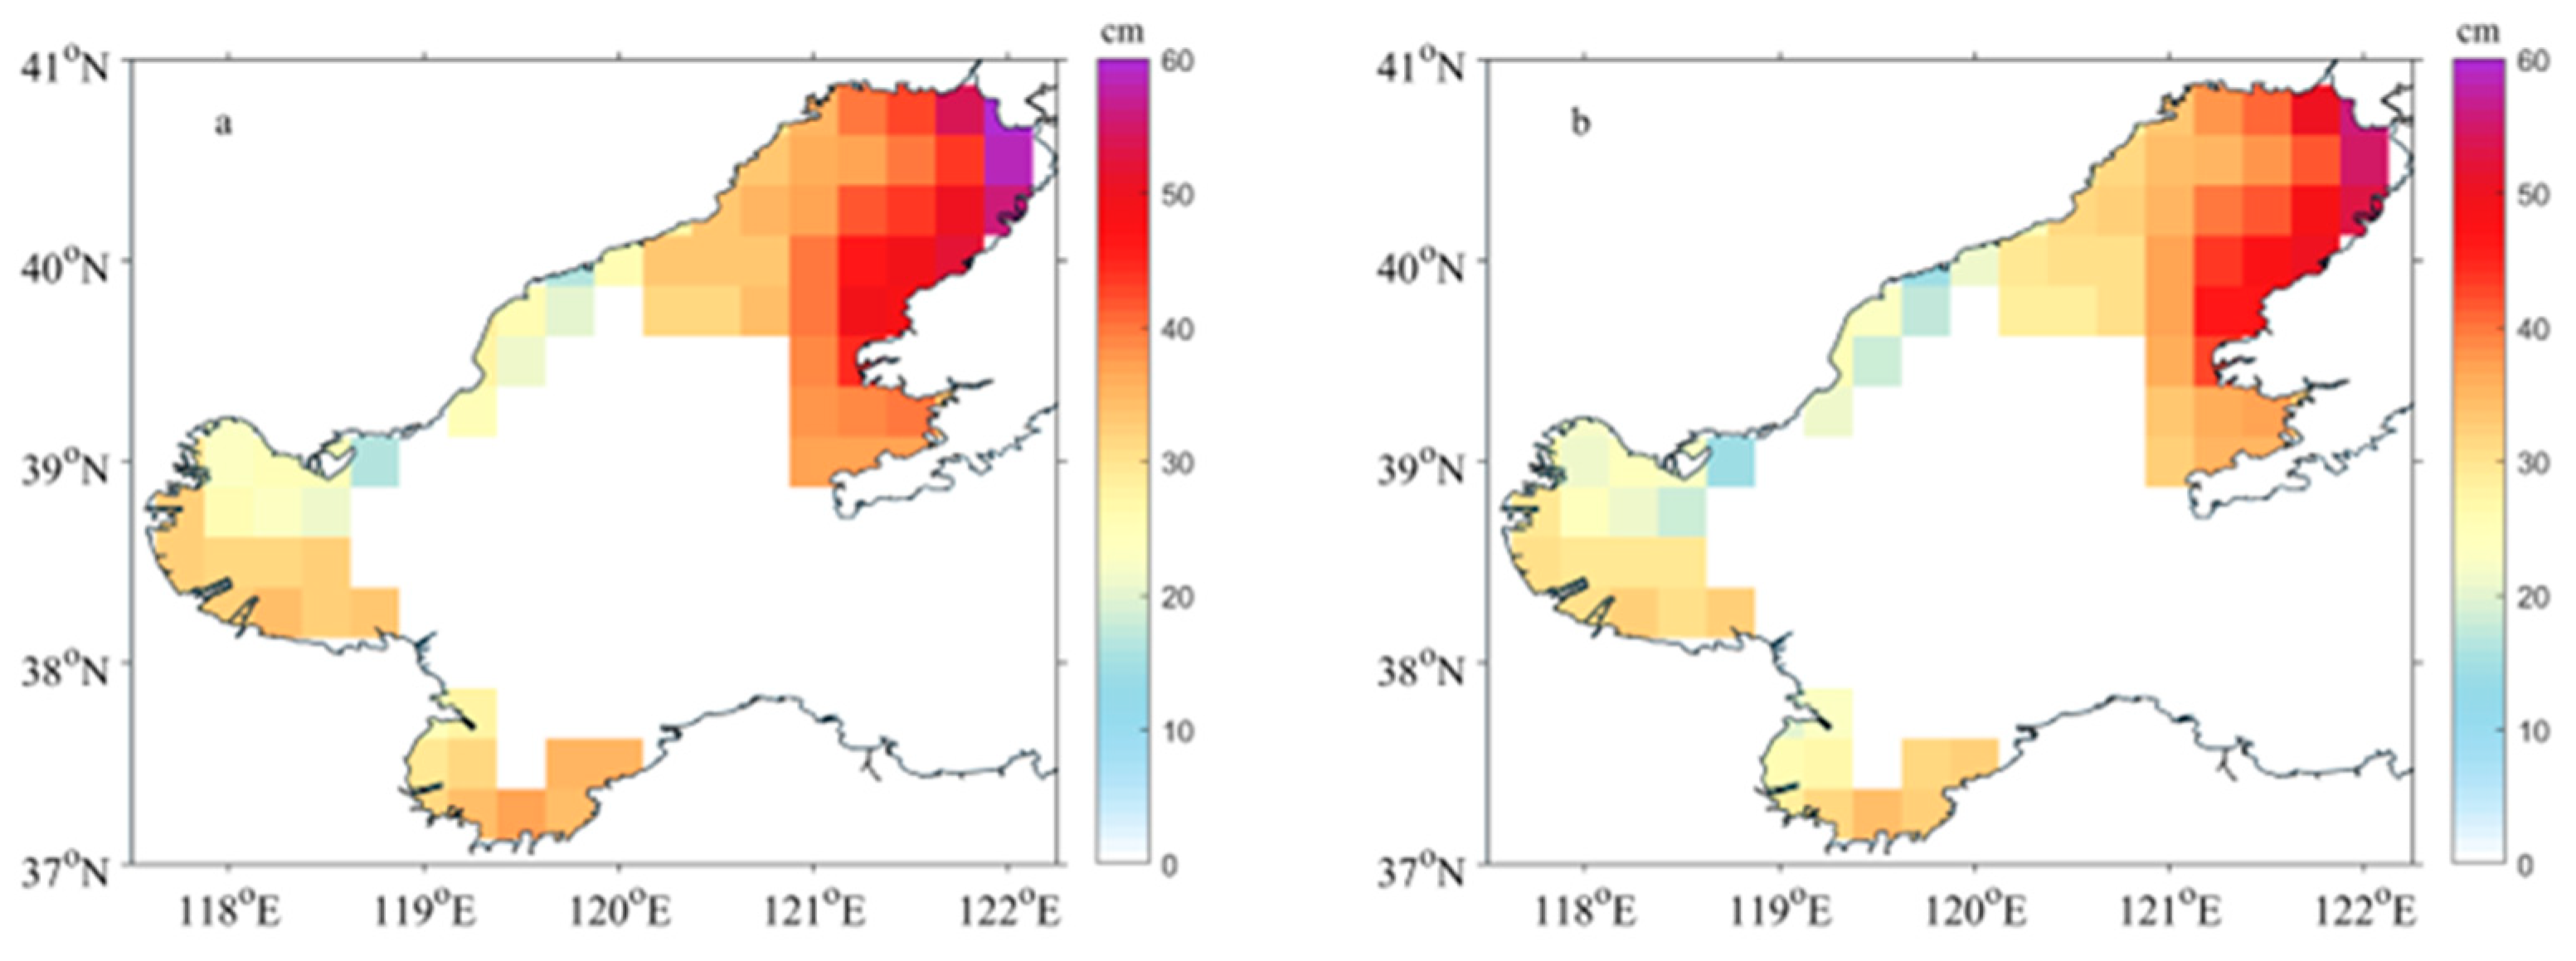
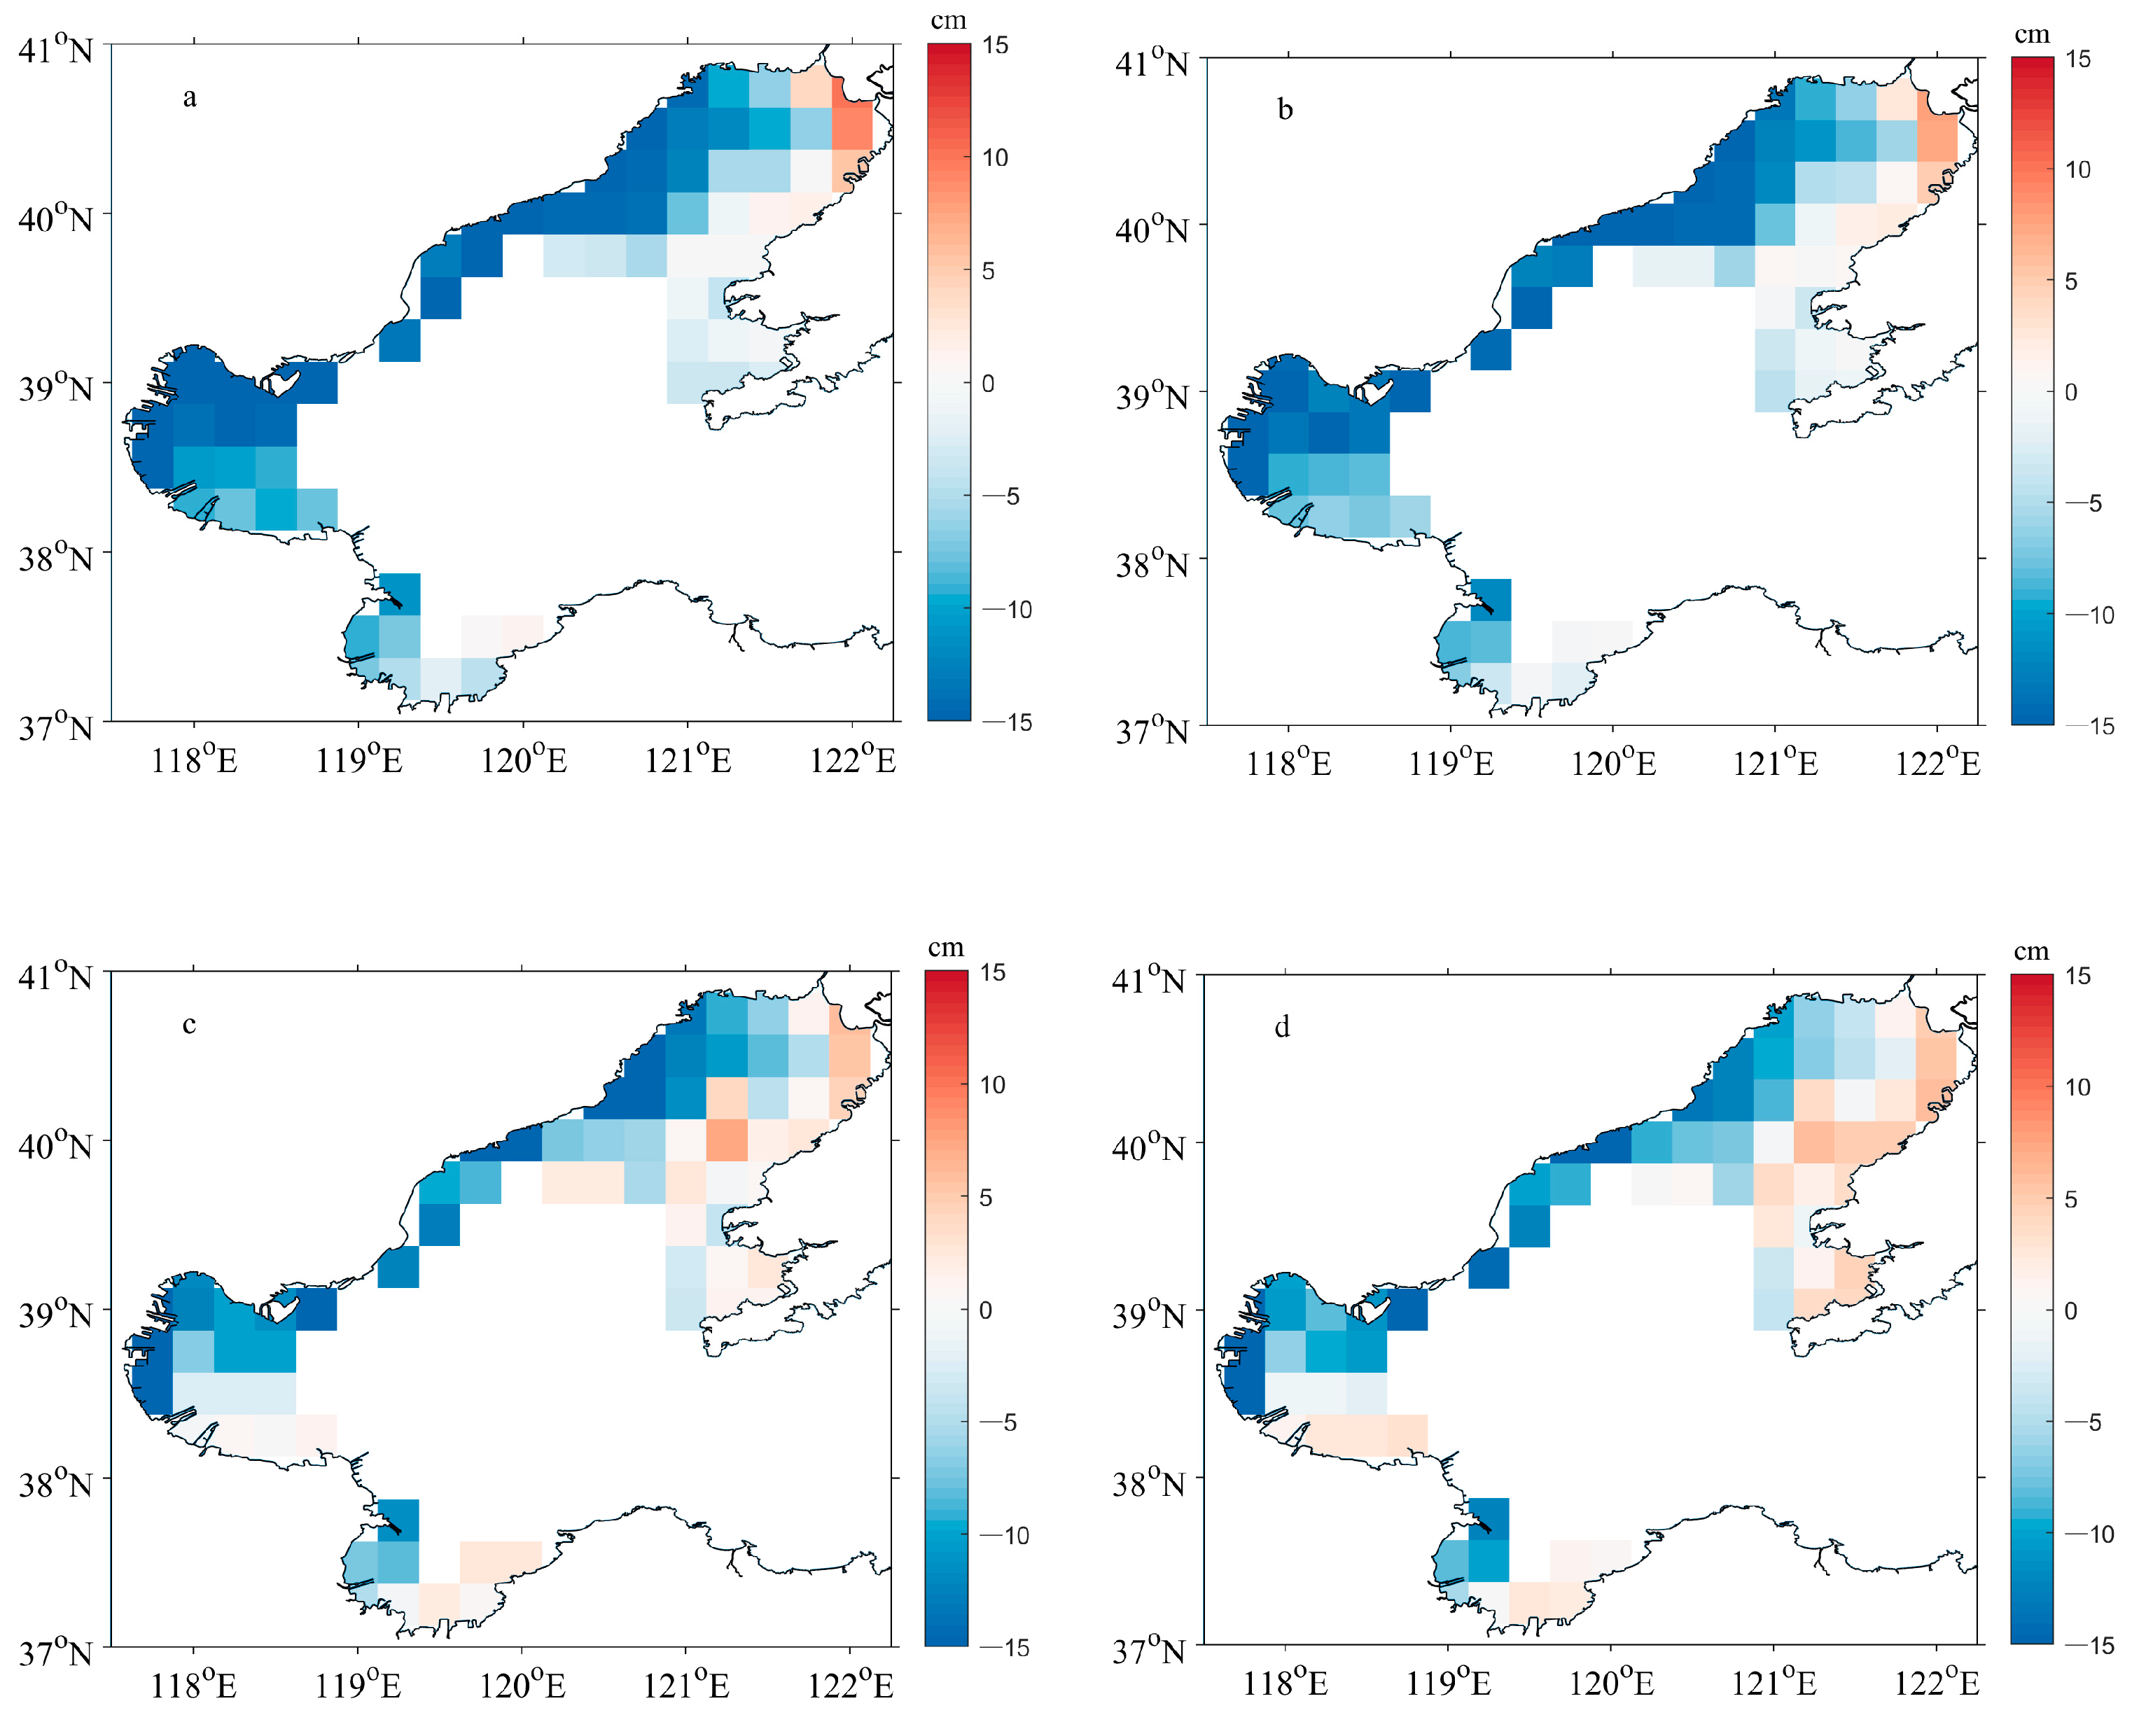
This study applied sea ice observations and hindcast data from the NEMO-LIM2 ice–ocean coupling model to establish a refined sea ice zone division in the Bohai Sea and analyzed the ice condition characteristics, including ice period, thickness, concentration, temperature, and salinity, as well as the design ice thickness for different return periods constructed by the average values of the P-III and Weibull methods. According to the analysis, the average effective ice temperature of the Bohai Sea shows a distribution trend of warm southwest and cold northeast, and the average effective ice salinity shows a low salinity distribution at the bottom of Liaodong Bay, southern Bohai Bay, and southern Laizhou Bay. The distribution of ice temperature and ice salinity is closely related to the distribution of ice thickness; that is, there is consistency in the distribution of low ice temperature, low ice salinity, and large ice thickness areas. The results of ice period, ice thickness, and ice concentration, as well as design ice thickness for different return periods and the comparison with the current standards of CNOOC, show that the design ice thickness on the west coast of the Bohai Sea has significantly decreased. The calculated values of design ice thickness on the east coast of Liaodong Bay have increased, indicating that the fine ice zone division has a more refined evaluation conclusion than the coarse ice zone division. At the same time, it is also a manifestation of the distribution pattern of mild ice conditions in the west and severe ice conditions in the east of Liaodong Bay. The analysis methods adopted in this paper can also be utilized in Arctic Sea ice engineering.

Author Contributions

Conceptualization, G.L. and X.C.; methodology, Y.J.; software, Y.Z.; validation, R.L.; formal analysis, D.G.; investigation, L.G.; resources, Q.H.; data curation, R.L.; writing—original draft preparation, G.L. and X.C.; writing—review and editing, Y.J. and Q.W. All authors have read and agreed to the published version of the manuscript.

Funding

This research was funded by the National Key Research and Development Program of China (2022YFE0107000).

Data Availability Statement

Data are contained within the article.

Acknowledgments

The authors thank the editor and anonymous reviewers for their valuable comments and suggestions to this paper.

Conflicts of Interest

The authors declare no conflicts of interest. The funders had no role in the design of the study; in the collection, analyses, or interpretation of data; in the writing of the manuscript; or in the decision to publish the results.

References

  1. Yang, G. Bohai sea ice conditions. J. Cold Reg. Eng. 2000, 14, 54–67. [Google Scholar] [CrossRef]
  2. Li, Z.; Zhang, L.; Lu, P.; Leppäranta, M.; Li, G. Experimental study on the effect of porosity on the uniaxial compressive strength of sea ice in Bohai Sea. Sci. China Technol. Sci. 2011, 54, 2429–2436. [Google Scholar] [CrossRef]
  3. Ouyang, L.; Hui, F.; Zhu, L.; Cheng, X.; Cheng, B.; Shokr, M.; Zhao, J.; Ding, M.; Zeng, T. The spatiotemporal patterns of sea ice in the Bohai Sea during the winter seasons of 2000-2016. Int. J. Digit. Earth 2019, 12, 893–909. [Google Scholar] [CrossRef]
  4. Tao, S.; Dong, S.; Wang, Z.; Guedes Soares, C. Intensity division of the sea ice zones in China. Cold Reg. Sci. Technol. 2018, 151, 179–187. [Google Scholar] [CrossRef]
  5. Li, Z.; Xiu, Y.; Wang, Q.; Li, G.; Lu, P.; Zhong, S.; Chen, X. On the method of design drift ice concentration and floe area for new-energy structures in ice-infested nearshore areas of the Bohai Sea, China. Front. Energy Res. 2022, 10, 947153. [Google Scholar] [CrossRef]
  6. Shen, Y. Sea Ice Intensity Division Based on Cluster Analysis in the Bohai Sea and the Northern of Yellow Sea. Master’ Thesis, Ocean University of China, Qingdao, China, 4 June 2013. (In Chinese). [Google Scholar]
  7. Liu, D.; Li, T.; Zhang, T.; Wang, J. Probabilistic analysis of sea ice conditions in the Liaodong Bay in the Bohai Gulf. J. Tianjin Univ. 1987, 4, 48–56. (In Chinese) [Google Scholar]
  8. Wu, H.; Yang, G.; Zhang, F.; Li, Y.; Zhang, M.; Li, H.; Li, H.; Wang, Z. Sea Ice Environment and Characteristics. In Sea Ice Design Operating Conditions in the Bohai Sea; China Ocean Press: Beijing, China, 2001; pp. 3–8. (In Chinese) [Google Scholar]
  9. Zhang, X.; Zhang, Z.; Xu, Z.; Li, G.; Sun, Q.; Hou, X. Sea ice disaster and their impacts since 2010 in Laizhou Bay of Bohai Sea, China. Nat. Hazards 2013, 65, 27–40. [Google Scholar] [CrossRef]
  10. Wang, A.; Tang, M.; Zhao, Q.; Liu, Y.; Li, B.; Shi, Y.; Sui, J. Analysis of sea ice parameters for the design of an offshore wind farm in the Bohai Sea. Ocean Eng. 2021, 239, 109902. [Google Scholar] [CrossRef]
  11. Yu, J.; Fu, Y.; Yu, Y.; Wu, S.; Wu, Y.; You, M.; Li, M. Assessment of offshore wind characteristics and wind energy potential in Bohai Bay, China. Energies 2019, 12, 2879. [Google Scholar] [CrossRef]
  12. Chao, J.; Gu, W.; Li, Y.; Xu, Y.; Zhang, H.; Tao, J. Temporal and spatial distribution characteristics of the effective wind and solar energy in the Bohai Bay coastal area. J. Renew. Sustain. Energy 2014, 6, 043133. [Google Scholar] [CrossRef]
  13. Wang, Z.; Dong, S.; Li, X.; Guedes Soares, C. Assessments of wave energy in the Bohai Sea, China. Renew. Energy 2016, 90, 145–156. [Google Scholar] [CrossRef]
  14. Li, Z.; Sui, J.; Dong, X.; Meng, G. Preliminary statistics of some sea ice conditions in Liaodong Gulf. Ocean. Eng. 1992, 10, 72–78. (In Chinese) [Google Scholar]
  15. Li, Z. Field investigation of sea ice in the Liaodong Gulf. Mar. Forecast. 1999, 16, 48–56. (In Chinese) [Google Scholar]
  16. Li, Z.; Lu, P.; Devinder, S.S. Ice engineering sub- areas in Bohai from ice physical and mechanical parameters. Adv. Water Res. 2004, 15, 598–602. (In Chinese) [Google Scholar]
  17. Yan, Y.; Gu, W.; Xu, Y.; Li, Q. The in situ observation of modelled sea ice drift characteristics in the Bohai Sea. Acta Oceanol. Sin. 2019, 38, 17–25. [Google Scholar] [CrossRef]
  18. Ma, Y.; Cheng, B.; Xu, N.; Yuan, S.; Shi, H.; Shi, W. Long-term ice conditions in Yingkou, a coastal region northeast of the Bohai Sea, between 1951/1952 and 2017/2018: Modeling and Observations. Remote Sens. 2022, 14, 182. [Google Scholar] [CrossRef]
  19. Zhang, B. Regulations for Offshore Ice Condition & Application in China Sea; China National Offshore Oil Corporation: Beijing, China, 2002; Q/HSn 3000-2002. [Google Scholar]
  20. Yan, Y.; Gu, W.; Gierisch, A.M.U.; Xu, Y.; Uotila, P. NEMO-Bohai 1.0: A high-resolution ocean and sea ice modelling system for the Bohai Sea, China. Geosci. Model Dev. 2022, 15, 1269–1288. [Google Scholar] [CrossRef]
  21. Uotila, P.; Iovino, D.; Vancoppenolle, M.; Lensu, M.; Rousset, C. Comparing sea ice, hydrography and circulation between NEMO3.6 LIM3 and LIM2. Geosci. Model Dev. 2017, 10, 1009–1031. [Google Scholar] [CrossRef]
  22. Chen, W.; Tenzer, R. Harmonic coefficients of the Earth’s Spectral Crustal Model 180-ESCM180. Earth Sci. Inform. 2015, 8, 147–159. [Google Scholar] [CrossRef]
  23. Toye, H.; Sanikommu, S.; Raboudi, N.F.; Hoteit, I. A hybrid ensemble adjustment Kalman filter based high-resolution data assimilation system for the Red Sea: Implementation and evaluation. Q. J. R. Meteorol. Soc. 2020, 146, 4108–4130. [Google Scholar] [CrossRef]
  24. Xv, N.; Chen, W.; Yuan, S.; Yue, Q.; Li, Z.; Ji, S.; Liu, X.; Shi, W.; Zhang, D.; Wang, R. The Specification for Engineering Sea Ice Techniques; State Oceanic Administration: Beijing, China, 2016; HY/T 047-2016. [Google Scholar]
  25. Gong, S.; Chen, W.; Zhang, C.; Yan, Q.; Hong, Y. Variability of sea ice from 2008 to 2019 in the Bohai and northern Huanghai Sea, China and the relationship with climatic factors. J. Ocean Univ. 2022, 21, 1189–1197. [Google Scholar] [CrossRef]
  26. Ma, Y.; Guan, P.; Xu, N.; Xu, Y.; Yuan, S.; Liu, Y.; Yu, F. Determination of the sea ice parameters for the reliability design of the marine structures in Liaodong Bay. Ocean. Eng. 2019, 37, 136–142. (In Chinese) [Google Scholar] [CrossRef]
  27. Tao, S.; Dong, S. Interval estimation of return sea ice thickness in the northern area of Bohai Sea based on maximum likelihood method. Eng. Mech. 2013, 30, 294–298. (In Chinese) [Google Scholar] [CrossRef]
Figure 1. 1/4°-resolution sea ice zoning in the Bohai Sea.
Water 16 00290 g001
Figure 2. Distribution map of sea ice concentration from the (a) MODIS, (b) NEMO-LIM2 model, and (c) assimilated model data.
Water 16 00290 g002
Figure 3. Distribution map of (a) sea ice concentration difference and (b) assimilation adjustment amount.
Water 16 00290 g003
Figure 4. Errors in sea ice concentration before and after the assimilation of MODIS data into the NEMO3.6 ocean model in the Bohai Sea in the winter of 2021/2022. For each column, the blue bar represents the sea ice concentration error after the assimilation, and the red bar represents the difference between the sea ice concentration error before and after the assimilation.
Water 16 00290 g004
Figure 5. Comparisons of hindcasting sea ice thickness data and observations from (a) JZ9-3 and (b) JZ20-2 oil platforms in the winters of 2010–2018. The blue lines represent the observations, and the red lines represent the hindcasting sea ice thickness.
Water 16 00290 g005
Figure 6. Comparisons of ice period from ocean stations and numerical model. The purple, green, and orange lines represent the Bayuquan (BYQ), Tanggu (TGU), and Wentuozi (WTZ) ocean stations, respectively. Lines with triangle and square marks represent observations from ocean stations and hindcasting data from the grid cell closest to the ocean station, respectively.
Water 16 00290 g006
Figure 7. Average severe ice period in the Bohai Sea from 2005 to 2022.
Water 16 00290 g007
Figure 8. (a) Maximum sea ice thickness, (b) average sea ice thickness, (c) maximum sea ice concentration, and (d) average sea ice concentration in the Bohai Sea from 2005 to 2022.
Water 16 00290 g008
Figure 9. Differences in average severe ice period between the present study and the 21-ice-zone standard.
Water 16 00290 g009
Figure 10. Differences in (a) maximum sea ice thickness, (b) average sea ice thickness, (c) maximum sea ice concentration, and (d) average sea ice concentration between the present study and the 21-ice-zone standard.
Water 16 00290 g010
Figure 11. (a) Average ice temperature and (b) average ice salinity in the Bohai Sea from 2005 to 2022, calculated using Equations (1) and (2).
Water 16 00290 g011
Figure 12. Design ice thickness for (a) 100-year, (b) 50-year, (c) 25-year, and (d) 10-year return periods in the Bohai Sea.
Water 16 00290 g012aWater 16 00290 g012b
Figure 13. Differences in design ice thickness for (a) 100-year, (b) 50-year, (c) 25-year, and (d) 10-year return periods between the present study and the 21-ice-zone standard.
Water 16 00290 g013
Disclaimer/Publisher’s Note: The statements, opinions and data contained in all publications are solely those of the individual author(s) and contributor(s) and not of MDPI and/or the editor(s). MDPI and/or the editor(s) disclaim responsibility for any injury to people or property resulting from any ideas, methods, instructions or products referred to in the content.

