Article

Steady-State and Dynamic Simulation for Wastewater Treatment Plant Management: Case Study of Maghnia City, North-West Algeria

by
Sidi Mohamed Tiar
1,2,
Madani Bessedik
1,2,
Chérifa Abdelbaki
1,2,
Nadia Badr ElSayed
3,
Abderrahim Badraoui
1,2,
Amaria Slimani
4 and
Navneet Kumar
5,6,*
1
Department of Hydraulics, Faculty of Technology, University of Tlemcen, P.O. Box 230, Tlemcen 13000, Algeria
2
Laboratoire Eau et Ouvrages dans leur Environnement (EOLE), University of Tlemcen, P.O. Box 230, Tlemcen 13000, Algeria
3
Environmental Sciences Department, Faculty of Science, Alexandria University, Alexandria 21511, Egypt
4
National Office of Sanitation, Tlemcen 13000, Algeria
5
Department of Ecology and Natural Resources Management, Center for Development Research (ZEF), University of Bonn, Genscherallee 3, 53113 Bonn, Germany
6
Global Mountain Safeguard Research (GLOMOS), United Nations University, United Nations Campus, Platz der Vereinten Nationen 1, 53113 Bonn, Germany
*
Author to whom correspondence should be addressed.
Water 2024, 16(2), 269; https://doi.org/10.3390/w16020269
Submission received: 3 November 2023 / Revised: 21 December 2023 / Accepted: 9 January 2024 / Published: 12 January 2024
(This article belongs to the Section Urban Water Management)

Abstract

:
Given the critical importance of addressing effluent quality concerns, the present study was dedicated to developing a dynamic simulation model based on the Activated Sludge Model 1 (ASM1) of a wastewater treatment plant located in Maghnia City, Algeria. The model calibration process involved collecting and analyzing 56 samples from the plant over a period of 18 months (from July 2021 to January 2023). Thirteen physicochemical parameters were analyzed to identify the variations in their water quality over time. Stoichiometric and kinetic parameters were adjusted during the plant calibration process. These modifications resulted in a reasonable alignment with the investigated variables, enabling the accurate prediction of the wastewater treatment plants (WWTPs)’ steady-state behavior regarding the removal measurements of chemical oxygen demand (COD), total suspended solids (TSS), and ammonium (NH4-N). The model was validated using 14-day measurements spanning a 4-month duration, and the results indicated good agreement between the observed and simulated effluent variable of chemical oxygen demand (COD) with a root mean square error (RMSE) of 23%. These findings highlight the utility of the ASM1 Model in comprehending and managing the intricate dynamics of the activated sludge process in wastewater treatment plants.

1. Introduction

Activated sludge systems (ASS) have become a widely preferred choice for wastewater treatment plants (WWTPs) worldwide as their usage has increased significantly over the past decade. These systems have evolved to incorporate more complex processes, reflecting the advancements in operational techniques and strategies within the field of wastewater treatment. This complexity has increased dramatically due to the requirements for removing nitrogenous and phosphor components together with carbonation ones. The simulation of biological wastewater treatment helps to understand and operate the treatment plant and can reduce operational costs and improve the treatability [1].
The activated sludge treatment process comprises two key elements: the reactor, where pollution is primarily broken down through biological mechanisms, and the clarifier, which separates treated water from biomass and other particulate matter using physical processes [2]. However, activated sludge processes become complicated because of their changing physical characteristics and the variability of the pollution load of raw wastewater [3]. In the same context, operators of wastewater treatment plants are often reluctant to test new or different designs or control strategies on a real plant because the process can exhibit unexpected behavior [4]. This underscores the necessity of modeling and simulations, not only to characterize the various stages and processes within the treatment procedure but also to forecast outcomes under various management scenarios [5].
The mathematical modelling of the activated sludge process provides a robust tool for design, operational support, predicting projected behavior, and process control [3,6]. In this regard, the International Water Association (IWA) developed activated sludge models (ASMs) over the past two decades. These models, including ASM1, ASM2, and ASM3, are widely acknowledged for their effectiveness in simulating carbon oxidation, nitrification/denitrification, and biological phosphorus removal processes [7,8] under different operating conditions [9].
ASM1, one of the well-recognized IWA models, has garnered considerable acceptance among researchers. It is also the most widely used biokinetic model, accounting for 57% of its usage among other models [10,11]. Several studies applying ASM1 to diverse biological processes, especially activated sludge, have proven its effectiveness and practicality. Baek et al. [12] utilized ASM1 to analyze an aerobic membrane bioreactor’s (MBR) performance, considering factors such as hydraulic retention time (HRT), sludge retention time (SRT), and mixed-liquor suspended solid (MLSS) concentrations; the model showed that the MBR performances were unaffected by varying operational conditions. Elshorbagy and Shawaqfah [13] developed a dynamic simulation model for an activated sludge process and calibrated and validated ASM1 with GPS-X simulations. The findings indicated significant concordance for COD and TSS while displaying relatively weaker agreement for NH4-N. Mohammadi et al. [14] evaluated ASM1′s consistency with data from a wastewater treatment plant in Isfahan, Iran; the experimental results for COD, total kjeldahl nitrogen (TKN), and TSS showed good adoption with model outputs. Additionally, Lahdhiri et al. [15] proposed a simplified version of ASM1, which is useful for estimating state variables and analyzing operating parameters, particularly in membrane bioreactor processes. The steady-state expressions revealed pleasing predictions of the concentrations of the state variables (SRT, HRT, soluble biodegradable substrate (Ss) and particulate inert substrate (Xi)).
The accurate calibration of these models plays a crucial role in achieving the aforementioned objectives. This calibration process involves the precise estimation of various stoichiometric and kinetic model parameters. Earlier studies have employed various calibration approaches to model the dynamic behavior of ASS. Typically, this calibration process involves extensive sampling programs, chemical and biological analyses, and laboratory experiments using diverse methods to determine numerous stoichiometric and kinetic parameters required [16]. However, this process is often considered time-consuming and costly, demanding meticulousness and accuracy to generate precise and representative results. It is important to acknowledge that uncertainties related to measurements, analyses, experimental work, and modelling approaches could introduce potential inaccuracies, thus requiring careful interpretation of the outcomes [17,18,19,20].
In practical applications of WWTPs, the dynamics and stoichiometric parameters of ASM1 must be ascertained while considering variations in operational conditions and external environments [21]. This acknowledgment underscores the potential divergence between model predictions and real outcomes when relying solely on IWA’s standardized parameters. Consequently, it is crucial to adjust the parameter values of ASM1 to ensure successful application of the model in practical scenarios. The imperative need to develop a dynamic simulation model at the Maghnia City Wastewater Treatment Plant (MCWWTP) is underscored by pressing concerns regarding effluent quality deterioration and international standard violations. This model holds the potential to significantly improve effluent quality control by providing real-time insights into system behavior. Furthermore, it assumes a central role in streamlining the planning of optimal design and operational strategies for the plant’s upgrade initiative. By means of dynamic simulations, the WWTP can proactively identify and rectify factors contributing to effluent quality decline, thus ensuring adherence to international standards and fostering sustainable wastewater management in the region.
This study’s primary objectives encompassed conducting a comprehensive wastewater characterization of influent COD at MCWWTP, involving the necessary fractionation of COD influent into Ss, soluble inert substrate (Si), particulate biodegradable substrate (Xs), and Xi components. The study aimed to provide a mathematical description of the plant verifying the predictability of the ASM1 under steady-state and dynamic conditions; this verification involved fine-tuning the model’s performance through calibration, wherein observed concentration values of COD, TSS, and NH4-N parameters were derived from routinely collected process data on effluent wastewater.

2. Materials and Methods

2.1. Study Area

The area under investigation is the region of Maghnia, a town in the wilaya of Tlemcen, Algeria (latitude: 34.85, longitude: −1.68) (Figure 1). It is a semi-arid zone located in the northwestern region of Algeria, 27 km east of Oujda (Morocco), 26 km west of Tlemcen and about 60 km from the coast. The region is extended over an area of 294 km2 with a population of 114,634 inhabitants [22]. The drought that occurred in Algeria during the past few decades has impacted the entire country, and more particularly its northwestern part [23]. Our study region, Maghnia is part of the Northwestern Oran coastal river basin.

2.2. Description of Maghnia City Wastewater Treatment Plant

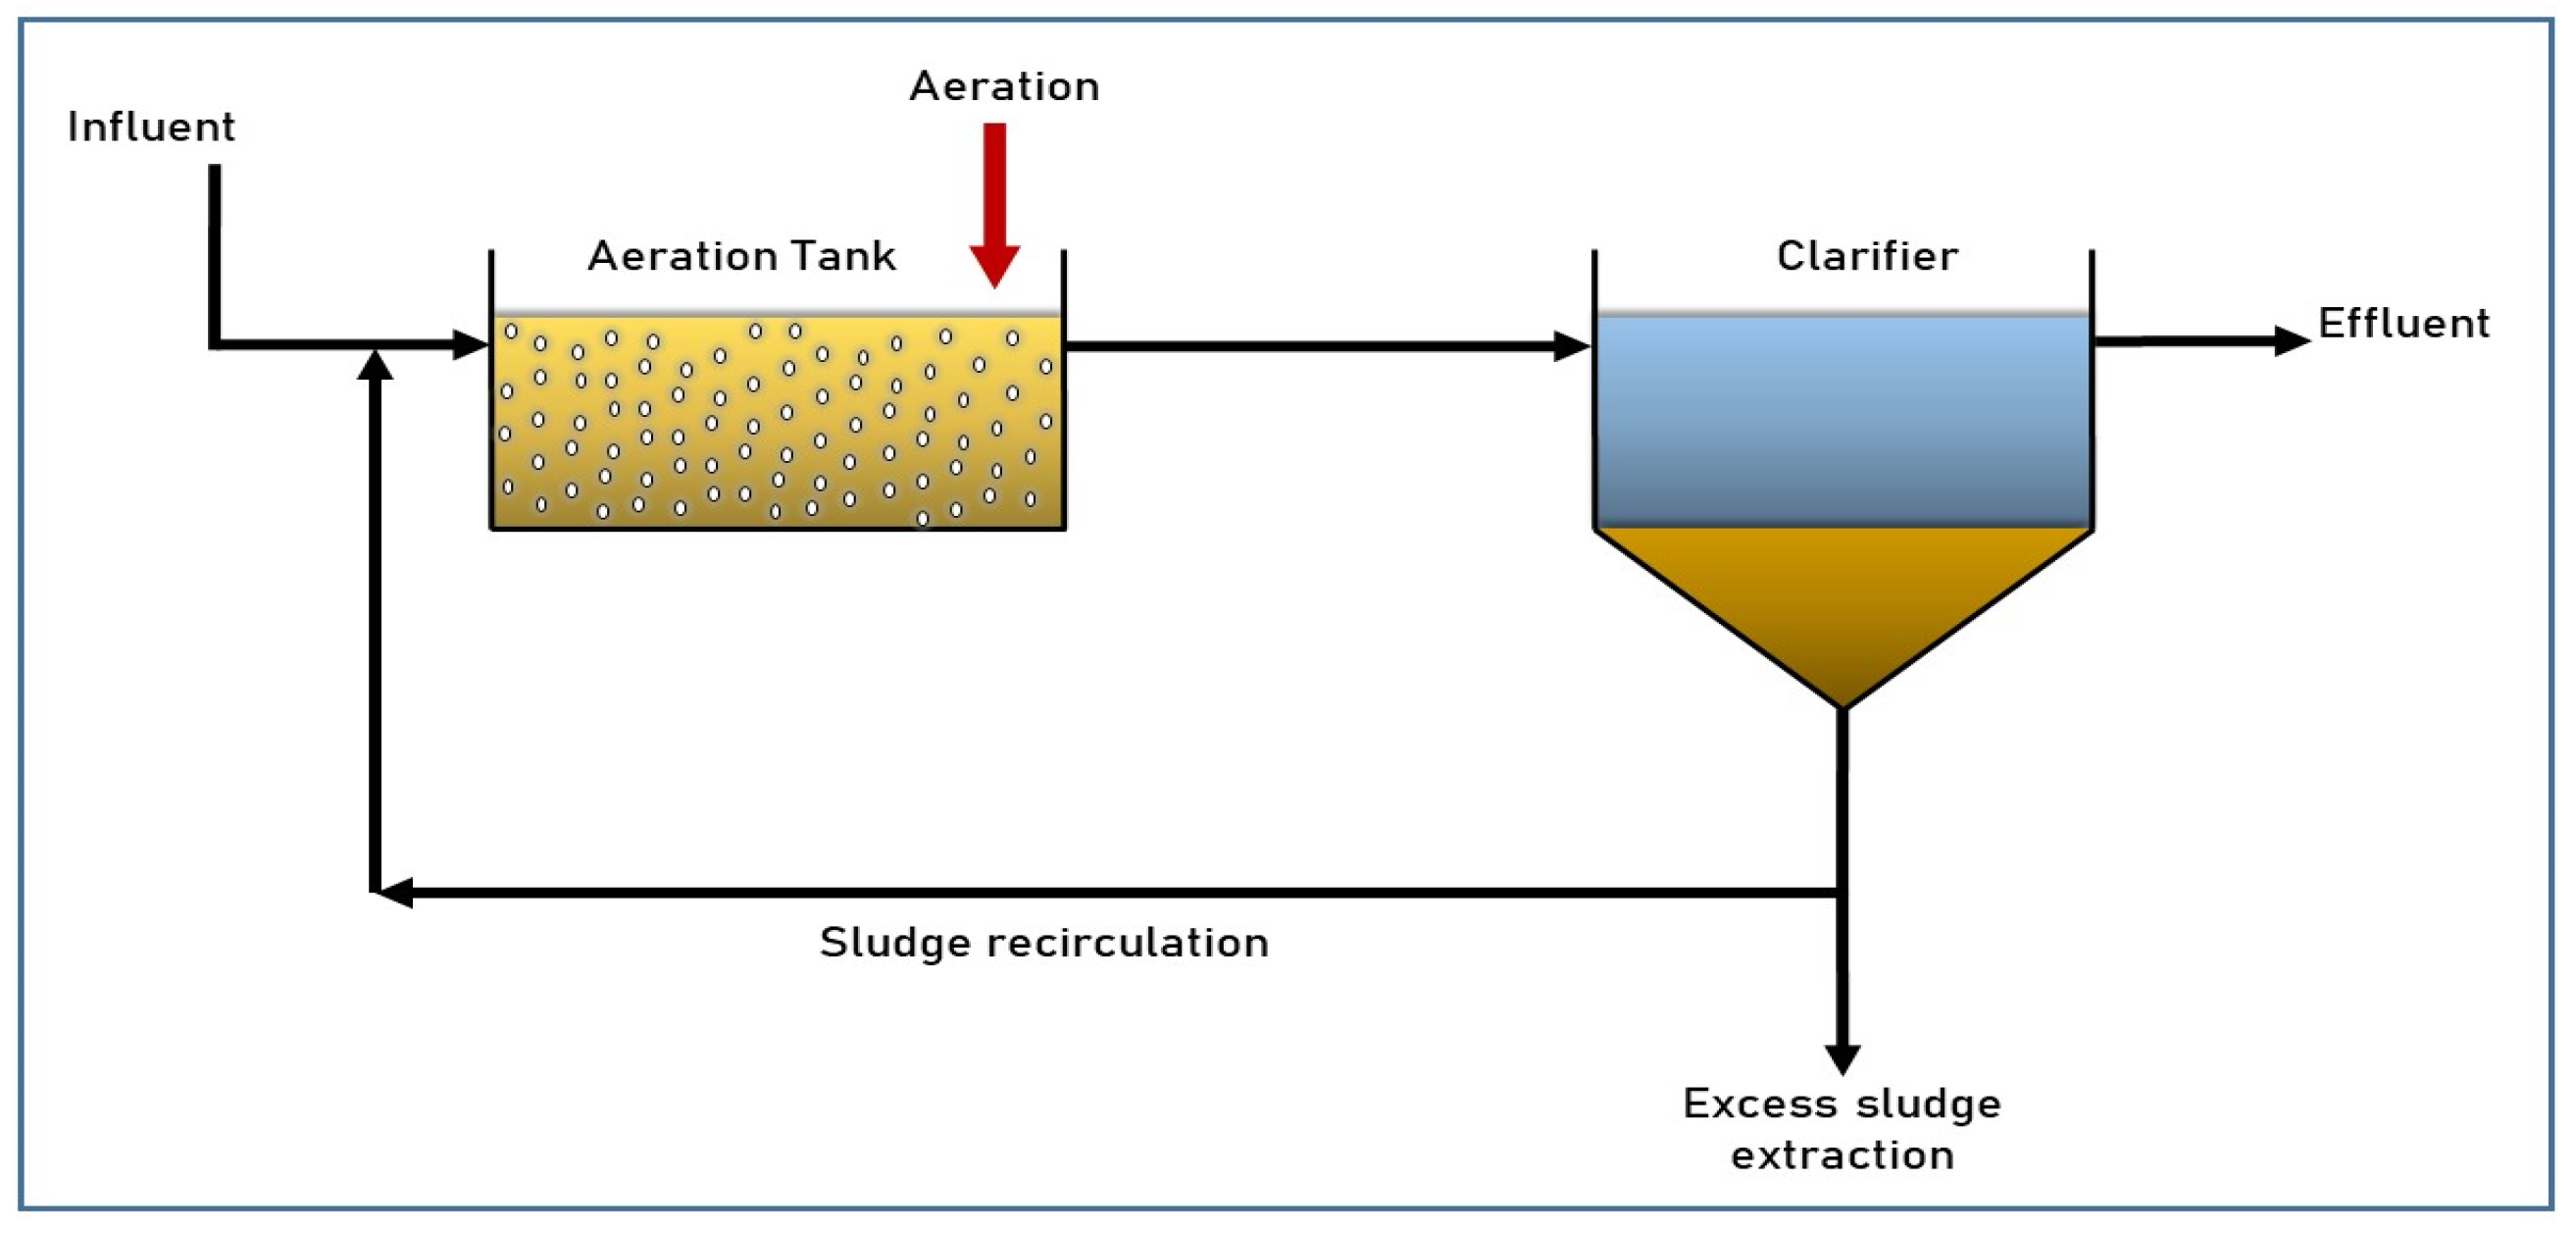
The Municipal Wastewater Treatment Plant was designed to accommodate a flow rate of 30,000 m3 per day and has been operational since 1999, managed and operated by the Algerian National Sanitation Office. The treatment facility integrates preliminary, secondary, and tertiary treatment systems, as illustrated in Figure 2. Preliminary treatment involves screenings and grit removal units. For secondary treatment, an activated sludge process coupled with clarification units is employed for the biological removal of organic and nutrient materials from the wastewater. The excess activated sludge is extracted from the recycled activated sludge line and directed to sludge drying beds. In the aeration tanks, dissolved oxygen (DO) levels are regulated using an on–off type automatic controller, with aeration facilitated by slow-rotating surface aerators installed on walkways. Ultrasonic sensors monitor the plant inflow. After clarification, the effluent proceeds to the chlorination and disinfection unit for tertiary treatment, and the final effluent is discharged to a stream [24]. The operating conditions of MCWWTP are detailed in Table 1. The recirculation of activated sludge in the aeration tank follows the scheme outlined in the diagram depicted in Figure 3.

2.3. Monitored Parameters and Analytical Methods

The laboratory at MCWWTP conducted analyses to derive the physicochemical parameters. A total of 56 samples were collected between 14 July 2021 and 10 January 2023, with a monitoring frequency ranging from one to four times per month. These samples were collected for both influent and effluent waters, aligning with daily monitoring data, to capture the temporal variations in their qualities. Samples were collected from 10 cm below the surface using a Silicon/Teflon water pump. Twelve water quality parameters were measured: temperature, potential of hydrogen (PH), TSS, DO, biochemical oxygen demand (BOD5), COD, NH4-N, Nitrates (NO3-N), Nitrites (NO2-N), Phosphate (PO4-P), turbidity, and chloride. Temperature and pH of surface water were assessed promptly post-collection using HQ40D Portable Multi Parameter Meters (Hach Company, Loveland, CO, USA). Standard methods for water and wastewater analysis were employed for all the applied analytical procedures [25].

2.4. Methodology

2.4.1. Presentation of the Software GPS-X Version 8

GPS-X software version 8 developed by Hydromantis Environmental Software Solutions, Inc. Ontario, Canada, was used in this current work [26]. It is a widely used comprehensive standalone model built with integrated biological wastewater treatment processes for ASP and anaerobic digestion system (ADS), along with numerous other processes involving physical and chemical reactions [27]. The GPS-X simulator operates based on a material balance over each of the state variables in the ASM model across the process units, incorporating both the flow rates in and out of the process unit as well as the specified generation or consumption rate. The software provides various methods for entering influent (state variables) COD, nitrogen, phosphorus, and solids fractions in a number of ways. The Influent Advisor spreadsheet in the simulator illustrates the links between user input values, state, and composite variables [28]. Users can easily select the library, with the CN library featuring only COD, oxygen, nitrogen, and phosphorus fractions. The specific fractions included in any model are dependent on the selected ASM model, library, and influent model. Additionally, an enhanced nitrogen library, known as the C2N library, encompasses fractions for nitrogen linked with inert fractions, along with nitrite–nitrogen associated with the process. The IP libraries introduce industrial pollutant fractions to either the CN or CNP libraries. The model calculates composite variables from the state variables using specific ratios, known as “stoichiometric constant”. The default numerical solver integration method is the Runge–Kutta–Felberg method [29].

2.4.2. The ASM1 Model

The ASM1 is a mathematical model used to simulate the behavior of microorganisms in the process of WWTP. The model consists of a set of differential equations that describe the dynamics of the microbial populations and the concentrations of key substrates and products in the wastewater treatment process.
The mathematical expression of the generic mass balance applied to the vector ξ, which signifies substrate or biomass concentration, is expressed as follows (Equation (1)):
d ξ d t = r ( ξ ) + 1 Θ ξ i n ξ
Here, Θ is the HRT and r   ( ξ ) is the conversion vector of the variable ξ (substrate utilization global rate).
The substrate utilization rate ( r i ) denotes the conversion rate for the component i through the process j [30] (Equation (2)):
r i = j ν i j ρ j
Here, ν i j the stoichiometric coefficient and ρ j is the process rate. This expression defines a system of differential equations wherein each equation represents a component of the model. The Monod equation ρ 1 indicates that biomass growth is proportional to the biomass concentration in a first-order manner and to the substrate concentration in a mixed-order manner. On the other hand, the Herbert expression ρ 2 specifies that biomass decay is first-order with respect to biomass concentration [8].
When the ASM1 is utilized to simulate oscillations in the effluent organic matter concentration of a WWTP, three differential equations are necessary for SS, XS, and heterotrophic biomass (XBH) [31]. The corresponding system of equations for these three components (Equations (3)–(5) in Table 2), based on the process rates that influence them, is as follows:
d S s d t = 1 f p b h X B H + 1 f p b A X B A + 1 Θ ( X S , i n X S )
d X s d t = µ H Y H S S K S + S S X B H + 1 Θ ( S S , i n S S )
d X B H d t = µ H S S K S + S S X B H b H X B H + 1 Θ ( X B H , i n X B H )
The interdependence of variables across multiple equations, as mentioned earlier, greatly adds to the complexity of solving the differential equations. This complexity arises due to the coupling of variables among different equations [32]. In practical applications, the material balance equations serve as input to a numerical solver responsible for generating results, which can be either static, providing a snapshot of the system, or dynamic, showcasing time-dependent variations. The numerical solver plays a crucial role in handling the intricate relationships between variables and obtaining meaningful outcomes from the equations.
In order to ensure precise outcomes, it is necessary to combine the ASM1 model with a decantation process model; the traditional layer model developed by [33] is used to describe the clarification and thickening processes. According to this model, the settler is represented as a tank with ten horizontal layers, assuming perfect mixing within each layer. The transfer of solids between adjacent layers is influenced by both sedimentation and liquid fluxes occurring in the settler, and the sedimentation rate is determined by considering the concept of limiting flux. The sedimentation velocity is computed using the double exponential velocity method proposed by [33] (Equation (6)), whose settling parameters are defined in Table 3:
u s X t s e t = m a x 0 , m i n u s , 0 , u s , 0 e r h X t s e t 1 f n s e r p X t s e t 1 f n s
The settling parameters (us,0), (u′s,0), (rh), (fns), (rp), and (Xtmax) are defined in Table 3.

2.4.3. Calibration of the Model

Calibrating the ASM1 model usually involves a step-by-step process, adjusting a few parameters instead of using an automated optimization routine [34]. This approach typically yields a reasonably accurate description, especially for standard municipal cases. [35].
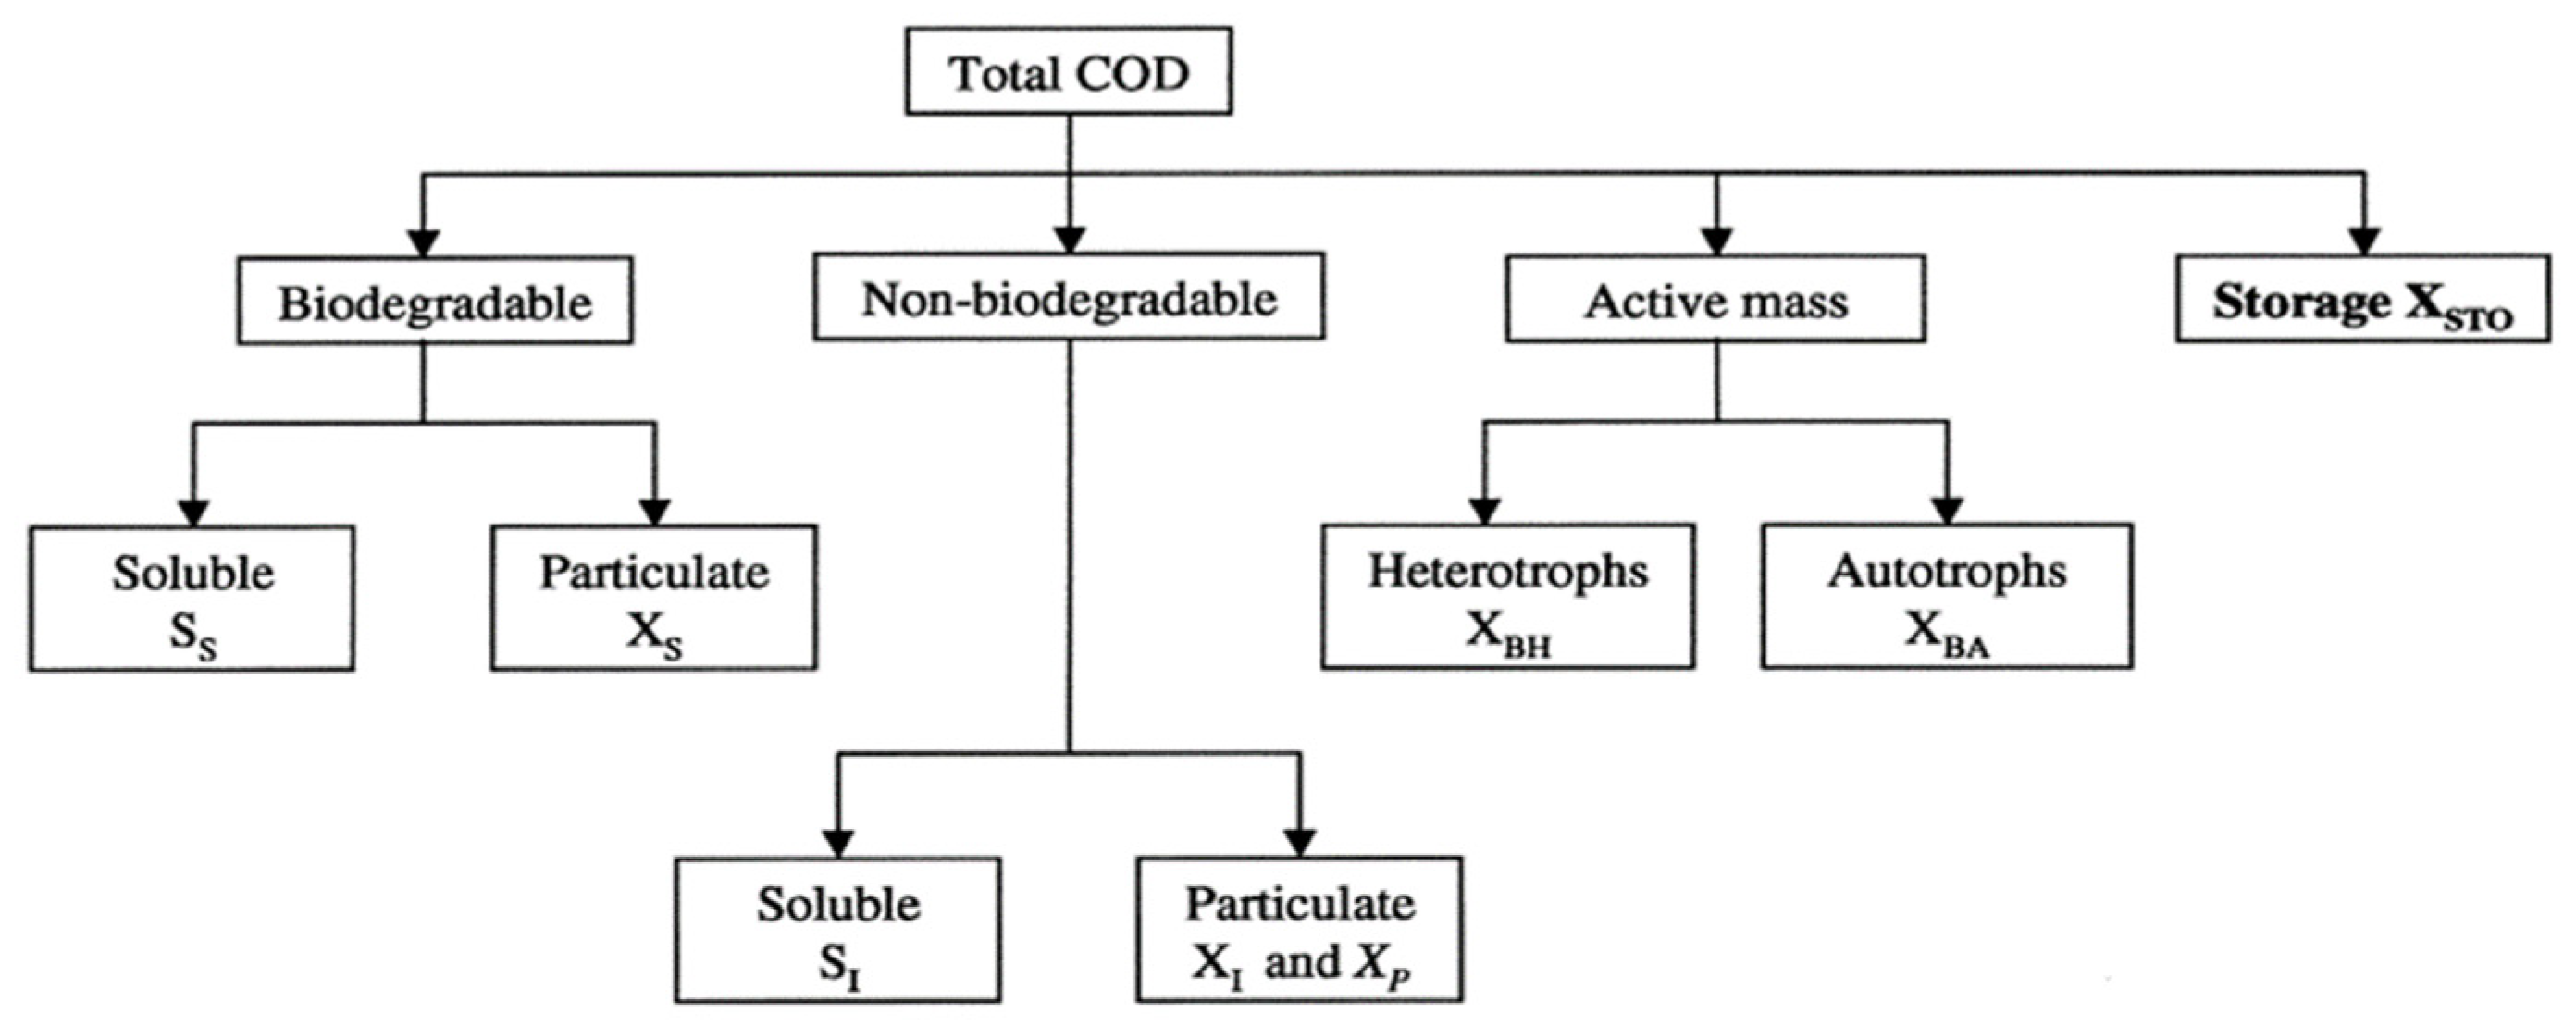
The model is based on COD fractions (Figure 4) and several stoichiometric coefficients (such as VSS (volatile suspended solids)/TSS ratio, soluble fraction of total COD, heterotrophic yield coefficient YH, and autotrophic yield coefficient YA), which required determination to enhance wastewater characterization. To accomplish this, the study utilized the Influent Advisor developed by Hydromantis Co., Ontario, Canada, inputting the average of observed concentration values of COD, TSS, and NH4-N parameters.
The total COD concentration within the influent of the treatment plant underwent a comprehensive fractionation into distinct components: SS, XS, SI, and XI. SI is commonly estimated using the soluble COD in the effluent or as 90% of the effluent COD, a method supported by research like that conducted by [36]. Considering that the process data from the studied treatment plant only provide measurements of total COD, SI was approximated as 90% of the effluent COD. To accomplish the COD influent fraction characterization, the CEMAGRAF protocol was adopted, and the adjustment fractionations were conducted using CEMAGREF’s default parameters for SS and XI, a well-established practice in the field.
The approach proposed by [34] was used for steady-state calibration. The influent flow was characterized by inputting averaged concentrations of COD, TSS, NO2-N, NO3-N, NH4-N, PH, and temperature for 28 samples provided by the plant laboratory over the period between 14 July 2021 and 10 January 2023. The model was fine-tuned to match the average effluent concentration data for the specified period. Mass balance was conducted in terms of COD. As a result, the concentrations of all organic materials, including biomass, were expressed in COD units [35].
Initially, default values of stoichiometric, kinetic, and other parameters associated with biochemical and clarification-thickening processes were used [35]. These parameters can be determined either directly through tests under specific conditions [37] or indirectly by numerically calibrating the model using experimental data obtained through the treatment process. This consists of determining some of the parameters by comparing simulated concentrations with measured values [38].
Given that COD provides a link between electron equivalents in the organic substrate, the biomass, and the utilized oxygen [39], we focused on dynamic variables affecting the output COD value, such as XBH and maximum specific growth rate (μ–max H) [31].
The important point of calibrating the model using dynamic data is to achieve a more accurate estimation of the saturation constant (KS), decay coefficient of heterotrophic biomass (bH), and μ–max H and one stoichiometric coefficient, the heterotrophic yield coefficient (YH), which are the most important parameters in predicting dynamic situations [40,41,42].
To approximate the simulation line to the experimental data, the steady-state simulation protocol is divided into three steps:
  • Enhance the clarity of the mathematical response to COD output and dynamic variables by using a range of values for μ–max H [43] while maintaining default values of other parameters to reduce the dynamism.
  • Ones μ–max H is obtained, adjusting parameters related to XBH, such as YH and bH, is required for a complete calibration [31].
  • Discrepancies between predicted and observed values are identified and adjustments are made in parameter values until achieving a precise match. The objective of the model calibration is to establish a correlation between the model’s prediction and the experimental results.
A simulation algorithm can handle model calibration visually or mathematically. In the study, due to the ASM1 model’s complexity and the absence of detailed data needed for automatic calibration, a direct mathematical simulation for practical parameter identification issues was not feasible [44,45]. Therefore, we chose to visually and manually adjust the parameters based on the experimental measurements.
Visual inspection of the agreement between observed and simulated values was reinforced by employing statistical method to assess this alignment. To validate the model and confirm its reliability in reflecting reality, the root mean square error (RMSE) (Equation (7)) was employed in this study [46].
R M S E y ¯ = ( y y ^ ) 2 n y ¯

3. Results & Discussion

3.1. Characterization of Influent Wastewater

The physicochemical parameters derived from analyses were processed by the laboratory of MCWWTP. A total of 56 water samples were collected from 14 July 2021 to 10 January 2023 for influent and effluent waters through daily monitoring to identify temporal changes in water quality. Table 4 presents the descriptive statistics including the mean, median, standard deviation (SD), minimum (Min), maximum (Max), 1st quartile (Q1), 3rd quartile (Q3), mean, and median values of the analyzed parameters for the water samples. Throughout the observed timeframe, the mean pH value of the influent samples surpassed that of the effluent samples by 1.31%. This discrepancy can be attributed to the pH increase resulting from the denitrification process [47]. The TSS removal efficiency of the MCWWTP was calculated as being 91.31%, while temperature changes between influent and effluent samples were negligible. The BOD and COD treatment performances of the ASP in MCWWTP were 95.15% and 90.85%, respectively. NH4-N was the predominant nitrogen form, treated with an efficiency of 38.24%. In contrast, NO3-N and NO2-N ions showed removal efficiencies of 55% and 75%, respectively. Additionally, the mean concentration of PO4-P increased by 3% in the influent flow, primarily because there is no phosphorous removal process implemented in the plant. While the heterotrophic bacteria within the ASS do assimilate phosphorus to some extent, their contribution alone appears insufficient to induce a substantial reduction in phosphorus concentration.
As mentioned previously, the adjustment fractions were derived using CEMAGREF’s default parameters as reported in Table 5. For SI, the ratio was estimated at 90% of the effluent COD, as proposed by [36]. The Si fraction was determined to have a mean value of 0.056. Deviating from CEMAGREF’s default value of 0.13, a fraction of 0.32 was taken for SS according to CEMAGREF defaults. The inert particulate fraction XI was also given from CEMAGREF defaults with a mean value of 0.05 [48,49,50]. The remaining 57.4% of the COD is considered as being the biodegradable substrate XS.

3.2. Model Calibration

The ASM1 model was calibrated using steady-state data on treatment plant operation, prioritizing the calibration of the COD, the TSS, and NH4-N.
The COD calibration depended mainly on adjusting the ASM1 kinetic and stoichiometric parameters. The model was calibrated adjusting two stoichiometric coefficients, YH and Yield for Autotrophic Biomass (YA); and three kinetic parameters, μ–max H, bH, and Ks. Table 6 shows the calibrated parameters and their default values for the ASM1. The rest of the parameters were expected to have minimal impact on the model’s outcome [34]; hence, the default ASM1 values were retained for them. The calibrated heterotrophic biomass yield (YH = 0.66 g COD/g COD) closely aligned with both the default value and values reported in the literature. Similarly, the autotrophic biomass yield maintained the same default value (YA = 0.24 g COD/g COD) as that mentioned in the literature. However, the calibrated values for the maximum heterotrophic growth rate (μ–max H = 3.2 d−1) and heterotrophic decay coefficient (bH = 0.66 d−1) deviated significantly from the default values (Table 6). Nonetheless, the half-saturation constant value remained unchanged as per the default setting. The calibration of TSS primarily relied on the precision of wastewater characterization, as the model computes suspended solids by utilizing the proportion of soluble (S) and particulate (X) COD to the total COD. Hence, it hinges upon the accurate fractionation of total COD [51].
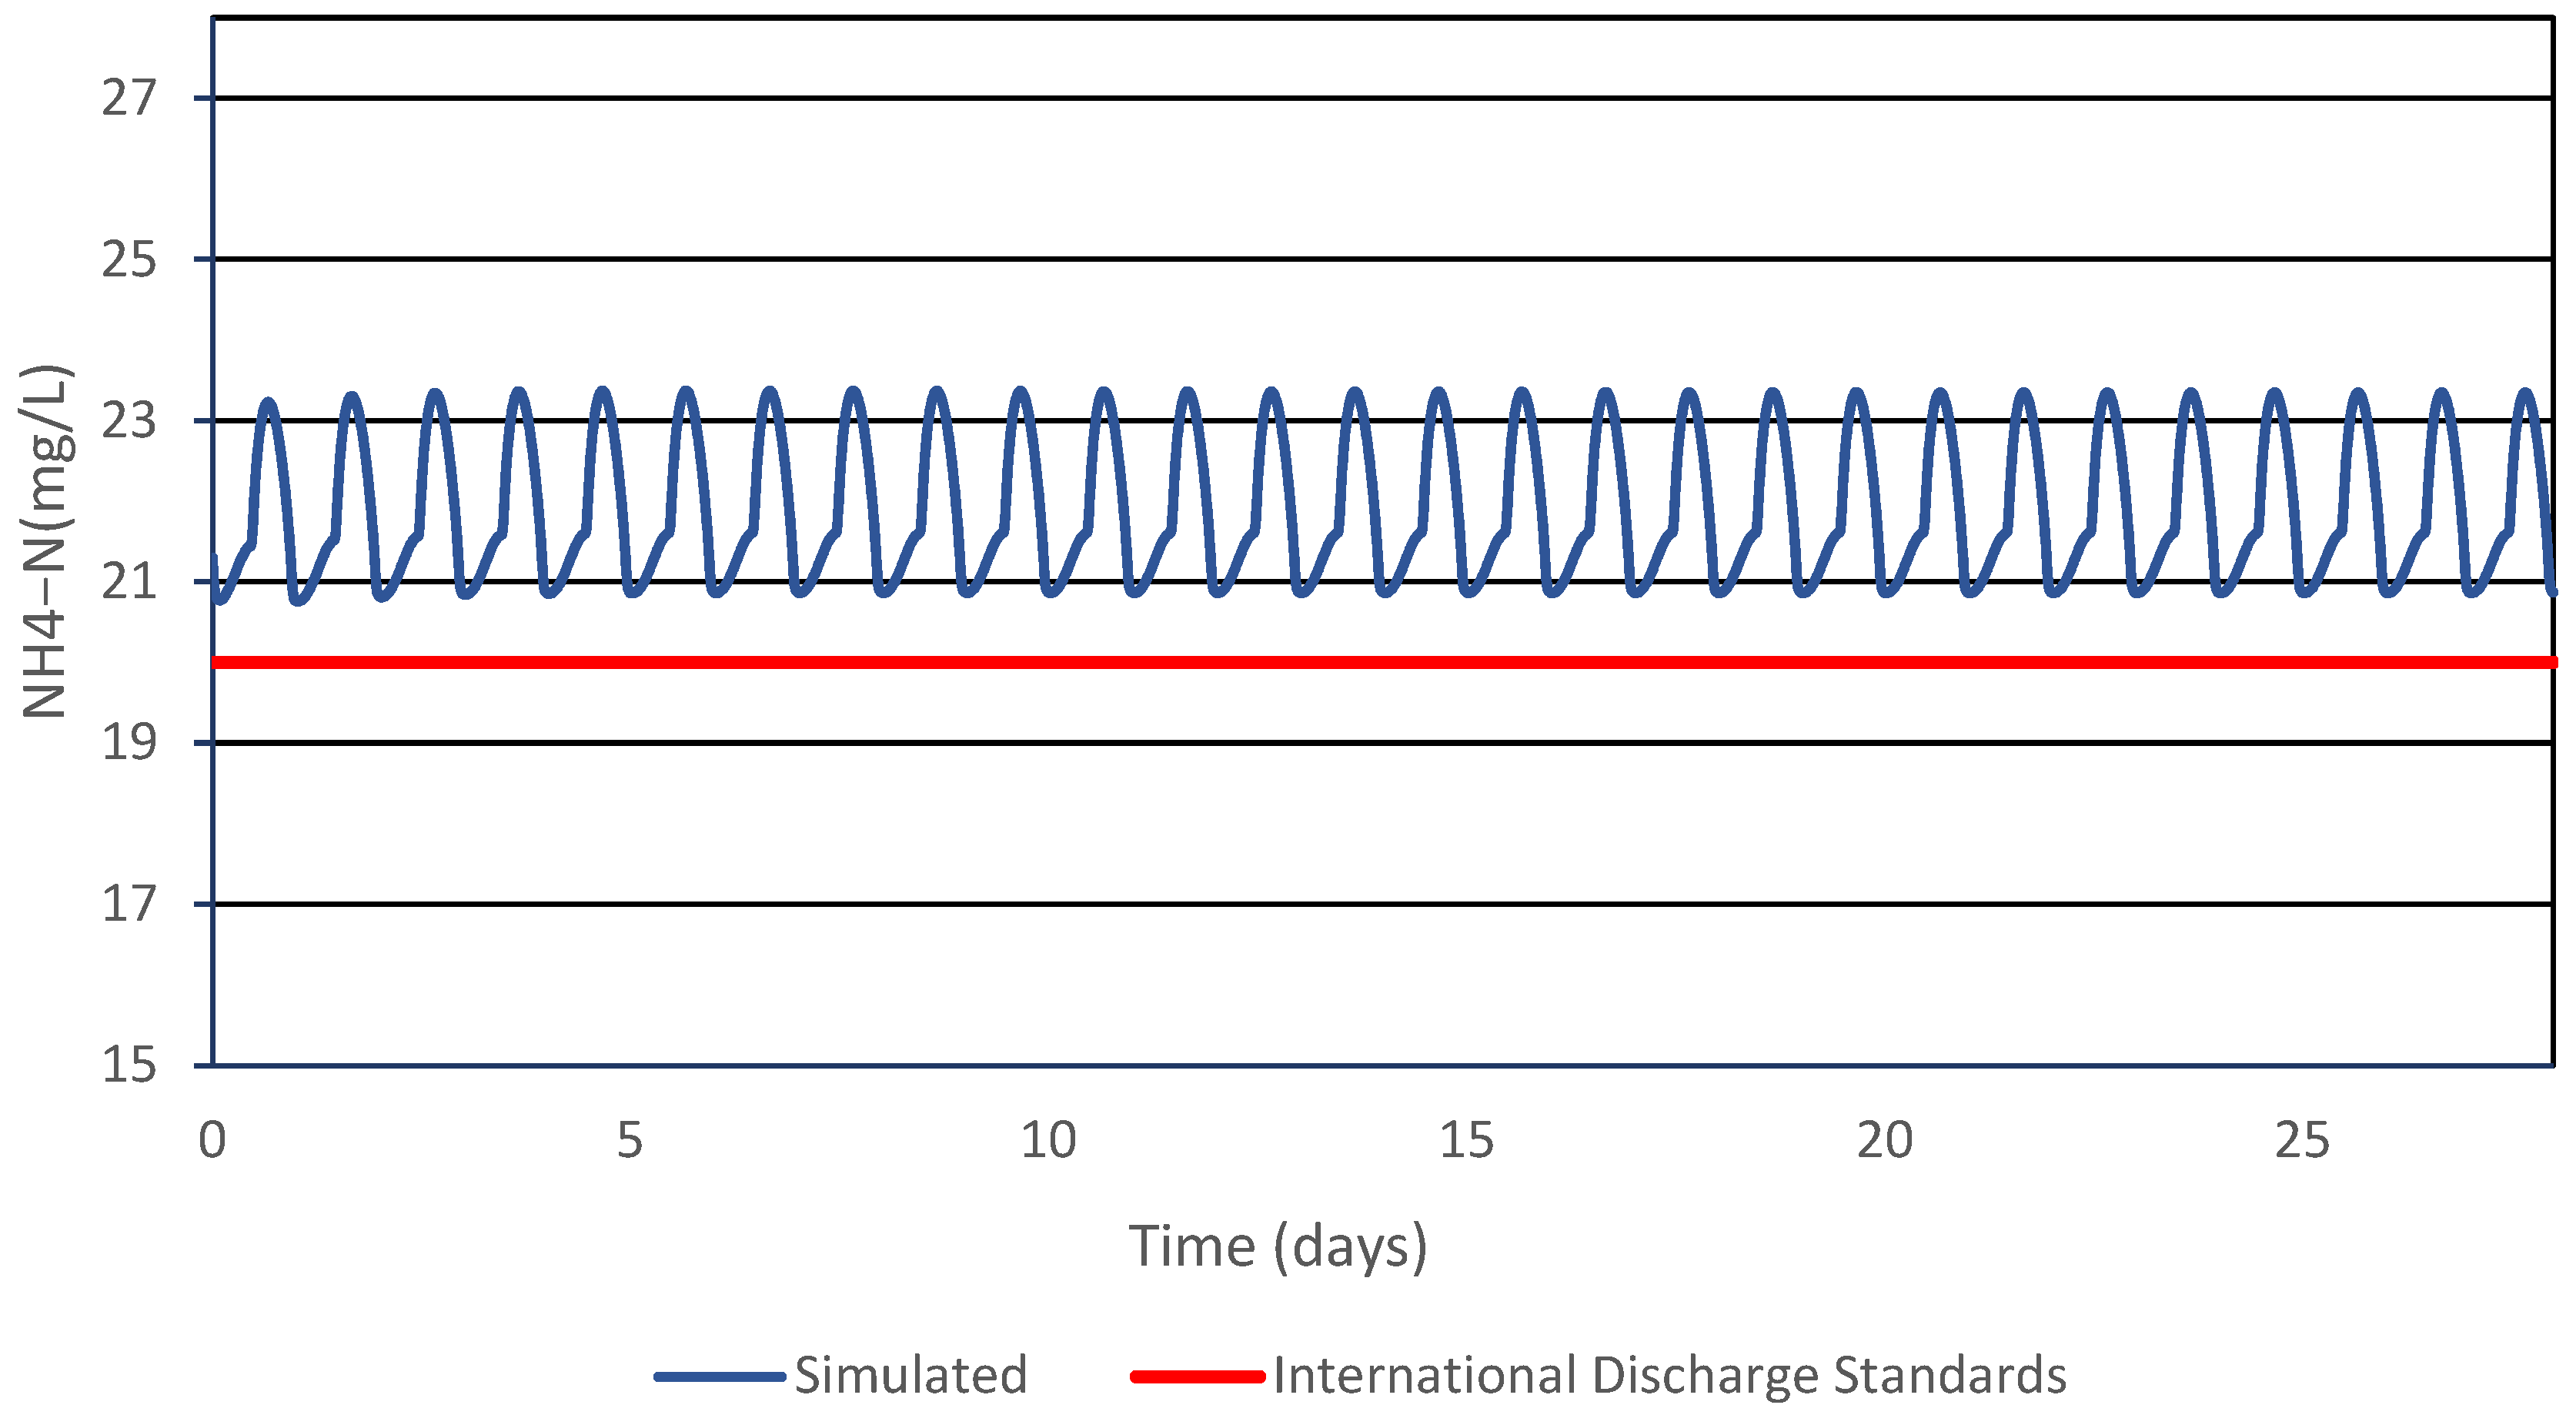
The primary objective of steady-state model calibration is to align the simulated values for each variable with the corresponding mean values obtained from plant data collected during measurements. This approach has been commonly employed in numerous studies to characterize the performance of ASSs in large-scale MCWWTPs [34,55,56,57].
After being measured at the plant, the influent COD is inputted into the GPS-X software. Figure 5 illustrates the effective representation of MCWWTP performance provided by the ASM1 model. The simulated effluent COD values closely align with the actual measured COD readings, demonstrating a low RMSE of 3.70% (Table 7). Given that COD stands as the principal parameter within ASM models, the major calibration efforts are directed towards fine-tuning COD adjustments. For TSS, the influent average was introduced through the calibration of two stoichiometric coefficients: the VSS/TSS ratio was fixed at 0.80 g VSS/ g TSS, consistent with the findings of [58], and XCOD/VSS was adjusted to 1.3 g COD/g VSS, differing from the default value of 1.48. The model effectively mirrored the observed TSS data in Figure 6, with an RMSE of 17% calculated. Nitrifying microorganisms responsible for the nitrification process are highly sensitive to a number of environmental factors (DO levels, temperature, pH, increased BOD, and the existence of harmful or inhibitory substances); therefore, the calibration of NH4-N was neglected. All kinetic and stoichiometric parameters related to the nitrification process (Mass N/mass COD in biomass (iXB), Nitrate for denitrifying heterotrophs (KNO), ammonification rate (Ka), and correction factor for anoxic hydrolysis (ŋh)) were set to the default values. This approach aligns with the perspective presented by [51]. The ASM1 model showed less alignment with measured data for NH4-N during calibration (Figure 7), resulting in an RMSE of 37% (Table 7).

3.3. Dynamic Simulation Results

The model’s validation process involved conducting a long-term simulation using influent process data spanning a 4-month period (from 14 July 2021 to 30 November 2021) as input for the model. Subsequently, the simulation results were compared against the effluent process data.
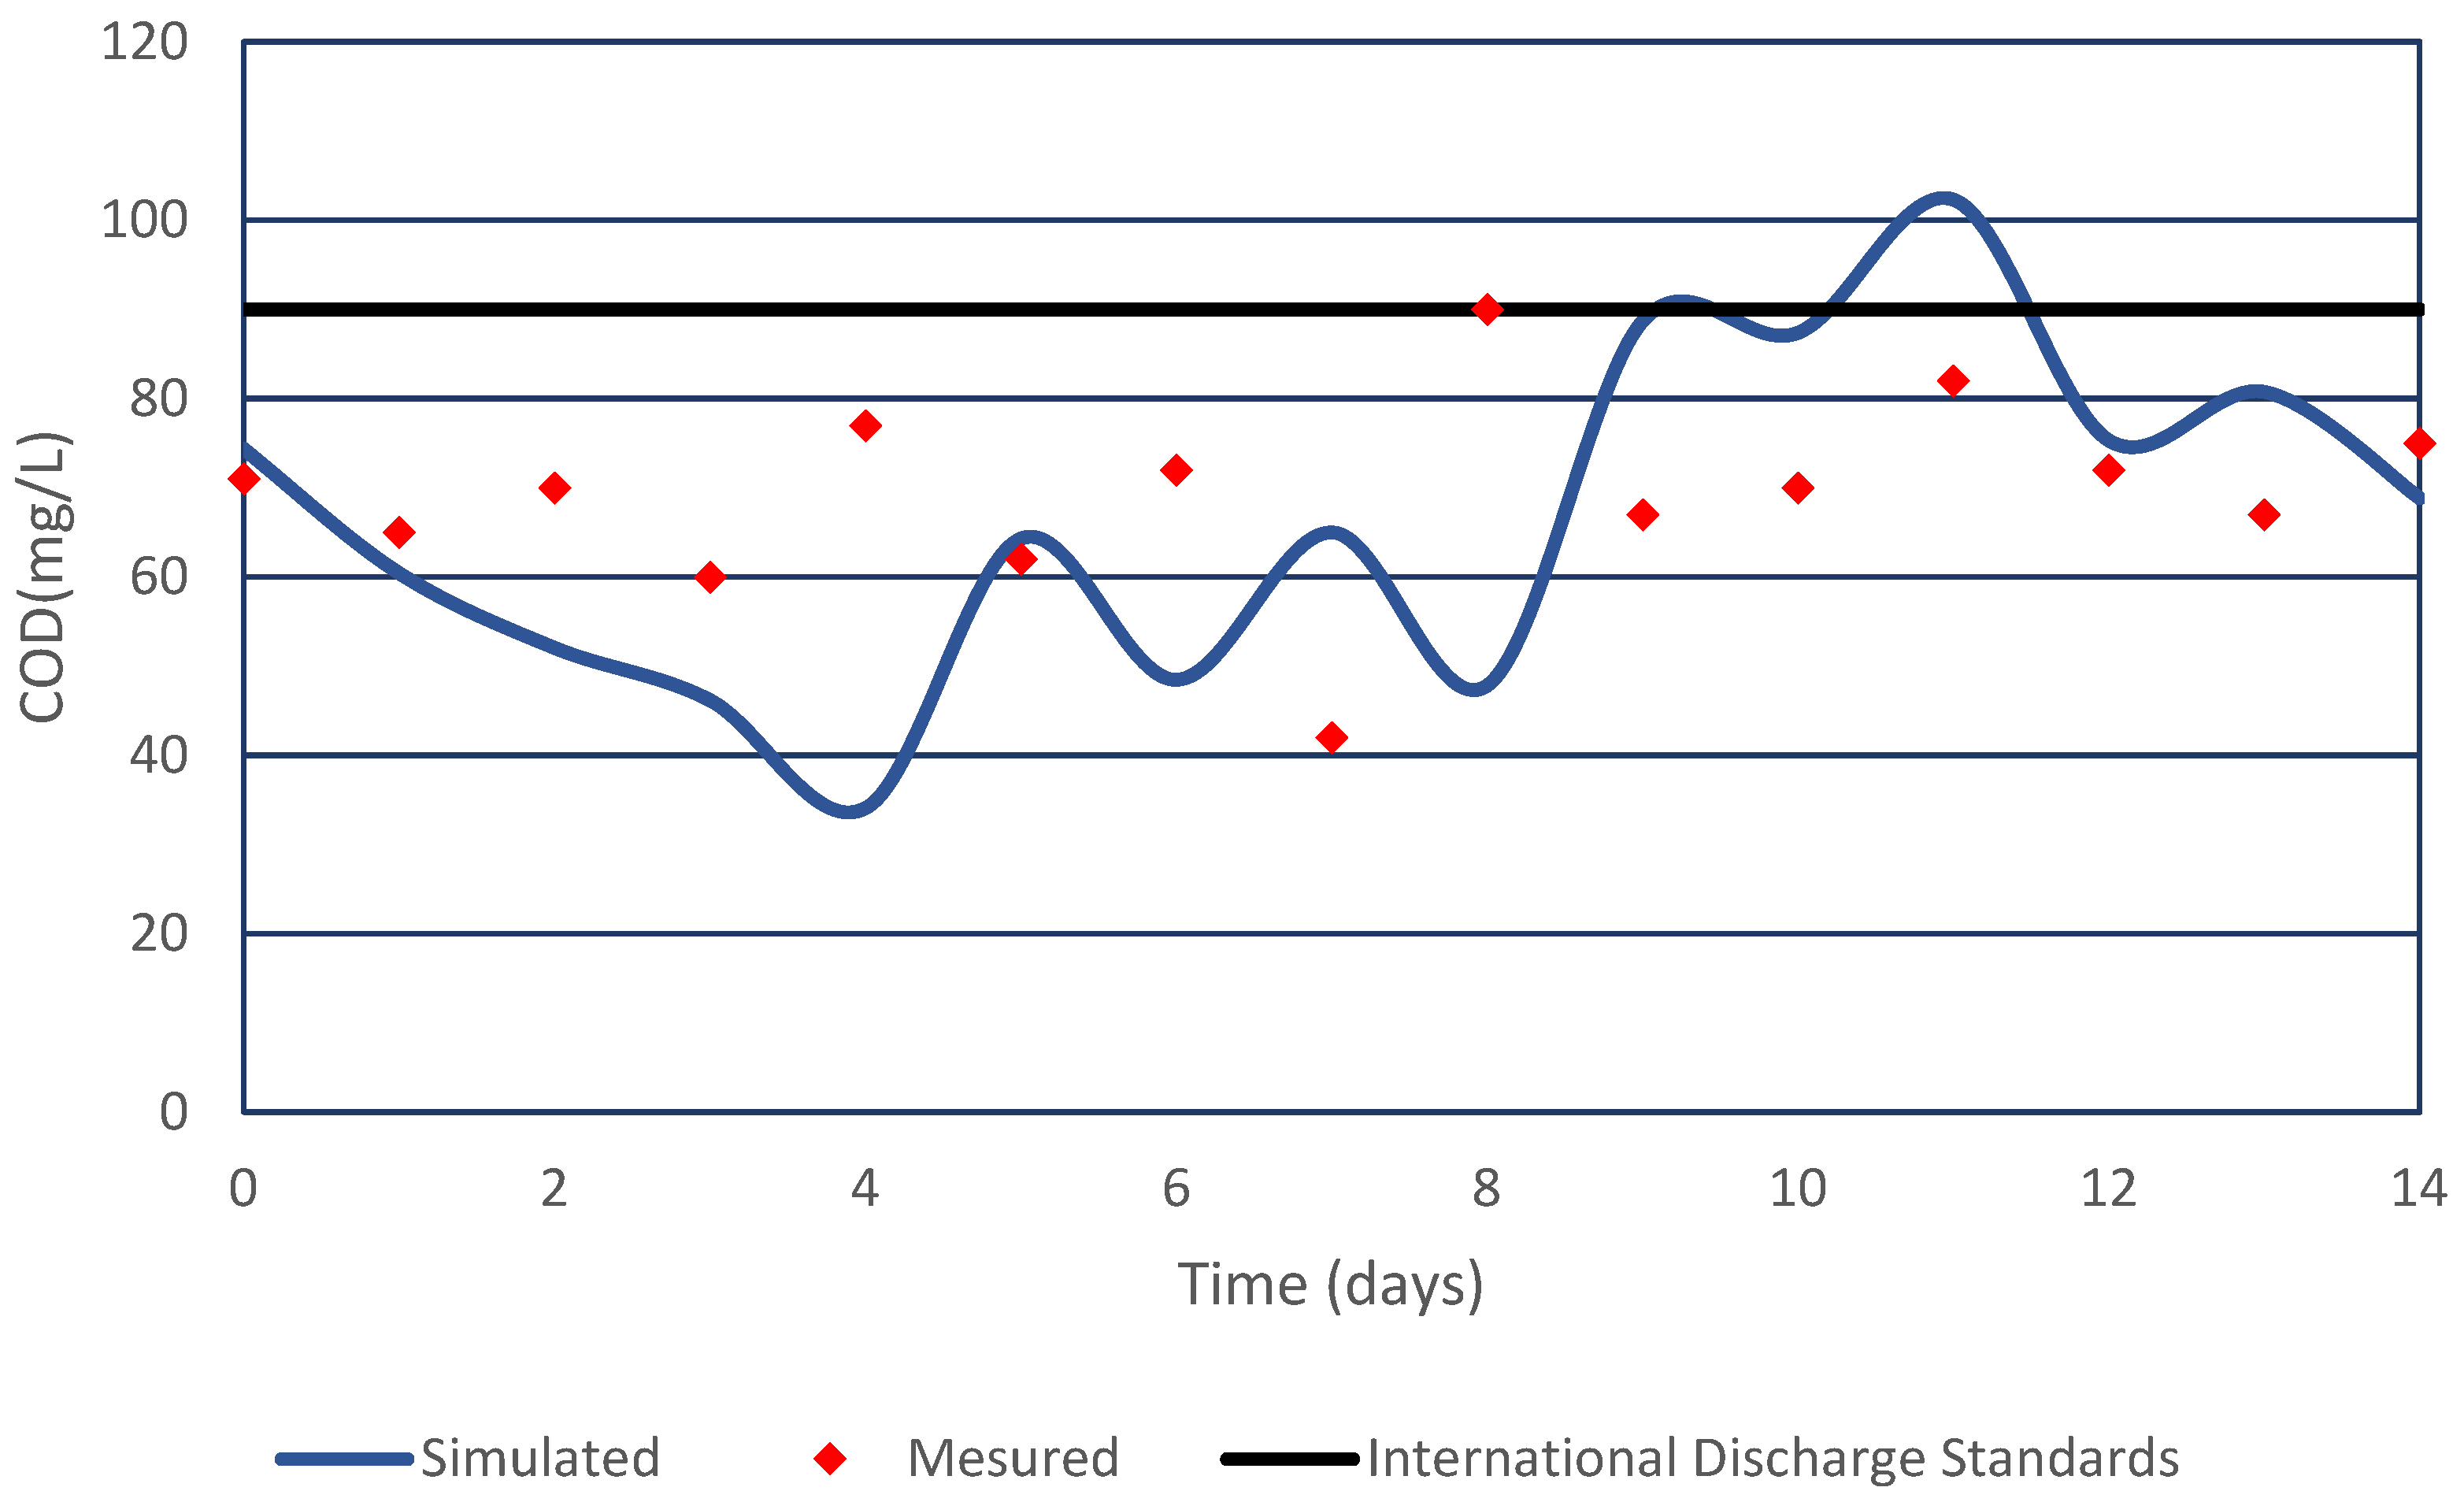
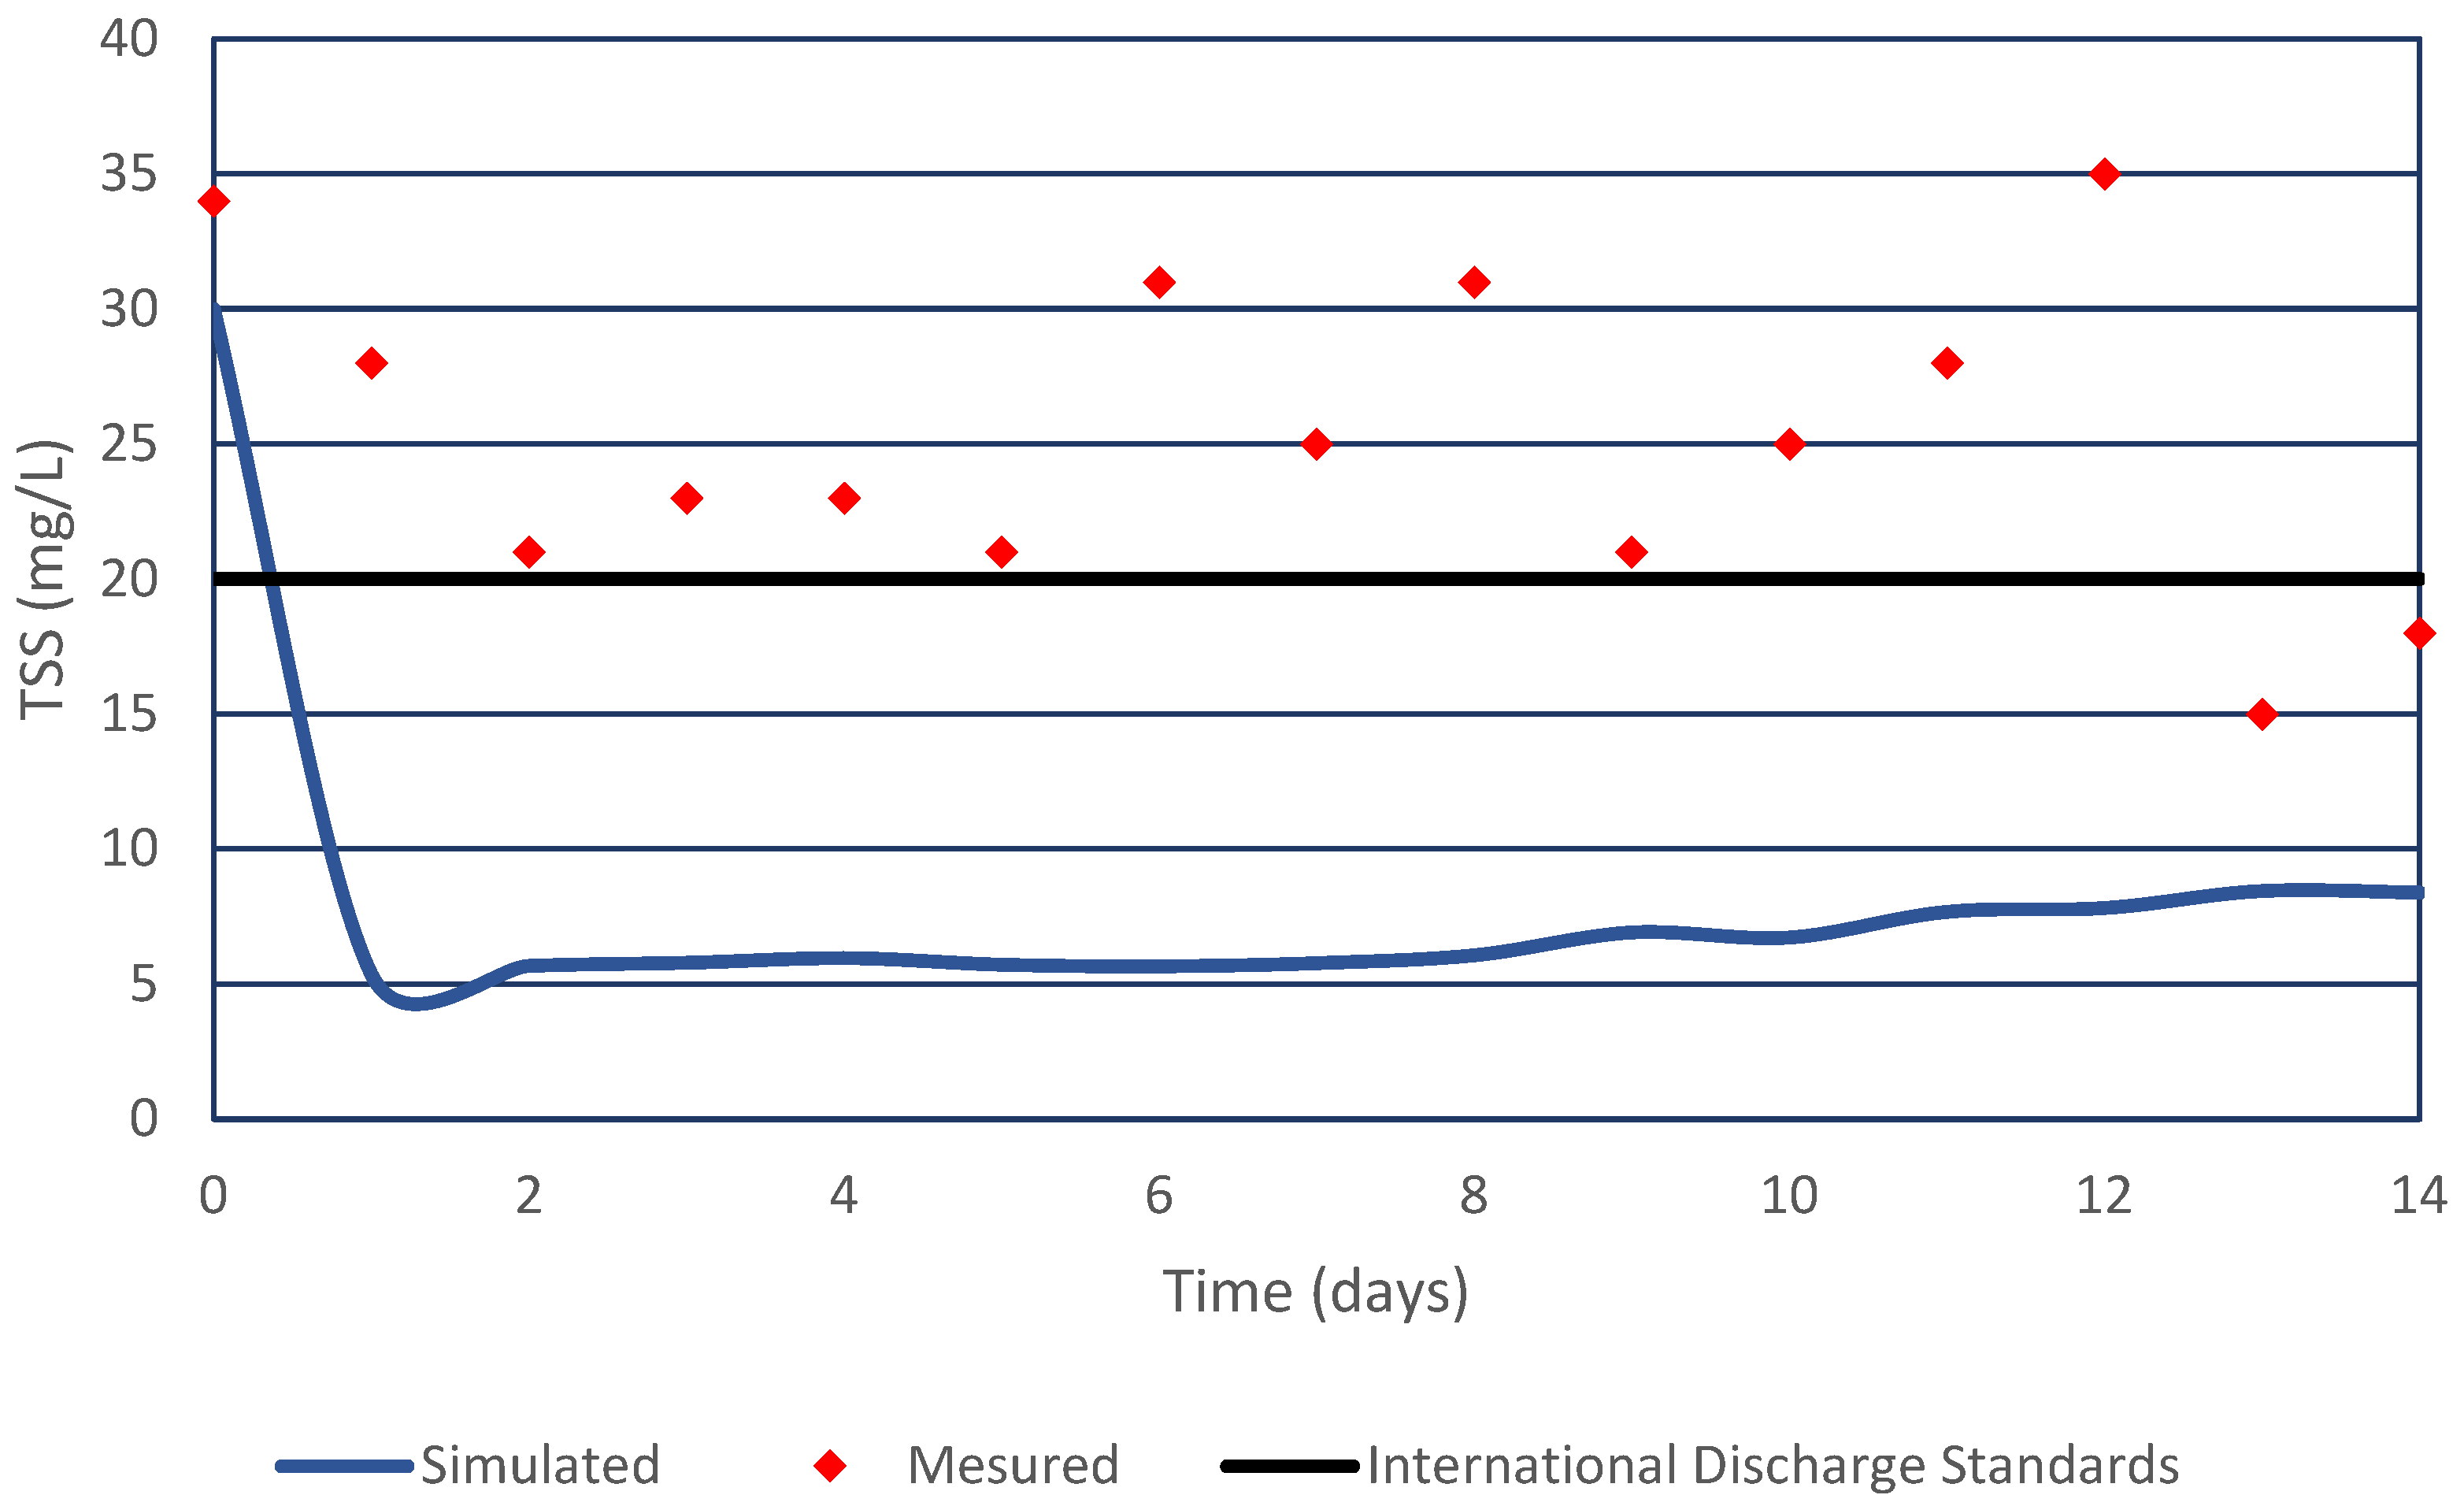
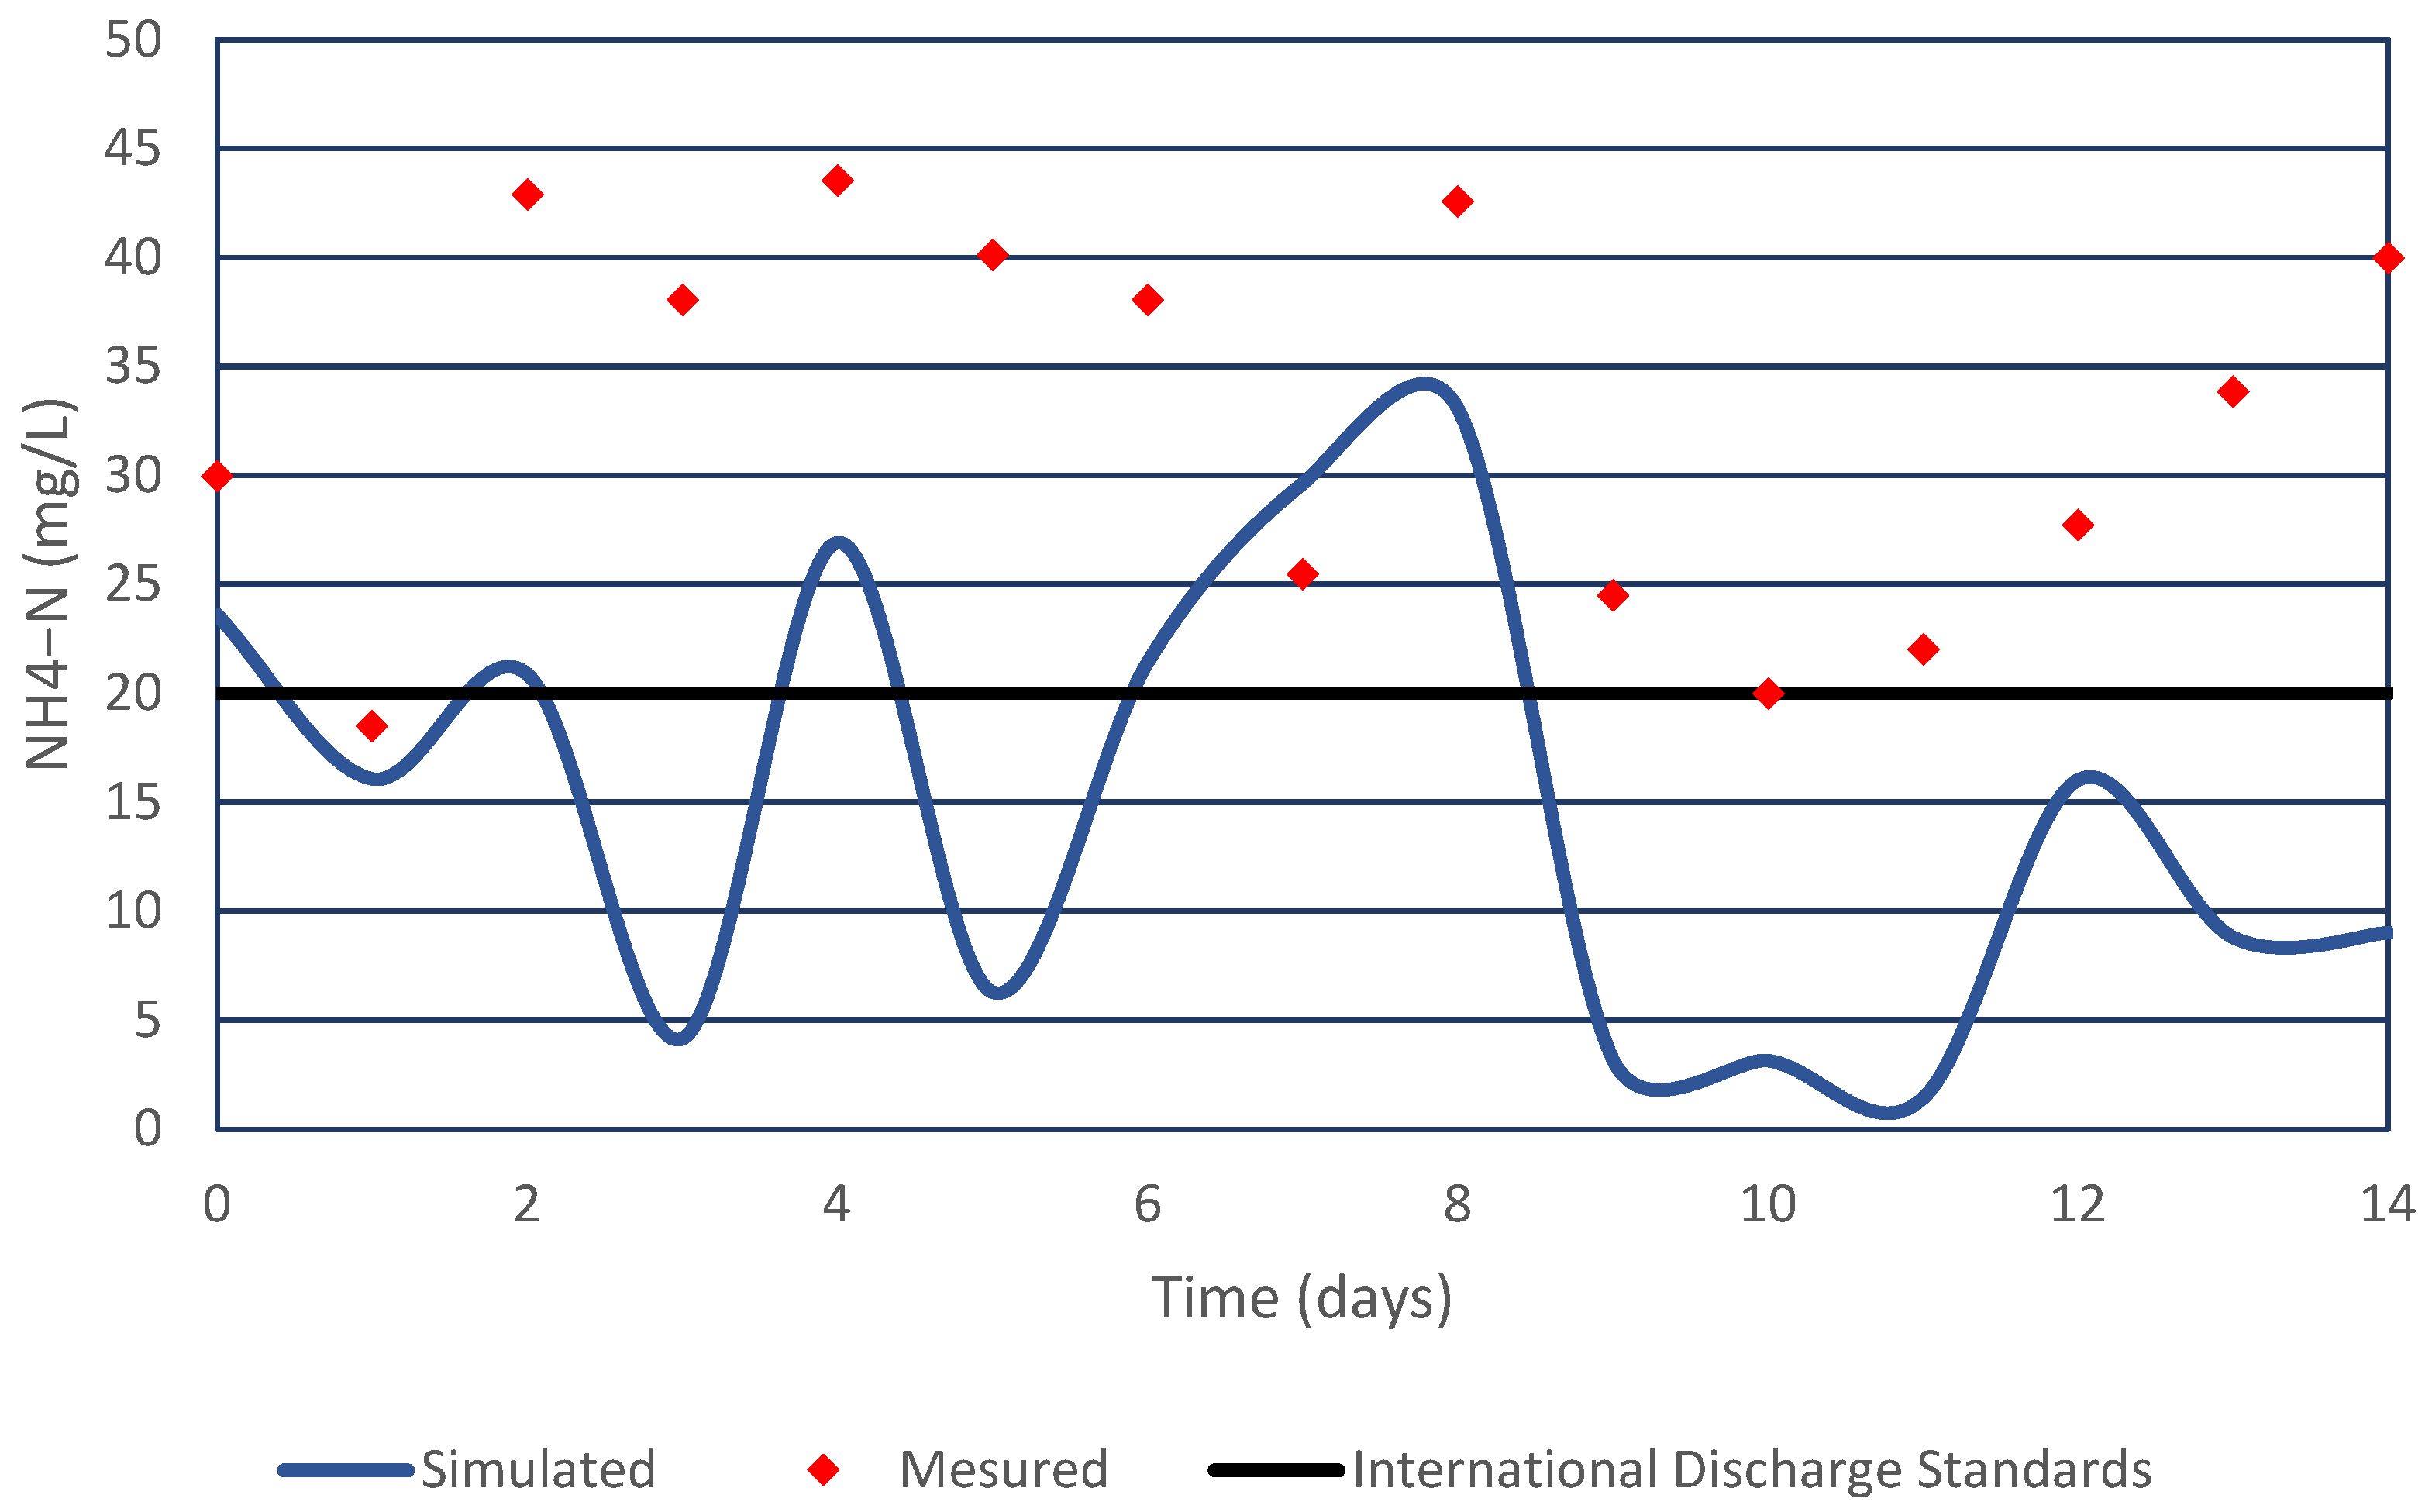
The average relative error between the simulated data and the measured data for the whole year was calculated, wherein RMSE values were 23, 67, and 56% for COD, TSS, and NH4-N, respectively (Table 8).
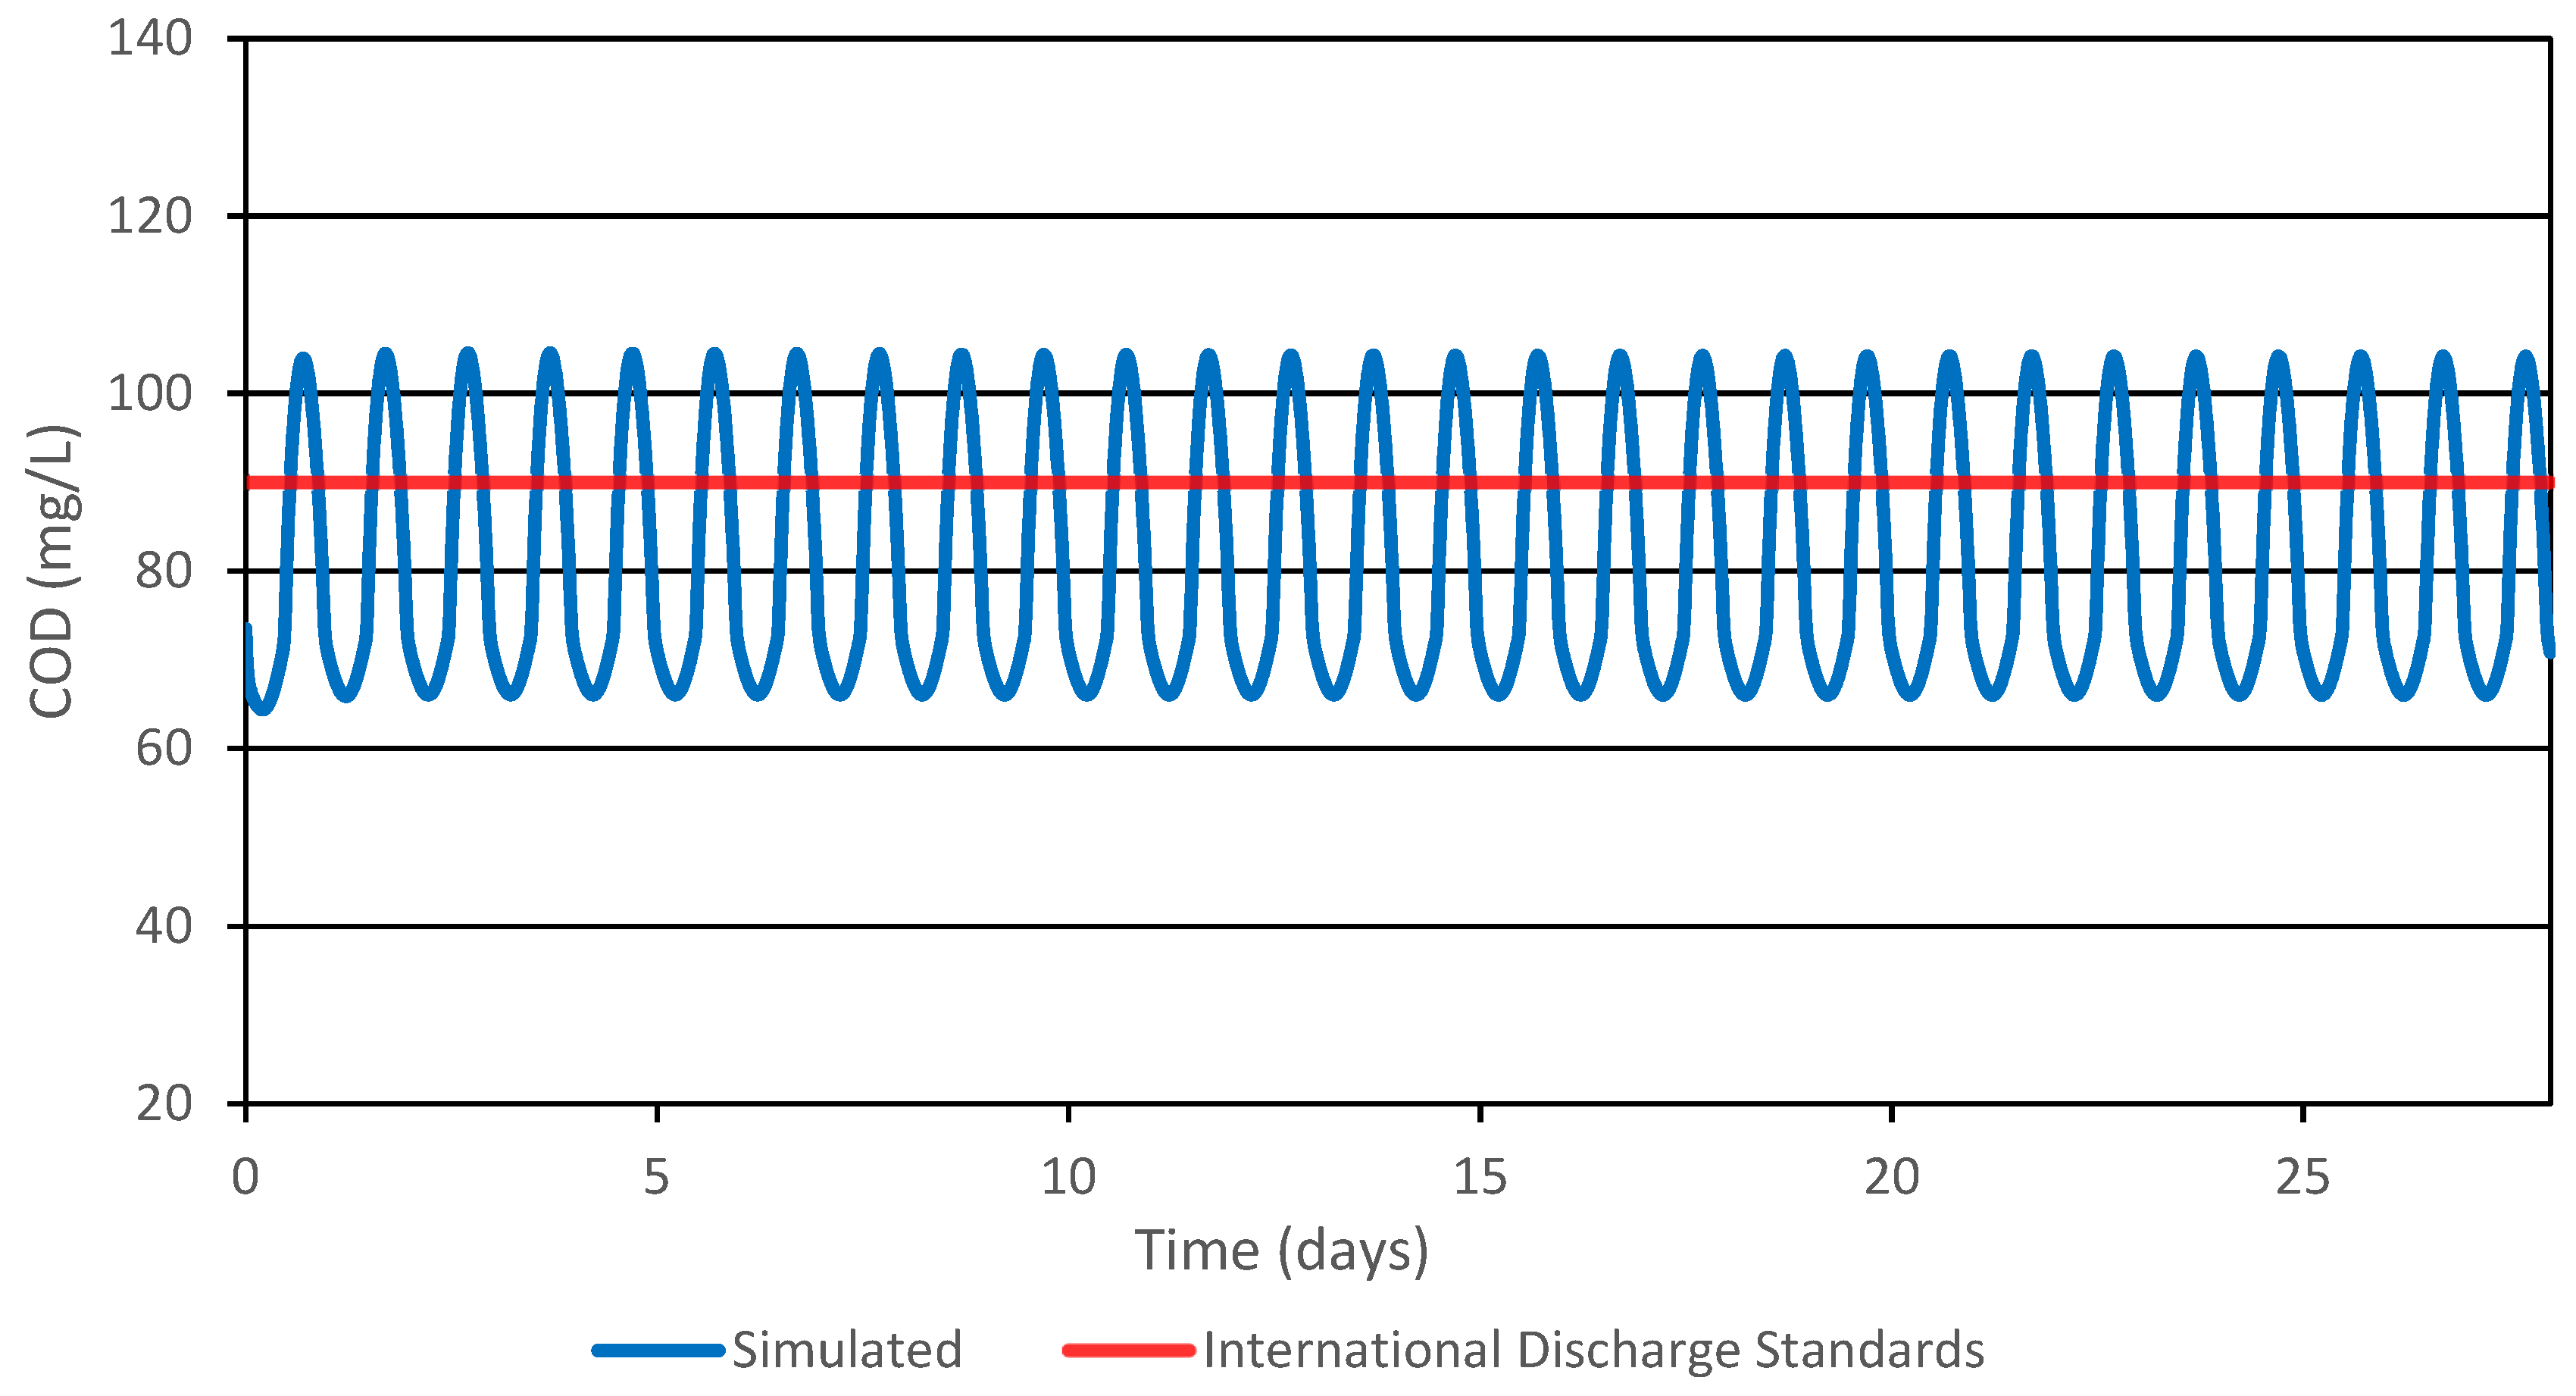
Figure 8 depicts the comparison between simulated and measured COD concentrations in the plant effluent, demonstrating a strong agreement during most of the simulation period. This should be attributed to both the good description of detailed influent wastewater characterization (SS, XS, SI, and XI) as well as the adjustment of the μ-max H value in accordance with the insights provided by [34].
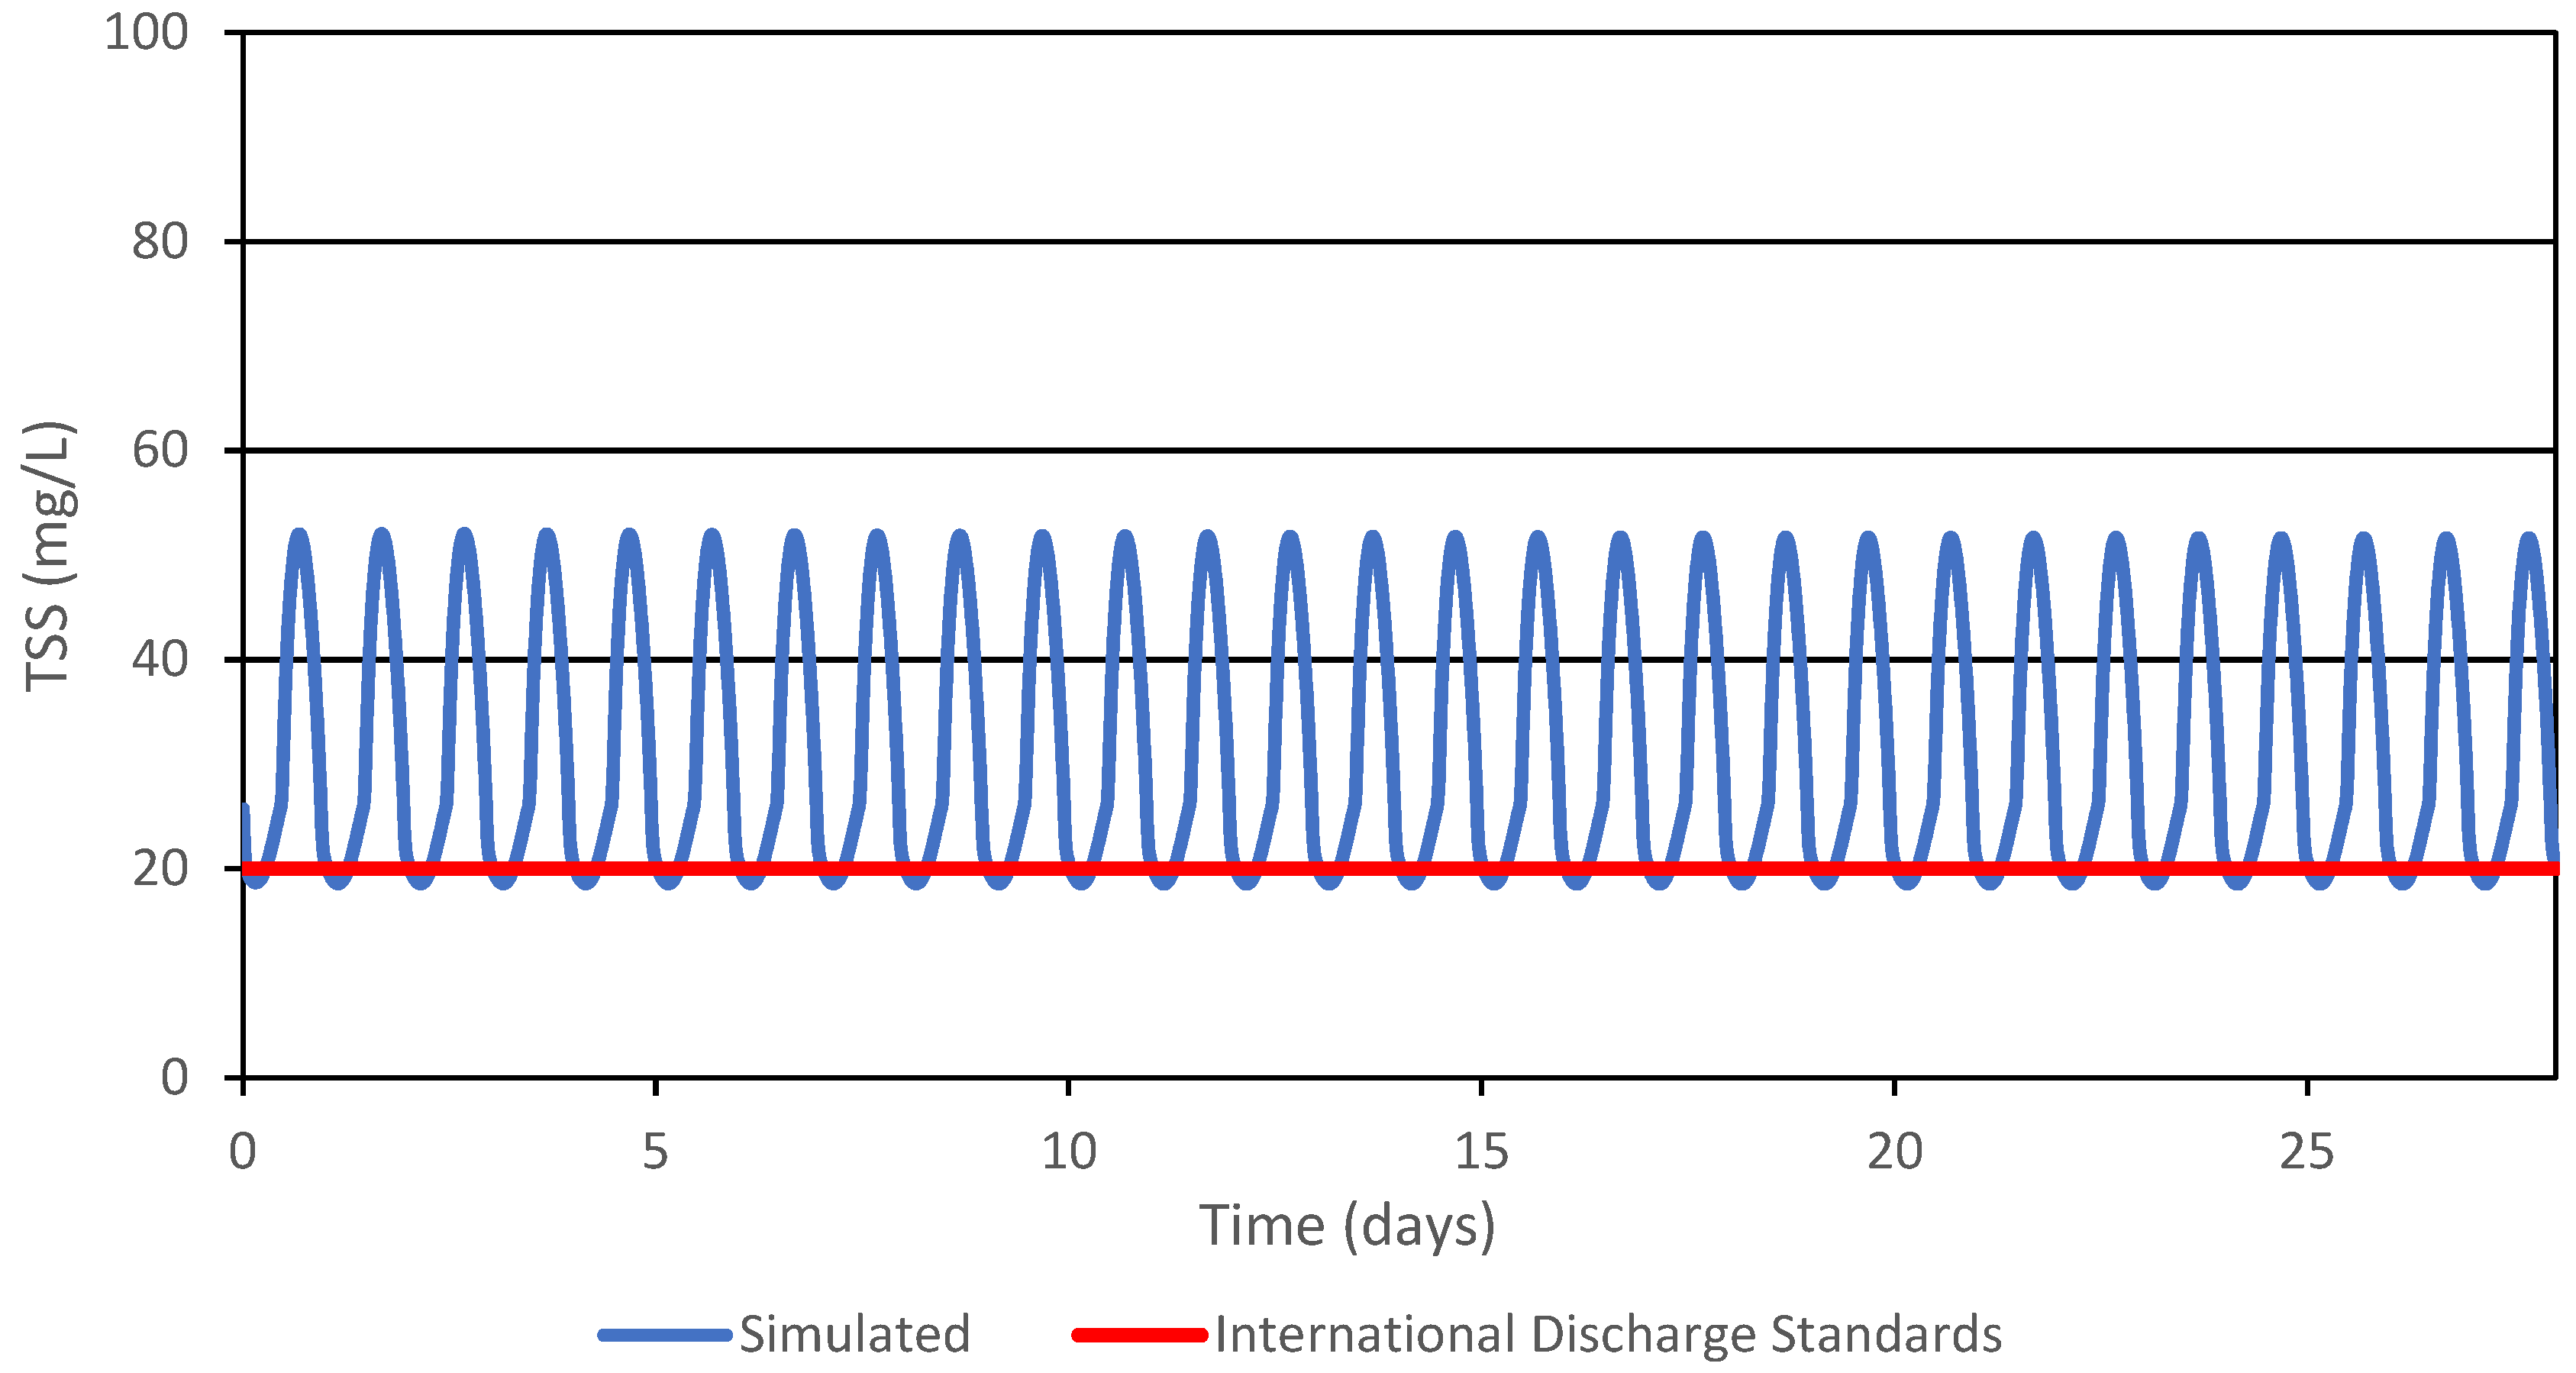
However, there is a relatively lower precision observed in depicting the behavior of TSS and NH4-N in the effluent (Figure 9 and Figure 10). The observed discrepancies could potentially stem from uncertainties linked to the observed TSS flows. It is notable that a considerable portion (86%) of the measured TSS effluent exceeds the 20 mg/L threshold, which corresponds to the limit discharge standards according to the World Health Organization (WHO) for wastewater [59]. Furthermore, the NH4-N effluent failed to meet the international discharge standard (<20 mg/L), with a deviation of 93.33% in NH4-N effluent concentrations exceeding the specified limit. These outcomes are consistent with similar findings in two separate studies conducted on sewage treatment plants in northeastern Algeria [58] and the United Arab Emirates [13]. In both cases, the dynamic simulation results exhibited relatively low congruence with the observed TSS and NH4-N values. Figure 10 provided additional insights, indicating that some parameters may not be suitable for autotrophic nitrifiers, including ammonium-oxidizing bacteria and little nitrite-oxidizing bacteria. This further confirms the challenges faced in accurately representing the behavior of these variables in the dynamic simulation.
Wastewater treatment does not appear to be an exact science; indeed, the ASP has improved considerably over the past few decades since the development of the ASM models, which constitute a management support tool particularly suitable for optimizing biological wastewater treatment processes. These results are commonly observed in dynamic simulations of biological treatment processes [60].
It is worth noting that a calibrated ASM1 model provides an accurate representation of the plant’s operations that constitutes a management support tool particularly suitable for describing biological wastewater treatment processes [34]. This study report can serve as a valuable training tool for plant operators, demonstrating its worth in predicting the oscillatory behavior of the output parameter values of COD effluent. This, in turn, equips the plant with the ability to proactively address challenges and strategically plan for future upgrades.

4. Conclusions

ASSs have emerged as the preferred choice for WWTPs worldwide as their usage has increased significantly over the past decade. In this contribution, a successful plant-wide modeling approach was undertaken for the Maghnia WWTP in Algeria. The physicochemical parameters for 56 water samples from both influent and effluent discharges were collected to detect the temporal changes in their qualities. The characterization of wastewater followed the CEMAGREF protocol, and the GPS-X simulation environment, based on the IWA ASM1 model for the activated sludge process, was implemented through a systematic step-wise procedure that involved adjusting certain stoichiometric and kinetic parameters of the model. The ASM1 model proved effective in precisely predicting the steady-state behavior of the WWTP’s removal processes for COD, TSS, and NH4-N, with corresponding RMSE values of 3.7%, 17%, and 37%, over an 18-month data period. Dynamic validation of the model using four months of acquired data produced RMSE values of less than 23% for the COD effluent, affirming the robust calibration of the model. However, simulated TSS and NH4-N exhibited less accuracy compared to measured values, with root mean square errors of 67% and 56%, respectively. Our study highlights the efficacy of plant-wide modeling in predicting COD removal performance, providing valuable insights and guidance for similar WWTPs in conducting plant-wide modeling and optimization. Nevertheless, the study faced challenges due to uncertainties in measuring TSS and NH4-N, warranting further efforts for the enhanced validation of the model concerning nitrogen and suspended solid removal processes.

Author Contributions

Conceptualization, S.M.T., M.B., C.A. and N.B.E.; methodology, S.M.T., M.B., C.A., N.B.E. and N.K.; software, S.M.T. and A.B.; validation, M.B., C.A., N.B.E., A.S. and N.K.; formal analysis, M.B., C.A., N.B.E. and N.K.; investigation, S.M.T. and A.B.; resources, S.M.T., A.B. and A.S.; data curation, S.M.T., A.B. and A.S.; writing—original draft preparation, S.M.T. and A.B.; writing—review and editing, S.M.T., M.B., C.A., N.B.E. and N.K.; visualization, M.B., N.B.E. and N.K.; supervision, M.B., C.A. and N.K.; project administration, C.A., M.B. and N.K. All authors have read and agreed to the published version of the manuscript.

Funding

This work was supported by the Open Access Publication Fund of the University of Bonn, Germany.

Data Availability Statement

Data is contained within the article.

Acknowledgments

The authors would like to express their sincere gratitude to the dedicated team at the National Sanitation Office in Tlemcen, as well as the personnel at the Maghnia Wastewater Treatment Plant, for generously providing the invaluable data for this study.

Conflicts of Interest

The authors declare no conflicts of interest.

Abbreviations

Nomenclature
bAdecay coefficient for autotrophic biomass (d−1);
bHdecay coefficient for heterotrophic biomass (d−1);
DO dissolved oxygen (mg/L);
fpfraction of biomass leading to particulate products;
iXBnitrogen fraction in biomass;
iXPnitrogen fraction in products from biomass;
khhydrolysis rate constant (d−1);
KOHoxygen half-saturation coefficient for heterotrophic biomass (mg/L);
Ks half-saturation coefficient for readily biodegradable substrate (mg/L);
Q influent flow rate (m3/d);
r i substrate utilization rate (mg/(L d));
r(ξ) conversion vector of the variable ξ (mg/(L d));
Si soluble inert organic matter (mg/L);
SNDsoluble biodegradable organic nitrogen (mg/L);
SNHammonia nitrogen (mg/L);
SNOnitrate and nitrite nitrogen (mg/L);
Ss readily biodegradable substrate (mg/L);
SS,ininfluent readily biodegradable substrate (mg/L);
t time (d);
T temperature (°C);
V reactor volume (L);
XBAactive autotrophic biomass (mg/L);
XBHactive heterotrophic biomass (mg/L);
XBH,ininfluent active heterotrophic biomass (mg/L);
Xi particulate inert organic matter (mg/L);
XNDparticulate biodegradable organic nitrogen (mg/L);
XPparticulate products arising from biomass decay (mg/L);
XSslowly biodegradable substrate (mg/L);
XS,ininfluent slowly biodegradable substrate (mg/L);
YAgrowth yield of autotrophic biomass;
YHgrowth yield of heterotrophic biomass.
Greek symbols
ξ vector of reactor and effluent concentration (mg/L);
ξin vector of influent concentration (mg/L);
μ–max Hmaximum specific growth rate for heterotrophic biomass (d − 1);
ρ(ξ) vector of reaction kinetics (mg/(L d));
ρj process rate (mg/(L d));
Θ hydraulic residence time, HRT (d);
νijstoichiometric coefficient;
ηgcorrection factor of µH under anoxic conditions;
ηhcorrection factor for hydrolysis under anoxic conditions.

References

  1. McHarg, A.M. Optimisation of Municipal Wastewater Biological Nutrient Removal Using Computer Simulation. Ph.D. Thesis, University of Ottawa, Ottawa, ON, Canada, 2002. [Google Scholar]
  2. Chachuat, B.; Latifi, A.; Roche, N. Methodologie d’Optimisation Dynamique et de Commande Optimale des Petites Stations d’Epuration a Boues Activees; Institut National Polytechnique de Lorraine (INPL): Vandoeuvre-lés-Nancy, France, 2001. [Google Scholar]
  3. Barnett, M.W.; Takacs, I.; Stephenson, J.; Gall, B.; Perdeus, M. Dynamic Modeling. Water Environ. Technol. 1995, 7, 41–44. [Google Scholar]
  4. Revollar, S.; Vilanova, R.; Vega, P.; Francisco, M.; Meneses, M. Wastewater Treatment Plant Operation: Simple Control Schemes with a Holistic Perspective. Sustainability 2020, 12, 768. [Google Scholar] [CrossRef]
  5. Han, H.-G.; Qiao, J.-F. Prediction of Activated Sludge Bulking Based on a Self-Organizing RBF Neural Network. J. Process Control 2012, 22, 1103–1112. [Google Scholar] [CrossRef]
  6. Olsson, G.; Newell, B. Wastewater Treatment Systems: Modelling, Diagnosis and Control. Water Intell. Online 2015, 4, 9781780402864. [Google Scholar] [CrossRef]
  7. Gujer, W.; Henze, M. Activated Sludge Modelling and Simulation. Water Sci. Technol. 1991, 23, 1011–1023. [Google Scholar] [CrossRef]
  8. Henze, M.; Gujer, W.; Mino, T.; Van Loosdrecht, M. Activated Sludge Models ASM1, ASM2, ASM2d and ASM3; IWA Scientific and Technical Report No. 9; IWA 2000 Publishing: London, UK, 2006. [Google Scholar]
  9. Jeppsson, U. Modelling Aspects of Wastewater Treatment Processes. Ph.D. Thesis, Department of Industrial Electrical Engineering and Automation, Lund Institute of Technology, Lund, Sweden, 1996. [Google Scholar]
  10. Nuhoglu, A.; Keskinler, B.; Yildiz, E. Mathematical Modelling of the Activated Sludge Process—The Erzincan Case. Process Biochem. 2005, 40, 2467–2473. [Google Scholar] [CrossRef]
  11. Van Loosdrecht, M.C.M.; Lopez-Vazquez, C.M.; Meijer, S.C.F.; Hooijmans, C.M.; Brdjanovic, D. Twenty-Five Years of ASM1: Past, Present and Future of Wastewater Treatment Modelling. J. Hydroinform. 2015, 17, 697–718. [Google Scholar] [CrossRef]
  12. Baek, S.H.; Jeon, S.K.; Pagilla, K. Mathematical Modeling of Aerobic Membrane Bioreactor (MBR) Using Activated Sludge Model No. 1 (ASM1). J. Ind. Eng. Chem. 2009, 15, 835–840. [Google Scholar] [CrossRef]
  13. Elshorbagy, W.E.; Shawaqfah, M. Development of an ASM1 Dynamic Simulation Model for an Activated Sludge Process in United Arab Emirates. Desalination Water Treat. 2015, 54, 15–27. [Google Scholar] [CrossRef]
  14. Mohammadi, F.; Rahimi, S.; Bina, B.; Amin, M.M. Modeling of Activated Sludge with ASM1 Model, Case Study on Wastewater Treatment Plant of South of Isfahan. Curr. World Environ. 2015, 10, 96–105. [Google Scholar] [CrossRef]
  15. Lahdhiri, A.; Lesage, G.; Hannachi, A.; Heran, M. Steady-State Methodology for Activated Sludge Model 1 (ASM1) State Variable Calculation in MBR. Water 2020, 12, 3220. [Google Scholar] [CrossRef]
  16. STOWA. Methoden voor Influentkarakterisering—Inventarisatie en Richtlijnen; STOWA Report 80-96; STOWA: Utrecht, The Netherlands, 1996. [Google Scholar]
  17. Sollfrank, U.; Gujer, W. Characterisation of Domestic Wastewater for Mathematical Modelling of the Activated Sludge Process. Water Sci. Technol. 1991, 23, 1057–1066. [Google Scholar] [CrossRef]
  18. Stokes, L.; Takács, I.; Watson, B.; Watts, J.B. Dynamic Modelling of an ASP Sewage Works—A Case Study. Water Sci. Technol. 1993, 28, 151–161. [Google Scholar] [CrossRef]
  19. Weijers, S.R.; Kok, J.J.; Preisig, H.A.; Buunen, A.; Wouda, T.W.M. Parameter Identifiablity in the IAWQ Model No. 1 for Modelling Activated Sludge Plants for Enhanced Nitrogen Removal. Comput. Chem. Eng. 1996, 20, S1455–S1460. [Google Scholar] [CrossRef]
  20. Schütze, M.R.; Butler, D.; Beck, M.B. Modelling, Simulation and Control of Urban Wastewater Systems; Springer: London, UK, 2002; ISBN 978-1-4471-1105-4. [Google Scholar]
  21. Hauduc, H.; Gillot, S.; Rieger, L.; Ohtsuki, T.; Shaw, A.; Takács, I.; Winkler, S. Activated Sludge Modelling in Practice: An International Survey. Water Sci. Technol. 2009, 60, 1943–1951. [Google Scholar] [CrossRef] [PubMed]
  22. ONS: Office National des Statistiques. Available online: https://www.ons.dz/spip.php?rubrique127 (accessed on 17 June 2023).
  23. Medejerab, A.; Henia, L. Variations spatio-temporelles de la sècheresse climatique en Algérie nord-occidentale. Courr. Savoir 2011, 11, 71–79. [Google Scholar]
  24. ONA. 2013 National Sanitation Office. Available online: http://ona-dz.org/cgi-sys/suspendedpage.cgi (accessed on 17 June 2023).
  25. APHA. Standard Methods for the Examination of Water and Wastewater, 22nd ed.; Rice, E.W., Baird, R.B., Eaton, A.D., Clesceri, L.S., Eds.; American Public Health Association (APHA): Washington, DC, USA, 2012. [Google Scholar]
  26. Hydromantis Water and Wastewater Treatment Modeling and Simulation Software|Hydromantis. Available online: https://www.hydromantis.com/ (accessed on 17 June 2023).
  27. Mu’azu, N.D.; Alagha, O.; Anil, I. Systematic Modeling of Municipal Wastewater Activated Sludge Process and Treatment Plant Capacity Analysis Using GPS-X. Sustainability 2020, 12, 8182. [Google Scholar] [CrossRef]
  28. Hydromantis, G.-X.; Environmental Software Solutions Inc. Hydromantis GPS-X Technical Reference; Environmental Software Solutions Inc.: Hamilton, ON, Canada, 2017; Available online: https://www.hydromantis.com/help/GPS-X/docs/8.0/Technical/index.html (accessed on 11 June 2023).
  29. Fehlberg, E. Klassische Runge-Kutta-Formeln fünfter und siebenter Ordnung mit Schrittweiten-Kontrolle. Computing 1969, 4, 93–106. [Google Scholar] [CrossRef]
  30. Henze, M.; Grady, C.P.L.; Gujer, W.; Marais, G.V.R.; Matsuo, T. A General Model for Single-Sludge Wastewater Treatment Systems. Water Res. 1987, 21, 505–515. [Google Scholar] [CrossRef]
  31. Costa, C. A Comprehensive View of the ASM1 Dynamic Model: Study on a Practical Case. Water 2022, 14, 1046. [Google Scholar] [CrossRef]
  32. Costa, C.; Domínguez, J.; Autrán, B.; Márquez, M.C. Dynamic Modeling of Biological Treatment of Leachates from Solid Wastes. Environ. Model. Assess. 2018, 23, 165–173. [Google Scholar] [CrossRef]
  33. Takacs, I. A Dynamic Model of the Clarification-Thickening Process. Water Res. 1991, 25, 1263–1271. [Google Scholar] [CrossRef]
  34. Petersen, B.; Gernaey, K.; Henze, M.; Vanrolleghem, P.A. Calibration of Activated Sludge Models: A Critical Review of Experimental Designs. In Biotechnology for the Environment: Wastewater Treatment and Modeling, Waste Gas Handling; Agathos, S.N., Reineke, W., Eds.; Focus on Biotechnology; Springer: Dordrecht, The Netherlands, 2003; pp. 101–186. ISBN 978-94-017-0932-3. [Google Scholar]
  35. Henze, M.; Grady, L., Jr.; Gujer, W.; Marais, G.; Matsuo, T. Activated Sludge Model No 1. Wat. Sci. Technol. 1987, 29, 183–193. [Google Scholar]
  36. Siegrist, H.; Tschui, M. Interpretation of Experimental Data with Regard to the Activated Sludge Model No.1 and Calibration of the Model for Municipal Wastewater Treatment Plants. Water Sci. Technol. 1992, 25, 167–183. [Google Scholar] [CrossRef]
  37. Maurer, M.; Gujer, W. Dynamic Modelling of Enhanced Biological Phosphorus and Nitrogen Removal in Activated Sludge Systems. Water Sci. Technol. 1998, 38, 203–210. [Google Scholar] [CrossRef]
  38. Van Veldhuizen, H. Modelling Biological Phosphorus and Nitrogen Removal in a Full Scale Activated Sludge Process. Water Res. 1999, 33, 3459–3468. [Google Scholar] [CrossRef]
  39. Gaudy, A.F.; Jrand Gaudy, E.T. Biological Concepts for Design and Operation of the Activated Sludge Process; US Environmental Protection Agency Water Pollution Research Series, Report No. 17090, FQJ, 09/71; US EPA: Washington, DC, USA, 1971. [Google Scholar]
  40. Dupont, R.; Sinkjær, O. Optimisation of W ASTEW A TER treatment plants by means of computer models. Water Sci. Technol. 1994, 30, 181–190. [Google Scholar] [CrossRef]
  41. Kristensen, G.H.; Jansen, J.L.C.; Jorgensen, P.E. Batch Test Procedures as Tools for Calibration of the Activated Sludge Model—A Pilot Scale Demonstration. Water Sci. Technol. 1998, 37, 235–242. [Google Scholar] [CrossRef]
  42. Henze, M.; Gujer, W.; Mino, T.; Matsuo, T.; Wentzel, M.C.; Marais, G.V.R.; Van Loosdrecht, M.C.M. Activated Sludge Model No.2d, ASM2D. Water Sci. Technol. 1999, 39, 165–182. [Google Scholar] [CrossRef]
  43. Sharifi, S.; Murthy, S.; Takács, I.; Massoudieh, A. Probabilistic Parameter Estimation of Activated Sludge Processes Using Markov Chain Monte Carlo. Water Res. 2014, 50, 254–266. [Google Scholar] [CrossRef]
  44. Spérandio, M.; Espinosa, M.C. Modelling an Aerobic Submerged Membrane Bioreactor with ASM Models on a Large Range of Sludge Retention Time. Desalination 2008, 231, 82–90. [Google Scholar] [CrossRef]
  45. Sin, G.; Kaelin, D.; Kampschreur, M.J.; Takács, I.; Wett, B.; Gernaey, K.V.; Rieger, L.; Siegrist, H.; Van Loosdrecht, M.C.M. Modelling Nitrite in Wastewater Treatment Systems: A Discussion of Different Modelling Concepts. Water Sci. Technol. 2008, 58, 1155–1171. [Google Scholar] [CrossRef] [PubMed]
  46. Power, M. The Predictive Validation of Ecological and Environmental Models. Ecol. Model. 1993, 68, 33–50. [Google Scholar] [CrossRef]
  47. Surampalli, R. Nitrification, Denitrification and Phosphorus Removal in Sequential Batch Reactors. Bioresour. Technol. 1997, 61, 151–157. [Google Scholar] [CrossRef]
  48. Choubert, J.M. Analyse et Optimisation du Traitement de l’Azote par Boues Activées à Basse Température. Ph.D. Thesis, Université Louis Pasteur, Strasbourg, France, 2002. [Google Scholar]
  49. Choubert, J.-M.; Racault, Y.; Grasmick, A.; Beck, C.; Heduit, A. Nitrogen Removal from Urban Wastewater by Activated Sludge Process Operated over the Conventional Carbon Loading Rate Limit at Low Temperature. Water SA 2005, 31, 503–510. [Google Scholar] [CrossRef]
  50. Marquot, A.; Stricker, A.-E.; Racault, Y. ASM1 Dynamic Calibration and Long-Term Validation for an Intermittently Aerated WWTP. Water Sci. Technol. 2006, 53, 247–256. [Google Scholar] [CrossRef]
  51. Elawwad, A.; Matta, M.; Abo-Zaid, M.; Abdel-Halim, H. Plant-Wide Modeling and Optimization of a Large-Scale WWTP Using BioWin’s ASDM Model. J. Water Process Eng. 2019, 31, 100819. [Google Scholar] [CrossRef]
  52. Barker, P.S.; Dold, P.L. General Model for Biological Nutrient Removal Activated-Sludge Systems: Model Presentation. Water Environ. Res. 1997, 69, 969–984. [Google Scholar] [CrossRef]
  53. Henze, M.; Van Loosdrecht, M.C.M.; Ekama, G.A.; Brdjanovic, D. Biological Wastewater Treatment: Principles, Modelling and Design; IWA Publishing: London, UK, 2008; ISBN 978-1-78040-186-7. [Google Scholar]
  54. Makinia, J.; Rosenwinkel, K.-H.; Spering, V. Comparison of Two Model Concepts for Simulation of Nitrogen Removal at a Full-Scale Biological Nutrient Removal Pilot Plant. J. Environ. Eng. 2006, 132, 476–487. [Google Scholar] [CrossRef]
  55. Vanrolleghem, P.; Insel, G.; Petersen, B.; Sin, G.; Pauw, D.; Nopens, I.; Dovermann, H.; Weijers, S.; Gernaey, K. A Comprehensive Model Calibration Procedure for Activated Sludge Models; Water Environment Federation: Alexandria, VA, USA, 2003. [Google Scholar] [CrossRef]
  56. Nelson, M.I.; Sidhu, H.S. Analysis of the Activated Sludge Model (Number 1). Appl. Math. Lett. 2009, 22, 629–635. [Google Scholar] [CrossRef]
  57. Nguyen, D.H.; Latifi, M.A.; Lesage, F.; Mulholland, M. Dynamic Simulation and Optimization of Wastewater Treatment Plants. In Proceedings of the 2013 International Conference on Process Control (PC), Strbske Pleso, Slovakia, 18–21 June 2013; pp. 407–414. [Google Scholar]
  58. Dairi, S.; Yassine, D.; Yahia, H.; Mrad, D. Dynamic Simulation for Wastewater Treatment Plants Management: Case of Souk-Ahras Region, North-Eastern Algeria. J. Water Land Dev. 2017, 34, 221. [Google Scholar] [CrossRef]
  59. World Health Organization (WHO). Guidelines for the Safe Use of Wastewater, Excreta and Greywater, Volume 4: Excreta and Greywater Use in Agriculture; WHO: Geneva, Switzerland, 2006. [Google Scholar]
  60. Fenu, A.; Guglielmi, G.; Jimenez, J.; Spèrandio, M.; Saroj, D.; Lesjean, B.; Brepols, C.; Thoeye, C.; Nopens, I. Activated Sludge Model (ASM) Based Modelling of Membrane Bioreactor (MBR) Processes: A Critical Review with Special Regard to MBR Specificities. Water Res. 2010, 44, 4272–4294. [Google Scholar] [CrossRef] [PubMed]
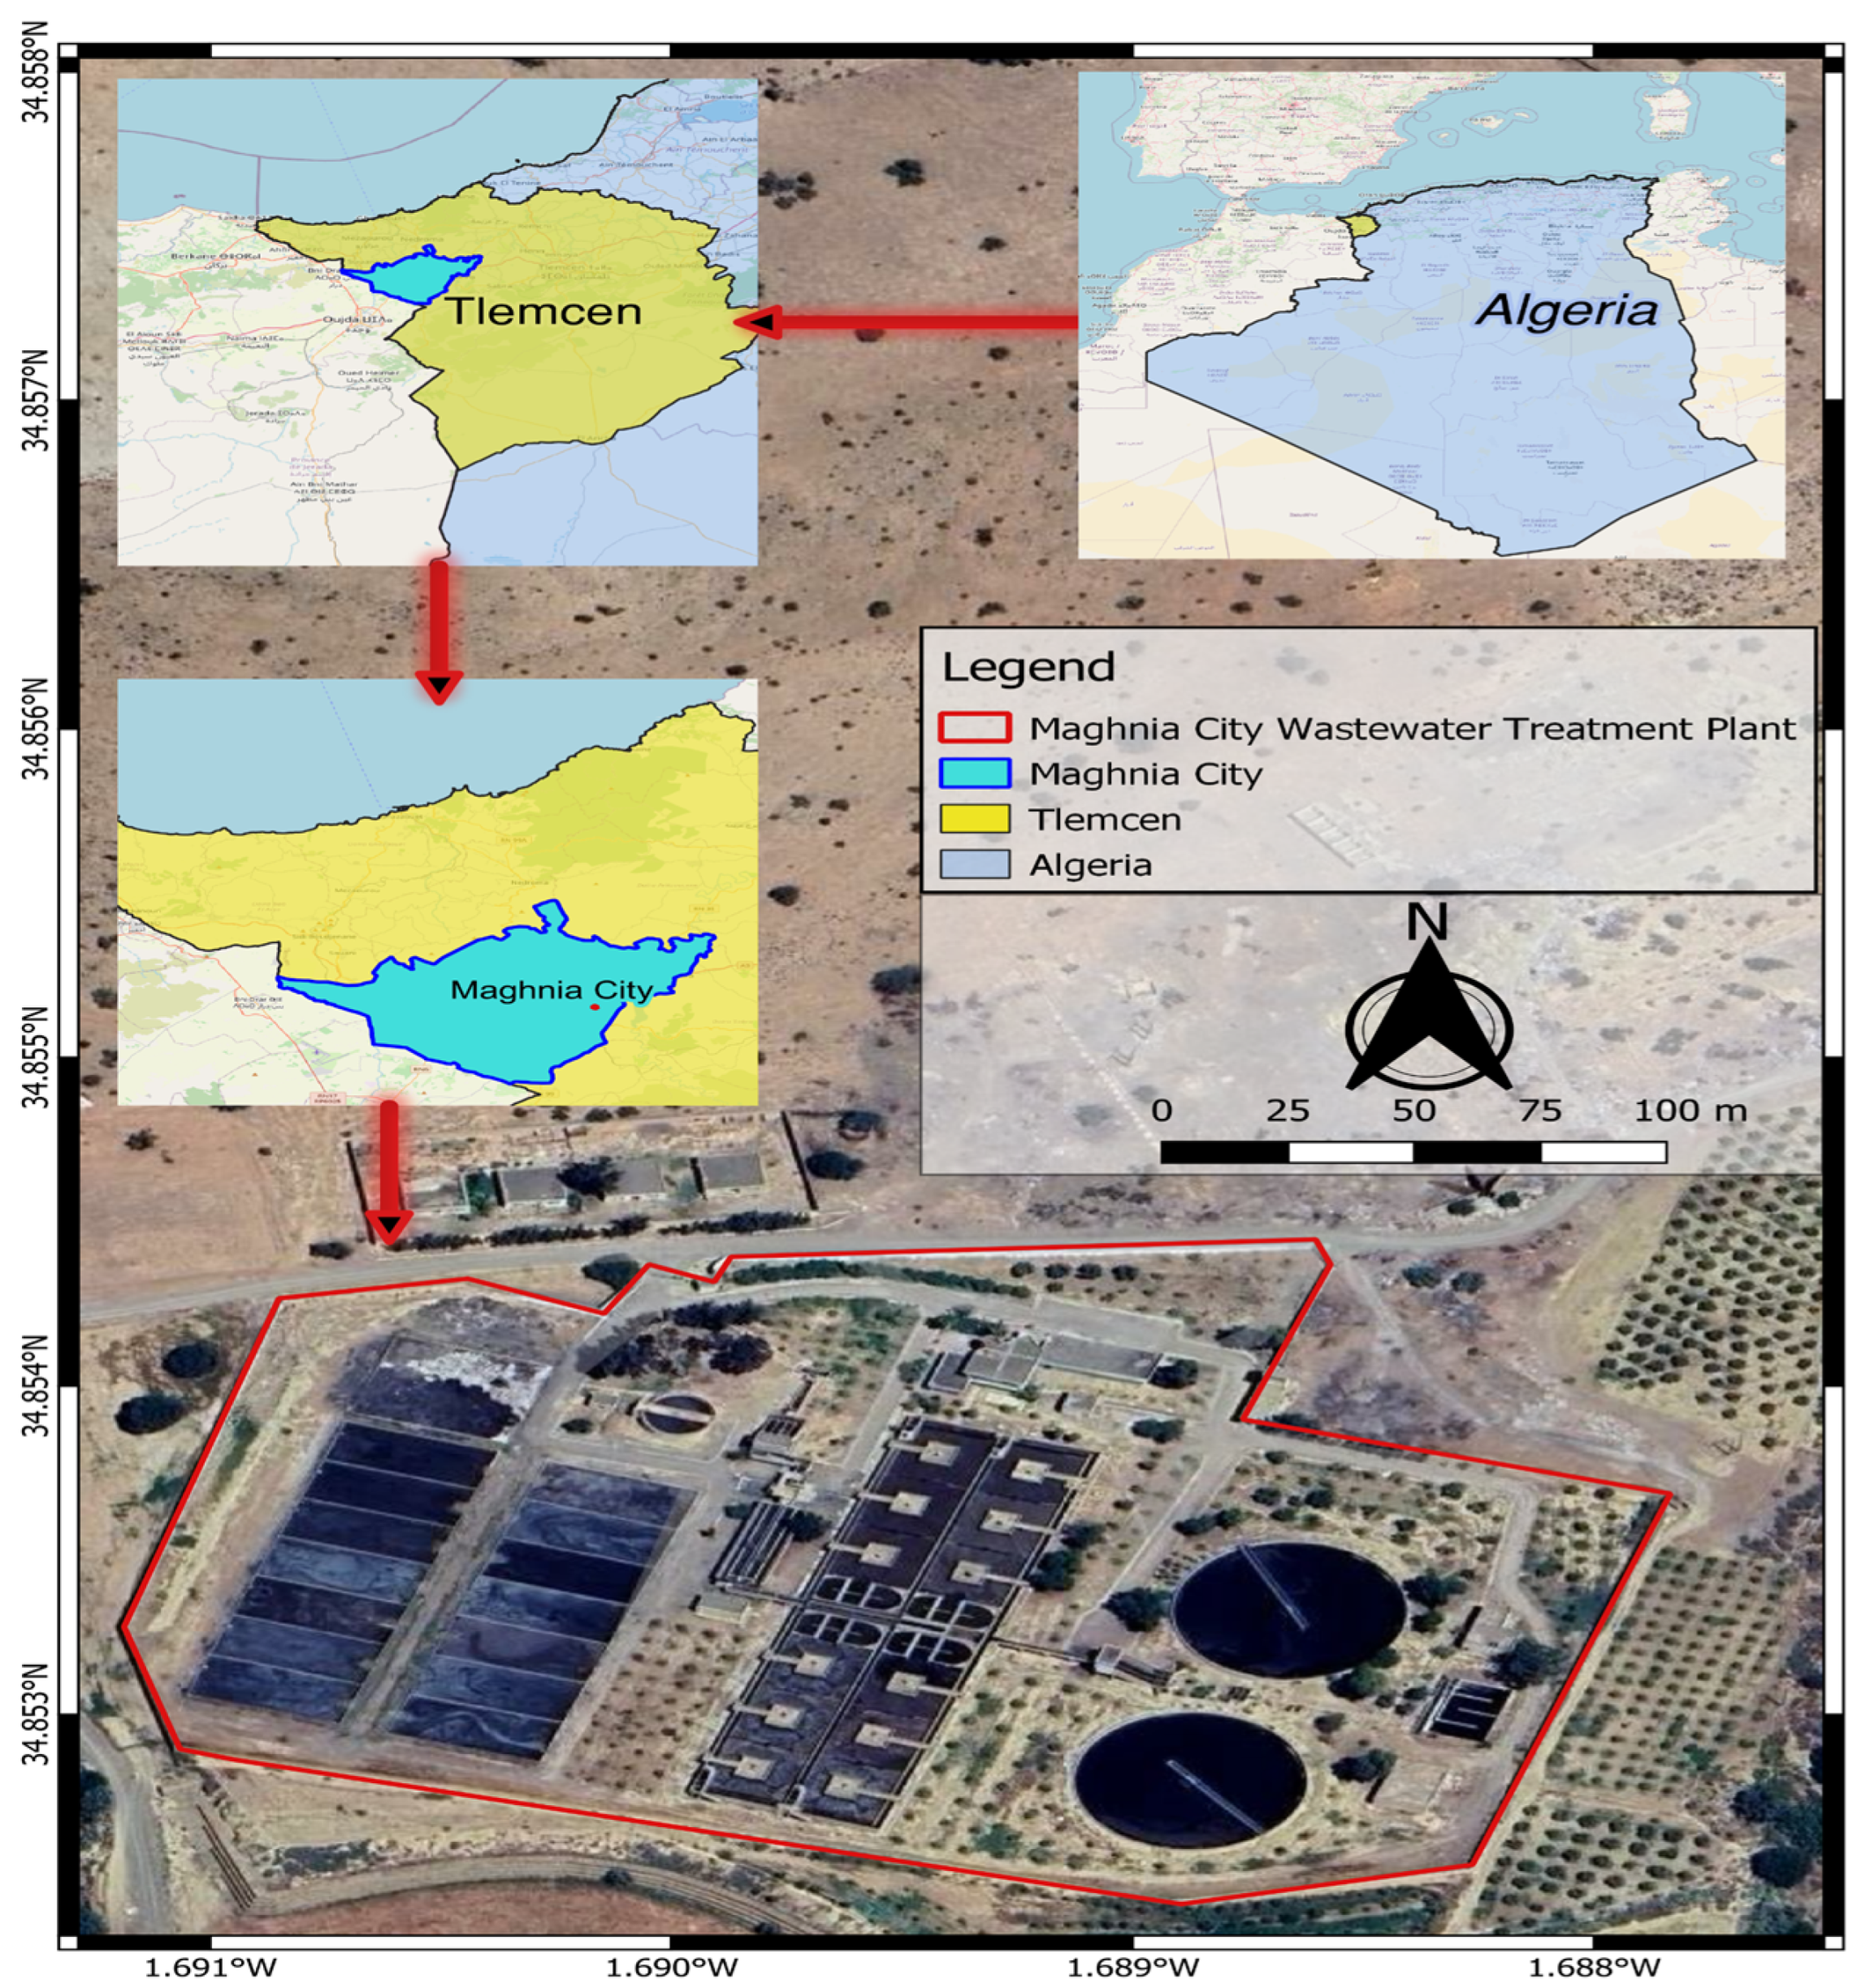
Figure 1. Geographic location and an aerial view of the MCWWTP.
Water 16 00269 g001
Figure 2. Flow sheet of Maghnia WWTP.
Water 16 00269 g002
Figure 3. Scheme of activated sludge recirculation at the Maghnia WWTP.
Water 16 00269 g003
Figure 4. COD components in ASM1 [9].
Water 16 00269 g004
Figure 5. Steady-state calibration results for the effluent COD.
Water 16 00269 g005
Figure 6. Steady-state calibration results for the effluent TSS.
Water 16 00269 g006
Figure 7. Steady-state calibration results for the effluent NH4-N.
Water 16 00269 g007
Figure 8. Dynamic simulation results for the effluent COD.
Water 16 00269 g008
Figure 9. Dynamic simulation results for the effluent TSS.
Water 16 00269 g009
Figure 10. Dynamic simulation results for the effluent NH4-N.
Water 16 00269 g010
Table 1. Operating data of the Maghnia City wastewater treatment plant.
ParametersUnitMCWWTP
Populationinhabitants150,000
Average daily flow ratem3.d−129,400
Flow to discharge in case of rainm3.h−130,312
peak flowm3.h−13266
BOD loadkg.d−19614
Suspended Solidskg.d−117,640
Recirculation Flow RASm3.h−11300
Table 2. Peterson State variables and process matrix. Components are recorded in columns and processes are identified in rows.
iComponent12345678910111213
jProcessSISSXIXSXBHXBAXPSOSNOSNHSDXNDSALK
1-Aerobic growth of
heterotrophs
1 Y H 1 1 Y H Y H i XB i XB 14
2-Anoxic growth of
heterotrophs
1 Y H 1 1 Y H 2.86 Y H i XB 1 Y H 14 × 2.86 Y H i XB 14
3-Aerobic growth of
autotrophs
1 4.57 Y A Y A 1 Y A i XB 1 Y A i XB 14 1 7 Y A
4-Decay of
heterotrophs
1 fP 1 fP i XB fP i XB
5-Decay of
autotrophs
1 fP 1fP i XB fP i XB
6-Ammonification of soluble organic nitrogen 1 1 1 14
7-Hydrolysis of entrapped organics 1 1
8-Hydrolysis of entrapped organics nitrogen 1 1
Table 3. Settling model parameters.
ParametersSymbolUnitDefault Value
Theoretical maximum sedimentation rate.°Fm.j−1712
Maximum effective sedimentation rate. u s , 0 m.j−1340
Sedimentation parameter for highly concentrated suspensions. r h m3.g−14.26 × 10⁻⁴
Sedimentation parameter for weakly concentrated suspensions. r p m3.g−15.0 × 10⁻³
Unsettled fraction of incidental solids. f n s -5.0 × 10⁻⁴
Limit concentration of suspended solids. X t m a x g.m−33000
Table 4. Statistical results of measured parameters for influent wastewater.
ParameterUnitMinQ1MedianQ3MaxMeanSD
Influent Values
TSSmg/L76.00210.00261.00335.00583.00280.44123.84
BODmgO2/L170.00360.00460.00592.00850.00467.52152.96
CODmgCOD/L190.00555.50653.00918.001403.00719.04271.67
NH4-NmgN/L25.3649.6752.0060.1179.7454.3110.27
NO3-NmgN/L0.140.230.320.522.700.510.52
NO2-NmgN/L0.150.280.400.490.960.400.17
PO4-Pmg/L7.3010.4011.9014.9021.5012.653.28
Temp°C13.0020.0026.5029.5032.0024.855.72
PH-7.057.377.577.958.217.630.33
Effluent Values
TSSmg/L13.0021.0024.5028.0035.0024.395.45
BODmgO2/L4.0020.0023.5026.5036.0022.688.40
CODmgCOD/L42.0061.5070.0072.7590.0067.7111.33
NH4-NmgN/L18.5025.4832.5840.0357.0833.5410.12
NO3-NmgN/L0.020.030.060.082.400.230.62
NO2-NmgN/L0.020.040.050.070.570.100.14
PO4-Pmg/L2.105.6310.0517.7034.8013.039.40
Temp°C13.0019.3826.2529.6332.0024.685.84
PH-6.777.357.697.968.197.620.39
Table 5. Parameters related to the organic matter fractionations (COD).
Parameter FractionSymbolRatioValue gCOD/m3Reference
Soluble biodegradable substrateSS0.32230.10[49,50]
Soluble inert substrateSI0.05640.26[36]
Particulate biodegradable substrateXS0.574412.72Own Study [XS = TCOD − (SS + SI + XI)]
Particulate inert substrateXI0.0535.95[49,50]
Table 6. Calibrated and typical values for kinetic and stoichiometric parameters at neutral pH.
ParametersSymbolUnitRangeDefault ValuesCalibrated ValuesReferences
Stoichiometric Parameters
Yield for heterotrophic biomassYHg COD/g COD(0.57–0.67)0.670.66[52]
Yield for Autotrophic biomassYAg COD/g COD(0.15–0.24)0.240.24[53]
volatile suspended solids/total suspended solidsVSS/TSSg VSS/g TSS-0.700.80[52]
particulate COD to total CODXCOD/VSS1g COD/g VSS-1.481.3[54]
Kinetic Parameters
Maximum specific growth rate for heterotrophic biomassμ–max Hd−1(0.6–13.2)63.2[52]
Heterotrophic decay coefficientbHd−1(0.3–1.2)0.620.66[30]
Half saturation constantKsmg3 COD/L(10–40)2020[30]
Table 7. RMSE values of different output variables tested for a steady-state simulation (COD, TSS, and NH4-N).
ParameterUnitMeasurementSimulation RMSE
CODmg/L67.7170.250.037
TSSmg/L24.3920.230.17
NH4-Nmg/L33.5421.030.37
Table 8. RMSE values of different output variables tested for a dynamic simulation (COD, TSS, and NH4-N).
ParameterUnitMeasurementSimulation RMSE
CODmg/L66.7570.440.23
TSSmg/L8.1525.060.67
NH4-Nmg/L14.5432.270.56
Disclaimer/Publisher’s Note: The statements, opinions and data contained in all publications are solely those of the individual author(s) and contributor(s) and not of MDPI and/or the editor(s). MDPI and/or the editor(s) disclaim responsibility for any injury to people or property resulting from any ideas, methods, instructions or products referred to in the content.