Article

Enhanced Adsorption Capacity of Methylene Blue Dye onto Kaolin through Acid Treatment: Batch Adsorption and Machine Learning Studies

1
Département de Chimie, Faculté des Sciences Exactes, Université de Bejaia, Bejaia 06000, Algeria
2
Laboratoire de Gestion et Valorisation des Ressources Naturelles et Assurance Qualité, Faculté SNVST, Université de Bouira, Bouira 10000, Algeria
3
Technology Laboratory of Materials and Process Engineering (LTMGP), University of Bejaia, Bejaia 06000, Algeria
4
Laboratoire E2Lim, Faculté des Sciences et Techniques, Université de Limoges, 123 Avenue Albert Thomas, 87060 Limoges, France
5
Université de Rennes, Ecole Nationale Supérieure de Chimie de Rennes, CNRS, ISCR—UMR6226, 35000 Rennes, France
6
Laboratoire de Génie des Procédés Chimiques, Department of Process Engineering, University of Ferhat Abbas, Setif 19137, Algeria
7
Laboratory of Biomaterials and Transport Phenomena (LBMPT), University of Médéa, Nouveau Pôle Urbain, Médéa 26000, Algeria
8
Center for Energy and Environmental Materials, Institute of Fundamental and Applied Sciences, Duy Tan University, Ho Chi Minh City 700000, Vietnam
9
Faculty of Environmental and Chemical Engineering, Duy Tan University, Da Nang 550000, Vietnam
10
Department of Chemistry, College of Sciences, King Saud University, Riyadh 11451, Saudi Arabia
*
Author to whom correspondence should be addressed.
Water 2024, 16(2), 243; https://doi.org/10.3390/w16020243
Submission received: 15 December 2023 / Revised: 1 January 2024 / Accepted: 4 January 2024 / Published: 10 January 2024
(This article belongs to the Special Issue Water Treatment Technology for Emerging Contaminants)

Abstract

:
Algerian kaolinite, sourced from Djebel Debbagh nuance 3 (DD3), was used as a low-cost adsorbent to remove methylene blue (MB) dye from water. Its adsorption capacity was enhanced through sulfuric acid treatment (treated-DD3). In response to the urgent demand for clean water, various technologies have been developed to address dye removal from wastewater. This study, specifically delving into the treatment of textile wastewater, examined the efficacy of treated-DD3 through adsorption processes. The acid treatment increased the surface area and pore volume of DD3. X-ray diffraction showed crystalline phases in both, with treated-DD3 having higher crystallinity. Fourier-transform infrared spectroscopy found no significant differences post-acid treatment. Scanning electron microscopy revealed DD3 had large, stacked particles with low surface area, while treated-DD3 had increased porosity and a smoother surface. Various parameters affecting MB adsorption were studied. The Langmuir and Freundlich models were used for isotherm parameters. Treated-DD3 exhibited a higher MB adsorption capacity (64.58 mg/g according to the Langmuir model) than DD3 (44.48 mg/g). Thermodynamic analysis indicated spontaneous and endothermic MB adsorption onto both DD3-BM and treated-DD3-BM systems under different pH conditions. Treated-DD3 effectively reduced chemical oxygen demand (from 304.056 mg/L to 34.44 mg/L) and biological oxygen demand (from 80 mg/L to 20 mg/L) in real textile wastewater. The adsorbent exhibited rapid removal and decolorization, surpassing 93% within the first 7 min of the experiment. The Gaussian process regression and particle swarm optimization (GPR–PSO) predicted MB adsorption capacity effectively (R = 0.9989, R2 = 0.9978, adj-R2 = 0.9978, RMSE = 1.1390, and MAE = 0.3926).

Graphical Abstract

1. Introduction

Protecting water is vital for life on Earth and environmental sustainability [1]. Industrial and metallurgical effluent pollutants (metal cations, organic dyes, chemicals, and overused antibiotics) are a major source of water pollution each year [2,3,4]. Furthermore, when these effluents are often overloaded with dyes, they are very hazardous to the environment and human health [5,6,7,8,9]. Therefore, it is necessary to develop effective treatment methods for minimizing this pollution.
Dye pollutants are a major contributor to environmental risks and pollution due to their high production (7 × 10⁵ tons/year) and usage in various industries (i.e., textiles, paper, and leather) [10]. The release of colored effluents from industries into the environment without treatment causes some elevated toxicity levels and environmental damage [11,12,13,14].
Methylene blue (MB) is one of the most well-known cationic dyes; it is generally used for dyeing cotton, silk, and wood [12,15,16,17]. The risks associated with its presence in wastewater mainly come from its multiple health hazards (i.e., respiratory distress, gastrointestinal diseases, blindness, and digestive and mental issues). Additionally, its toxicity results in a range of symptoms such as vomiting, nausea, diarrhea, cyanosis, shock, gastritis, jaundice, methemoglobinemia, elevated heart rate, tissue necrosis, and skin and eye irritation [18].
Hence, the removal of dyes from wastewater before release into mainstream water is important owing to their poor biodegradability. Various procedures and treatment methods have been employed throughout the last years for removing dyes from wastewater sources. Among current methods such as chemical oxidation [19], filtration [20], coagulation–flocculation [21], ozonation [22], membrane processes [23], biological treatment [24], precipitation, ion exchange [25], and photocatalytic degradation [26], adsorption is one of the most commonly used techniques for treating textile dye pollutants in water [27,28,29,30]. This is because of its low cost, ease of use, high efficiency, availability, and simple design, as well as its ability to handle a wide range of pollutants and adsorbents. It is considered environmentally friendly and poses minimal ecological risks. These factors make adsorption a more attractive option compared to the other approaches [3,7,9,11,27,28]. In the literature, many absorbents were used for the removal of pollutants from the environment, such as graphene/montmorillonite [29], chitosan/clay [6], bentonite [16], alginate beads [14], smectite [30], zeolite [31], and activated carbon [27]. Among them, clays are widely used as adsorbents due to their inexpensive cost, specific surface area, excellent stability, and variety of properties. They are formed by the collision of rocks, soils, and sediments and exhibit a layered structure composed of tetrahedral and octahedral sheets. Notably, the adsorption capacity of clays is generally determined by their chemical composition and pore structure [2,32,33].
Kaolinite clay (phyllosilicate minerals) is a mineral commonly found in highly weathered soils and sediments, and it is a potential adsorbent for removing organic compounds and potentially toxic metal ions from water. Although kaolinite exhibits a low cation-exchange capacity, its adsorption capacity makes it useful for removing inorganic and organic contaminants. Kaolinite (with its chemical formula of Al2Si2O5(OH)4) is a 1:1 aluminosilicate composed of stacked tetrahedral silica sheets and octahedral alumina sheets held together by hydrogen bonding. Its crystal structure includes a silica face with SiO2 tetrahedra, an alumina face with Al–OH groups, and edges with both Si–OH and Al–OH sites [3,34,35,36]. The structural dislocation (caused by the unconformity between the tetrahedral sheet and the octahedral sheet) of kaolinite promotes the automatic winding of the single sheet or thin sheet into nano-rollers because the lateral size of octahedral Al–O layer is slightly smaller than that of the tetrahedral Si–O layer. The formed nano-rollers have a tetrahedral Si–O sheet on the outside and an octahedral Al–O sheet on its inside. The octahedral sheet and crystal edges have a pH-dependent variable charge due to the protonation and deprotonation of the hydroxyl (–OH) group on its surface [37]. Although kaolinite has been employed in research studies for wastewater remediation and the removal of cationic dyes from aqueous solutions, according to some studies [11,38], until now, acid activation has been one of the most beneficial, simplest, cheapest, and successful chemical treatments for modifying kaolinite to obtain the necessary attributes using inorganic acids at a certain temperature to raise the acidity, surface area, and porosity of the clays [32,39].
The adsorption process for reducing contamination in discharges is effective, but optimizing its parameters is challenging due to its nonlinear and complex nature. The traditional method of optimizing conditions by changing one variable at a time is slow and requires many experiments. To address these limitations, researchers are using artificial intelligence (AI) to model and optimize the adsorption process, including modeling with artificial neural networks, particle swarm optimization, response surface models, and nanocomposite structures. Some studies have used AI to optimize adsorption of contaminants such as methylene blue, Cr(VI), Cd(II), Pb(II), As(III), and water treatment [40,41,42]. The purpose and the novelty of this study lies in its choice of adsorbent material kaolin from Djebel Debbagh (DD3); this is significant because kaolin is a naturally occurring clay mineral. Its potential as an effective adsorbent for the removal of methylene blue from both water and wastewater may not have been extensively explored in the context of this specific dye or location. The characterization of the adsorbent was performed using various techniques and the influence of various factors on adsorption was analyzed. We compared two isotherm models to determine the best correlation for adsorbed MB on DD3 and acid-activated DD3 (treated-DD3). The thermodynamic parameters for the treated-DD3 and MB system were also determined. A Gaussian process regression (GPR) with particle swarm optimization (PSO) model was used to predict the MB adsorption capacity. The use of GPR and PSO together suggests an innovative approach to understanding and predicting adsorption behavior; and its consideration of a specific geographical location, Djebel Debbagh, may have unique geographical and environmental characteristics that influence the adsorption process, adding a valuable geospatial dimension to the research. These elements contribute to the advancement of knowledge in the field of adsorption for dye removal and may have practical implications for water and wastewater in specific regions. This study is unique in that it is the first to optimize the removal of MB by DD3 and treated-DD3 and the first to use the GPR–PSO model for MB adsorption capacity prediction.

2. Materials and Methods

The Djebel Debbagh zone (situated near Guelma in eastern Algeria), is one of the richest locations in several kinds of kaolinitic clays. Thus, the natural gray color of DD3 (a kaolinitic commercial clay sample) was selected to represent plentiful raw materials with no special degree of purity [8]. The DD3 form of kaolinite (Figure S1b) is a less prevalent species compared to other clay minerals and warrants recognition for its unique characteristics. In this investigation, cationic dye (methylene blue dye, Figure S1a) was selected as the adsorbate and was used in its dry form. This dye, commonly referred to as Basic Dye 9 (C.I. 52015), is characterized by its high purity [43] with common properties as follows: chemical formula (C16H18N3ClS), molar weight (319.85 g/mol), λmax = 665 nm, molar volume (0.242 L/mol), width (1.43 nm), depth (0.61 nm), thickness (0.4 nm), and molecular diameter (0.8 nm) [3,35,44,45].

2.1. Preparation of Adsorbents

2.1.1. Purification of Natural Kaolinite

Before its use for experiments, kaolinite DD3 was treated as follows: a suspension containing 10 g/L kaolinite DD3 was mechanically agitated for 24 h [37,46]. The supernatant suspension was then filtered using a Whatman N°1 filter paper. The material was dried at 110 °C for 24 h and then sieved (a 100-μm sieve).

2.1.2. Acid Activation of Kaolinite

Around 5 g of DD3 was activated by refluxing with 10 mL of sulfuric acid solution containing different concentrations (0.2, 0.6, and 1.0 mol/L) at 90 °C for 3 h. This temperature was maintained using a water bath. The suspension was air-cooled, filtered, and washed many times with double-distilled water until the pH was neutral and the BaCl2 test was negative. The activated kaolin was dried in an oven at 110 °C for 24 h, crushed, and sieved through a 100-μm sieve prior to use [46]. The primary result of MB adsorption indicated that the sample DD3 treated with 1.0 mol/L sulfuric acid exhibited the highest adsorption capacity (Figure S2). Therefore, it was named as “treated-DD3” and used for further studies.

2.2. Characterization of Adsorbents

The drift method was employed to determine the point of zero charge (pHPZC) of the DD3 and treated-DD3 samples. Around 0.15 mg of adsorbent was added to a 50 mL aqueous sodium chloride solution (0.01 mol/L). The pH of the dispersion was adjusted to initial values ranging from 2 to 11 with small amounts of 0.1 mol/L HCl and 0.1 mol/L NaOH solutions as described by other studies [4,47,48]. The dispersions were left to stir for 48 h before the final pH was measured and plotted against the initial pH. The pHPZC was calculated as the point where the final pH equaled the initial pH. The physical and chemical properties of the DD3 and treated-DD3 samples are presented in Table 1. Cationic exchange capacity (CEC) refers to the amount of negative charge on the surface of the adsorbent and the number of organic species required to exchange metal cations in the interlamellar spaces [2,49]. The CEC of kaolinites was tested to estimate the cation exchange mechanism between the adsorbent (kaolinite DD3 and treated-DD3) and the MB dye. The CEC value was determined by the cobalt-hexammine chloride method. Approximately 1.0 g of DD3 or treated-DD3 with 15 mL of 0.05 mol/L CoCl2•6H2O was added to a flask. After a required reaction time (4 h), the suspension was filtered, and the filtrate’s absorbance was measured at λmax = 510 nm using a spectrophotometer (Agilent Cary; 60 UV-Vis; Santa Clara, CA, USA). Differences regarding Co2+ quantity were used to estimate the CEC values of materials [2]. The nitrogen adsorption isotherm was measured using a bath temperature of 77.3 K with Nova Station BET apparatus using a nitrogen press. The analysis process was automated and conducted using static volumetric techniques (0.123 cm3). Prior to each measurement, the samples were degassed at 200 °C. The BET analysis was used to determine the specific surface area, and the total pore volume (Vtot ) was calculated through nitrogen adsorption at a relative pressure of 0.98. The average pore size (Dp) of the adsorbents was estimated using cylindrical pore assumption, as described by the following equation [47].
D p = 4 × V t o t × 1000 S B E T
The chemical components (oxide composition) of DD3 and treated-DD3 were determined by X-ray fluorescence (XRF). Scanning electron microscope (SEM) and energy-dispersive X-ray spectroscopy (EDS) were utilized to explore the morphology and elemental analysis in the surface of DD3 and treated-DD3. The FTIR spectra of DD3 and treated-DD3 dispersed in KBr discs were obtained in the region of 500–4000 cm−1 using the FTIR spectrometer (Jasco FT/IR-4200) at room temperature. XRD was used to determine the mineralogical compositions of representative air-dried kaolinite DD3 and treated-DD3 samples. The XRD patterns of these adsorbents were acquired using a PANALYTICAL EMPYREAN® Diffractometer equipped with a ceramic X-ray emitting tube with a copper anticathode and an X-ray generator (40 mA and 45 kV).

2.3. Methylene Blue Adsorption Experiments

2.3.1. Batch Adsorption Experiment of Methylene Blue

Methylene blue dye was used in adsorption assays, with 0.1 g of treated-DD3 activated with three different concentrations of sulfuric acid (0.2, 0.6, and 1 mol/L) and 100 mL of dye MB at a concentration of 250 mg/L at unadjusted pH, 200 rpm, and for 24 h. The samples were taken the following day after removing MB by adsorption. This time was more than enough for the treated-DD3 materials to reach equilibrium. A UV-vis spectrophotometer was used to analyze the MB dye concentration in solutions (Figure S2). The MB dye stock solution (1 g/L) was generated by dissolving 1.0 g of the dye in 1 L of distilled water. The experiments were performed under constant agitation of 200 rpm at 25 ± 3 °C. By diluting the stock solution, the desired concentrations were made for each experiment. The pH of the solutions measured by a pH-meter (Inolab PH7310, Weilheim in Oberbayern, Germany) were adjusted by adding either 0.1 mol/L HCl or 0.1 mol/L NaOH. The equilibrium concentration of the dye was established by determining its absorbance at 665 nm using a Cary 60 UV-ViS spectrophotometer (Agilent Technologies, Santa Clara, CA, USA). Samples were taken from the reaction suspensions at various intervals, separated using a centrifuge (LW Scientific, EZ Swing 3K, Germany). The amount of dye absorbed per gram of adsorbent at equilibrium (qe, mg/g) and any time t (qt, mg/g) were calculated using Equations (2) and (3).
q e = C o C e m V
q t = C o C t m V
where C o is initial dye concentration (mg/L) at t = 0; C t is concentration of the dye solution (mg/L) at any time t of the process of adsorption; V is the volume of the dye solution (L); and m is the mass of the adsorbent (kaolinite DD3 or treated-DD3) used (g).

2.3.2. Effect of Various Parameters on MB Adsorption on DD3 and Treated-DD3

The adsorption capacity of DD3 or treated-DD3 for the studied pollutant in simulated textile wastewater as well as the effects of contact time and initial dye concentration, adsorbent dosage, pH, ionic strength and temperature were determined. Contact time of the adsorption process is one of the most crucial from an economic standpoint for the systems of treatment, as it determines the amount of adsorbed dye at different time intervals. 0.1 g of DD3 or treated-DD3 was kept in contact with 100 mL dye solution of MB at various concentrations (Co = 50, 75, 100, 150, and 200 mg/L) at unadjusted pH. To confirm that the equilibrium was reached, a time contact equal to 180 min was set for all experiments with constant stirring at 200 rpm at an ambient temperature of 25 ± 3 °C using a 15-position magnetic stirring plate (2 mag, magnetic motion, Munich, Germany). The samples were withdrawn after a given time (2–180 min) in order to determine the residual concentration and the equilibrium point. After each time, the mixture was centrifuged for 10 min. Finally, the residual concentration of the dye was determined using UV-Visible spectrophotometry at λmax = 665 nm; each experiment was triplicated under identical conditions. The experiments were conducted at 25 ± 3 °C and 200 rpm with varying pH values (ranging from 2 to 11) to determine the effect of pH on the adsorption of MB color removal. Conical flasks containing 100 mL of MB dye solution with an initial concentration of 75 mg/L were prepared. Using a small volume of 0.1 M NaOH and 0.1 M HCl solutions, the pH of the solution was adjusted. Before each measurement, the pH-meter was calibrated using NBS buffers in order to get accurate results. Each flask contained 0.1 g of sorbents and was stirred for 60 min at room temperature. Each value obtained was the average of three experiments conducted in the same conditions. For the evaluation of the adsorbent’s dosage on adsorption, a series of conical flasks containing varied quantities of DD3 or treated-DD3 adsorbents (ranging from 0.01 to 1.0 g) and 100 mL of MB dye solution (or m/V = 1.0–10 g/L) with an initial concentration of 75 mg/L was used. The solutions were stirred for 60 min at 200 rpm. By measuring the residual concentration using the spectrophotometer, the optimal value of the adsorbents was determined. The impact of temperature on the adsorption capacity of dyes was investigated over a range of 25 °C to 55 °C. The study utilized 0.1 g of either adsorbent DD3 or treated DD3 in 100 ml of a constant initial dye concentration of 75 mg/L. The experiments were conducted in closed 250 ml conical flasks for a duration of 60 minutes at an unadjusted pH. Throughout the adsorption period, the temperature was maintained at a constant level using a temperature-controlled bath. To achieve equilibrium, the conical flasks were shaken at 200 rpm using an orbital shaker. The experiment started with the addition of the adsorbent. The mixture was centrifuged to determine the concentrations of the residual dye. The same tests were performed at pH 11. The effect of ionic strength (using NaCl; 0.1–1 mol/L) on the removal rate of MB using DD3 or treated-DD3 was investigated at 25 ± 3 °C, unadjusted pH, and constant initial dye concentration MB of 75 mg/L (agitation speed of 200 rpm during 60 min); the samples were then withdrawn and spectrophotometrically analyzed.

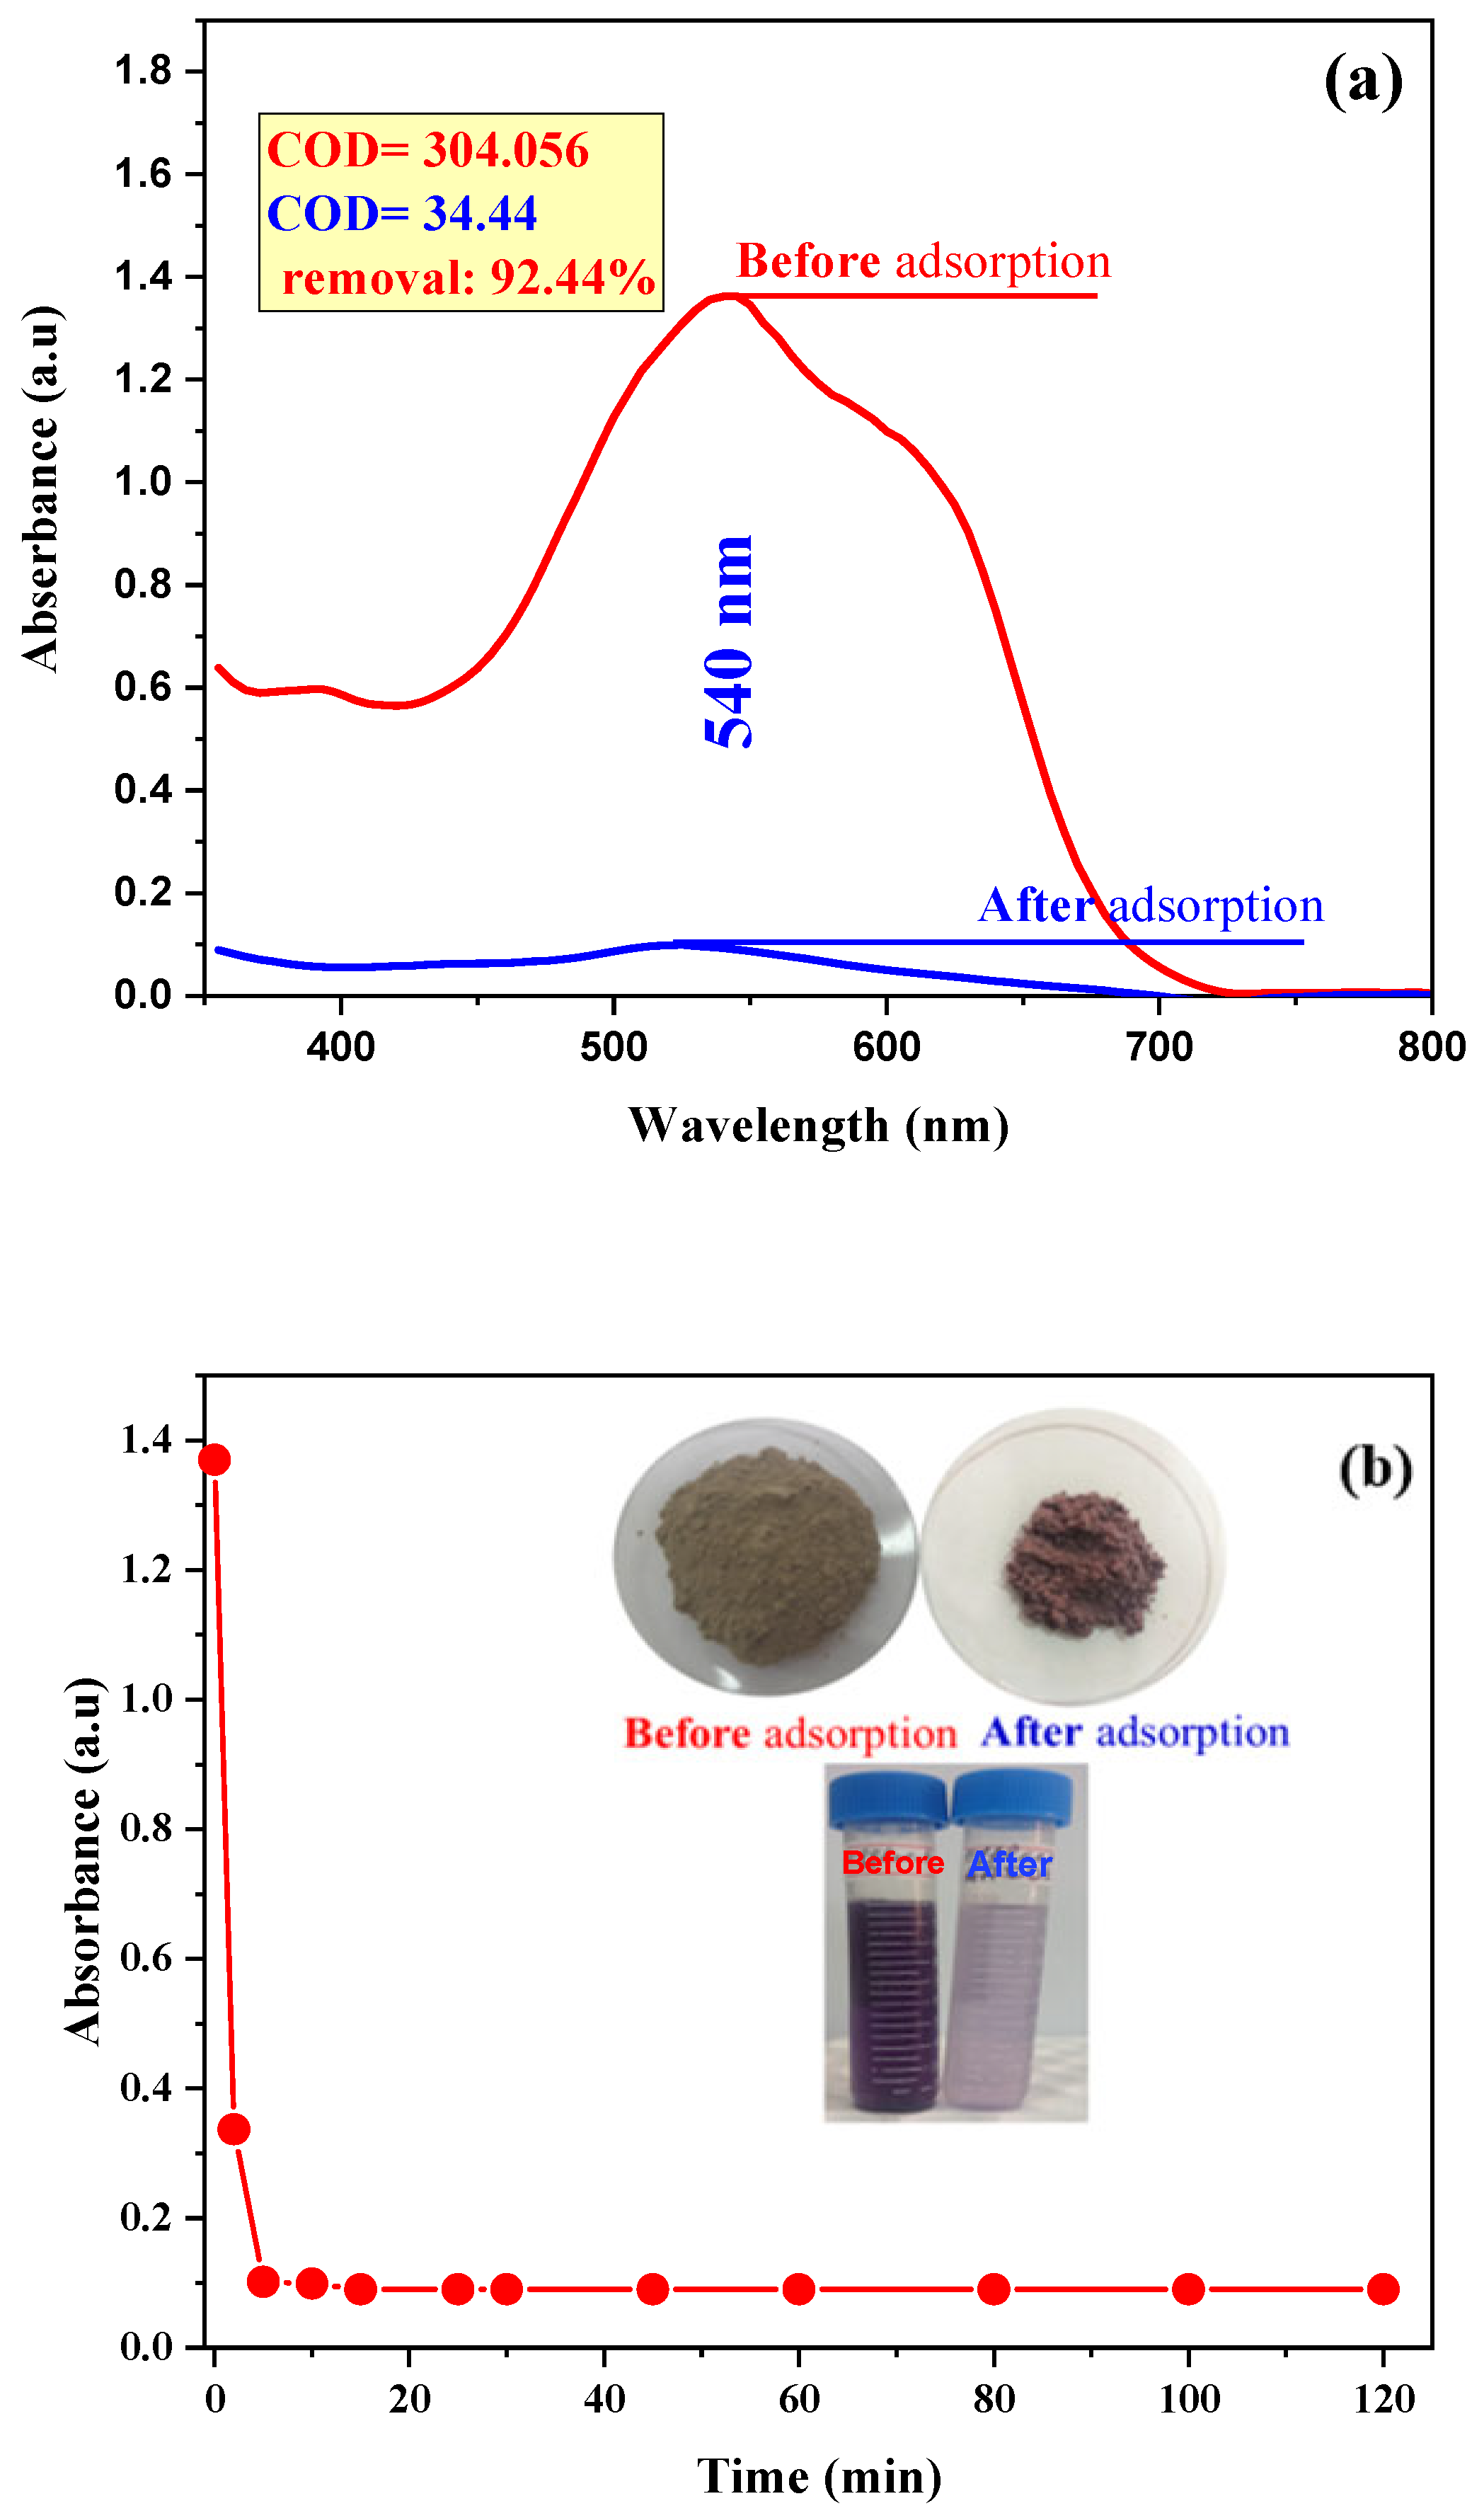
2.3.3. Application of Treated-DD3 for Treating Real Effluent

The textile effluent real sample is collected from the ALCOVEL company in Akbou, Bejaia, Algeria, which utilizes different dyes and other chemicals including detergents, salts and surfactants. This water to be treated mainly from dyes effluent has an indigo blue color and will be referred to as “MB wastewater”. The main objective of this section is to verify the effectiveness of treated-DD3 on the adsorption of waste textile dyes. To this end, the same conditions were maintained as for the adsorption of MB from a synthetic solution. Around 0.1 g of treated-DD3 was placed in 100 mL of textile solution, at unadjusted pH = 6.7 and ambient temperature 25 °C. The mixture was stirred, and samples were taken every 2 min. UV-vis spectrophotometer scan readings were used to analyze the MB-wastewater solutions.

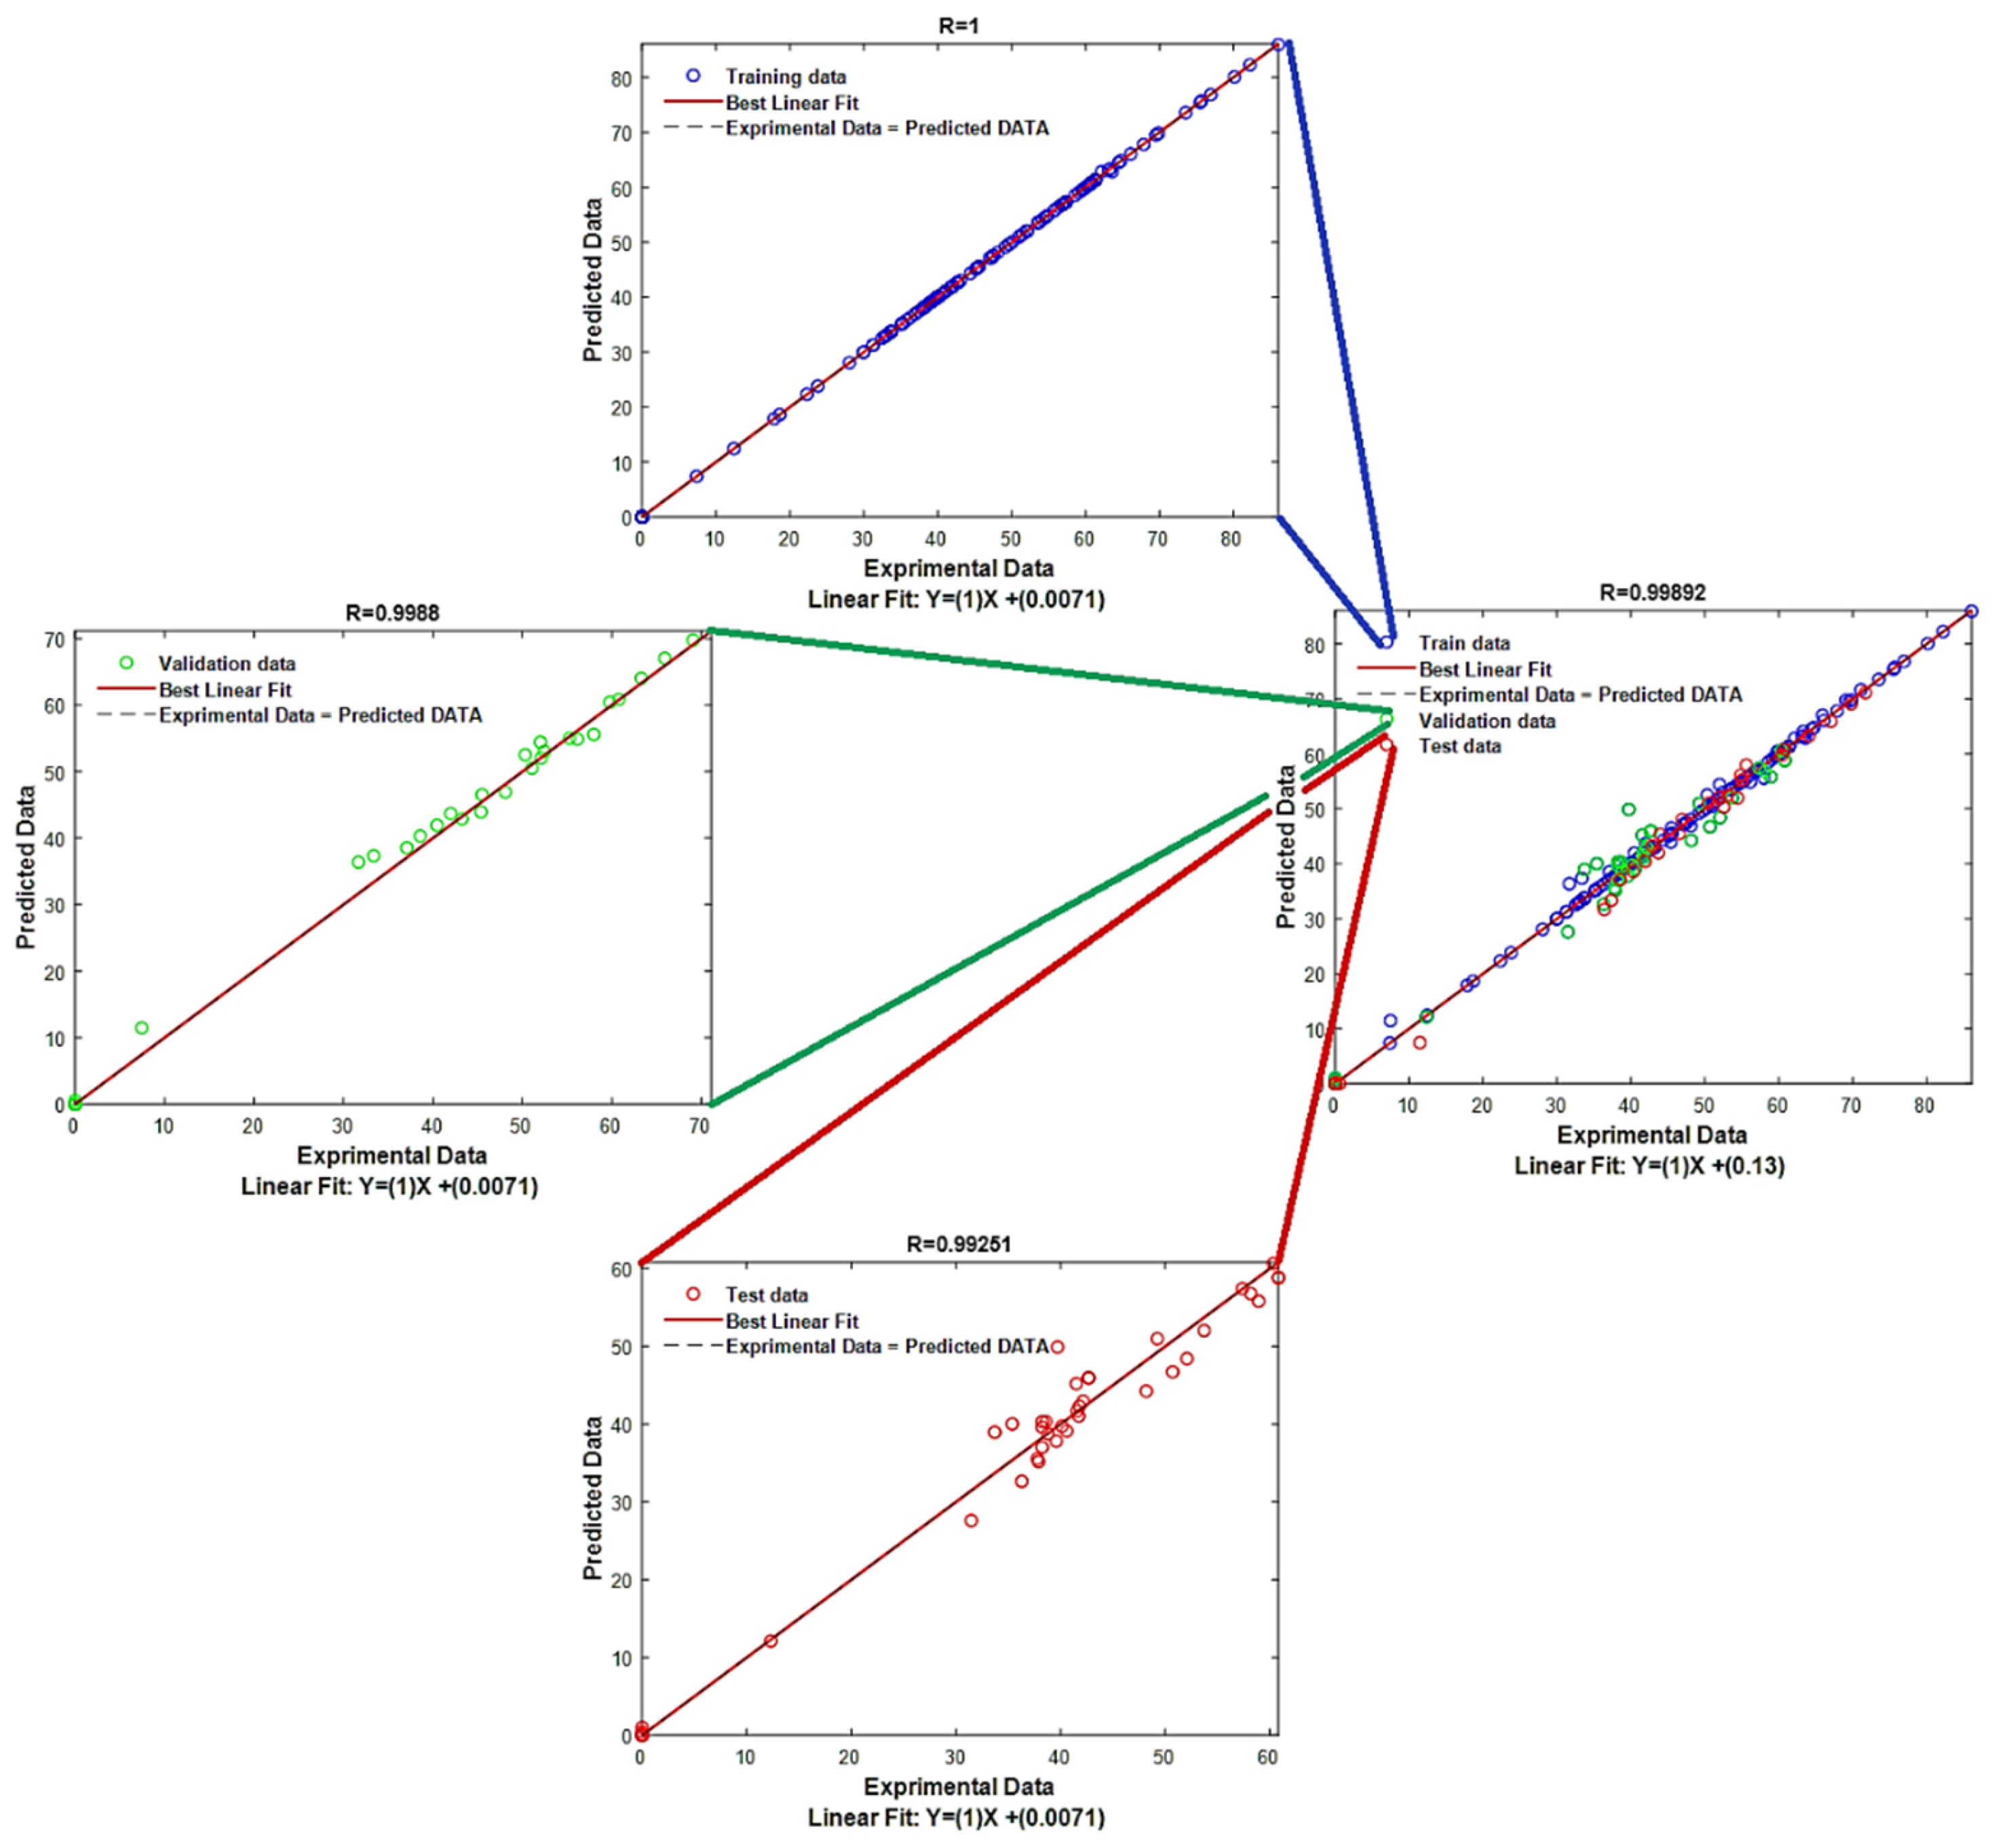
2.3.4. Gaussian Process Regression Coupled with Particle Swarm Optimization (GPR–PSO)

The Gaussian process (GP) is a statistical process characterized by a collection of random variables, where any finite subset of these random variables has a joint Gaussian distribution. This probabilistic representation of a target function can be used for regression and classification tasks [17]. The GP is described as a group of random variables (stochastic process) where it is assumed that any finite number of these variables are jointly Gaussian distributed [50]. The GP can completely capture the distribution of an unknown function f(x) through its mean function m(x) = E [f(x)] and a kernel function k (x, x′) which estimates the covariance E [(f(x) − m(x)) (f(x′) − m(x′))]. The kernel (covariance) function represents a geometric distance measure, meaning that inputs that are closer to each other are assumed to have higher correlation in terms of their function values [17]. In GPR, the kernel (covariance) function outlines the structure of the target function. Hence, the type of kernel function k (x, x′) selected to construct the GPR model, as well as its parameters, greatly influences the overall representation of the GPR model and can affect the prediction accuracy. Numerous types of kernel functions are available for uses [51]. In this study, the results of optimizing MB adsorption parameters using DD3 and treated-DD3 were combined into a single database to create a large and valid model for the two adsorbents used by GPR_PSO. The inputs selected were X1 (contact time: 0–180 min), X2 (initial MB concentration: 50–200 mg/L), X3 (adsorbent mass: 0.01–1 g), X4 (pH 2–11), and X5 (temperature: 25–55 °C); and the output was the MB adsorption capacity (Y). To distinguish the results between DD3 and treated-DD3, an additional parameter X6 was added to the inputs. The results of DD3 and treated-DD3 were represented by the values “1” and “2”, respectively. To derive the optimal GPR–PSO model, a strategy was implemented that focuses on the design and optimization of the kernel and parameters of both GPR and PSO. The model was constructed through the following steps [51]:
(1)
Data were prepared and examined;
(2)
The database was divided into three parts: 222 points for training, 47 points for evaluating model performance (test), and 47 points for verifying model results (validation);
(3)
Ten kernels’ functions, including Exponential, Square Exponential, Matern32, Matern52, Rational Quadratic, Ard Exponential, Ard Square Exponential, Ardmatern32, Ardmatern52 and Ard Rational Quadratic, were optimized with four basis functions—Constant, Linear, Zero and Pure Quadratic;
(4)
The PSO algorithm’s iteration count and search agents were optimized to determine the best parameters (Kernel Scale [sigmaM, sigmaF] and sigma) for each kernel function.

2.3.5. Statistical Evaluation Criteria

The performance of each model was evaluated using several metrics: correlation coefficient (R), determination coefficient (R2), adjusted coefficient (R2adj), root mean square error (RMSE), and mean absolute error (MAE). These values were determined by applying the relevant mathematical equations [52,53,54]:
R = i = 1 N ( y exp y ¯ exp ) ( y p r e d y ¯ p r e d ) i = 1 N ( y exp y ¯ exp ) 2 i = 1 N ( y p r e d y ¯ p r e d ) 2
R a d j 2 = 1 ( 1 R 2 ) ( N 1 ) N K 1
R M S E = ( 1 N ) ( i = 1 N [ ( y exp y p r e d ) ] 2 )
M A E = ( 1 N ) i = 1 N | y exp y p r e d |
where N is the number of data samples; K is the number of variables (inputs); yexp and y p r e d are the experimental and the predicted values, respectively; and y ¯ exp and y ¯ p r e d are, respectively, the average values of the experimental and the predicted values.

3. Results and Discussion

3.1. Characterization of DD3 and Treated-DD3 Kaolinites

3.1.1. Chemical Composition of the Kaolinites

The chemical compositions (by mass%) of the finely ground DD3 and treated-DD3 powders were determined by X-ray Fluorescence. Table 1 reveals that DD3 and treated-DD3 are enriched in alumina Al2O3 (35.92% and 35.49%) and silica SiO2 (41.13% and 37.73%, respectively). Some minor components (Fe2O3, MgO, CaO, Na2O, K2O, NiO, BaO, P2O5, and SO3) present in two materials can reinforce the refractive index of DD3 and treated-DD3. The MnO content reached up to 0.71% for DD3 and 0.91% for treated-DD3 because kaolinite DD3 was impure and hence grey in color. The percentage of loss in ignition of DD3 (19.56%) and treated-DD3 (22.58%) resulted from the presence of water in the different minerals (kaolinite, gibbsite, and todorokite) [55,56,57]. The high level of clay material purity created rheological and physico-chemical features and directly impacted on the quality of the ceramic industry raw materials [2].

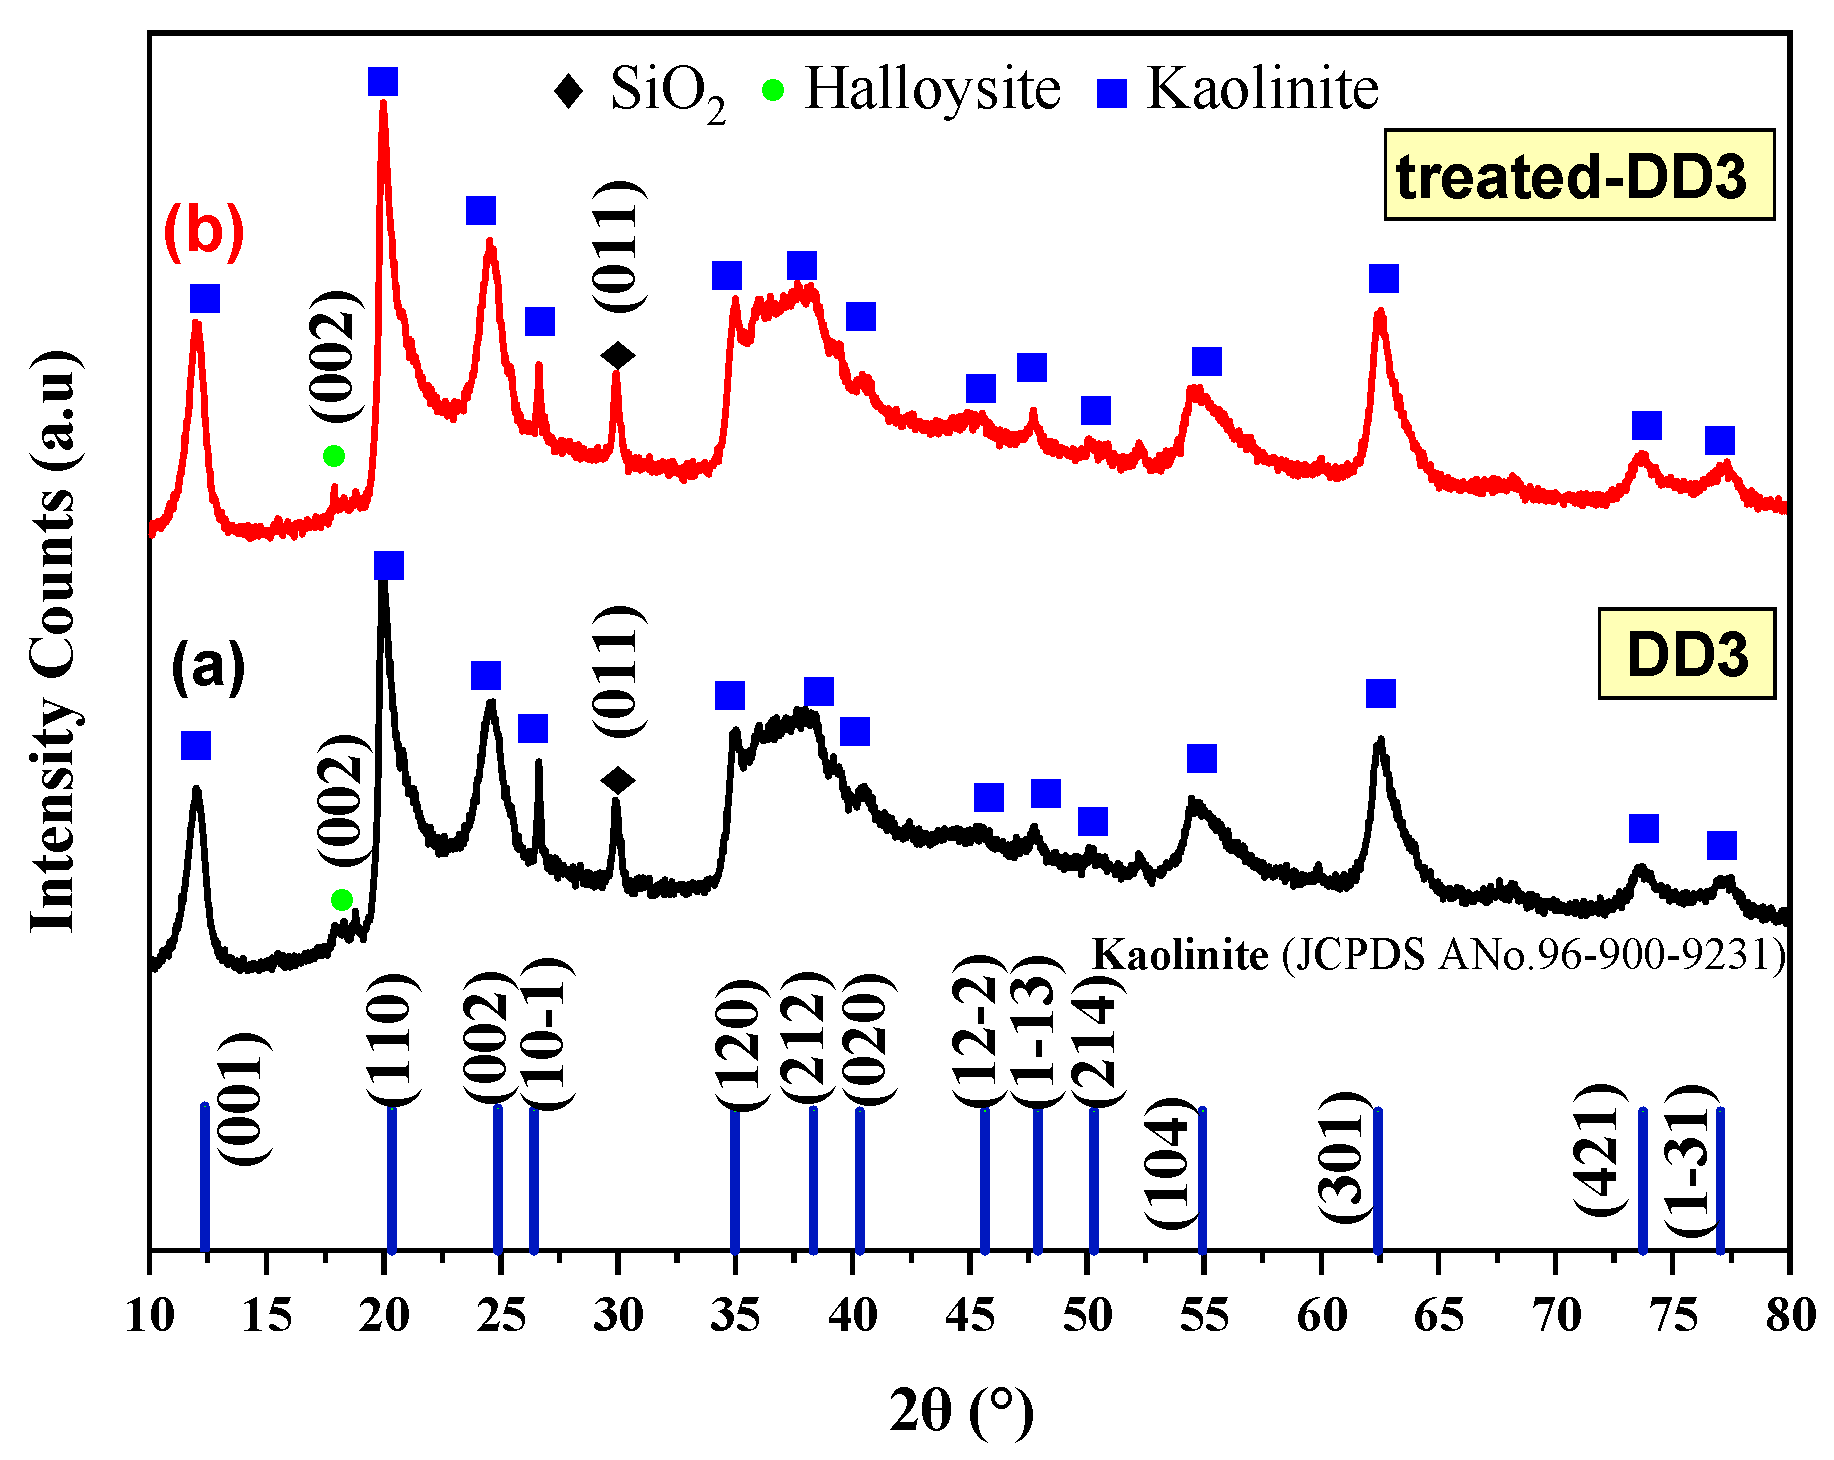
3.1.2. Crystal Structure of the Kaolinites

X-ray diffraction analysis (XRD) is used to assess the amorphous and crystalline natures of materials by identifying the changes in their phases and crystalline properties [58]. Figure 1 displays the XRD patterns of DD3 and treated-DD3. The raw kaolin material (DD3; Figure 1a) indicated the existence of kaolinite (the predominant mineral) (JCPDS file 96-900-9231), and there were also other crystalline phases, including a small amount of halloysite (JCPDS file 96-500-0091) at 2θ = 17.8° attributed to the (002) plan. The diffraction peak at 2θ = 29.9° was assigned to (011) of the silica oxide (SiO2) phase (JCPDS file 01-081-0069). The XRD peaks of the treated-DD3 (Figure 1b) showed a significant increase in intensity, indicating a rise in the clay minerals’ crystallinity [56,57,59]. This may be due to the removal of the amorphous layer by the acid, which allowed the X-ray beam to directly access both the octahedral and tetrahedral sites.

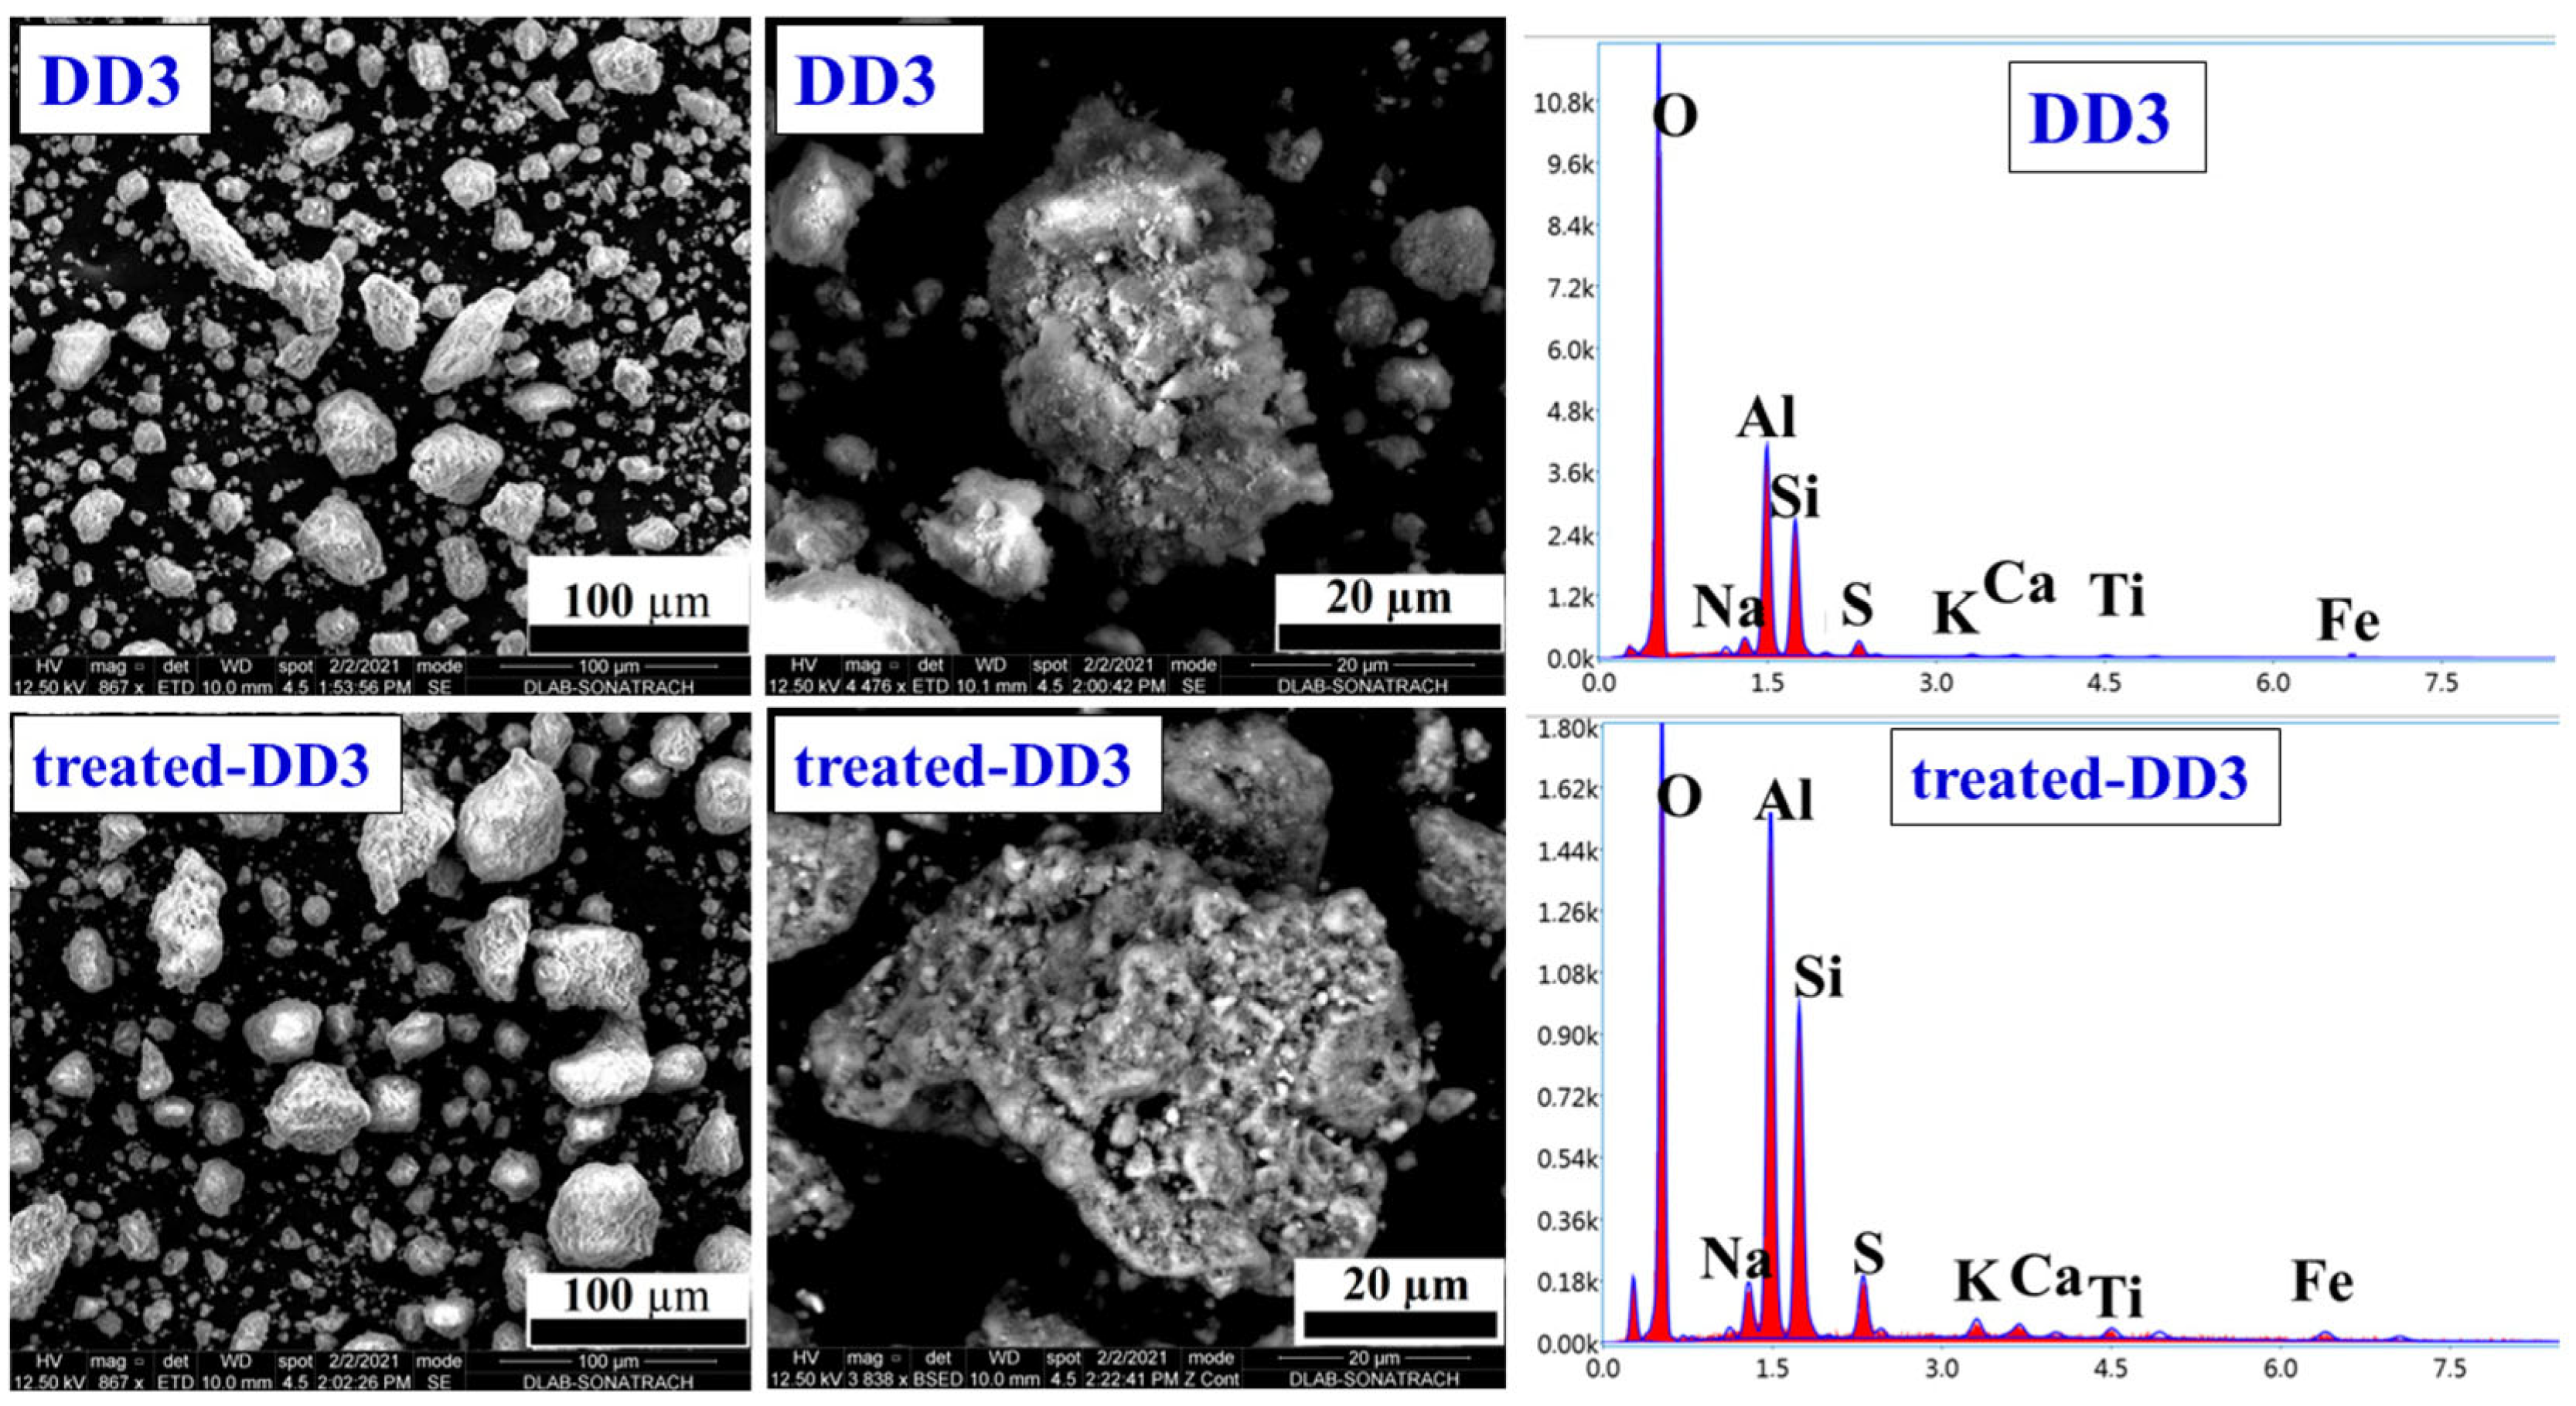
3.1.3. Surface Morphology and Element Component of the Kaolinites

The SEM analysis (Figure 2) showed that DD3 is composed of large particles arranged in stacks, resulting in bulk forms with a low specific surface area and impurities. DD3 kaolinite with its poor crystallinity (Figure 1a) might result from the presence of impurities. Some authors reported that the existence of impurities and quartz minerals lead to decreased whiteness of kaolinites [48,60]. In contrast, treated-DD3 displayed a more regular edge and a smoother surface because of the crystallization process [8,48]. Furthermore, when the DD3 material was treated with acid H2SO4, the clay surface was significantly modified by this treatment with an increase in its porosity, which was confirmed by SBET, which facilitates MB adsorption on this kaolinite. The appearance of the crystal plate or flake was probably attributed to the change in the particles’ surface charge after the acid activation process. The pHPZC of treated-DD3 (3.85) was lower than that of DD3 (6.70; Table 2), suggesting that treated-DD3 exhibited a higher negatively charged surface than DD3.
The EDS spectrum of the kaolinite is composed principally of Si, O, and Al elements, which results from the aluminosilicate structure. In addition to these chemical elements, other chemical compounds (Na, S, K, Ca, Ti and Fe) were observed in low amounts.

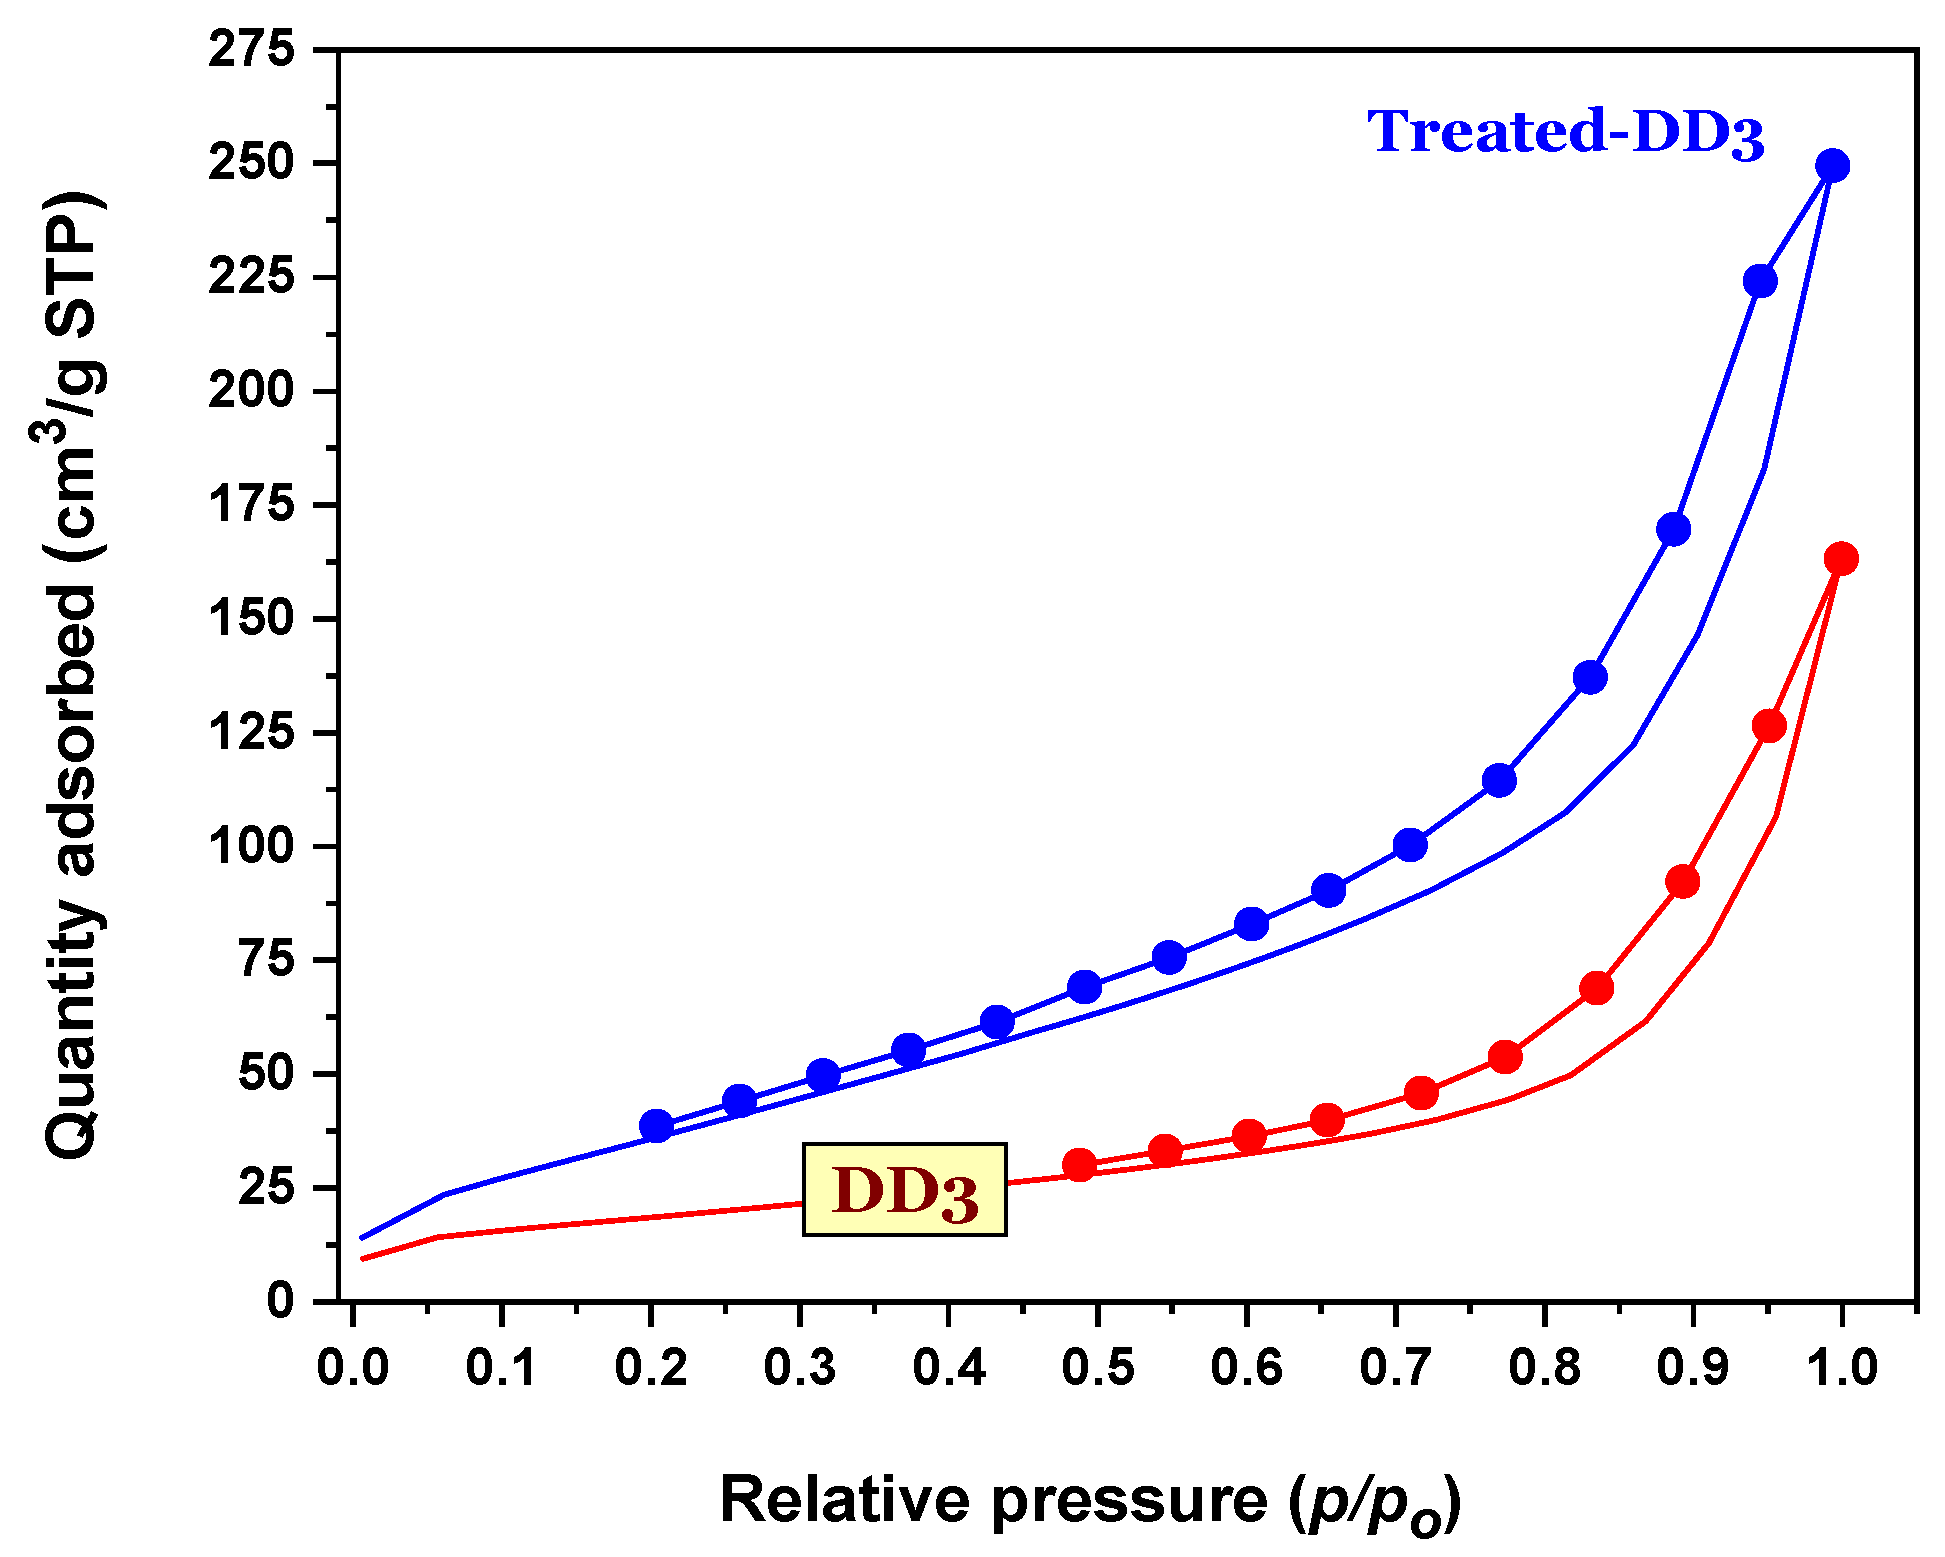
3.1.4. Textural Property of the Kaolinites

Figure 3 displays the nitrogen adsorption/desorption isotherms of DD3 and treated-DD3. The isotherm curves were categorized as Type IV of the IUPAC classification system [61]. The presence of the Type H3 hysteresis loop in these curves confirmed that both kaolinites are mesoporous materials. The average pore width (Table 2) of DD3 (14.94 nm) and treated-DD3 (9.953 nm) was in a mesopore range (2–50 nm). Mesoporous materials can often well adsorb solutes with a large molecular size through a pore-filling mechanism.
Table 2 displays the textural parameters of two materials obtained from the nitrogen adsorption curve (Figure 3). As expected, after the acid treatment, the SBET and Vtot of DD3 remarkably increased from 67.60 to 155.1 m2/g and 0.252 to 0.386 cm3/g, respectively. This is presumably because the majority of the nonporous components (i.e., quartz; Figure 1) in DD3 were removed after the strong acid activation [2]. Treated-DD3 with higher SBET and Vtot than DD3 was expected to possess more active sites for adsorbing MB dye in water.

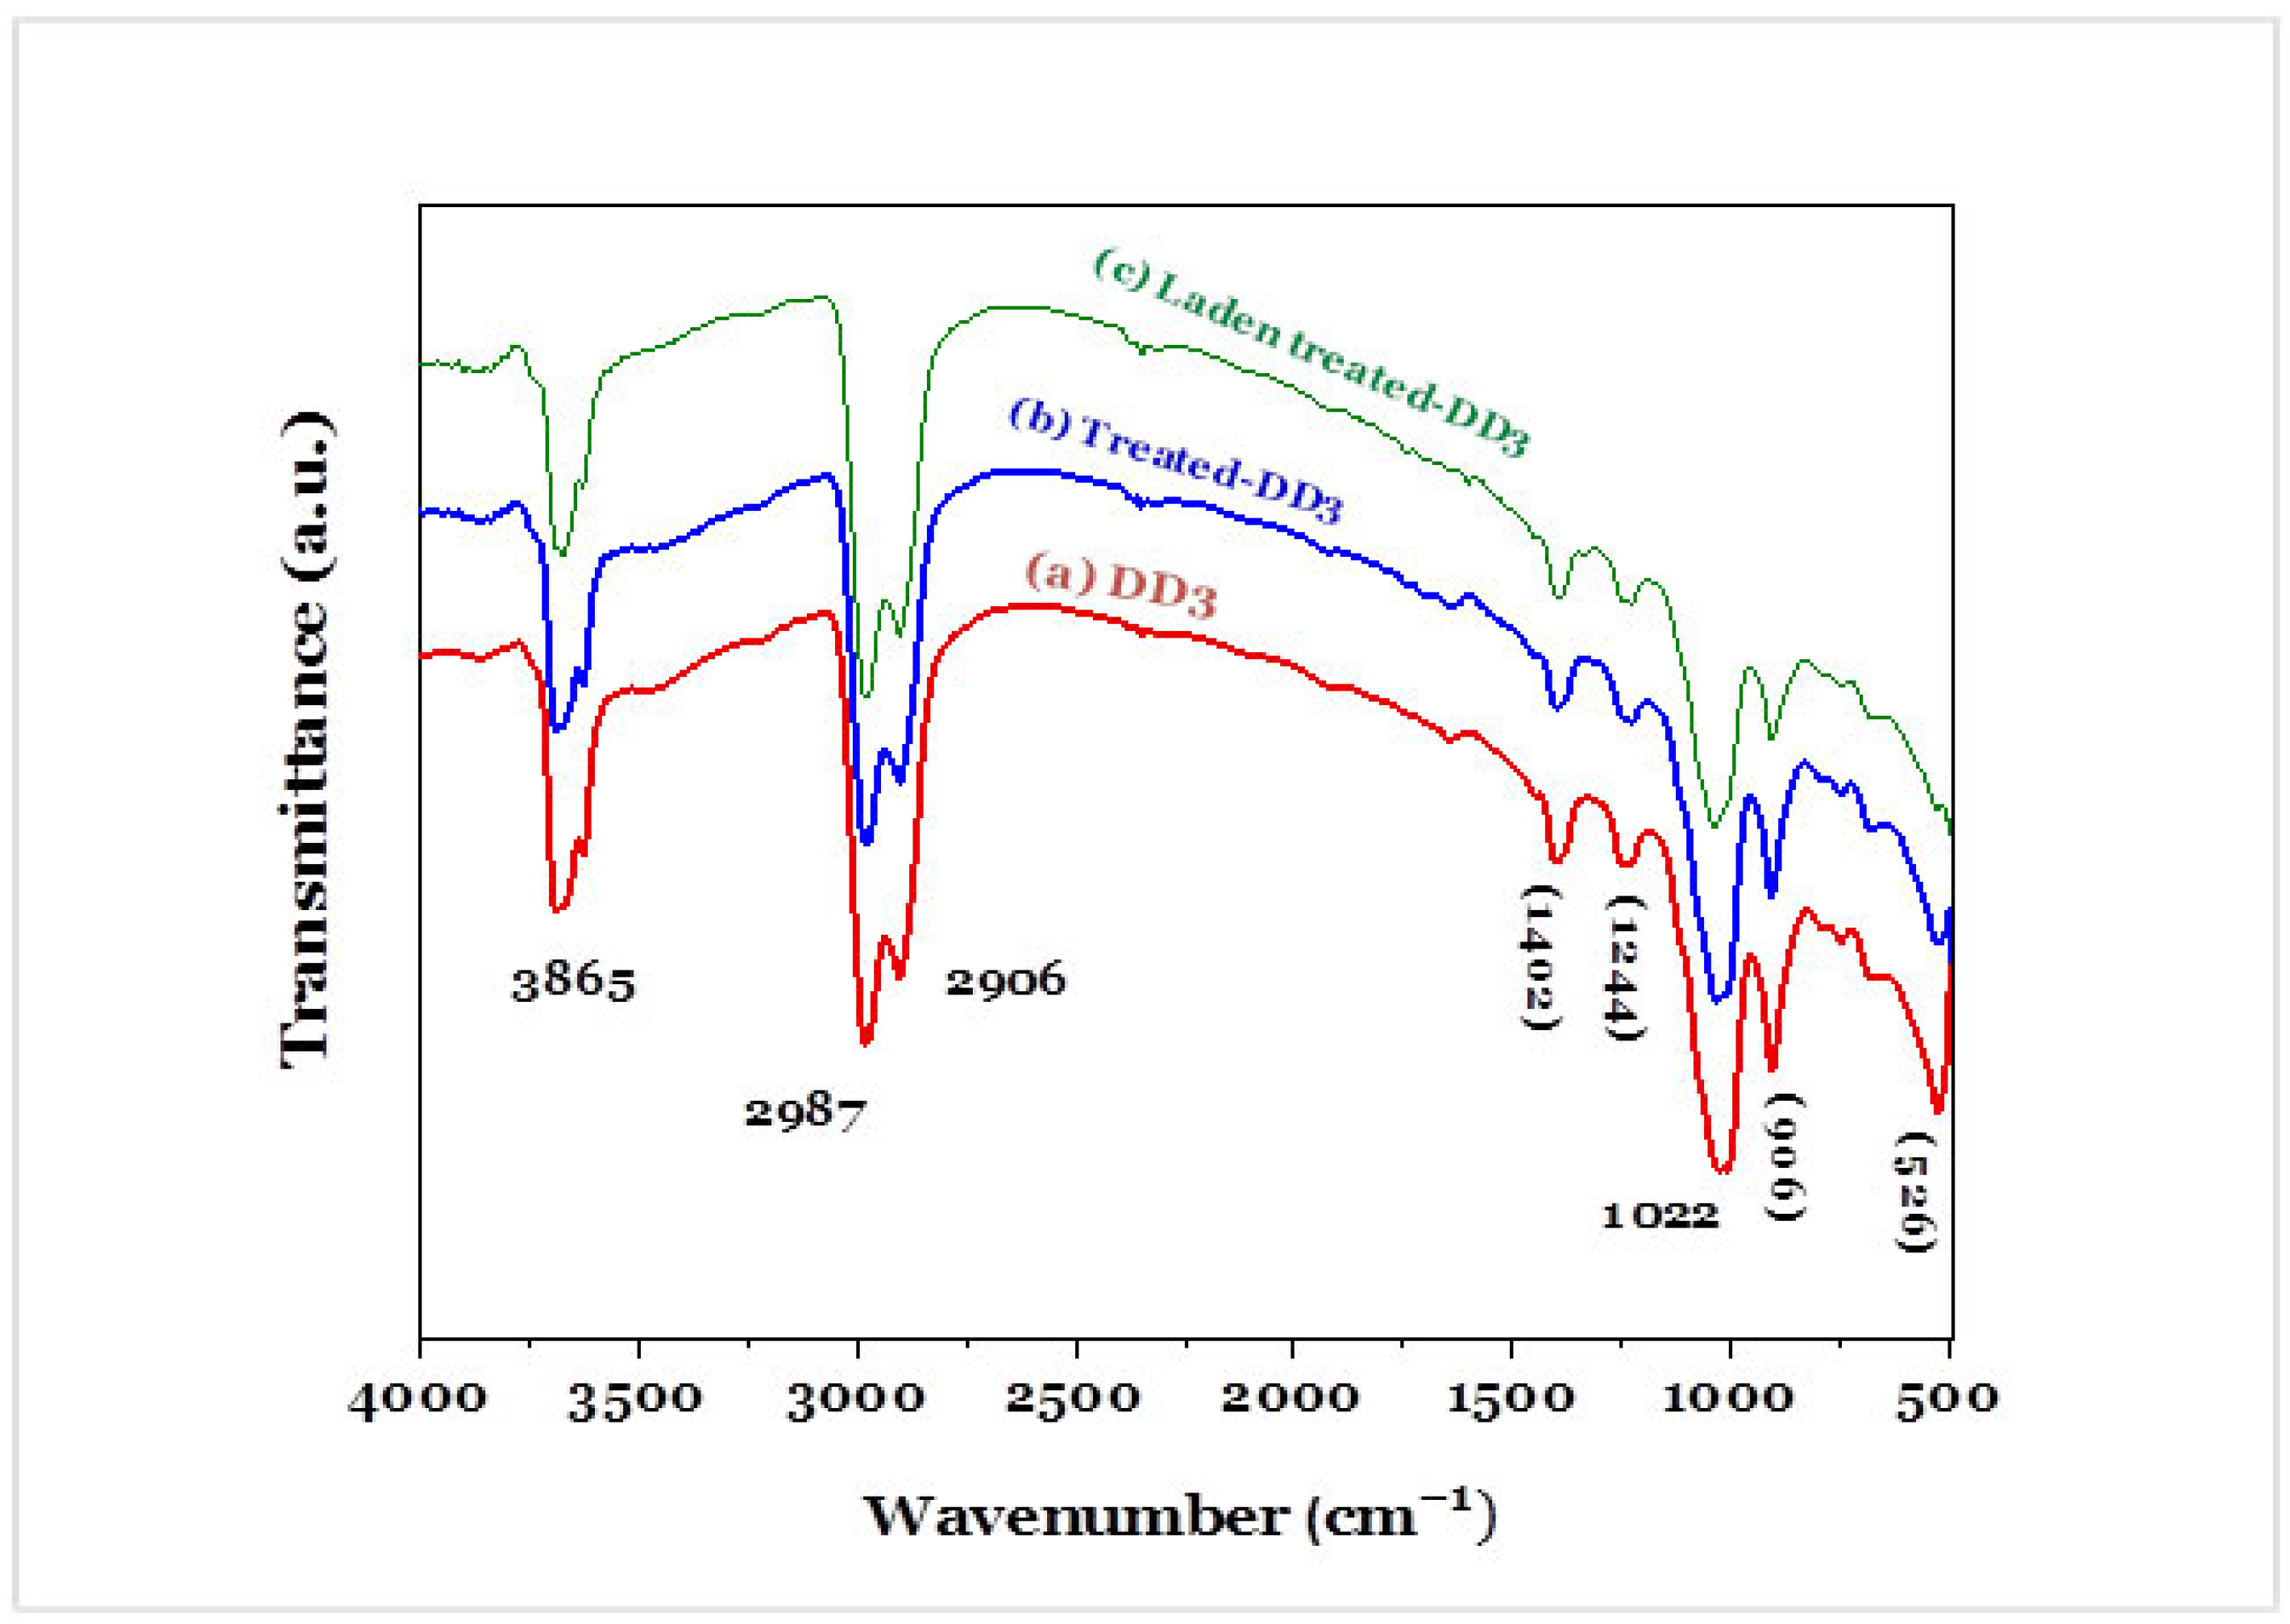
3.1.5. Functional Group on the Surface of Kaolinites

DD3 and treated-DD3 were analyzed by infrared spectrometry to identify the different chemical bonds of vibrations of structural hydroxyls. The FTIR spectra obtained for the three samples, DD3, treated-DD3, and treated-DD3-MB, in the region of 500–4000 cm−1 are shown in Figure 4a–c, where treated-DD3-MB is the MB-adsorbed treated-DD3 adsorbent. The three adsorbents indicated the presence of analogous bands of vibration. Indeed, the band observed between 3600 and 3865 cm−1 might be ascribed to the stretching frequencies of the OH functional groups of coordination water and of the hydration OH stretching (the interlayer hydroxyl belongs to the stretching mode of Al–OH mode) [2,3,32].
The absorption bands at 2906 and 2987 cm−1 and especially that at 1400 cm−1 prove the presence of calcite in the halloysite of Djebel Debbagh. Quartz is also detected at 2500 cm−1 [62]. Similarly, the bands of H−O−H deformation (bending) observed in the range of 1402 cm−1 and 1950 cm−1 were the result of the combination of elongation and deformation of the water molecule adsorbed on the surface. The broad band centered at 1402 cm−1 in the Algerian halloysite can be attributed to bending vibrations of adsorbed water [62]. In addition to these bands, the band observed at the 1244 cm−1 shoulder was assigned to the stretching mode of apical Si–O, while the bands at 1022 and 906 cm−1 were caused by the stretching vibrations of Si–O–Si and bending modes of Al–O–Al, respectively. The rest of the bands between 526 and 906 cm−1 were attributed to the vibration of the bonds in the metal oxides, in particular the aluminum oxides and/or that of silica in our samples considering the aluminosilicate character of the clays; these bands were confirmed by the appearance of the band of absorption for the metal-oxygen M-O, attached to Al3+, Fe3+, and Mg2+ groups, and the silica quartz impurities.
The acid treatment process did not result in a noticeable difference between the raw and activated DD3. However, a shift in the band at 526 cm−1, which was originally from the Si–O–Al bonding in untreated kaolinite, was observed to appear at 500 cm−1 after the treatment. This shift indicates a slight disruption of the kaolinite layers and interlayer space caused by cation leaching during the acid activation process [2]. The findings suggest a minor disturbance of the kaolinite octahedral sheets occurring during the acid activation process [32].

3.2. Adsorption of MB Dye by DD3 and Treated-DD3

3.2.1. Effect of Adsorbent Dose, Solution pH, and Ionic Strength on Adsorption Processes

The effect of the adsorbent’s dose (or solid/liquid ratio) on the MB dye adsorption process is provided in Figure 5a. In general, an increase in the amount of materials used led to decreasing qe values. This is because qe values were calculated based on the mass balance relationship (Equation (2)). Treated-DD3 exhibited higher qe values than DD3 when the dose used was lower than 0.4 g (or m/V = 4 g/L). To avoid the agglomeration of adsorbent particles, the solid/liquid ratio of 1 g/L was used for further studies. Solution pH plays a crucial role in adsorption processes because it affects the ionization state of the adsorbent surface and dye molecule. Figure 5b demonstrates the effect of solution pH on adsorbing MB dye onto DD3 and treated-DD3. The results showed that their adsorption capacity increased when the solution pH increased from 2.0 to 11. Under acidic solutions, the surface of DD3 or treated-DD3 was positively charged. Electrostatic repulsion between the adsorbent and the adsorbate existed in the adsorption system, which results in a low adsorbed quantity. In contrast, the presence of abundant OH anions under a basic environment made the surface of DD3 or treated-DD3 become negatively charged. As a result, the amount of dye adsorbed through electrostatic attractions increased. A similar phenomenon has been reported by other researchers [15,35,39,63,64,65]. Because natural solutions’ pH (6.6–6.9) without adjustment has environmental and financial benefits, the pH of the dye solution was maintained at ~7.0. In addition, the optimal pH solution (pH = 11) was selected for investigating the effects of temperature on the adsorption processes. The influence of inorganic salt (NaCl) on the adsorption capacity of MB on raw and acid-treated kaolinite is depicted in Figure 5c. When the concentration of NaCl increased, the capacity of MB dye adsorption by DD3 and treated-DD3 increased. This phenomenon contrasts with previous findings. The rise in ionic strength may lead to the aggregation of clay particles, forming new adsorption sites where the dye molecules can be absorbed. In a clay suspension, particles are suspended in pure water and do not aggregate, but the presence of an electrolyte (i.e., NaCl) can cause the particles to get close enough to one another to aggregate. The addition of NaCl led to an increasing mean radius of aggregates [66]. Luckham and Rossi [67] showed that adding a low amount of Na resulted in the formation of edge-to-edge aggregates, while a solution with a higher concentration led to the creation of extremely dense irregular aggregates with a face-to-face layered structure.

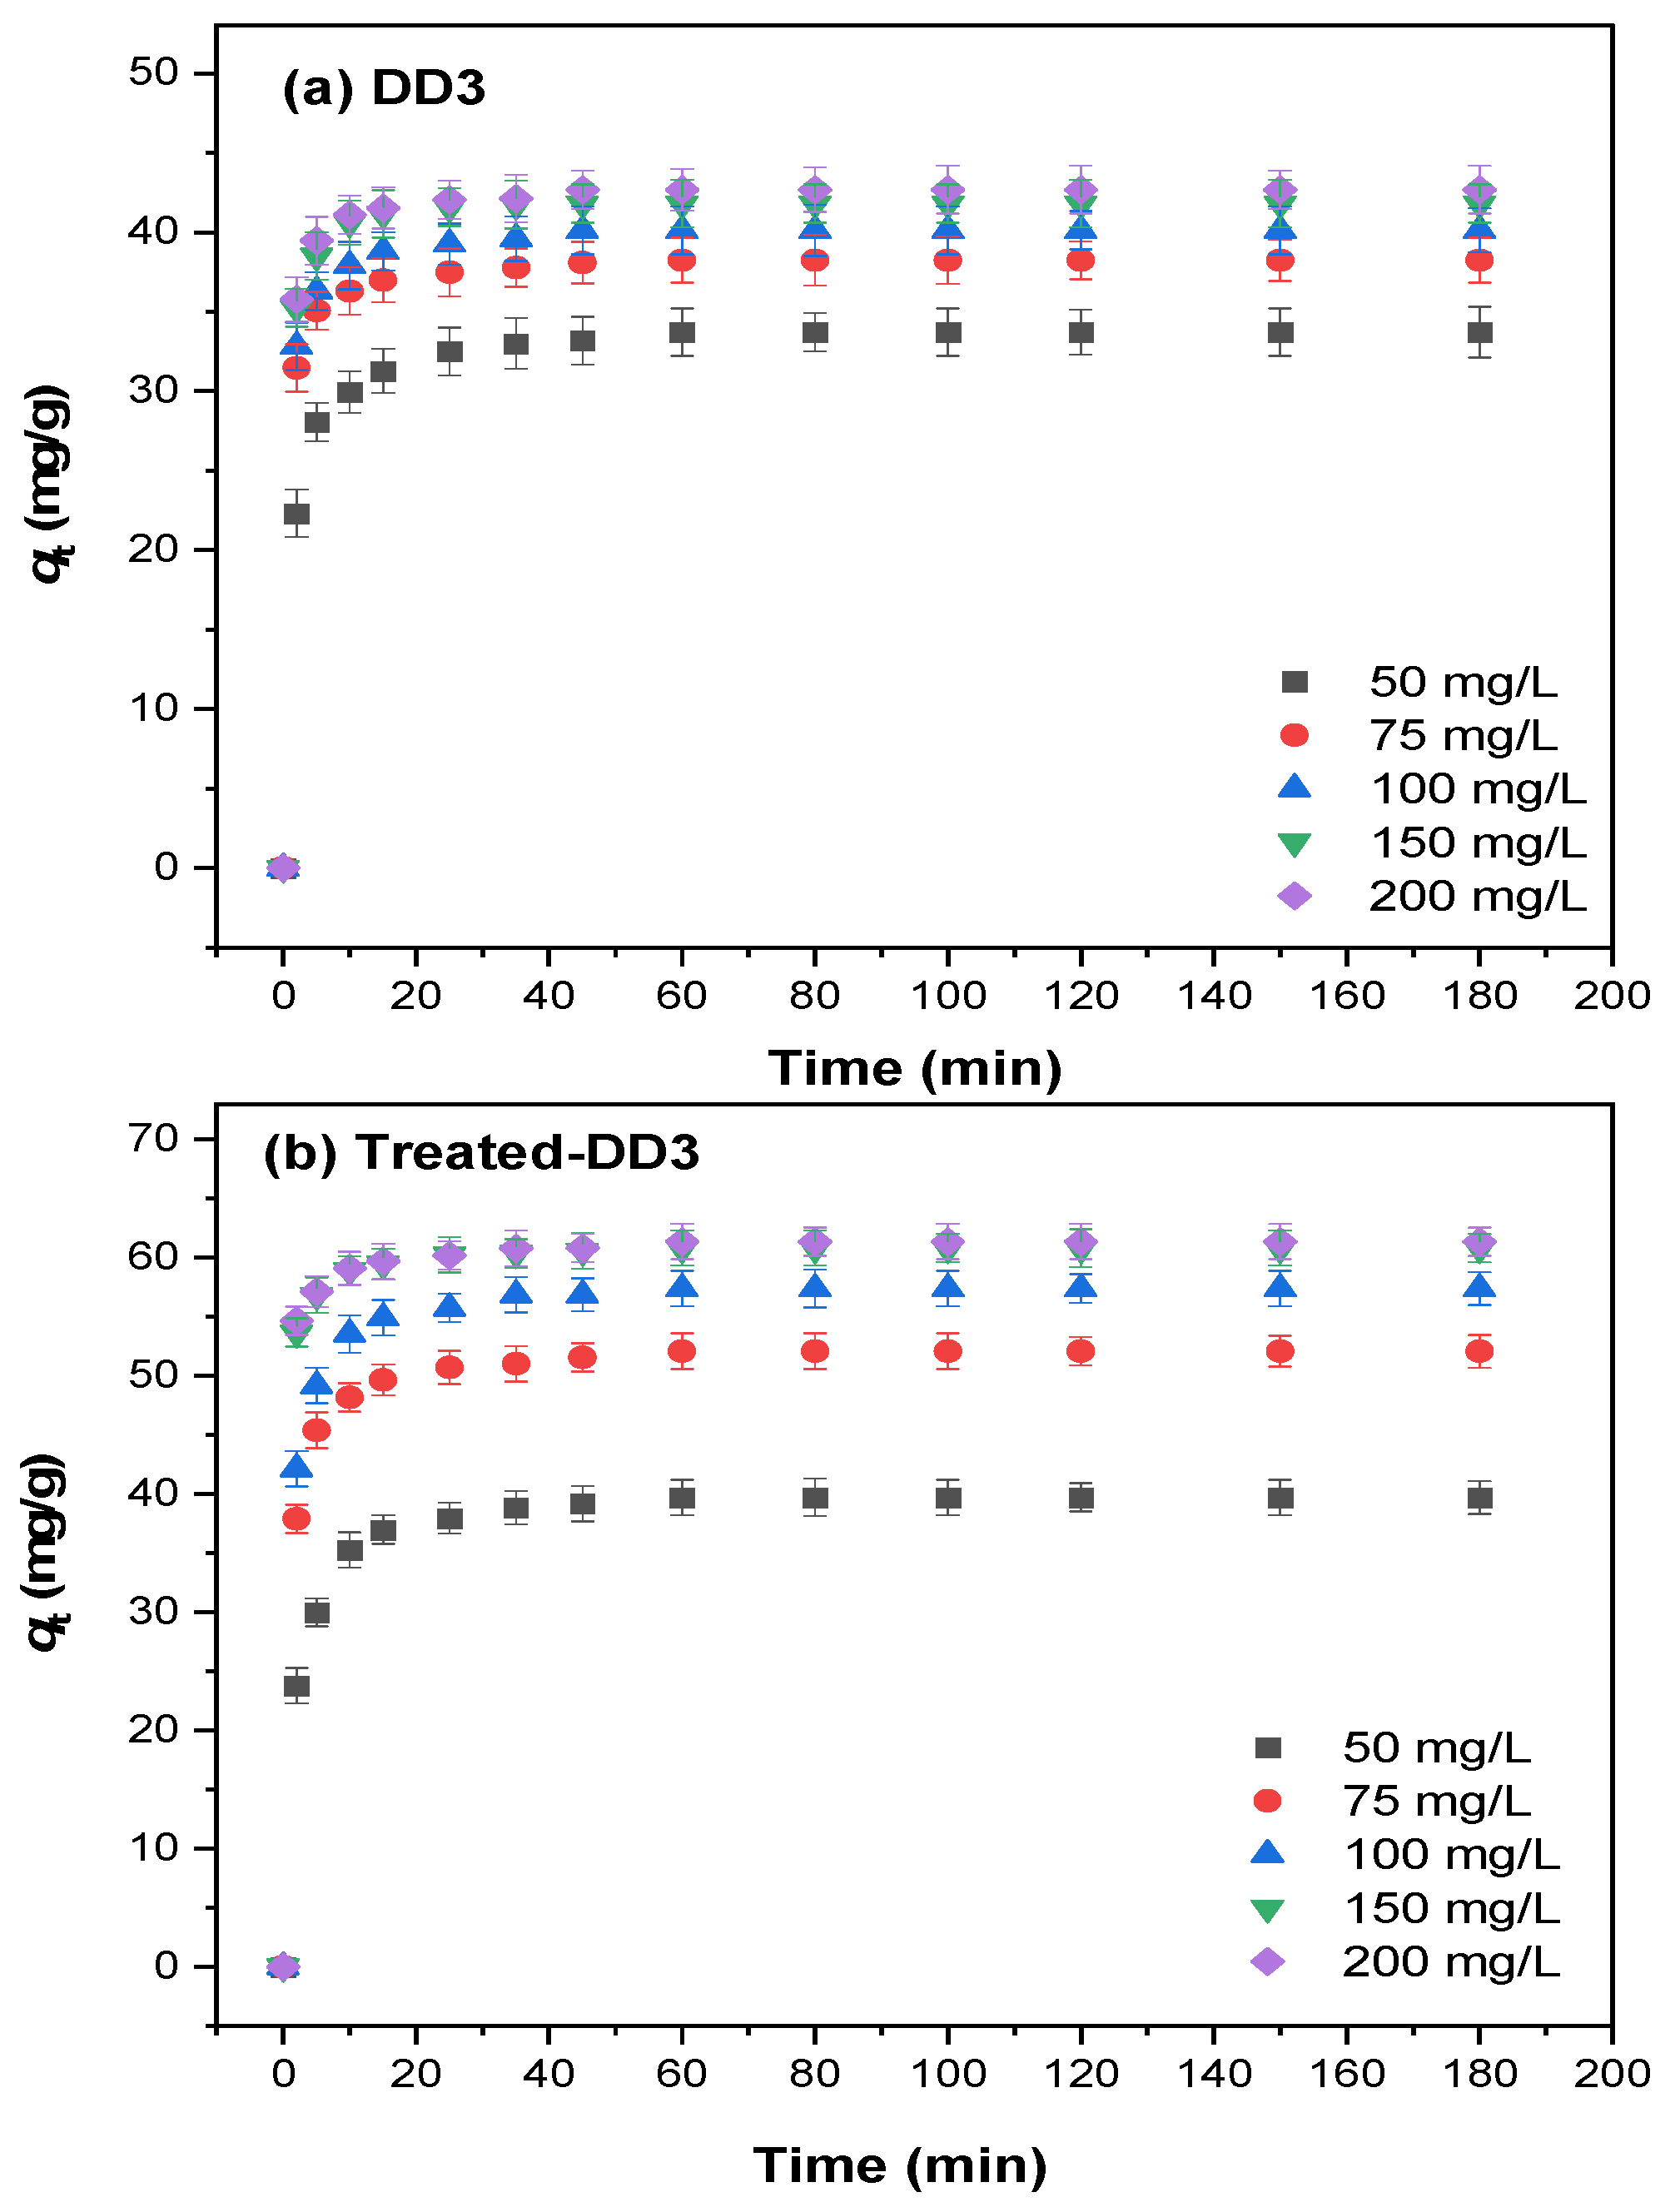
3.2.2. Adsorption Kinetics

Figure 6 depicts the evolution of the MB adsorption capacity by DD3 and treated-DD3 over time. Several other studies [27,68,69] indicated similar effects of contact times and concentrations on adsorption processes. The figure showed that the qt values increased with increasing contact times. The adsorption process could be divided into three steps for two adsorbents. In the first step (0–15 min), the rapid removal of MB dye was due to the large number of unoccupied surface sites, suggesting external surface diffusion. During the second step (15–60 min), the adsorption rate slowed down and gradually increased. In the final step (60–180 min), a plateau was reached after approximately 60 min (an equilibrium time for this study). This finding may be explained by the presence of underutilized adsorption sites on kaolinite surfaces. During the initial phase of adsorption, a large number of these empty sites were available for the adsorption of MB dye. As the contact duration increased, the surface sites became saturated, causing the remaining MB dye to move into the voids within the kaolinite samples. Eventually, all the unoccupied surface sites were filled, leading to a decrease in adsorption efficiency. This decline is likely due to both a decrease in the number of available surface sites and repulsive interactions between the MB molecules already adsorbed and those in the solution [4].
Two adsorption kinetic models: the pseudo-first-order (PFO; Equation (8)) and pseudo-second-order (PSO; Equation (9)) were used to infer adsorption kinetics of the MB dye onto DD3 and treated-DD3 [70,71].
q t = q e ( 1 e k 1 t )
q t = q e 2   k 2   t q e k 2   t + 1
where qt (mg/g) and qe (mg/g) are the amount of MB adsorbed per g of adsorbent (mg/g) at time t (min) and equilibrium, respectively; k 1 and k2 are the rate constants of the PFO (1/min) and PSO [(g/mg × min)] models, respectively.
The nonlinear plots of qt (mg/g) versus t (min) were drawn for the adsorbents DD3 and treated-DD3, and the parameters of these models (k1, k2, and qe) were obtained from the PFO and PSO equations (Table 3). The results showed that the PSO model described the kinetics adsorption perfectly compared to the PFO one. The PSO model presents a very high R2 value (>0.999), and the values qe from the model were also in good agreement with those from experiments (Table 3).

3.2.3. Adsorption Isotherms

Figure 5d demonstrates that the initial concentration of the MB dye (Co) had a significant influence on the MB adsorption kinetics by DD3 and treated-DD3. An increase in Co values (50–200 mg/L) led to increasing the MB adsorption ability onto DD3 (33.7–42.7 mg/g) and treated-DD3 (39.7–61.3 mg/g), respectively. At low Co (<75 mg/L), the adsorption sites in the materials were not saturated. In addition, this is attributable to the rise in the concentration gradient’s driving force. These findings demonstrate that the Co value has a crucial influence in the adsorption process [72,73].
The Langmuir (Equation (10)) and Freundlich (Equation (11)) models [71] were adjusted to the adsorption isotherms of the MB dye by DD3 and treated-DD3. The related nonlinear formulae of the isotherm models are summarized below:
q e = Q max K L C e 1 + K L C e
q e = K F . C e ( 1 / n )
where Qmax (mg/g) is the maximum adsorption capacity of the adsorbent; Ce (mg/L) is the equilibrium concentration; KL (L/mg) is the Langmuir constant; KF [(mg/g)/(mg/L)1/n] is the Freundlich constant; and n is the empirical coefficient related to the adsorption intensity.
The adsorption isotherm is represented by the curve giving the equilibrium adsorption capacity qe (mg/g) versus the equilibrium concentration Ce (mg/L) (Figure 5d). At initial higher dye concentrations, the resistance to mass transfer between the solid surface and the dye solution can be more rapidly exceeded. With increasing dye concentration, the vacant active centers on the adsorbent surface are rapidly filled. Thus, when the initial concentration increased, the amount adsorbed increased [31,74]. Table 4 shows that the Langmuir model (R2 = 0.999 and 0.999) well described the MB dye adsorption equilibrium data by the DD3 and treated-DD3 compared to the Freundlich model (0.937 and 0.866, respectively). The maximum adsorption capacity of treated-DD3 (64.58 mg/g) obtained from the Langmuir model was higher than that of DD3 (44.48 mg/g), suggesting the important role of acid treatment in enhancing the adsorption capacity of the kaolinite compared to other absorbents studied by the authors (Table S1).

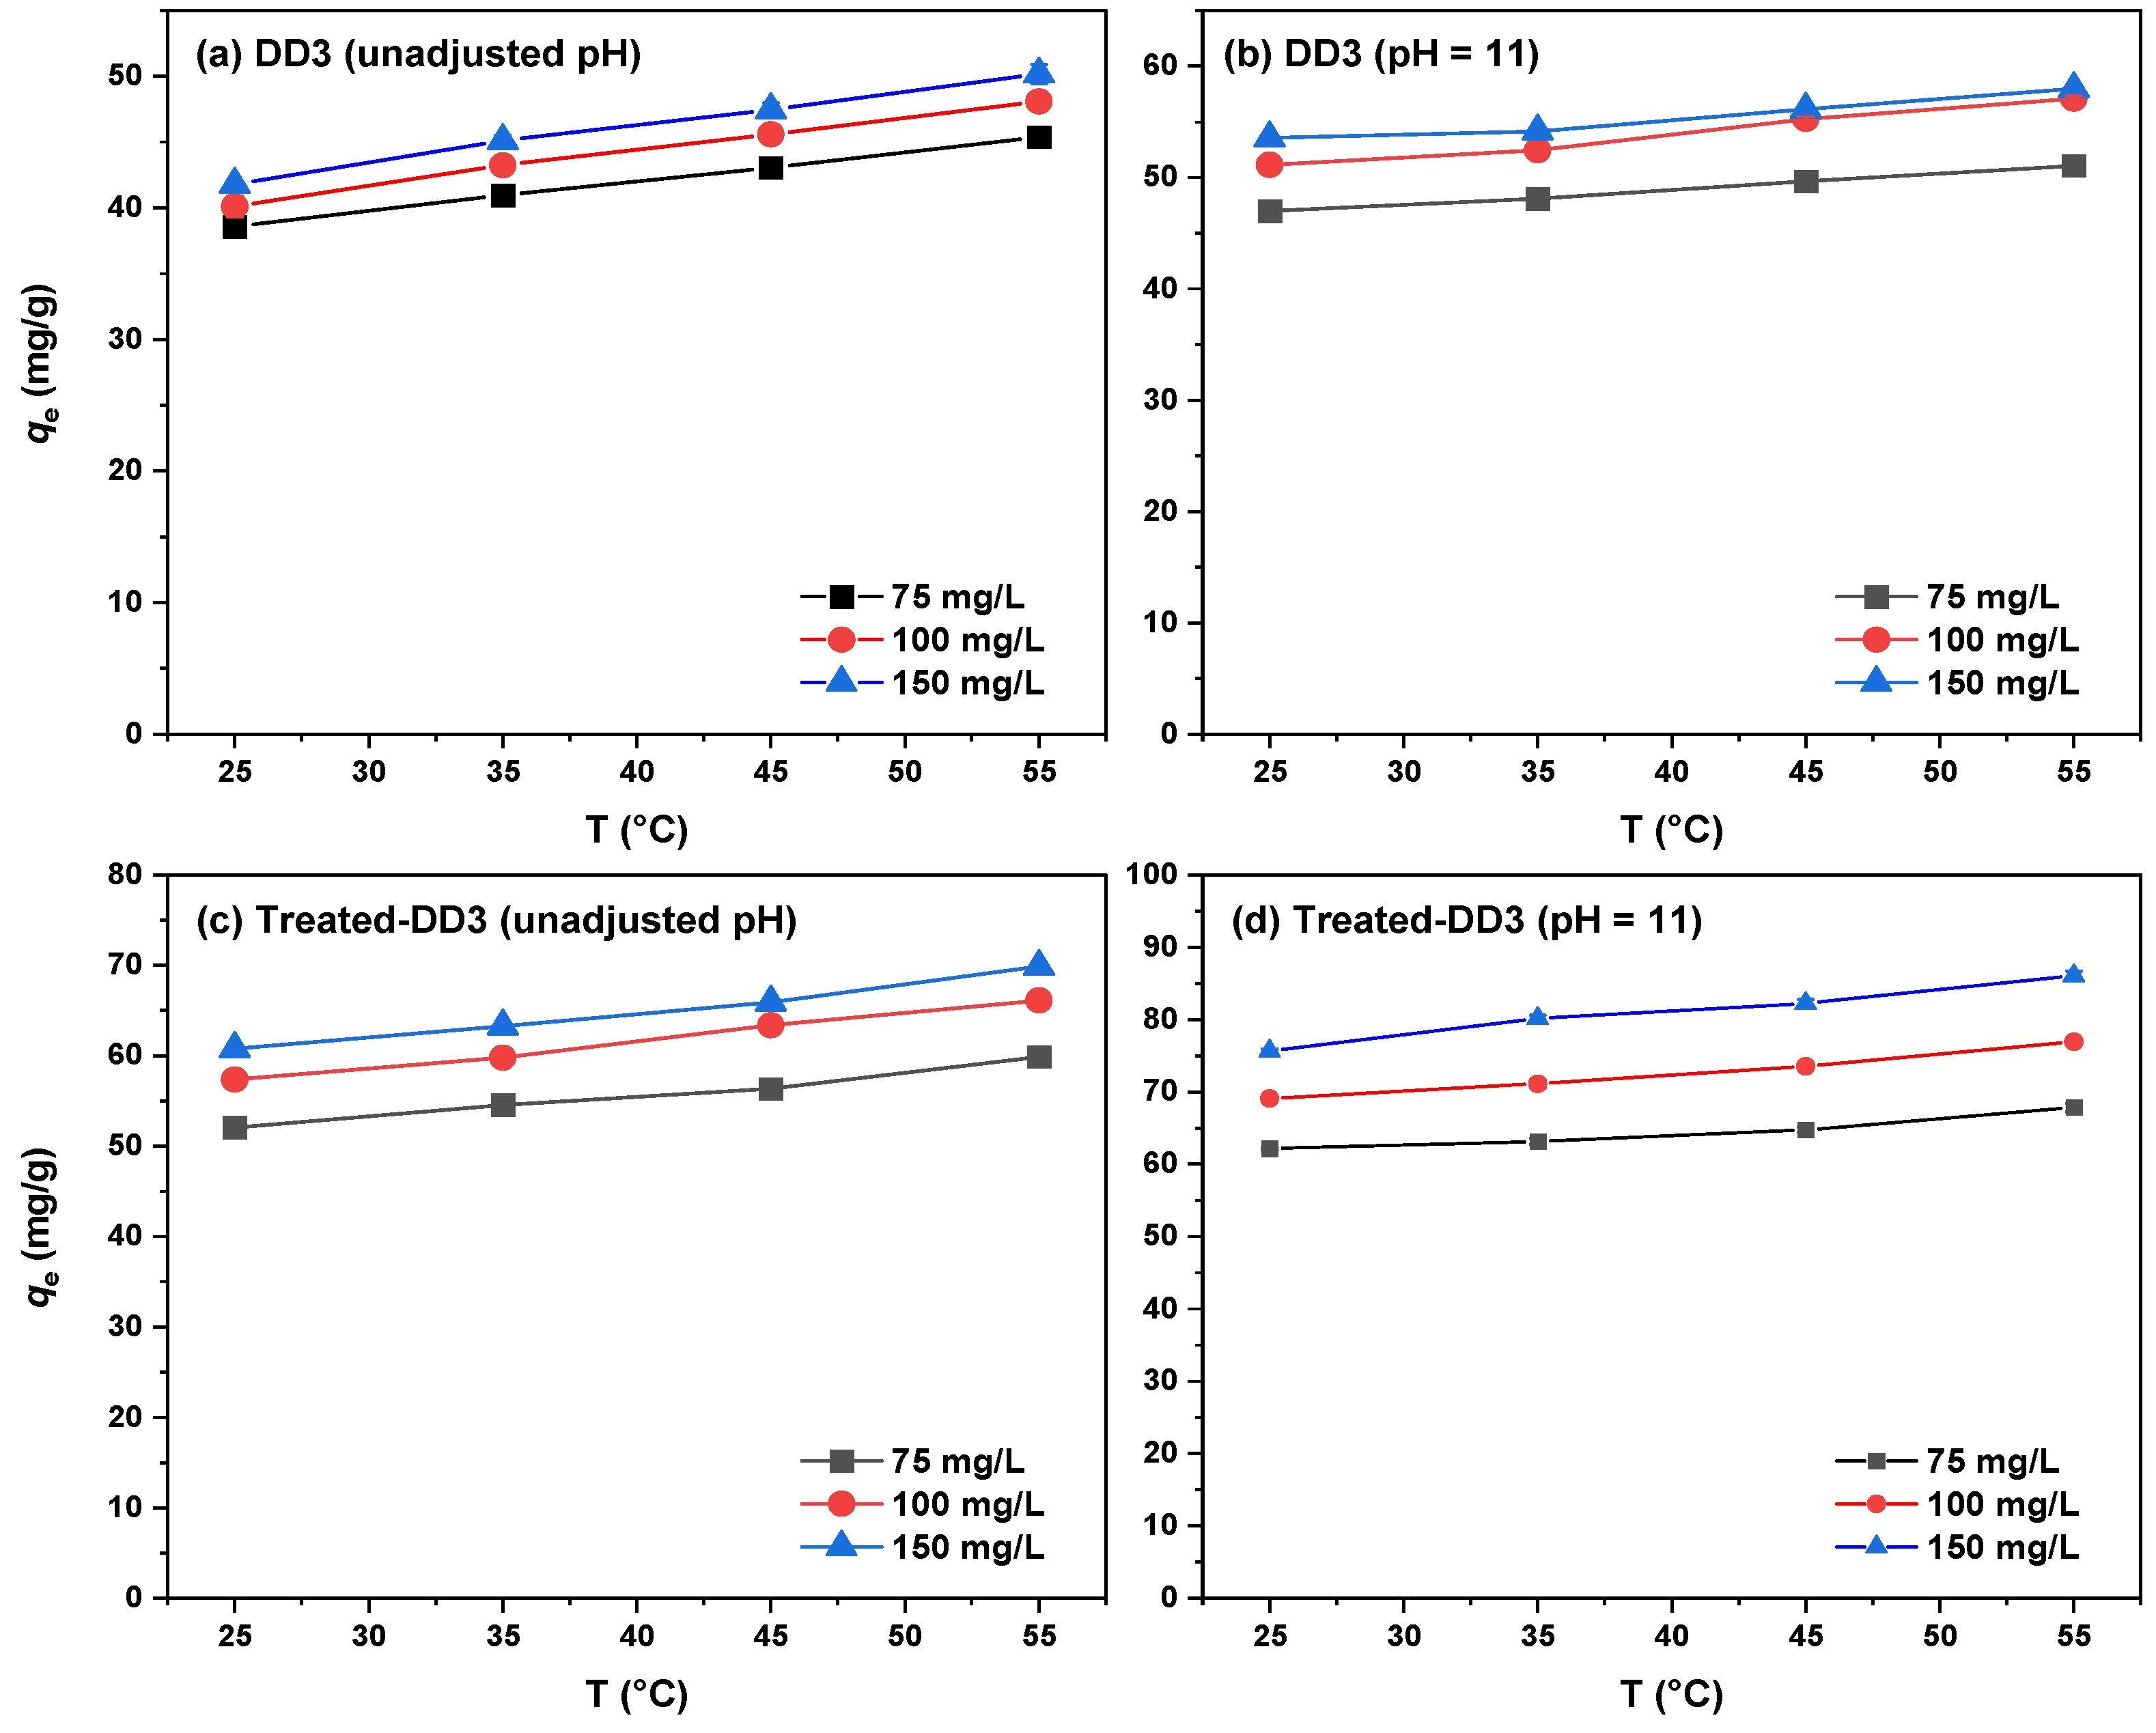
3.2.4. Adsorption Thermodynamics

The adsorption capacities of two materials at pH 7 and pH 11 were evaluated at different temperatures (298–328 K) to interpret the nature of the adsorption process (Figure 7). The results showed that their adsorption capacity increased slightly with increasing temperatures. This is because increasing temperatures caused a decrease in the dye solution viscosity. This stimulates the transfer and diffusion of MB molecules through the surface and pores of the adsorbents, which results in increasing the available adsorption sites [35,63,65,75,76]. The influence of temperature on the adsorption behavior of the MB dye onto the adsorbents is explained by determining the thermodynamic parameters [74,77], namely the change in standard Gibbs free energy (ΔG°), enthalpy (ΔH°), and entropy (ΔS°). The parameter ΔG° was directly computed based on (Equation (11)), and the others were determined using the following mathematical equation (Equation (12)) from the slope and intercept of the plot of KC versus 1/T.
Δ G ° = R T ln K C = Δ H ° T Δ S °
ln K C = Δ H ° R × 1 T + Δ S ° R
K C = 1000   K L M a d s o r b a t e   A d s o r b a t e ° γ M B
where R is the universal gas constant (8.314 J/mol×K); T represents the temperature (K); KC (dimensionless; Equation (14)) is the standard equilibrium for the adsorption process derived from the Langmuir constant KC (L/mol); C° is the standard concentration of the solute (1 mol/L by defined); Madsorbate (319.85 g/mol) is the atomic mass of MB; and γMB is the activity coefficient of the MB dye in solution (under dilution condition, γMB is assumed as unity). The nature of the thermodynamic process in adsorption processes (exothermic or endothermic) can give evidence for the solid–liquid interactions and mechanism of an adsorption process [74,77]. The resulting plots (not represented) of the Van ‘t Hoff equation (Equation (13)) were used to estimate ΔH° (kJ/mol) and ΔS° [J/(mol×K)]. Table 5 shows that the ΔH° values were positive (for DD3 and treated-DD3), indicating an endothermic adsorption process. In general, the adsorption phenomenon of the MB dye by DD3 or treated-DD3 was dominantly governed by weak forces (physical adsorption) because of low magnitudes of ΔH°. For chemical adsorption, ΔH° needs to higher than 80 kJ/mol [74,77]. The weak physical adsorption is consistent with the FTIR data. There were insignificant differences and changes of the FTIR spectrum of treated-DD3 before and after adsorption (Figure 3). Both ΔH° and ΔS° of the adsorption process by DD3 decreased with increasing pH of the solutions, whereas the opposite was true for treated-DD3. The result suggests that the primary adsorption mechanisms of DD3 were different to treated-DD3. Negative ΔG° values observed for all systems demonstrate the effectiveness of DD3 and treated-DD3 in removing the MB dye from an aqueous phase, which is comparable to other clay materials such as raw kaolin KT3B as reported by previous studies [35]. In comparison to treated-DD3, the ΔH° value for MB adsorption at pH 11 on treated-DD3 was larger, indicating a higher degree of kinetic difficulty in comparison to the unadjusted medium. This disparity was attributed to the exchange of MB+ with more mobile ions present on the treated-DD3 exchanger, which results in an increase in entropy during the adsorption process [73]. The positive ΔS° values for both adsorbents demonstrate an increase in the randomness of the system at the solid/solution interface due to the desorption of water molecules from the adsorbent surface [78]. The result is in agreement with the findings of other studies [31].

3.2.5. Dye Removal Efficiency by Treated-DD3 under Real BM-Wastewater

The results obtained in Figure 8 show that the effluent has a maximum wavelength at 540 nm, and the adsorption kinetics of the effluent dyes on treated-DD3 is very rapid, with a maximum sorption capacity (93.47%) reached within the first 7 min of contact. Then, the COD and BOD5 values for the effluent before treatment are 304.056 mg/L and 80 mg/L, and after treatment they decreased to 34.44 mg/L and 20 mg/L, respectively. Thus, it is evident that the treated-DD3 have a high affinity for COD and positively charged dye molecules [79].

3.3. Gaussian Process Regression

From the beginning, a multicollinearity test was conducted on the input variables to assess the existence of any correlation between them. This test consists of a plot of Kendall’s rank correlation coefficients among all pairs of variables, serving as a hypothesis test to determine which correlations significantly deviate from zero [51]. The multicollinearity test demonstrates that the variables have no linear relationship with one another, thereby indicating their independence. Next, ten kernel functions were optimized using the PSO algorithm with the base function and the best performing one was chosen based on RMSE and MAE. Table 6 displays the best model and its parameters (kernel scale and sigma) along with its characteristics (R, R2, adj-R2, RMSE, and MAE) for the four steps (training, testing, validation, and all four phases) and the kernel settings. Additionally, the table highlights the best kernel function with the resulting base functions, particle swarm count, and the number of iterations that produced the optimal model.
The results (Table 6) indicated that the correlation, determination, and adjusted coefficients are very high (close to 1) for all four phases. Additionally, the statistical coefficients for the model are low (near zero), which supports its accuracy. These findings are further illustrated in Figure 9. To verify the effectiveness of the obtained model, the experimental values were compared with the predicted values using the number of points in the database to visualize their relative positioning. Furthermore, a residual analysis was carried out by plotting the discrepancy between the experimental and predicted values against the number of data points in the database. Finally, the instance and frequency methods have been applied to provide a comprehensive overview of the obtained model [17].
The results demonstrate an exceptional match between actual and estimated values for all three phases. There are minimal errors within the range from −10 to 4 for all three phases. A noticeable occurrence of error 0 for all three phases (training, testing, and validation) is seen peaking at instance 250 with other errors being low and insignificant. A high frequency of error 0 (nearly 250) is further displayed. These results and observations suggest the effectiveness and performance of the GPR–PSO model.

3.4. Interface for Optimization and Prediction

An interface was developed utilizing the MATLAB guide for prediction to offer an effortless method for estimating the adsorbed amount of basic red and the rate of its removal. This interface tool was then transformed into a Windows executable application. This user-friendly application enables direct prediction of the output by choosing the input values through the GPR–PSO model (data are available if requested).

4. Conclusions

Raw DD3 and sulfuric acid-activated DD3 were tested for their ability to adsorb MB from aqueous solution. The results showed that the MB adsorption was influenced by several factors including pH, dose of adsorbent, ionic strength, contact time, initial concentration of dye, and temperature. The most crucial factor was found to be pH, and the highest MB adsorption was observed at pH 11. The study also found that a contact time between 30 to 60 min was sufficient to reach the equilibrium for MB adsorption.
The pseudo-first-order and pseudo-second-order kinetic models were utilized to examine the MB adsorption data, and the adsorption kinetics followed the pseudo-second-order model expression (with an R2 value of 0.999) which is better fitted to describe the adsorption kinetics. The Langmuir adsorption isotherm characterized by R2 values exceeding 0.99, provided a superior description of MB adsorption, with maximum adsorption capacities (Qmax) for both systems (DD3 + MB and treated-DD3 + MB) being 44.48 mg/g and 64.58 mg/g at 25 °C and natural pH medium, respectively.
The thermodynamic analysis revealed that the adsorption process for both DD3 and treated-DD3 adsorbents is not only feasible but also spontaneous and endothermic in the temperature range of 298–328 K. This was evident from the negative Gibbs energy (ΔG° < 0) observed for MB adsorption. The standard enthalpy change ΔH° of adsorption for MB at unadjusted pH was measured at +8.4 kJ/mol and +14.05 kJ/mol for DD3 and treated-DD3, respectively, while at pH = 11, the values were +3.69 kJ/mol and +27.09 kJ/mol for DD3 and treated-DD3, respectively. Additionally, the positive change in entropy indicated an increase in randomness at the solid–solution interface.
The GPR–PSO model demonstrated exceptional accuracy with highly favorable statistical coefficients (near 1) and very minimal statistical errors (close to 0). The effectiveness of the model has been verified through various techniques, such as test interpolation and residual analysis, highlighting the benefits of combining GPR with PSO.

Supplementary Materials

The following supporting information can be downloaded at: https://www.mdpi.com/article/10.3390/w16020243/s1, Figure S1: Structure of (a) methylene blue and (b) kaolinite DD3; Figure S2: Adsorption tests for the removal of MB on acid activated prepared materials, (C0 (MB) = 250 mg/L, m/V = 1 g/L, contact time 24 h, T = 25 ± 3 °C, and unadjusted pH); Figure S3: Point of zero charge (pHpzc) of DD3 and Treated-DD3; Figure S4: Plots showing the variation in the amount of MB adsorbed on DD3 and Treated-DD3 in the time range 0–60 min for the PSO model (m/V = 1 g/L, T = 25 ± 3 °C, and unadjusted pH), as a nonlinear expression; Figure S5: Multicollinearity test; Figure S6: Residuals relating to the model established by the different techniques according to the estimated values: (a) Relationship between experimental data and the predicted data of samples, (b) Residue of errors, and (c) Instances distribution of errors, and (d) Frequency distribution of errors; Figure S7: MATLAB Interface: prediction of the adsorption quantity with the GPR–PSO model; Table S1: Maximum adsorption capacity (Qmax (mg/g) of MB by various adsorbents in other reports.

Author Contributions

Conceptualization, N.H., A.H., S.C., A.I. and L.M.; software, A.I.; methodology, S.C., L.M., A.B. and N.H.; validation, A.I., A.B., L.M. and A.A.; formal analysis, H.T., A.H. and A.I.; investigation, N.H.; resources, A.I., L.M., A.O.E., H.A.A.-L., H.N.T. and A.A.; data curation, A.H. and L.M.; writing—original draft preparation, N.H., S.C., J.-C.B., A.O.E. and H.A.A.-L.; writing—review and editing, S.C, L.M., N.H., J.-C.B. and A.A.; visualization, L.M., A.O.E., H.A.A.-L., J.-C.B. and A.A.; supervision, L.M., H.N.T. and A.A.; project administration, L.M., H.T. and A.A. All authors have read and agreed to the published version of the manuscript.

Funding

This project was funded by the Researchers Supporting Project number (RSP2024R54), King Saud University, Riyadh, Saudi Arabia.

Data Availability Statement

Data is contained within the article or Supplementary Material.

Acknowledgments

The authors acknowledge the financial support through Researchers Supporting Project number (RSP2024R54), King Saud University, Riyadh, Saudi Arabia. Also, we would like to thank the Directorate-General for Scientific Research and Technological Development (DGRSDT) for supporting this work.

Conflicts of Interest

The authors declare no conflicts of interest.

References

  1. Hadadi, A.; Imessaoudene, A.; Bollinger, J.-C.; Assadi, A.A.; Amrane, A.; Mouni, L. Comparison of Four Plant-Based Bio-Coagulants Performances against Alum and Ferric Chloride in the Turbidity Improvement of Bentonite Synthetic Water. Water 2022, 14, 3324. [Google Scholar] [CrossRef]
  2. Zen, S.; Berrichi, F. Adsorption of Tannery Anionic Dyes by Modified Kaolin from Aqueous Solution. Desalination Water Treat. 2014, 57, 6024–6032. [Google Scholar] [CrossRef]
  3. Fei, F.; Gao, Z.; Wu, H.; Wurendaodi, W.; Zhao, S.; Asuha, S. Facile Solid-State Synthesis of Fe3O4/Kaolinite Nanocomposites for Enhanced Dye Adsorption. J. Solid State Chem. 2020, 291, 121655. [Google Scholar] [CrossRef]
  4. Cheikh, S.; Imessaoudene, A.; Bollinger, J.-C.; Hadadi, A.; Amar, M.; Bouzaza, A.; Assadi, A.A.; Amrane, A.; Zamouche, M.; El Jery, A.; et al. Complete Elimination of the Ciprofloxacin Antibiotic from Water by the Combination of Adsorption-Photocatalysis Process Using Natural Hydroxyapatite and TiO2. Catalysts 2023, 13, 336. [Google Scholar] [CrossRef]
  5. Hajjaji, W.; Andrejkovičová, S.; Pullar, R.; Tobaldi, D.; Galindo, A.; Jammousi, F.; Rocha, F.; Labrincha, J.A. Effective Removal of Anionic and Cationic Dyes by Kaolinite and TiO2/Kaolinite Composites. Clay Miner. 2016, 51, 19–27. [Google Scholar] [CrossRef]
  6. Kausar, A.; Naeem, K.; Tariq, M.; Nazli, Z.-I.-H.; Bhatti, H.; Jubeen, F.; Nazir, A. Preparation and Characterization of Chitosan/Clay Composite for Direct Rose FRN Dye Removal from Aqueous Media: Comparison of Linear and Non-Linear Regression Methods. J. Mater. Res. Technol. 2018, 8, 1161–1174. [Google Scholar] [CrossRef]
  7. Lertcumfu, N.; Jaita, P.; Thammarong, S.; Lamkhao, S.; Tandorn, S.; Randorn, C.; Tunkasiri, T.; Rujijanagul, G. Influence of Graphene Oxide Additive on Physical, Microstructure, Adsorption, and Photocatalytic Properties of Calcined Kaolinite-Based Geopolymer Ceramic Composites. Colloids Surf. A Physicochem. Eng. Asp. 2020, 602, 125080. [Google Scholar] [CrossRef]
  8. Bouras, D.; Mecif, A.; Harabi, A.; Barille, R.; Mahdjoub, A.; Zaabat, M. Economic and Ultrafast Photocatalytic Degradation of Orange II Using Ceramic Powders. Catalysts 2021, 11, 733. [Google Scholar] [CrossRef]
  9. Shikuku, V.; Mishra, T. Adsorption Isotherm Modeling for Methylene Blue Removal onto Magnetic Kaolinite Clay: A Comparison of Two-Parameter Isotherms. Appl. Water Sci. 2021, 11, 103. [Google Scholar] [CrossRef]
  10. Hadadi, A.; Imessaoudene, A.; Bollinger, J.-C.; Cheikh, S.; Assadi, A.A.; Amrane, A.; Kebir, M.; Mouni, L. Parametrical Study for the Effective Removal of Mordant Black 11 from Synthetic Solutions: Moringa Oleifera Seeds’ Extracts Versus Alum. Water 2022, 14, 4109. [Google Scholar] [CrossRef]
  11. Adeyemo-Oloidi, A.; Adeoye, I.; Bello, O. Adsorption of Dyes Using Different Types of Clay: A Review. Appl. Water Sci. 2015, 20, 543–568. [Google Scholar] [CrossRef]
  12. González-Crisostomo, J.; López-Juárez, R.; Yocupicio-Gaxiola, R.; Villanueva, E.; Zavala-Flores, E.; Petranovskii, V. Chabazite Synthesis and Its Exchange with Ti, Zn, Cu, Ag and Au for Efficient Photocatalytic Degradation of Methylene Blue Dye. Int. J. Mol. Sci. 2022, 23, 1730. [Google Scholar] [CrossRef] [PubMed]
  13. Hadadi, A.; Imessaoudene, A.; Bollinger, J.-C.; Cheikh, S.; Manseri, A.; Mouni, L. Dual Valorization of Potato Peel (Solanum tuberosum) as a Versatile and Sustainable Agricultural Waste in Both Bioflocculation of Eriochrome Black T and Biosorption of Methylene Blue. J. Polym. Environ. 2023, 31, 2983–2998. [Google Scholar] [CrossRef]
  14. Oussalah, A.; Boukerroui, A.; Amina, A.; Djellouli, B. Cationic and Anionic Dyes Removal by Low-Cost Hybrid Alginate/Natural Bentonite Composite Beads: Adsorption and Reusability Studies. Int. J. Biol. Macromol. 2018, 124, 854–862. [Google Scholar] [CrossRef]
  15. Jawad, A.H.; Abdulhameed, A. Mesoporous Iraqi Red Kaolin Clay as an Efficient Adsorbent for Methylene Blue Dye: Adsorption Kinetic, Isotherm and Mechanism Study. Surf. Interfaces 2019, 18, 100422. [Google Scholar] [CrossRef]
  16. Oussalah, A.; Boukerroui, A. Alginate-Bentonite Beads for Efficient Adsorption of Methylene Blue Dye. Euro-Mediterr. J. Environ. Integr. 2020, 5, 31. [Google Scholar] [CrossRef]
  17. Bouchelkia, N.; Tahraoui, H.; Amrane, A.; Belkacemi, H.; Bollinger, J.-C.; Bouzaza, A.; Zoukel, A.; Zhang, J.; Mouni, L. Jujube Stones Based Highly Efficient Activated Carbon for Methylene Blue Adsorption: Kinetics and Isotherms Modeling, Thermodynamics and Mechanism Study, Optimization via Response Surface Methodology and Machine Learning Approaches. Process Saf. Environ. Prot. 2022, 170, 513–535. [Google Scholar] [CrossRef]
  18. Khan, I.; Saeed, K.; Zekker, I.; Zhang, B.; Hendi, A.H.; Ahmad, A.; Ahmad, S.; Zada, N.; Ahmad, H.; Shah, L.A.; et al. Review on Methylene Blue: Its Properties, Uses, Toxicity and Photodegradation. Water 2022, 14, 242. [Google Scholar] [CrossRef]
  19. Abdel-Aziz, M.; Bassyouni, M.; Zoromba, M.; Alshehri, A. Removal of Dyes from Waste Solutions by Anodic Oxidation on an Array of Horizontal Graphite Rods Anodes. Ind. Eng. Chem. Res. 2018, 58, 1004–1018. [Google Scholar] [CrossRef]
  20. Ma, J.; Tang, X.; He, Y.; Fan, Y.; Chen, J.; Yu, H. Robust Stable MoS2/GO Filtration Membrane for Effective Removal of Dyes and Salts from Water with Enhanced Permeability. Desalination 2020, 480, 114328. [Google Scholar] [CrossRef]
  21. Hadadi, A.; Imessaoudene, A.; Bollinger, J.-C.; Bouzaza, A.; Amrane, A.; Tahraoui, H.; Mouni, L. Aleppo Pine Seeds (Pinus halepensis Mill.) as a Promising Novel Green Coagulant for the Removal of Congo Red Dye: Optimization via Machine Learning Algorithm. J. Environ. Manag. 2023, 331, 117286. [Google Scholar] [CrossRef] [PubMed]
  22. Dias, N.C.; Bassin, J.P.; Sant’Anna, G.L.; Dezotti, M. Ozonation of the Dye Reactive Red 239 and Biodegradation of Ozonation Products in a Moving-Bed Biofilm Reactor: Revealing Reaction Products and Degradation Pathways. Int. Biodeterior. Biodegrad. 2019, 144, 104742. [Google Scholar] [CrossRef]
  23. Alardhi, S.M.; Albayati, T.M.; Alrubaye, J.M. A Hybrid Adsorption Membrane Process for Removal of Dye from Synthetic and Actual Wastewater. Chem. Eng. Process. Process Intensif. 2020, 157, 108113. [Google Scholar] [CrossRef]
  24. Mishra, S.; Cheng, L.; Maiti, A. The Utilization of Agro-Biomass/Byproducts for Effective Bio-Removal of Dyes from Dyeing Wastewater: A Comprehensive Review. J. Environ. Chem. Eng. 2021, 9, 104901. [Google Scholar] [CrossRef]
  25. Joseph, J.; Radhakrishnan, R.C.; Johnson, J.K.; Joy, S.P.; Thomas, J. Ion-Exchange Mediated Removal of Cationic Dye-Stuffs from Water Using Ammonium Phosphomolybdate. Mater. Chem. Phys. 2020, 242, 122488. [Google Scholar] [CrossRef]
  26. Rafiq, A.; Ikram, M.; Ali, S.; Niaz, F.; Khan, M.; Khan, Q.; Maqbool, M. Photocatalytic Degradation of Dyes Using Semiconductor Photocatalysts to Clean Industrial Water Pollution. J. Ind. Eng. Chem. 2021, 97, 111–128. [Google Scholar] [CrossRef]
  27. Chedri Mammar, A.; Mouni, L.; Bollinger, J.-C.; Belkhiri, L.; Bouzaza, A.; Assadi, A.A.; Belkacemi, H. Modeling and Optimization of Process Parameters in Elucidating the Adsorption Mechanism of Gallic Acid on Activated Carbon Prepared from Date Stones. Sep. Sci. Technol. 2020, 55, 3113–3125. [Google Scholar] [CrossRef]
  28. Zhang, Q.; Zhang, Y.; Chen, J.; Liu, Q. Hierarchical Structure Kaolinite Nanospheres with Remarkably Enhanced Adsorption Properties for Methylene Blue. Nanoscale Res. Lett. 2019, 14, 104. [Google Scholar] [CrossRef]
  29. Zhang, L.; Min, F.; Chen, J.; Liu, C.; Wang, T. New Insights into the Interaction between Monomers from Acrylamide-Based Polymeric Flocculants and Montmorillonite: A DFT Study. J. Mol. Liq. 2022, 365, 120171. [Google Scholar] [CrossRef]
  30. Pajak, M. Adsorption Capacity of Smectite Clay and Its Thermal and Chemical Modification for Two Anionic Dyes: Comparative Study. Water Air Soil Pollut. 2021, 232, 83. [Google Scholar] [CrossRef]
  31. Imessaoudene, A.; Cheikh, S.; Bollinger, J.-C.; Belkhiri, L.; Tiri, A.; Bouzaza, A.; El Jery, A.; Assadi, A.; Amrane, A.; Mouni, L. Zeolite Waste Characterization and Use as Low-Cost, Ecofriendly, and Sustainable Material for Malachite Green and Methylene Blue Dyes Removal: Box–Behnken Design, Kinetics, and Thermodynamics. Appl. Sci. 2022, 12, 7587. [Google Scholar] [CrossRef]
  32. Sandollah, N.A.S.M.; Ghazali, S.A.I.S.M.; Ibrahim, W.N.W.; Rusmin, R. Adsorption-Desorption Profile of Methylene Blue Dye on Raw and Acid Activated Kaolinite. Indones. J. Chem. 2020, 20, 755. [Google Scholar] [CrossRef]
  33. Sternik, D.; Galaburda, M.V.; Bogatyrov, V.; Oranska, O.I.; Charmas, B.; Gun’ko, V. Novel Porous Carbon/Clay Nanocomposites Derived from Kaolinite/Resorcinol-Formaldehyde Polymer Blends: Synthesis, Structure and Sorption Properties. Appl. Surf. Sci. 2020, 525, 146361. [Google Scholar] [CrossRef]
  34. Achraf, H.; Gharibi, E.; Nasri, H.; El Ouahabi, M. Thermodynamics and Kinetics of the Removal of Methylene Blue from Aqueous Solution by Raw Kaolin. SN Appl. Sci. 2020, 2, 277. [Google Scholar] [CrossRef]
  35. Mouni, L.; Belkhiri, L.; Bollinger, J.-C.; Bouzaza, A.; Assadi, A.; Tirri, A.; Dahmoune, F.; Madani, K.; Remini, H. Removal of Methylene Blue from Aqueous Solutions by Adsorption on Kaolin: Kinetic and Equilibrium Studies. Appl. Clay Sci. 2018, 153, 38–45. [Google Scholar] [CrossRef]
  36. Nandi, B.; Goswami, A.; Purkait, M. Removal of Cationic Dyes from Aqueous Solutions by Kaolin: Kinetic and Equilibrium Studies. Appl. Clay Sci. 2009, 42, 583–590. [Google Scholar] [CrossRef]
  37. Hamdi, M.; Doğan, M.; Alkan, M. Removal of Cationic Dyes by Kaolinite. Microporous Mesoporous Mater. 2009, 122, 20–27. [Google Scholar] [CrossRef]
  38. Tehrani Bagha, A.; Nikkar, H.; Mahmoodi, N.M.; Menger, F.M. The Sorption of Cationic Dyes onto Kaolin: Kinetic, Isotherm and Thermodynamic Studies. Desalination 2011, 266, 274–280. [Google Scholar] [CrossRef]
  39. Sarma, G.; Gupta, S.; Bhattacharyya, K. Removal of Hazardous Basic Dyes from Aqueous Solution by Adsorption onto Kaolinite and Acid-Treated Kaolinite: Kinetics, Isotherm and Mechanistic Study. SN Appl. Sci. 2019, 1, 211. [Google Scholar] [CrossRef]
  40. Ding, Y.; Jin, Y.; Yao, B.; Khan, A. Artificial Intelligence Based Simulation of Cd (II) Adsorption Separation from Aqueous Media Using a Nanocomposite Structure. J. Mol. Liq. 2021, 344, 117772. [Google Scholar] [CrossRef]
  41. Khan, H.; Hussain, S.; Hussain, S.F.; Gul, S.; Ahmad, A.; Ullah, S. Multivariate Modeling and Optimization of Cr (VI) Adsorption onto Carbonaceous Material via Response Surface Models Assisted with Multiple Regression Analysis and Particle Swarm Embedded Neural Network. Environ. Technol. Innov. 2021, 24, 101952. [Google Scholar] [CrossRef]
  42. Khiam, G.K.; Karri, R.R.; Mubarak, N.M.; Khalid, M.; Walvekar, R.; Abdullah, E.C.; Rahman, M.E. Modelling and Optimization for Methylene Blue Adsorption Using Graphene Oxide/Chitosan Composites via Artificial Neural Network-Particle Swarm Optimization. Mater. Today Chem. 2022, 24, 100946. [Google Scholar] [CrossRef]
  43. Cristóbal, A.G.; Castelló, R.; Martin-Luengo, M.; Vizcayno, C. Zeolites Prepared from Calcined and Mechanically Modified Kaolins: A Comparative Study. Appl. Clay Sci. 2010, 49, 239–246. [Google Scholar] [CrossRef]
  44. Al-Ghouti, M.; Khraisheh, M.; Ahmad, M.; Allen, S. Adsorption Behaviour of Methylene Blue onto Jordanian Diatomite: A Kinetic Study. J. Hazard. Mater. 2008, 165, 589–598. [Google Scholar] [CrossRef] [PubMed]
  45. Hassani, A.; Vafaei, F.; Karaca, S.; Khataee, A. Adsorption of a Cationic Dye from Aqueous Solution Using Turkish Lignite: Kinetic, Isotherm, Thermodynamic Studies and Neural Network Modeling. J. Ind. Eng. Chem. 2014, 20, 2615–2624. [Google Scholar] [CrossRef]
  46. Doğan, M.; Abak, H.; Alkan, M. Adsorption of Methylene Blue onto Hazelnut Shell: Kinetics, Mechanism and Activation Parameters. J. Hazard. Mater. 2008, 164, 172–181. [Google Scholar] [CrossRef]
  47. Rida, K.; Sarra, B.; Selma, H. Adsorption of Methylene Blue from Aqueous Solution by Kaolin and Zeolite. Appl. Clay Sci. 2013, 83–84, 99–105. [Google Scholar] [CrossRef]
  48. Yavuz, Ö.; Saka, C. Surface Modification with Cold Plasma Application on Kaolin and Its Effects on the Adsorption of Methylene Blue. Appl. Clay Sci. 2013, 85, 96–102. [Google Scholar] [CrossRef]
  49. Rahmani, S.; Zeynizadeh, B.; Karami, S. Removal of Cationic Methylene Blue Dye Using Magnetic and Anionic- Cationic Modified Montmorillonite: Kinetic, Isotherm and Thermodynamic Studies. Appl. Clay Sci. 2019, 184, 105391. [Google Scholar] [CrossRef]
  50. Tahraoui, H.; Belhadj, A.-E.; Triki, Z.; Boudella, N.; Seder, S.; Amrane, A.; Zhang, J.; Moula, N.; Tifoura, A.; Ferhat, R.; et al. Mixed Coagulant-Flocculant Optimization for Pharmaceutical Effluent Pretreatment Using Response Surface Methodology and Gaussian Process Regression. Process Saf. Environ. Prot. 2022, 169, 909–927. [Google Scholar] [CrossRef]
  51. Tahraoui, H.; Belhadj, A.-E.; Amrane, A.; Houssein, E.H. Predicting the Concentration of Sulfate Using Machine Learning Methods. Earth Sci. Inform. 2022, 15, 1023–1044. [Google Scholar] [CrossRef]
  52. Zamouche, M.; Tahraoui, H.; Laggoun, Z.; Mechati, S.; Chemchmi, R.; Kanjal, M.I.; Amrane, A.; Hadadi, A.; Mouni, L. Optimization and Prediction of Stability of Emulsified Liquid Membrane (ELM): Artificial Neural Network. Processes 2023, 11, 364. [Google Scholar] [CrossRef]
  53. Bousselma, A.; Abdessemed, D.; Tahraoui, H.; Amrane, A. Umjetna Inteligencija i Matematičko Modeliranje Kinetike Sušenja Prethodno Obrađenih Cjelovitih Plodova Marelice. Kem. U Ind. Časopis Kemičara I Kem. Inženjera Hrvat. 2021, 70, 651–667. [Google Scholar]
  54. Zamouche, M.; Chermat, M.; Kermiche, Z.; Tahraoui, H.; Kebir, M.; Bollinger, J.-C.; Amrane, A.; Mouni, L. Predictive Model Based on K-Nearest Neighbor Coupled with the Gray Wolf Optimizer Algorithm (KNN_GWO) for Estimating the Amount of Phenol Adsorption on Powdered Activated Carbon. Water 2023, 15, 493. [Google Scholar] [CrossRef]
  55. Rao, B.; Dai, H.; Gao, L.; He, F.; Zhang, M.; Gan, F.; Zhang, Q.; Liu, M.; Yin, Z. A Novel Combined Metallurgy-Beneficiation Method for the Facile and Low-Cost Comprehensive Resource Utilization of Low-Grade Kaolin Solid Wastes. J. Environ. Manag. 2023, 345, 118650. [Google Scholar] [CrossRef] [PubMed]
  56. Ayalew, A.A. Physiochemical Characterization of Ethiopian Mined Kaolin Clay through Beneficiation Process. Adv. Mater. Sci. Eng. 2023, 2023, 9104807. [Google Scholar] [CrossRef]
  57. Misrar, W.; Loutou, M.; Saadi, L.; Waqif, M.; Mansori, M. Modification of Ceramic Membranes Porosity Using Layer Deposition of Kaolinite and Palygorskite. J. Aust. Ceram. Soc. 2023, 59, 995–1012. [Google Scholar] [CrossRef]
  58. Aragaw, T.A.; Temesgen, F. Synthesis and Characterization of Ethiopian Kaolin for the Removal of Basic Yellow (BY 28) Dye from Aqueous Solution as a Potential Adsorbent. Heliyon 2020, 6, e04975. [Google Scholar] [CrossRef]
  59. Aljohani, N.S.; Kavil, Y.N.; Al-Farawati, R.K.; Alelyani, S.S.; Orif, M.I.; Shaban, Y.A.; Al-Mhyawi, S.R.; Aljuhani, E.H.; Salam, M.A. The Effective Adsorption of Arsenic from Polluted Water Using Modified Halloysite Nanoclay. Arab. J. Chem. 2023, 16, 104652. [Google Scholar] [CrossRef]
  60. Felhi, M.; Tlili, A.; Gaied, M.; Montacer, M. Mineralogical Study of Kaolinitic Clays from Sidi El Bader in the Far North of Tunisia. Appl. Clay Sci. 2008, 39, 208–217. [Google Scholar] [CrossRef]
  61. Sing, K. Reporting Physisorption Data for Gas/Solid Systems with Special Reference to the Determination of Surface Area and Porosity. Pure Appl. Chem. 1982, 54, 2201–2218. [Google Scholar] [CrossRef]
  62. Mellouk, S.; Cherifi, S.; Sassi, M.; Marouf-Khelifa, K.; Bengueddach, A.; Khelifa, A. Intercalation of Halloysite from Djebel Debagh (Algeria) and Adsorption of Copper Ions. Appl. Clay Sci. 2009, 44, 230–236. [Google Scholar] [CrossRef]
  63. Khan, T.A.; Khan, E.A.; Shahjahan. Removal of Basic Dyes from Aqueous Solution by Adsorption onto Binary Iron-Manganese Oxide Coated Kaolinite: Non-Linear Isotherm and Kinetics Modeling. Appl. Clay Sci. 2015, 107, 70–77. [Google Scholar] [CrossRef]
  64. Omer, O.S.; Hussein, M.A.; Hussein, B.H.; Mgaidi, A. Adsorption Thermodynamics of Cationic Dyes (Methylene Blue and Crystal Violet) to a Natural Clay Mineral from Aqueous Solution between 293.15 and 323.15 K. Arab. J. Chem. 2017, 11, 615–623. [Google Scholar] [CrossRef]
  65. Munir, M.; Nazar, M.; Zafar, M.; Zubair, M.; Ashfaq, M.; Hosseini-Bandegharaei, A.; Khan, S.; Ahmad, A. Effective Adsorptive Removal of Methylene Blue from Water by Didodecyldimethylammonium Bromide-Modified Brown Clay. ACS Omega 2020, 5, 16711–16721. [Google Scholar] [CrossRef]
  66. Errais, E.; Duplay, J.; Darragi, F.; M’Rabet, I.; Aubert, A.; Huber, F.; Morvan, G. Efficient Anionic Dye Adsorption on Natural Untreated Clay: Kinetic Study and Thermodynamic Parameters. Desalination 2011, 275, 74–81. [Google Scholar] [CrossRef]
  67. Luckham, P.; Rossi, S. The Colloidal and Rheological Properties of Bentonite Suspensions. Adv. Colloid Interface Sci. 1999, 82, 43–92. [Google Scholar] [CrossRef]
  68. Feng, Y.; Zhou, H.; Liu, G.; Qiao, J.; Wang, J.; Haiying, L.; Yang, L. Methylene Blue Adsorption onto Swede Rape Straw (Brassica napus L.) Modified by Tartaric Acid: Equilibrium, Kinetic and Adsorption Mechanisms. Bioresour. Technol. 2012, 125, 138–144. [Google Scholar] [CrossRef]
  69. Sheshmani, S.; Ashori, A.; Hasanzadeh, S. Removal of Acid Orange 7 from Aqueous Solution Using Magnetic Graphene/Chitosan: A Promising Nano-Adsorbent. Int. J. Biol. Macromol. 2014, 68, 218–224. [Google Scholar] [CrossRef]
  70. Lima, É.C.; Adebayo, M.A.; Machado, F.M. Kinetic and Equilibrium Models of Adsorption. In Carbon Nanomaterials as Adsorbents for Environmental and Biological Applications; Springer: Berlin/Heidelberg, Germany, 2015; pp. 33–69. [Google Scholar]
  71. Fernandes, J.; Rodrigues, A.M.; Menezes, R.; Neves, G. Adsorption of Anionic Dye on the Acid-Functionalized Bentonite. Materials 2020, 13, 3600. [Google Scholar] [CrossRef]
  72. Nguyen, V.; Pho, Q. Preparation of Chitosan Coated Magnetic Hydroxyapatite Nanoparticles and Application for Adsorption of Reactive Blue 19 and Ni2+ Ions. Sci. World J. 2014, 2014, 273082. [Google Scholar] [CrossRef] [PubMed]
  73. Zhang, H.; Xiaoyun, W.; Honghong, L.; Tianshe, T.; Wu, W. Adsorption Behavior of Th(IV) onto Illite: Effect of Contact Time, pH Value, Ionic Strength, Humic Acid and Temperature. Appl. Clay Sci. 2016, 127–128, 35–43. [Google Scholar] [CrossRef]
  74. Tran, H.N.; You, S.-J.; Hosseini-Bandegharaei, A.; Chao, H.-P. Mistakes and Inconsistencies Regarding Adsorption of Contaminants from Aqueous Solutions: A Critical Review. Water Res. 2017, 120, 88–116. [Google Scholar] [CrossRef] [PubMed]
  75. Kul, A.; Gökırmak Söğüt, E.; Caliskan, N. Adsorption of neutral red dye from aqueous solutions by natural adsorbent: An equilibrium, kinetic and thermodynamic study. Commun. Fac. Sci. Univ. Ank. Ser. B Chem. Chem. Eng. 2021, 63, 27–60. [Google Scholar]
  76. Mustapha, S.; Ndamitso, M.; Abdulkareem, A.; Tijani Oladejo, J.; Mohammed, A.; Shuaib, D.T. Potential of Using Kaolin as a Natural Adsorbent for the Removal of Pollutants from Tannery Wastewater. Heliyon 2019, 5, e02923. [Google Scholar] [CrossRef]
  77. Tran, H.; You, S.-J.; Chao, H.-P. Thermodynamic Parameters of Cadmium Adsorption onto Orange Peel Calculated from Various Methods: A Comparison Study. J. Environ. Chem. Eng. 2016, 4, 2671–2682. [Google Scholar] [CrossRef]
  78. Cheikh, S.; Imessaoudene, A.; Bollinger, J.-C.; Manseri, A.; Bouzaza, A.; Hadadi, A.; Hamri, N.; Amrane, A.; Mouni, L. Adsorption Behavior and Mechanisms of the Emerging Antibiotic Pollutant Norfloxacin on Eco-Friendly and Low-Cost Hydroxyapatite: Integrated Experimental and Response Surface Methodology Optimized Adsorption Process. J. Mol. Liq. 2023, 392, 123424. [Google Scholar] [CrossRef]
  79. Agarwal, S.; Singh, A.P.; Mathur, S. Removal of COD and Color from Textile Industrial Wastewater Using Wheat Straw Activated Carbon: An Application of Response Surface and Artificial Neural Network Modeling. Environ. Sci. Pollut. Res. 2023, 30, 41073–41094. [Google Scholar] [CrossRef]
Figure 1. XRD data of (a) DD3 and (b) treated-DD3 kaolinites.
Water 16 00243 g001
Figure 2. SEM images and EDS data of the DD3 and treated-DD3 kaolinites.
Water 16 00243 g002
Figure 3. Nitrogen adsorption/desorption isotherms at 77 K of DD3 and treated-DD3 kaolinites.
Water 16 00243 g003
Figure 4. FTIR spectrum of (a) DD3, (b) treated-DD3, and (c) treated-DD3 after adsorbing MB dye.
Water 16 00243 g004
Figure 5. (ac) Effect of adsorbent doses (solid/liquid ratios), solution pH, and ionic strength on the adsorption of MB onto DD3 and treated-DD3; and (d) dye adsorption isotherm by DD3 and treated-DD3.
Water 16 00243 g005
Figure 6. Effect of contact time and initial concentration of MB on the adsorption capacity of (a) DD3 and (b) treated-DD3 (m/V = 1 g/L, 25 ± 3 °C, and unadjusted pH).
Water 16 00243 g006
Figure 7. Effect of temperature on the adsorption capacity of the MB dye onto (a,b) DD3 and (c,d) treated-DD3 at different solutions’ pH and initial dye concentrations.
Water 16 00243 g007
Figure 8. (a) COD values of the BM-wastewater effluents before and after adsorption on treated-DD3; and (b) Effect of contact time of BM-wastewater decolorization on treated-DD3 (pH of the effluent, m/V = 1 g/L, and 25 ± 3 °C).
Water 16 00243 g008
Figure 9. Relationship between experimental values and predicted values (based on the GPR–PSO model): training data, test data, validation data, and all data.
Water 16 00243 g009
Table 1. Oxide composition (%) for DD3 and treated-DD3 kaolinites determined by the XRF technique.
ComponentDD3Treated-DD3
SiO241.1337.73
Al2O335.9235.49
Fe2O30.920.98
MgO0.030.08
CaO0.200.39
Na2O0.320.37
K2O0.270.26
NiO0.040.05
BaO0.050.07
P2O50.050.05
SO30.740.71
MnO0.710.92
LOI *19.5622.58
Note: * Loss on ignition.
Table 2. Basic properties of DD3 and treated-DD3 adsorbents.
UnitDD3Treated-DD3
SBETm2/g67.60155.1
VTotcm3/g0.2520.386
Dpnm14.949.95
CECmeq/100 g14.369.83
pHPZC6.703.85
Table 3. Parameters of the pseudo-first-order and pseudo-second-order kinetic models for adsorbing the MB dye by DD3 and treated-DD3.
Co
(mg/L)
qe (exp)
(mg/g)
PFO Model PSO Model
qe
(mg/g)
k1
(1/min)
R2qe
(mg/g)
k2
g/(mg × min)
R2
1. DD3
50

33.70

32.84

0.504

0.980

33.94

0.027

0.999
7538.2337.640.8710.99338.310.0580.999
10040.1139.460.8520.99140.190.0520.999
15041.7941.400.9210.99442.030.0600.999
2. Treated-DD3
50

39.71

38.78

0.379

0.977

40.30

0.016

0.999
7552.0751.030.6270.98752.360.0240.999
10057.3756.280.6280.98557.750.0220.999
15060.8060.141.0910.99560.850.0570.999
Table 4. Parameters of the Langmuir and Freundlich isotherm models for adsorbing the MB dye onto DD3 and treated-DD3.
UnitDD3Treated-DD3
1. Langmuir model
Qmax

mg/g

44.48

64.58
KLL/mg0.1480.163
R20.9990.999
2. Freundlich model
KF

(mg/g)/(mg/L)1/n

24.16

31.48
1/n0.1160.141
R20.9370.866
Table 5. Thermodynamic parameters for adsorption of MB dye onto DD3 and teated-DD3.
T (K)KCΔG°
(kJ/mol)
ΔH°
(kJ/mol)
ΔS° [J/(mol × K)]
1. DD3
Unadjusted pH
298

47,626

−26.69

8.40

117.98
30856,933−28.04
31861,501−29.15
32865,397−30.24
pH = 11
298

55,971

−27.09

3.69

103.34
30859,492−28.15
31862,371−29.19
32864,069−30.18
2. Treated-DD3
Unadjusted pH
298

52,238

−26.91

14.05

137.50
30866,401−28.43
31870,162−29.50
32891,154−31.14
pH = 11
298

73,185

−27.75

27.09

182.87
30884,492−29.05
31894,267−30.28
328217,671−33.51
Table 6. Performances of the GPR–PSO model.
PSOMax_Iteration = 100
SearchAgents_no = 30
Kernel FunctionBasis FunctionKernel ScaleSigmaR/R2/adj-R2RMSE/MAE
Sigma MSigma F TrainTestVALALLTrainTestVALALL
Ard
Exponential
Constant0.0296
17.6066
10.1373
75.1580
233.048
11.5636
21.36030.35061.0000
1.0000
1.0000
0.9925
0.9851
0.9828
0.9988
0.9976
0.9972
0.9989
0.9978
0.9978
0.0745
0.0258
2.5985
1.7202
1.3942
0.7975
1.1390
0.3926
Disclaimer/Publisher’s Note: The statements, opinions and data contained in all publications are solely those of the individual author(s) and contributor(s) and not of MDPI and/or the editor(s). MDPI and/or the editor(s) disclaim responsibility for any injury to people or property resulting from any ideas, methods, instructions or products referred to in the content.

