Abstract
An accurate assessment of crop water requirements during the crop growth period can help organize irrigation schedules and investigate the hydrological environments in irrigation districts, especially in shallow groundwater districts. In irrigation scheduling, crop coefficients, representing three development stages, play a critical role in modeling evapotranspiration. Therefore, in this study, the crop coefficient (Kc) of sunflowers under drip irrigation in different hydrological years in the Hetao irrigation district with shallow groundwater is determined. Based on the analysis of rainfall frequency, the experimental situations of 2012, 2013, and 2014 are adopted as high, normal, and low flow years. Using the water balance method, groundwater recharge and crop evapotranspiration in different hydrological years were investigated. The results showed that the groundwater recharge in a high-flow year was larger than that in normal and low-flow years with values of 67.47, 66.75, and 42.61 mm, respectively. Crop evapotranspiration is directly related to the irrigation amount at the same growth stage. The Kc of sunflowers in a high-flow year is higher by 0.1 and 0.15 than that in normal and low-flow years. The Kc of sunflowers under drip irrigation is lower than that under surface irrigation by 8.9% in the initial and late stages of sunflower growth, but higher than that by 10.6% in the mid-stage, which is due to differences in small water potential differences and less evapotranspiration in the initial and late stages under drip irrigation. The study is of great significance for formulating a reasonable schedule of drip irrigation with shallow groundwater and improving the field environment.
1. Introduction
Water resources are a kind of precious natural resource for national and regional social economies and ecological environments. With water becoming scarce, especially in semi-arid countries, the difficulty we are facing is to produce more food with less water [1].
In China, one of the most severely water-short countries in the world, irrigation and food supply are intrinsically linked. Seventy percent of the food required for 1.3 billion people is produced on irrigated land. In addition, the rapid development of urbanization and industrialization will require more water in the future and then agriculture will be required to produce more food with less water and other decreasing resources. Therefore, improving irrigation efficiency without decreasing the yield and improving the ecological environment in China is a serious challenge [2,3], especially in the changing environment.
To meet crop evapotranspiration, the shallow groundwater can continuously replenish the soil water to meet the water absorption of crop roots. The amount of groundwater replenishment or utilization of groundwater by crops refers to the amount of submerged evaporation under crop cover [4]. Groundwater recharge can reduce the irrigation quota, protect water resources, and reduce the cost of agricultural production [5]. In shallow groundwater districts, groundwater upflow can play an important role in contributing to crop water use, and then the vertical water flux in groundwater tables needs to be quantified because the shallow groundwater should be viewed as a potential water resource for crop use and ecological environment protection [6,7]. Chen reported that the contribution of groundwater to evapotranspiration has an obviously increasing trend with declining groundwater, accounting for 20% in 2013, which was doubled compared with that in 1980 [8]. Babajimopoulos et al. found that in terms of the specific field conditions, 3.6 mm/day of water in the root zone originating from the shallow water table amounted to about 18% of the water, which was transpired by the maize with the water table observed at a mean depth of 0.58 m below the soil surface [9].
Sustainable irrigation practices aim at improving crop productivity with manageable resources under a changing hydrological environment [10]. An accurate assessment of water requirements during the crop growth period can help to determine irrigation amount and date, maximize crop yield, and minimize water loss and crop stress [11,12,13]. The importance of accurate actual evapotranspiration (ETc) estimation has been highlighted in several studies [14,15]. These studies, however, have only considered the crop-soil system in a less-irrigated environment but failed to take into account different hydrological years and the water for crop evapotranspiration from groundwater in shallow groundwater regions.
The crop coefficient, estimated by crop reference evapotranspiration, accounts for phenological and managerial conditions of soil and crops [16,17]. The applicability of water-saving approaches will affect crop water use and the field environment requires accurate information on crop water use (i.e., crop coefficient and evapotranspiration) [18,19,20]. The FAO-56 method uses two approaches to define this scaling factor, including a single crop coefficient and a dual crop coefficient [21,22]. Based on the water balance, many studies have investigated the crop coefficient for different crop types [23,24]. Some scholars modeled crop water requirements for citrus orchards in central India using single and dual crop coefficient approaches. Nonetheless, the crop coefficient under drip irrigation in shallow groundwater regions during different hydrological years has been barely discussed [25].
On the other hand, drip irrigation is the most water-saving irrigation technology in the world. The development of drip irrigation in the Hetao irrigation district can significantly improve the utilization rate of field water, reduce ineffective evaporation and deep leakage, and enhance the level of irrigation management. Plenty of studies have discussed soil water and salt movement rules, water requirements, planting modes of crops, and reasonable arrangements of capillary tubes under drip irrigation [26,27,28]. However, the crop coefficient under drip irrigation needs to be further studied, especially in the shallow groundwater regions.
The Hetao Irrigation district is a typical arid area with shallow groundwater, of which the irrigation water is supplied by the Yellow River. Irrigation and groundwater contribution are very important components for determining a reasonable irrigation schedule. Precipitation frequency will affect irrigation and groundwater directly, and drip irrigation is widely adopted as a water-saving irrigation measure in the Hetao irrigation district. Therefore, for studying the crop coefficient under drip irrigation in different hydrological years, the Hetao irrigation district was chosen as the study area. The reference crop evapotranspiration is less affected by rainfall, but the actual crop evapotranspiration is obviously affected by rainfall through the water balance method. The crop coefficient is obtained by dividing actual crop evapotranspiration by reference crop evapotranspiration. Then, the crop coefficient will be influenced by rainfall in different hydrological years.
Based on the field experiments of typical crops under the condition of a water-saving irrigation system in the Hetao irrigation district, the main objectives of this paper are as follows: (1) to calculate the groundwater recharge to soil water in different hydrological years under drip irrigation; (2) to obtain the crop evapotranspiration and field water balance in different hydrological years under drip irrigation; and (3) to determine the crop coefficient of sunflower in different hydrological years under drip irrigation. The research will provide a theoretical basis for formulating a reasonable water-saving schedule in shallow groundwater regions, increasing water use efficiency, and improving the field water environment.
2. Materials and Methods
2.1. Study Area
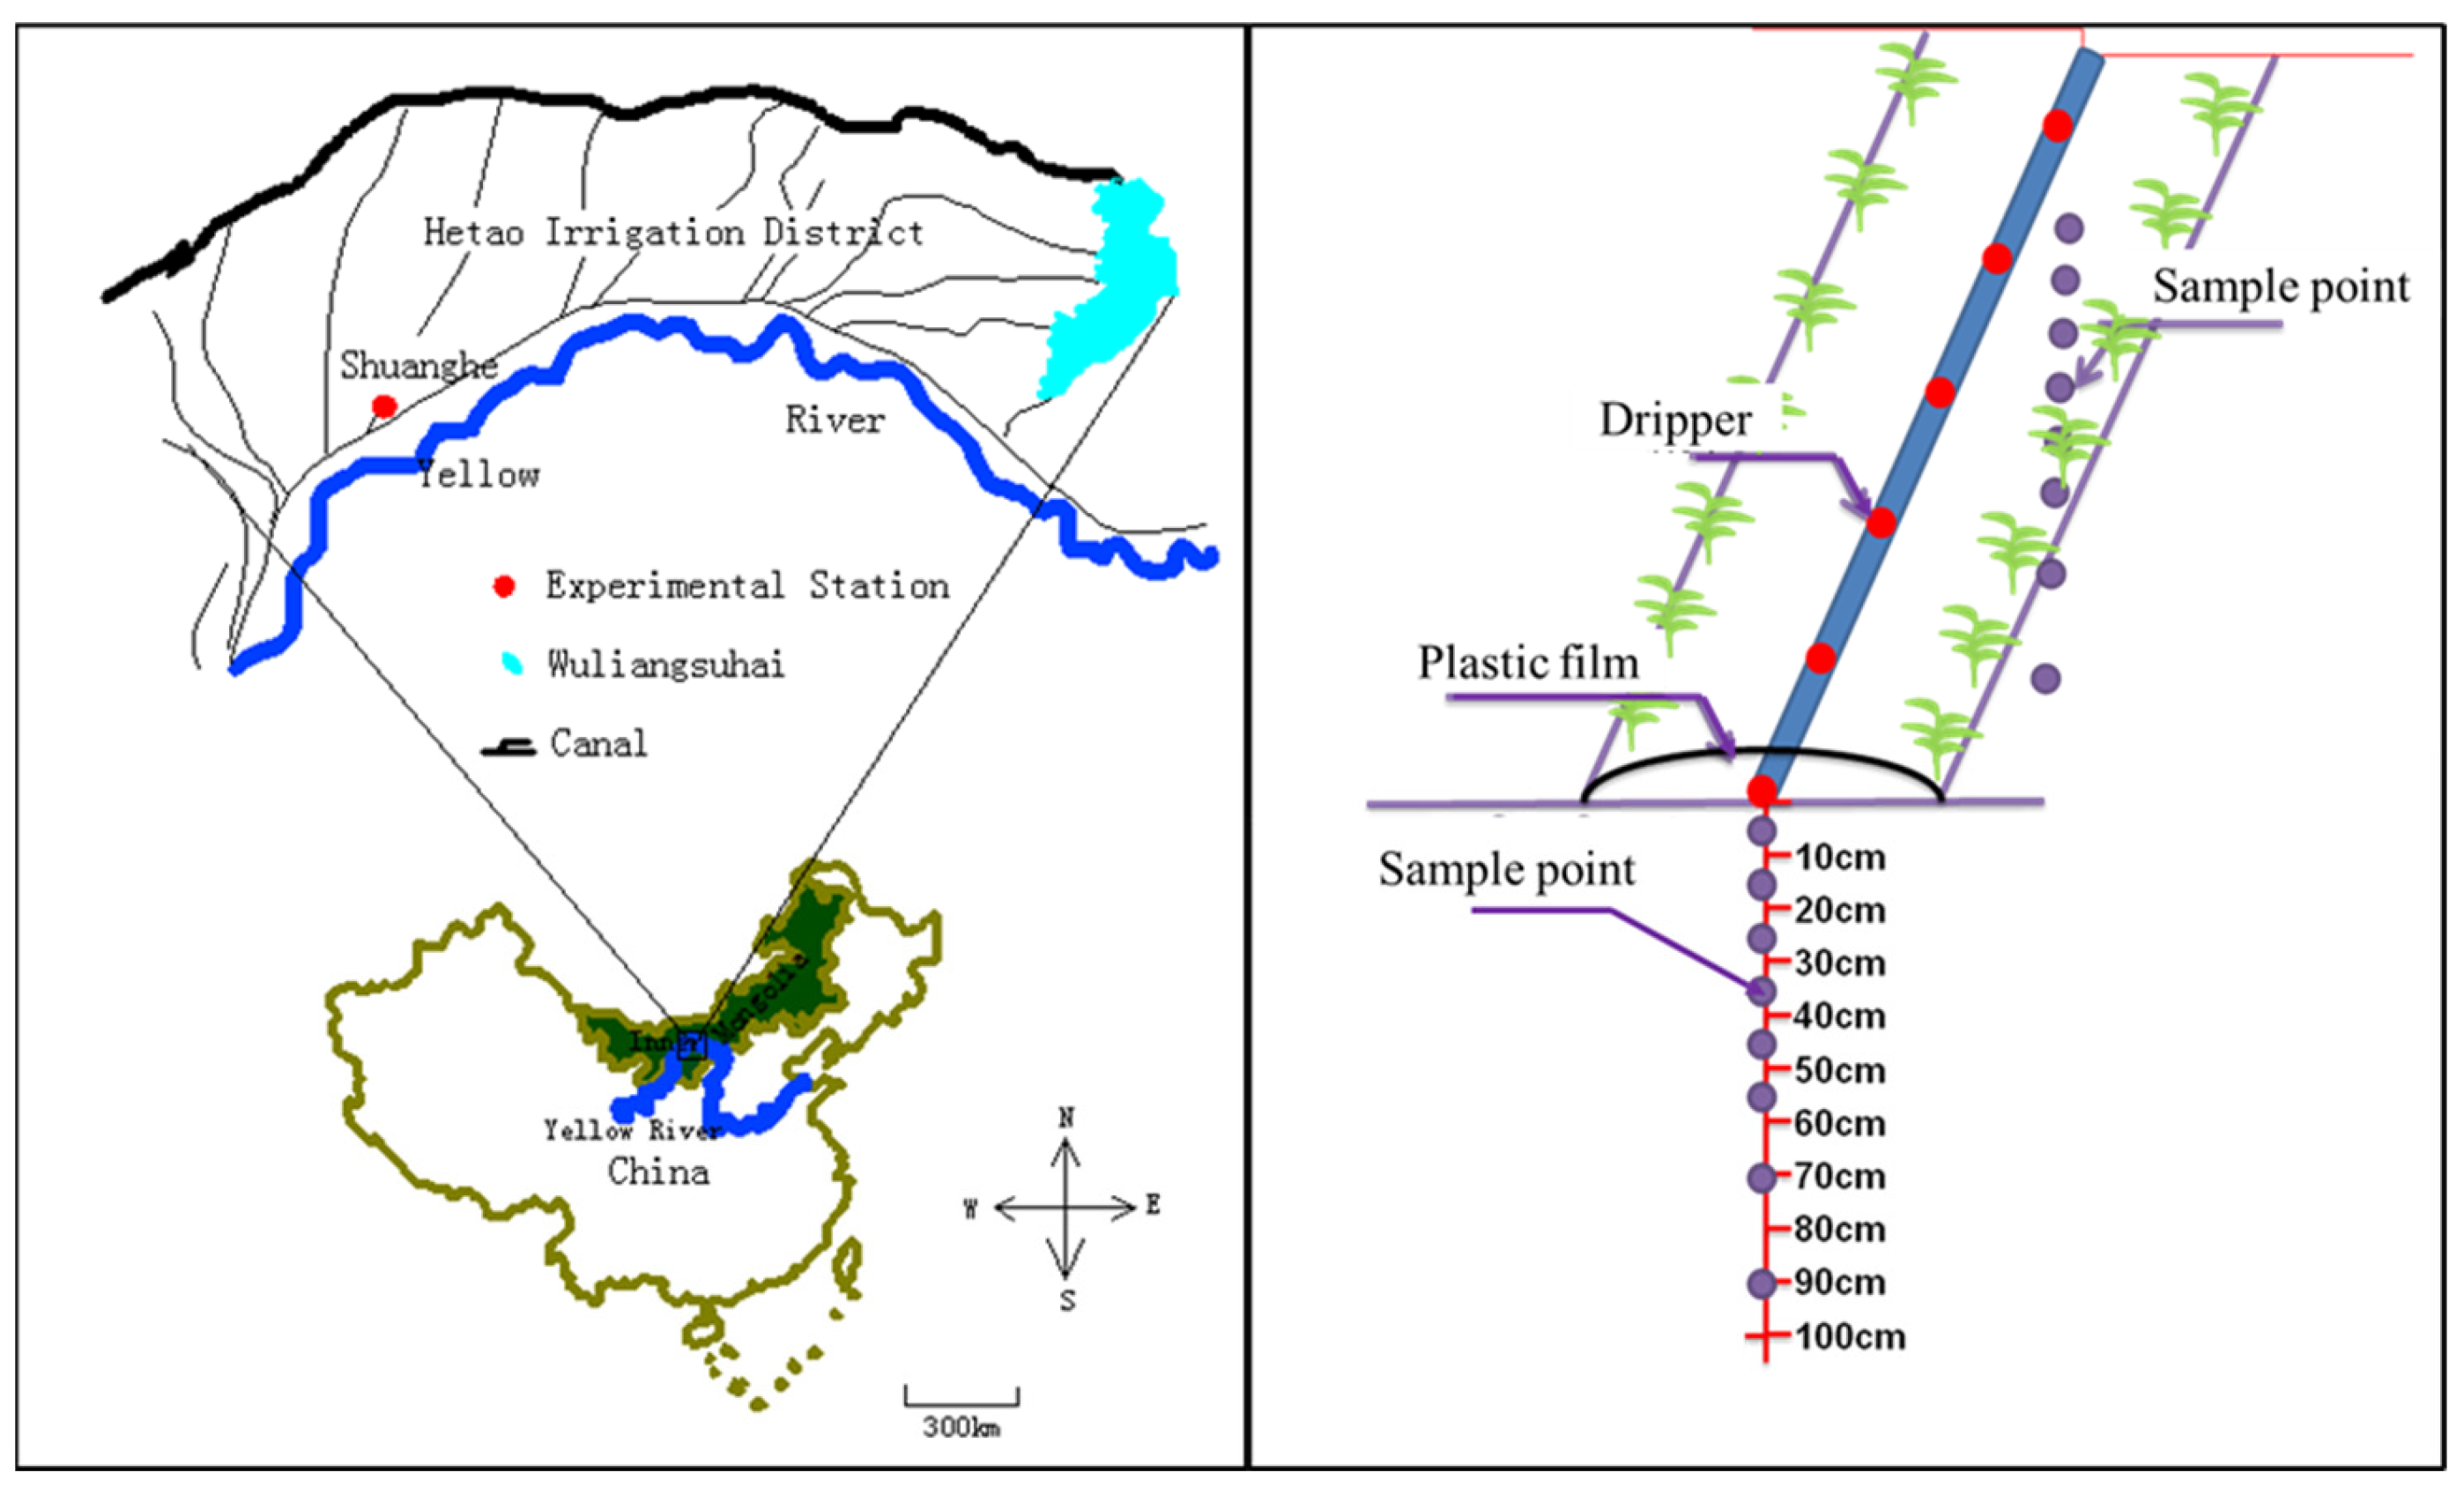
The study area was located in Shuanghe town (107°18′ E and 40°41′ N), Linhe district, Hetao irrigation district, Inner Mongolia, at an altitude between 1041–1043 m. Located in the hinterland of the Hetao Plain, Linhe was above the bend of the Yellow River, facing the Ordos Plateau in the south, the Yin Mountain in the north, and the Wulate Grassland in the east (Figure 1). The district was characterized by a typical arid and semi-arid continental climate. Its mean annual rainfall was 136–222 mm/year, and potential evaporation was 1940–2400 mm/year. Winters were cold with minimal snow cover, while summers were hot. The soil started to freeze around the middle of November. The average temperature was 6.8 °C, with large temperature differences between day and night and a long sunshine duration. The surface began to thaw in March, and the soil fully thawed out at the end of May with a frost—free period of about 130 days. Light, heat, water, and frost—free periods appeared at the same time, which was suitable for crop and grass growth. The Yellow River in the south of the Hetao irrigation district was the main source of irrigation water. There were 10 underground water observation wells in this area which could fully reflect the dynamic underground changes via various irrigation methods.
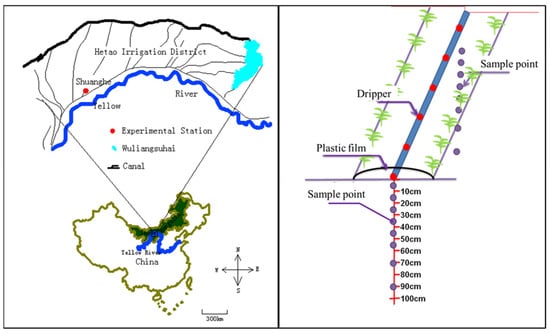
Figure 1.
Map of the study area and experimental observation. The left image shows the location of the research area. The red dot refers to the experimental station, the blue area refers to the Wuliangsuhai, and the fold lines refer to the canals. The right image shows the relative positions of the dripper, plastic film, and sample point location. The soil is divided into eight layers for sampling, including 0–10 cm, 10–20 cm, 20–30 cm, 30–40 cm, 40–50 cm, 50–60 cm, 60–80 cm, and 80–100 cm, respectively.
2.2. Experiment
2.2.1. Experimental Materials
According to the soil structure, the 0~100 cm soil layer was divided into three sub-layers. Through air-drying, rolling, and screening using a 2 mm sieve, the soil bulk densities of 0–60 cm, 60–70 cm, and 70–100 mm are 1.39, 1.54, and 1.43 g/cm3.
Drip irrigation was conducted through local groundwater, with a salinity of 1.007 g/L. The drip irrigation belt used in the experiment was the internal disc type produced by the Dayu Water-Saving Company, with a drip head spacing of 300 mm, a drip head flow rate of 1.68 L/h, and a pipe diameter of 16 mm. The tested crops were sunflowers named 9009. The planting row spacing of sunflowers was 60 cm, and the plant spacing was 41–43 cm with a density between 39,000–40,500 plants/ha. The plastic films were agricultural white plastic films with a width of 70 cm and a thickness of 0.01 mm. The planting mode of one film and two rows was adopted (Figure 1).
2.2.2. Experimental Design
Experiments were conducted in 2012, 2013, and 2014. The irrigation amounts varied in different hydrological years under the same matric potential (−20 kpa). In a high flow year, the irrigation amount was twice smaller (45 mm) than that in a low flow year, and once smaller (22.5 mm) than that in a normal flow year. Under the same soil matrix potential, the climate and rainfall in different hydrological years would have a great impact on the irrigation amount of the same crop at the same growth stage. The irrigation amounts of sunflowers during the growth periods in 2012, 2013, and 2014 were 195 mm, 219 mm, and 244 mm, respectively.
In this paper, fertilizer utilization was determined based on the existing research results and the traditional fertilization system in the Hetao irrigation area of Inner Mongolia. Accordingly, the fertilization system of drip irrigation under sunflower films was adopted as follows: base fertilizer was 34.2 kg/ha nitrogen (N) and 91.2 kg/ha phosphorus (P), followed by 89.25 kg/ha N and 66.75 kg/ha potassium (K).
2.3. Measurements
2.3.1. Soil Physical and Chemical Properties
Before sowing, undisturbed soil and soil samples were taken using soil drilling from the 0–100 cm section in 8 layers (0–10 cm, 10–20 cm, 20–30 cm, 30–40 cm, 40–50 cm, 50–60 cm, 60–80 cm, and 80–100 cm) to measure soil moisture content and soil bulk density.
During the period of crop growth, the soil moisture of each 10 cm layer in the 0–100 cm soil was measured with three replications once every 5 days with a Diviner 2000-TDR Moisture Monitor (TRIME-PICO-IPH manufactured in Germany) and was measured additionally before and after rainfall and irrigation. After harvesting, soil samples were taken from soil layers of 0–10 cm, 10–20 cm, 20–30 cm, 30–40 cm, 40–60 cm, 60–80 cm, and 80–100 cm below the drip head to measure soil moisture (Figure 1). The TDR data were calibrated by taking soil samples determined gravimetrically by oven drying at 105 °C for ten hours.
2.3.2. Meteorological Data and Groundwater
The meteorological weather station (HOBO U30 maded by onset company, purchasing the Ecotech Ecological Technology, Ltd., Beijing, China) on the Jiuzhuang experimental site collected the precipitation, wind speed, temperature, and humidity in 2012, 2013, and 2014. The number of sunshine hours was obtained from the China Meteorological Data Sharing Service System.
The groundwater depth for ten wells was monitored every five days manually from 15 May to 15 September in 2012, 2013, and 2014. Groundwater depth during the measurement period ranged from 1.6 m at the end of June 2012 to 3.9 m at the beginning of June 2013.
2.3.3. Crop Growth
The sunflowers were sowed and harvested on 20 June and 10 October 2012; 4 June and 5 October 2013, and 9 June and 1 October 2014.
In each plot, 3 representative plants were selected to measure plant height, leaf number, and leaf area at different growth stages.
After maturing, 3 representative plants were selected in each plot and harvested separately. Then, the samples were dried and threshed to calculate 100 grain weight, seed setting rate, and crop yield.
2.4. Methods
2.4.1. Determination of Hydrological Year
To study the crop coefficient of sunflowers under different hydrological year types, the statistical analysis of daily rainfall data from the China Meteorological Network (http://data.cma.cn/site/index.html, accessed on 5 June 2015) in Linhe Station, Inner Mongolia from 1959 to 2014 is carried out. P-III type frequency distribution curve was used to fit the rainfall corresponding to the growth period of the sunflowers. Three rainfall frequencies (P = 75%, P = 50%, and P = 25%) was selected. Using the typical year method, the rainfall corresponding to years with similar rainfall values was determined.
2.4.2. Reference Crop Evapotranspiration
The Penman-Monteith formula [22], which considered the influence of various meteorological factors on ET0, was a unified, standard mechanistic formula for calculating ET0. It was widely used worldwide. The calculation formula is shown as follows:
where ET0 was reference crop evapotranspiration, mm/day; Rn was net radiation on the surface of the crop canopy, MJ/m2/day; G was soil heat flux, MJ/m2/day; T is average daily temperature at 2 m altitude, °C; u2 was average daily wind speed at 2 m altitude, m/s; es was saturated water vapor pressure, kPa; ea was actual water vapor pressure, kPa; es − ea was pressure difference of saturated water vapor, kPa; Δ was the slope of saturated water vapor pressure and temperature curve, namely the slope of water vapor pressure curve, kPa/°C; and was hygrometer constant, kPa/°C.
2.4.3. Actual Crop Evapotranspiration
The water balance for a control volume in the vadose zone for a period Δt was calculated using two moisture content measurements [29].
where ETc was the daily evapotranspiration from the soil and the crop (mm/day), Pe was the effective precipitation (mm/day), I was the irrigation amount (mm/day), G was the groundwater recharge (mm/day) and ΔW was the measured change in soil water storage in mm over a period of days. was the soil water content in t + ∆t day and was the soil water content in t day (mm). Because the quota of drip irrigation is small, the wetting front is 30–40 cm after testing. Therefore, the planned wetting layer is 40 cm to calculate the soil water balance.
It was generally believed that effective rainfall referred to the amount of water in the total rainfall that could be stored in the root layer of the crop to meet the transpiration needs of the crop, so it did not include surface runoff and the amount of water leaking below the absorbent layer of the crop root zone. The effective rainfall during the crop growth period was determined by statistical analysis and the empirical method [30]. The calculation formula is shown as follows:
where Pe was effective rainfall, mm; P was rainfall, mm.
At present, most empirical formulas for calculating groundwater reported that groundwater recharge was related to groundwater depth, phreatic evaporation, crop type, and soil texture. Based on the study results and comparing all kinds of empirical formulas, this paper calculated the groundwater recharge using the method proposed by Li et al. [31], where the soil texture was similar to that in the experimental area. The formula was as follows:
where G was the groundwater contribution, mm; ET was the water requirements during the same period, mm, which was calculated by reference crop evapotranspiration multiplying crop coefficient cited by Dai [32]. The proposed Kc in the initial stage, crop development stage, mid-season stage, and late-season stage were 0.695, 0.751, 0.804, and 0.35, respectively. H was the groundwater depth, m.
2.4.4. Crop Coefficient
Crop coefficient (Kc) was an important parameter for the calculation of crop water demand. It reflected the biological characteristics of the crop itself, the level of yield, and the effect of soil fertility and farming conditions on crop water demand. It was calculated as follows [33,34]:
2.4.5. Data Analysis
The software including EXCEL and Origin 2019 was used to analyze the data. Statistical analysis was adopted for data collation and analysis.
3. Results and Discussions
3.1. Analysis of Hydrological Years and Representative Evaluation in Study Area
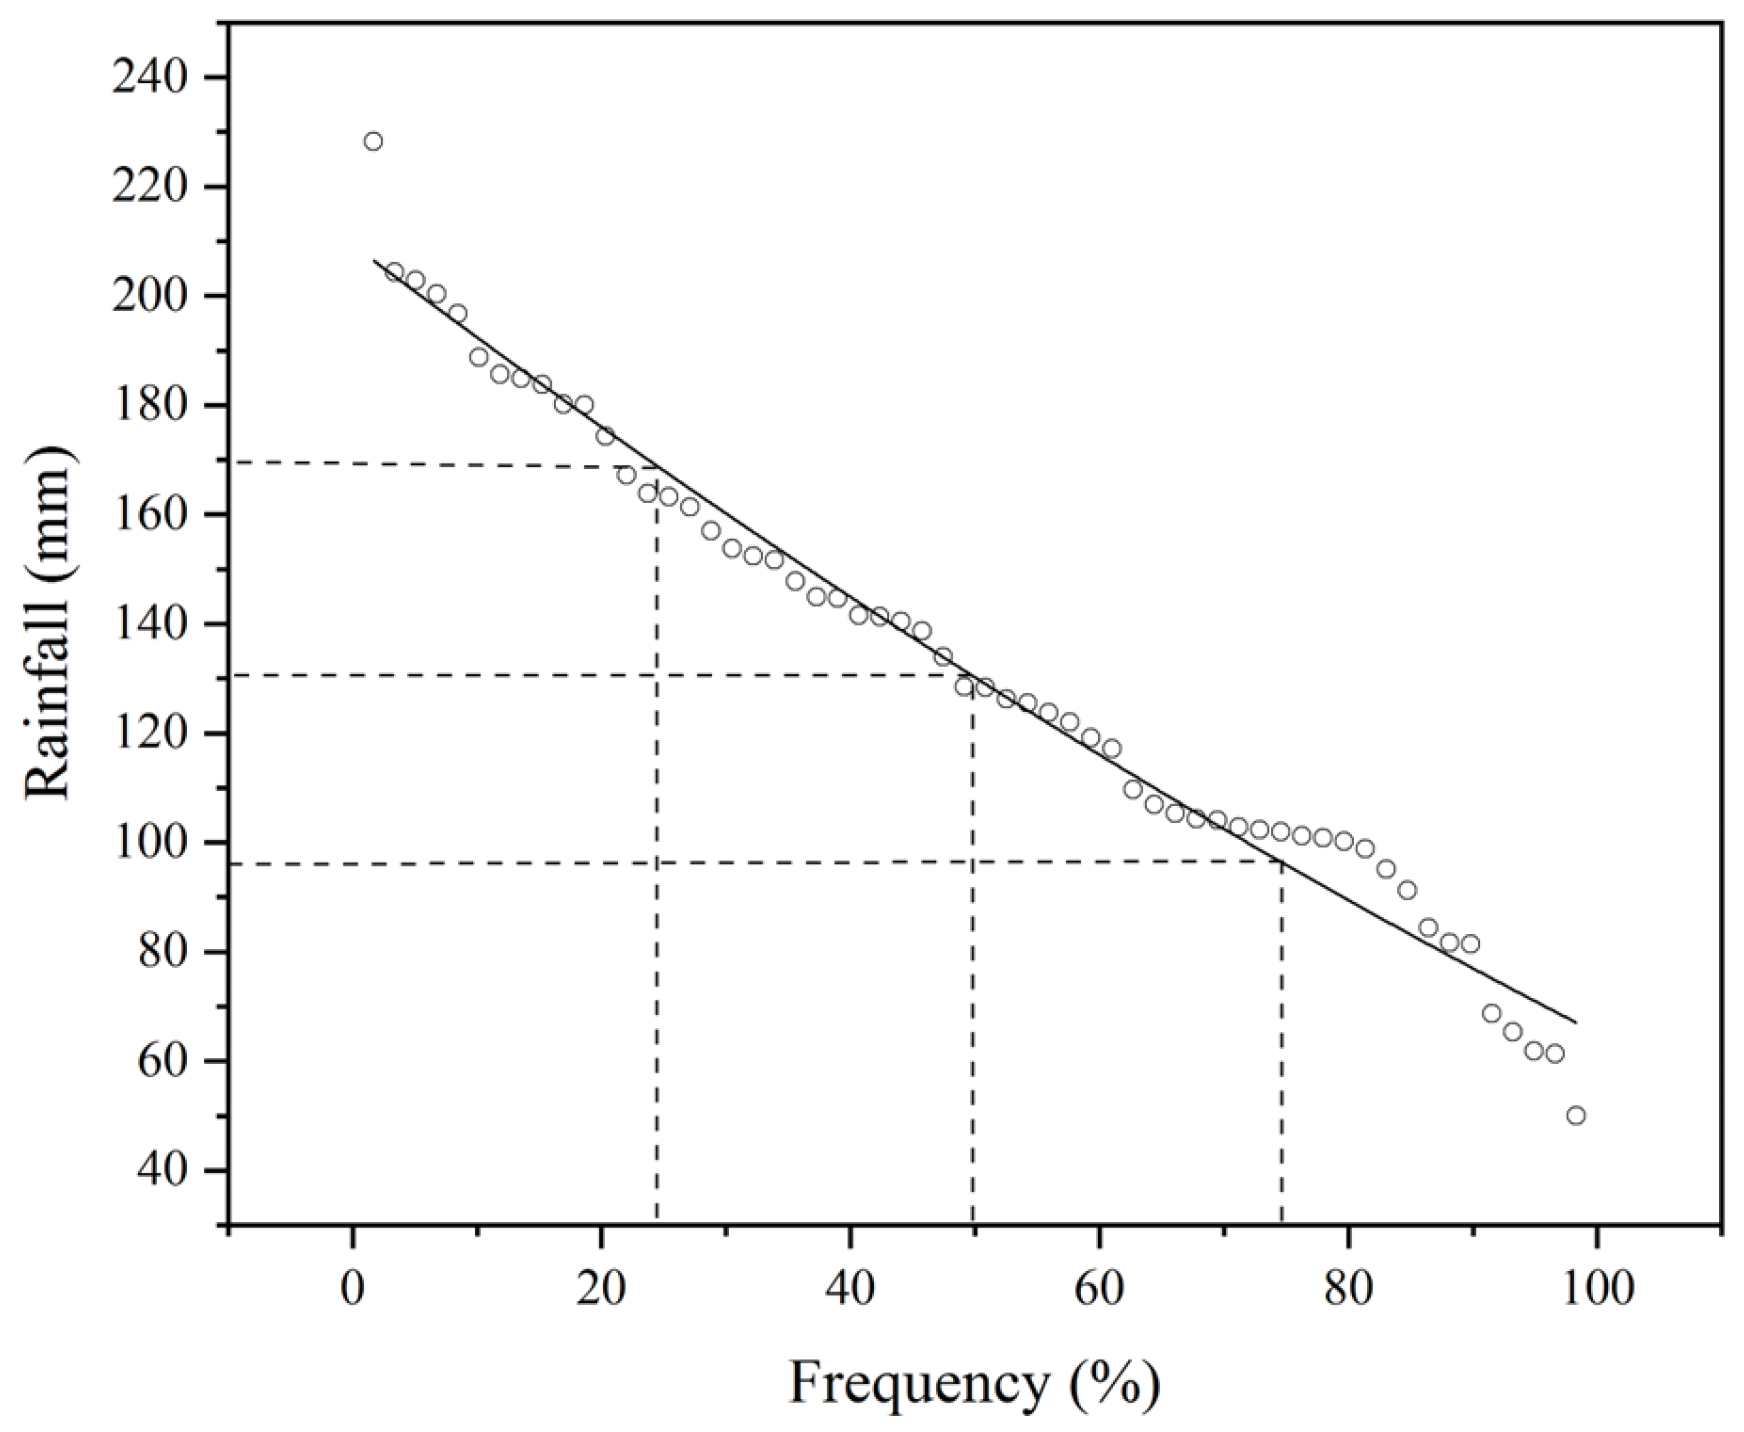
Irrigation, precipitation, and groundwater contribution are of great significance for crop evapotranspiration and crop growing. In order to study crop coefficients and crop water consumption under different rainfall conditions, the hydrological years need to be determined using the P-III type frequency distribution curve. The hydrological years from 1957 to 2014 in the Linhe area were calculated by the frequency analysis method, and the calculated results are listed in Figure 2.
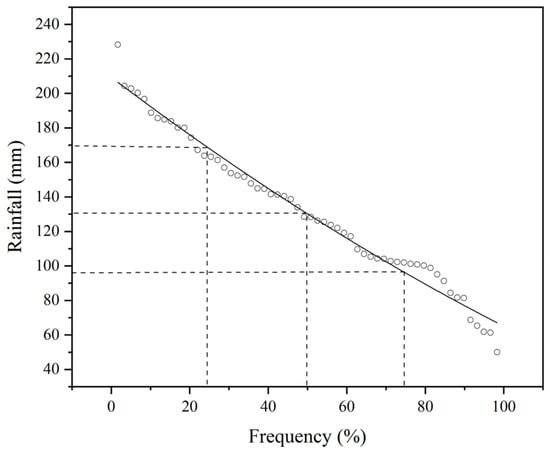
Figure 2.
Rainfall amounts and frequencies in Linhe district.
The results showed that the rainfall in the study area changed greatly from 1957 to 2014. The year with abundant water appeared in 1990, with a frequency of 25% and a rainfall of 163.2 mm. The maximum rainfall occurred in 1967, with a frequency of 1.69% and a rainfall of 228.2 mm, which was 65 mm higher than that in the high flow year with a frequency of 25%. In 2012, the rainfall in the study area reached 152.4 mm with a frequency of 32%, which was 11 mm lower than that in the high flow year. The recurrence period was 3.8 years, which could be regarded as a high-flow year. The year with normal water appeared in 1985, with a frequency of 50% and a rainfall of 128.3 mm. In 2013, the rainfall in the study area was 106.9 mm, with a frequency of 64%, which was 22 mm lower than that in the normal flow year. The recurrence period was 3.4 years, which could be regarded as a normal flow year. In 1963, the rainfall reached 74.58 mm with a frequency of 75%. The special low-flow year was 2011 with a rainfall of 50 mm. In 2014, the rainfall was 65.4 mm and the frequency was 93%, which was 9.18 mm lower than that in the 75% low-flow year. So, 2014 could be regarded as a low-flow year with a recurrence period of 16 years. The frequency curve is shown in Figure 2.
Judging from the above analysis, the average rainfall for many years was 132.5 mm in the study area. 2012, 2013, and 2014 were regarded as high, normal, and low flow years, respectively. The research in the above three years could represent the results in various hydrological years in the study area.
3.2. Crop Water Use for Drip Irrigation under Different Hydrological Annual Films
3.2.1. Reference Crop Evapotranspiration in Different Hydrological Years
The Penman-Monteith formula [22], which considered the influence of various meteorological factors on ET0 synthetically, was a unified, standard mechanistic formula for calculating ET0. After decades of theoretical research and practical application, there was no need to carry out regional rate determination, nor was there a need to change any parameters to apply to China and other regions of the world. In fact, the formula had a reliable physical basis and was widely used in many countries and regions of the world [5].
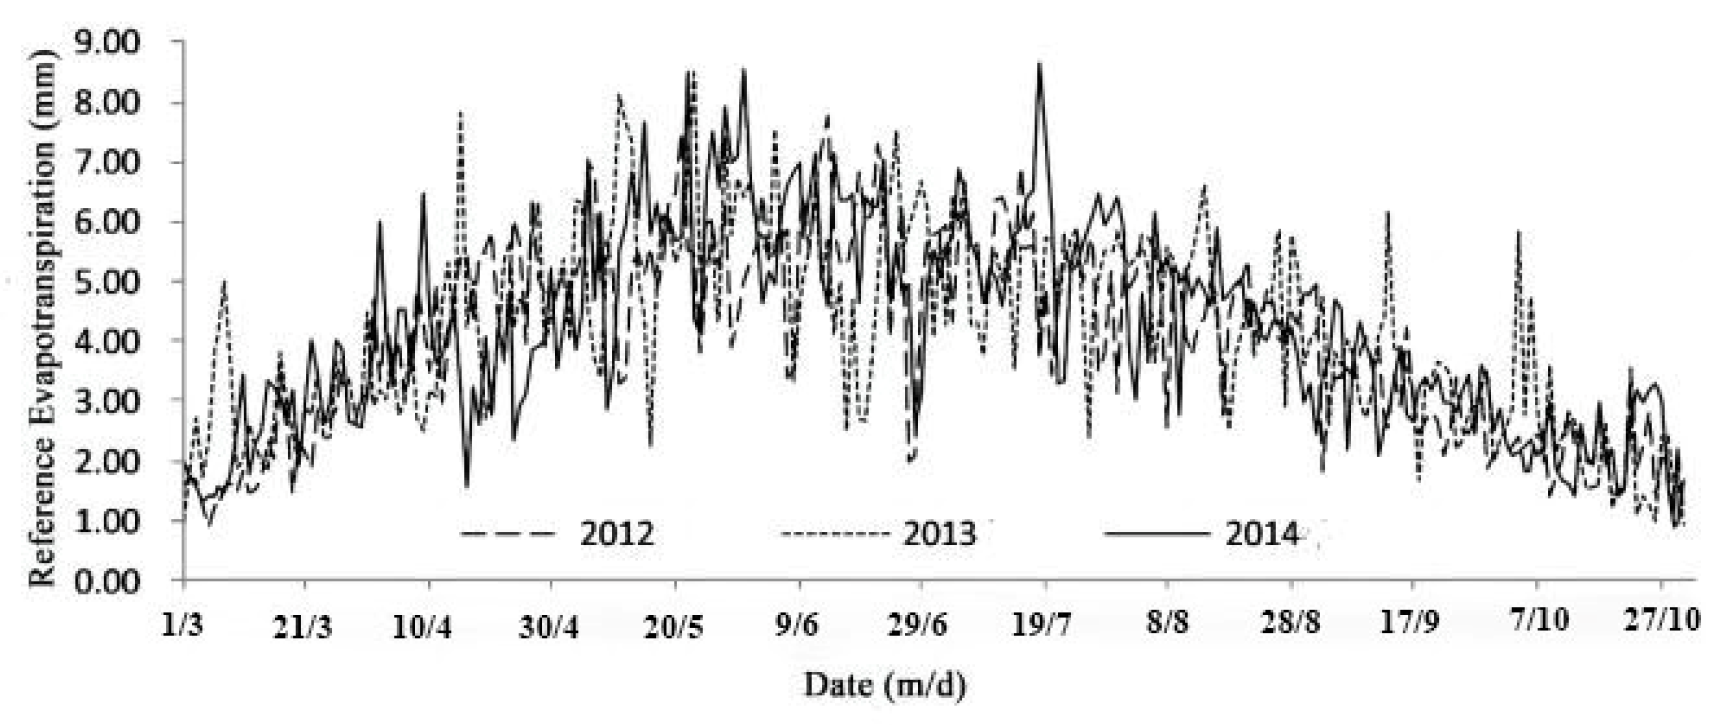
The daily ET0 of the study area was calculated, with the calculated results shown in Figure 3. With crops growing, the daily ET0 increased first and then decreased as the maximum daily temperature decreased. The ET0 in July increased by 139.0%, 78.5%, and 120.0% than that on January 2012, 2013, and 2014, while the ET0 in October decreased by 61%, 56.7%, and 63.7% compared to that in July 2012, 2013, and 2014, respectively.
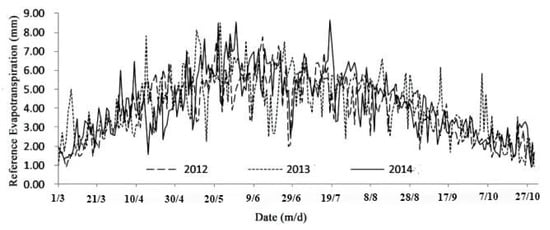
Figure 3.
Reference evapotranspiration during the crop growth period in 2012, 2013, and 2014.
Judging from the above calculation, the change in reference crop evapotranspiration during the whole year was obvious, but the difference in reference crop evapotranspiration in different hydrological years was small. The ET0 in the high-flow year was slightly higher than that in the normal and dry years. During the whole year, the ET0 in 2012, 2013, and 2014 were 1086.1, 1116.1, and 1128 mm, respectively, while the ET0 from May to September were 722.2, 721.8, and 758.9 mm, respectively. This was because ET0 was mainly affected by wind speed, temperature, and humidity, while hydrology tear was determined by precipitation.
3.2.2. Groundwater Changes and Groundwater Recharge during Crop Growth Period
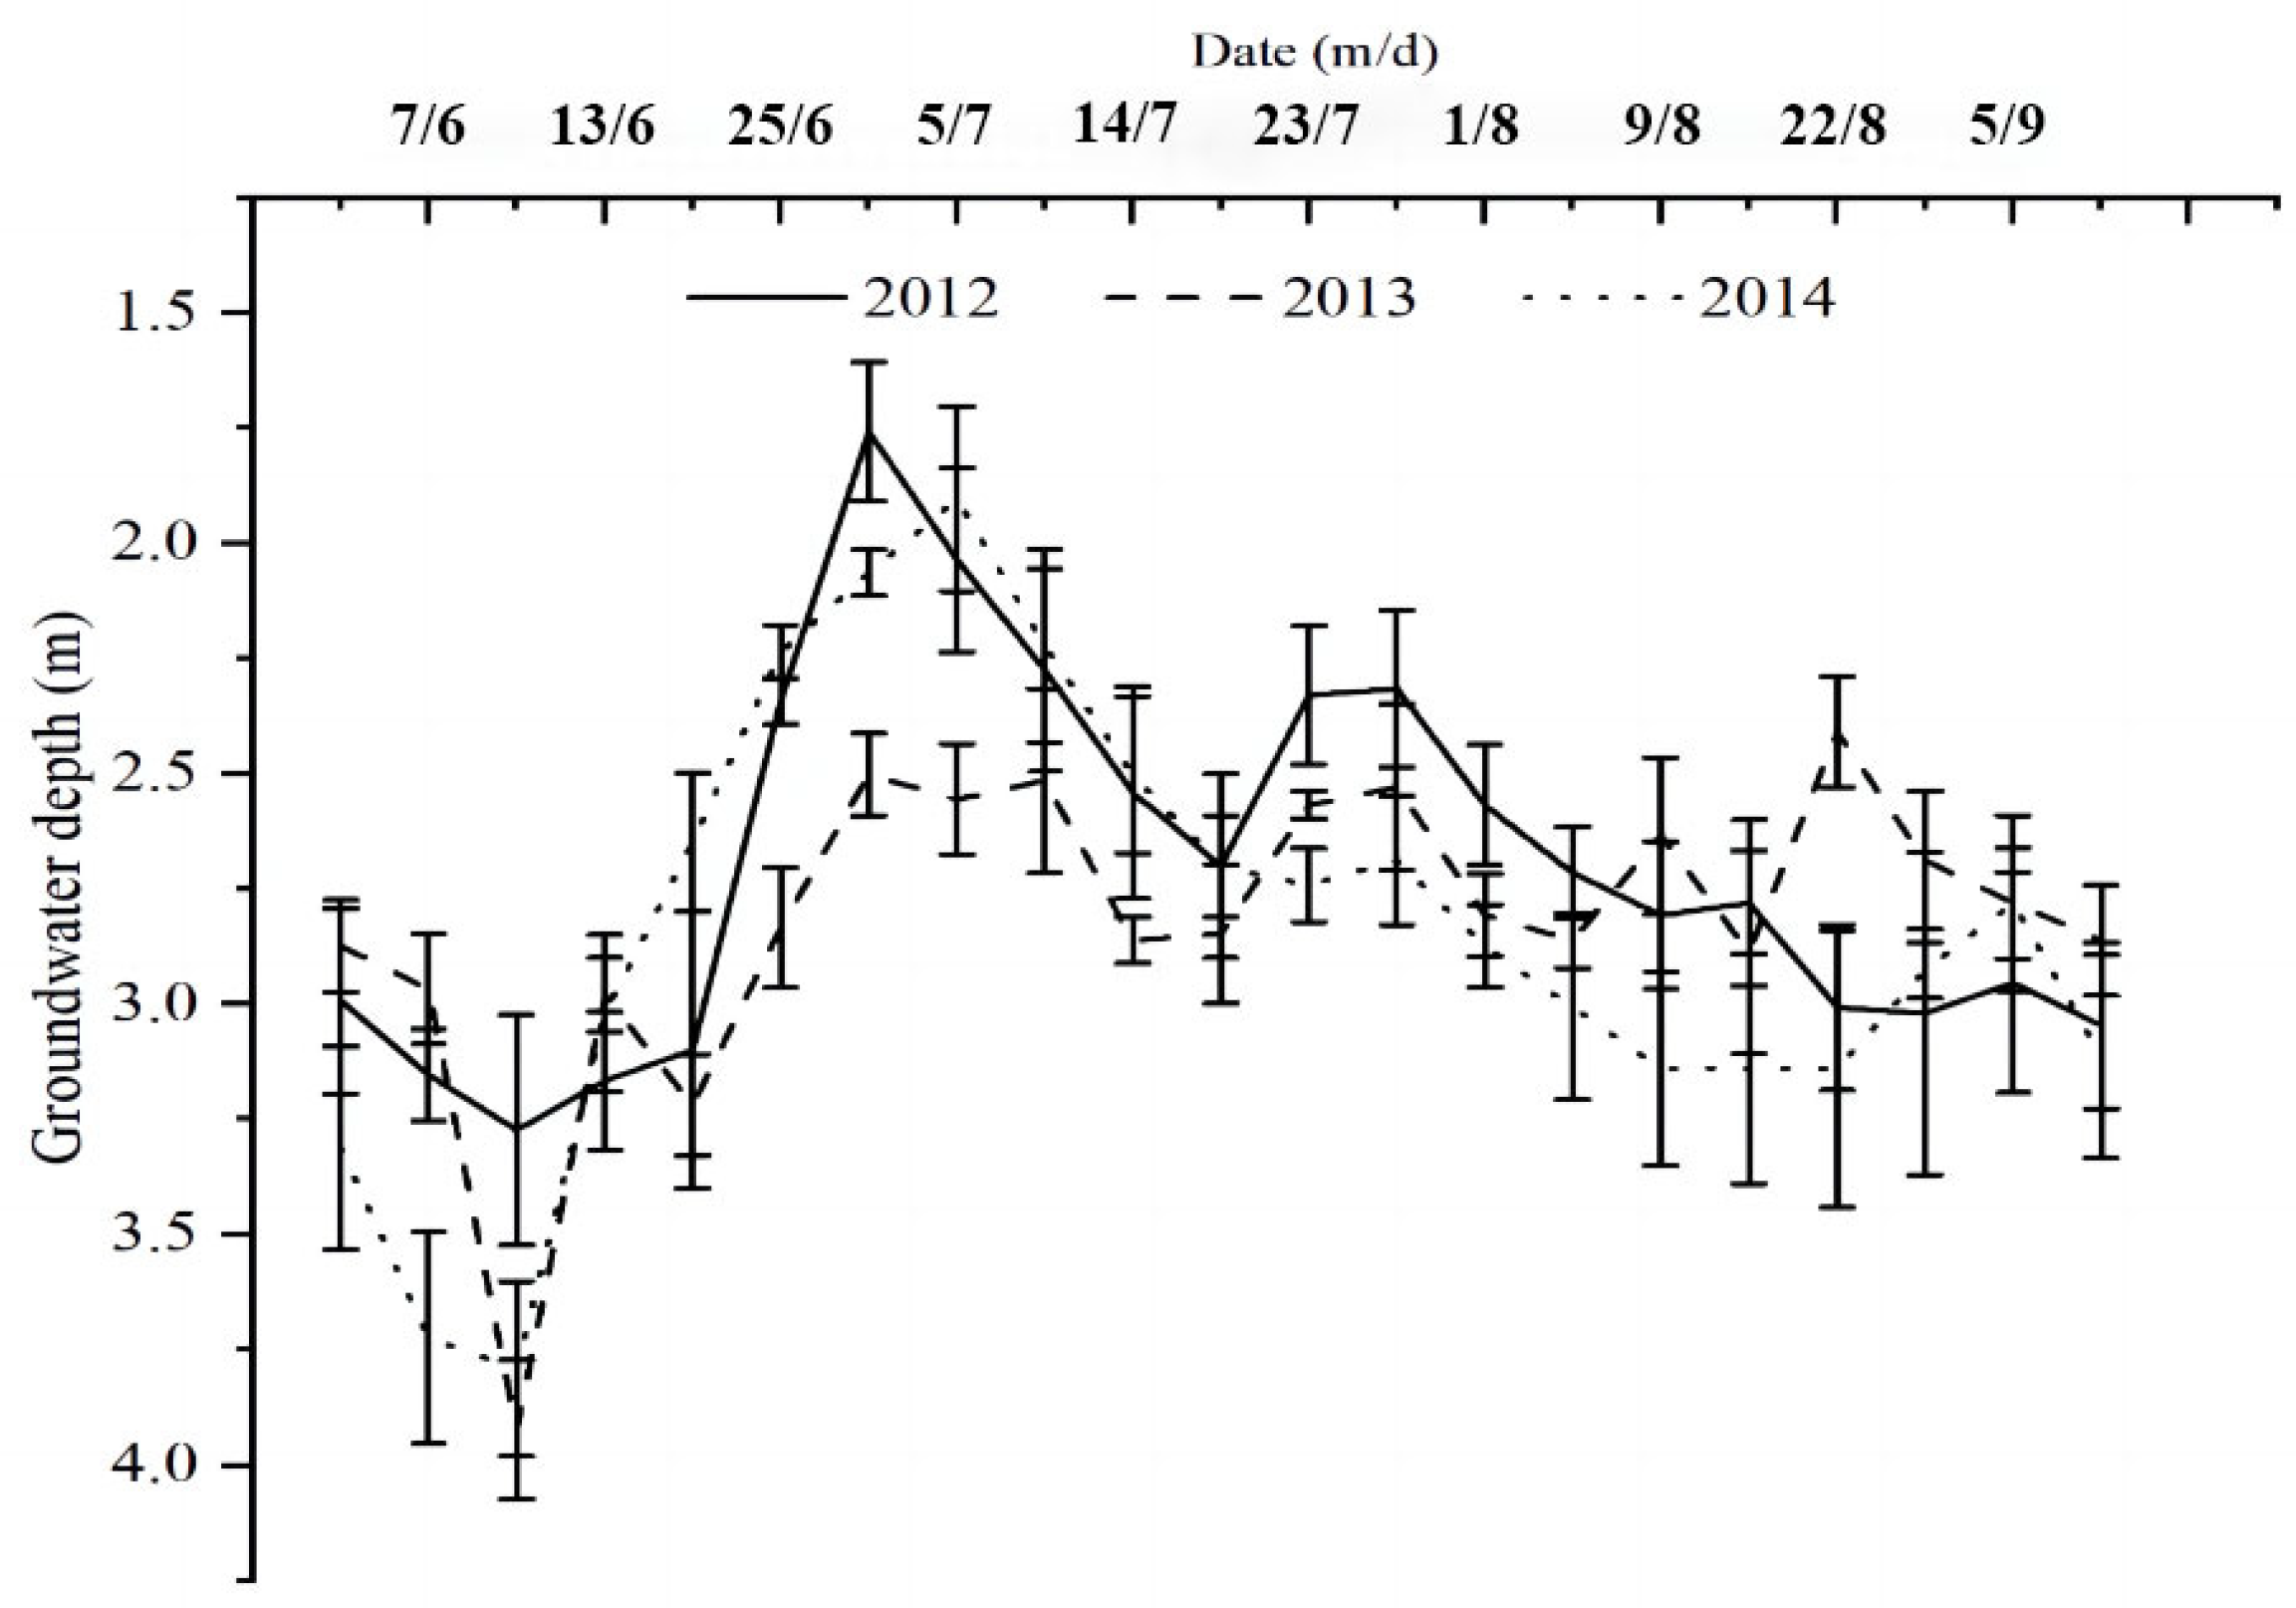
Groundwater changes during the growth period in the study area from 2012 to 2014 were indicated in Figure 4. It could be seen that the overall variation of groundwater in the three years was similar and that the variation trend was affected by irrigation or rainfall. The minimum and maximum groundwater depth in 2012, 2013, and 2014 were 1.74 m on 29 June, 3.26 m on 9 June; 1.74 m on 21 August, 3.94 m on 9 June, and 1.9 m on 5 July, 3.78 m on 9 June, respectively. The maximum groundwater depth appeared in early June, given that a lot of spring irrigation in well-irrigated areas led to deeper groundwater in the heading stages of wheat and maize. Then, the groundwater became deeper gradually during the crop growth period with the average groundwater being shallower in the high-flow year than in the low-flow year.

Figure 4.
Groundwater changes during the crop growth period in the study area.
3.2.3. Groundwater Recharge
Because of surface evaporation and crop transpiration, shallow groundwater could continuously recharge a certain amount of soil water to meet the water absorption needs of crop roots. The amount of groundwater that recharged soil or the use of groundwater by crops actually referred to the evaporation of diving under the crop cover. This part of the water changed from groundwater, which could be used directly by crops to soil water which could be absorbed and utilized by crops, thus expanding the storage of soil water resources.
It could be inferred from Table 1 that the results based on the two calculation methods were similar to those of groundwater recharge, indicating that the selected formula was suitable for the calculation of groundwater recharge in this area. There were no notable differences between 2012 (high flow year) and 2013 (normal flow year). Through the above calculation, the groundwater recharge in the sunflower growth period in 2013 reached 66.75 mm, which was 24.14 mm higher than 42.61 mm in 2014, mainly as a result of the high groundwater level in the sunflower experimental plot and well-irrigated area in 2013. Similar to the conclusion by Gao et al. and Huo et al. [6,7], the contribution of groundwater recharge to crop water use could hardly be ignored in the shallow groundwater area.

Table 1.
Groundwater recharge of sunflowers in the growth period.
3.2.4. Calculation of Annual Crop Evapotranspiration by Water Balance Method
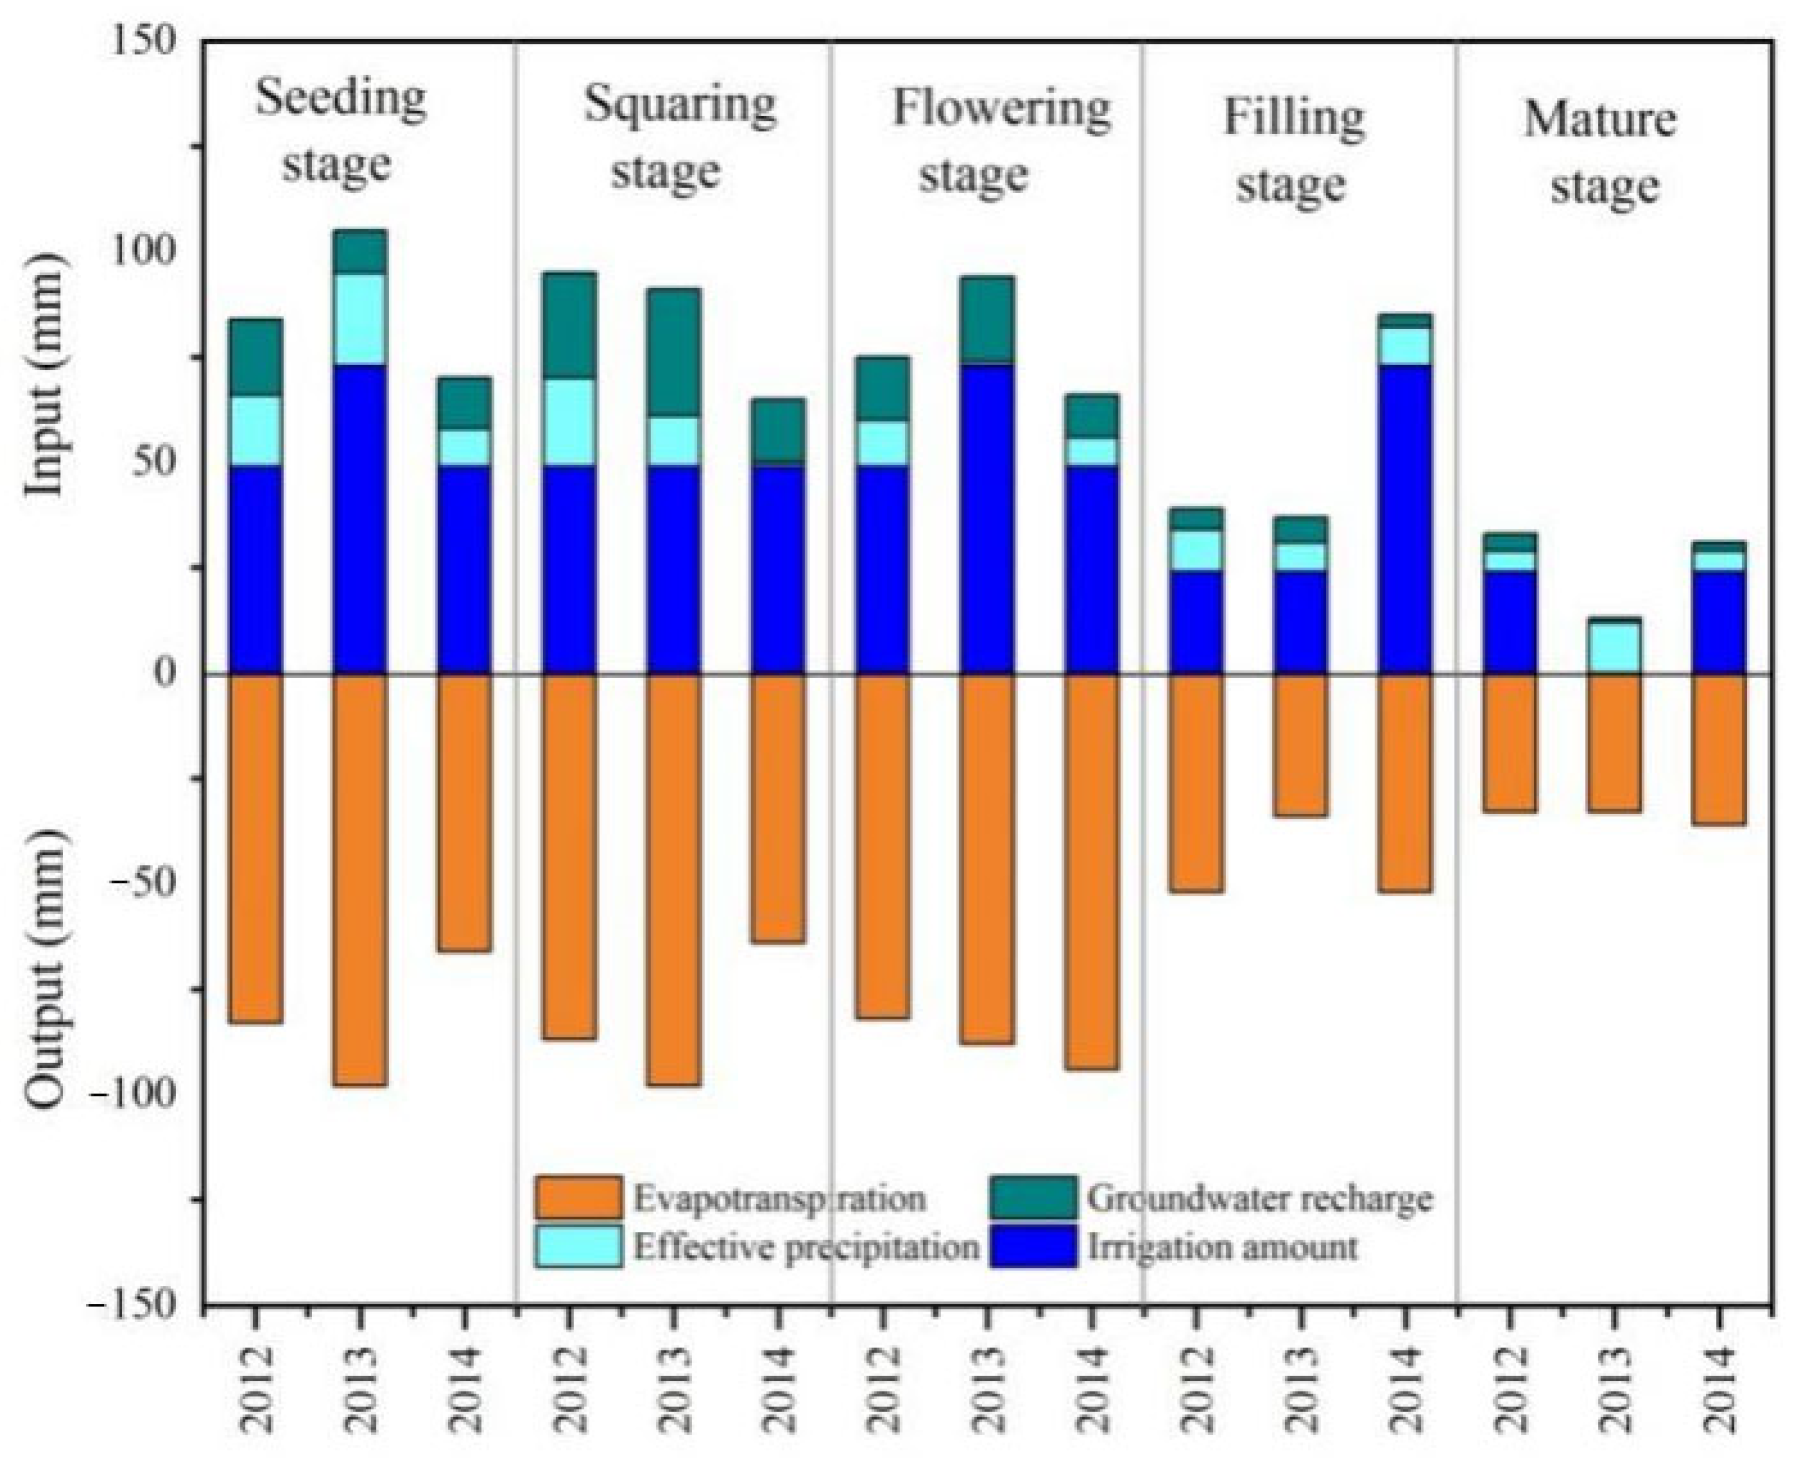
According to the experimental observation and analysis, drip irrigation during the crop growth period had no significant deep leakage or surface runoff. The water balance of the root zone at the growth stages in 2012, 2013, and 2014 are shown in Figure 5 and Table 2.
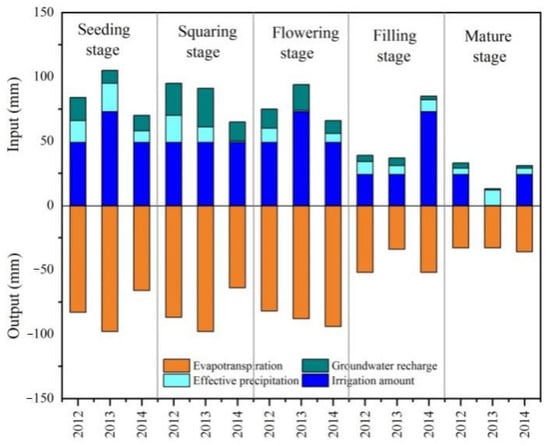
Figure 5.
Water balance of root zone at growth stages in 2012, 2013, and 2014.
Table 2.
Change of the moisture storage in the growth period of the sunflower.
The crop evapotranspiration varied during the growth periods in different hydrological years. For illustration, the ET of sunflowers in 2013 reached a maximum of 350 mm, while the ET in 2014 was 312 mm. The result was mainly connected with climate. When the climate conditions were suitable for crop growth, the ET was larger under the same conditions. Furthermore, the ET in 2013 was higher than that in 2012. Though 2012 was a high-flow year, its effective precipitation during the growth period was not significantly higher than that in 2013, and its irrigation amount was smaller. Moreover, during the last stage of crop development, the ET in 2014 was higher than that in 2012 and 2013, which was due to the fact that the irrigation in 2014 increased. In agreement with Gao et al. [35], the irrigation amount directly affected the ET. The crop evapotranspiration in the seeding stage, squaring stage, and flowering stage was higher, which also indicated that irrigation amount and groundwater recharge directly affected crop evapotranspiration.
3.3. Crop Coefficient in Different Hydrological Years
The crop coefficient integrated the effect of characteristics that distinguished a typical field crop from the grass reference, which had a constant appearance and a complete ground cover. Consequently, different crops would have varied Kc. In addition, the changing characteristics of the crop over the growing season also impacted the crop coefficient (Kc). Finally, as evaporation was an integrated part of crop evapotranspiration, conditions affecting soil evaporation would also have an effect on the Kc [36].
The calculation of the coefficient in different hydrological years is exhibited in Table 3. Reference evapotranspiration was obtained using the FAO 56 PM method, while actual evapotranspiration was determined by the water balance method. The crop coefficient was determined by actual evapotranspiration dividing reference evapotranspiration.
Table 3.
Crop coefficient of sunflowers in a growth period.
The results showed that the ET0 of sunflowers in 2012 was relatively small, which was largely because the planting time of sunflowers in 2012 was 15 days later than that in other years. After correction, the ET0 of sunflowers in different hydrological years was slightly different. It was shown that the sunflower coefficient increased first and decreased gradually with crop growth and that it was up to the maximum in the flowering stage, as described in the study by Allen et al. [22], which is similar to the results of Francisco et al. [16].
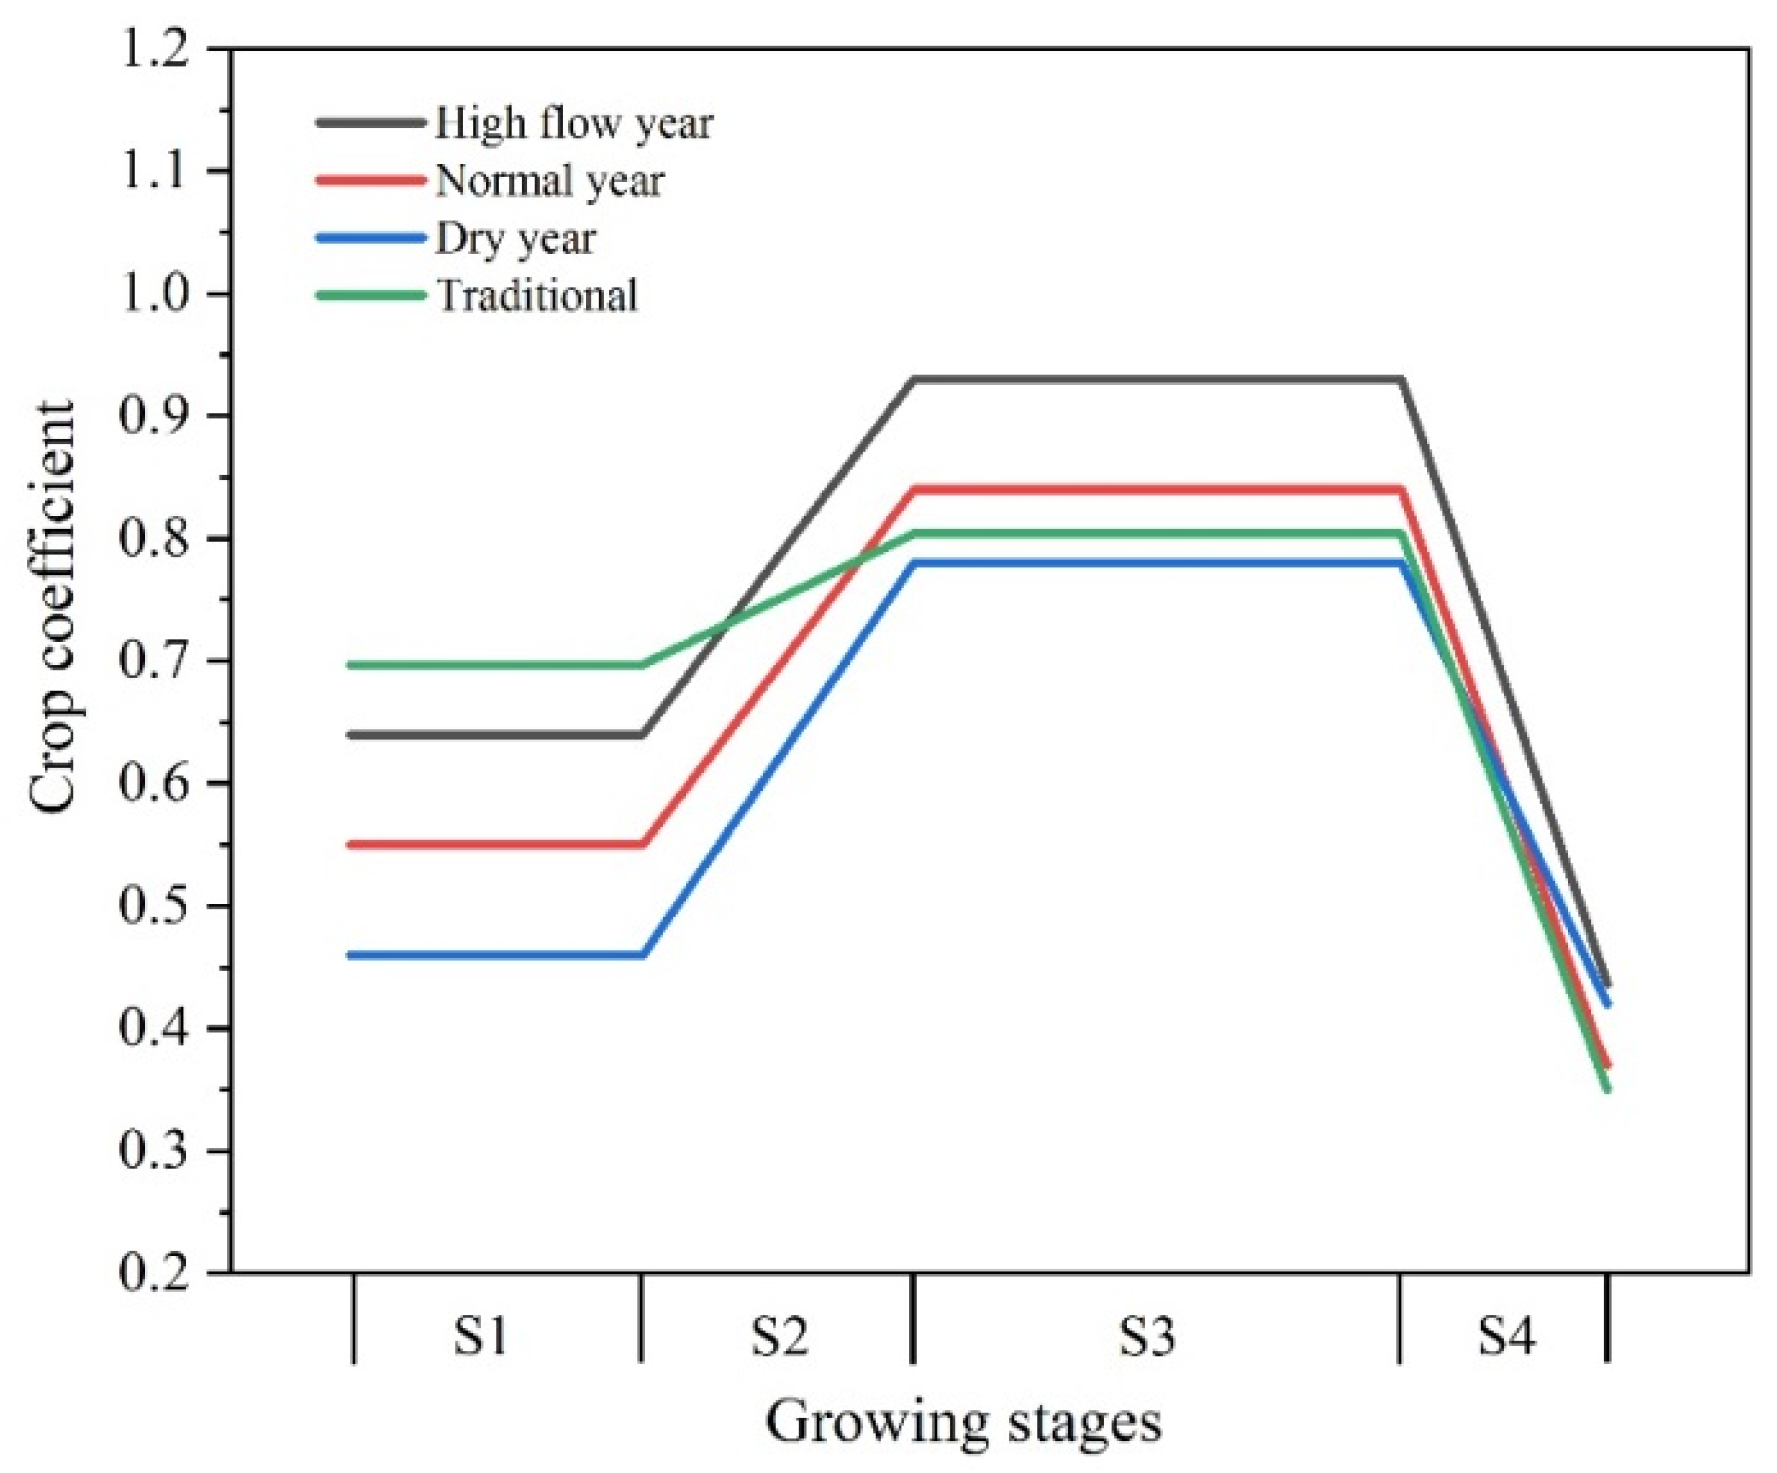
Based on Table 3 and Figure 6, it could be seen that the sunflower coefficient in the high flow year was the highest, and the coefficient in the normal year was higher by 0.1 than that in the low flow year. This could be attributed to the fact that the higher rainfall led to more soil water content and larger actual evapotranspiration in the normal flow year, while the increasing soil water content in the normal year was higher by 17 mm than that in the low flow year. Considering that the soil moisture content was tested according to the period of crop growth and did not have continuity, the crop coefficient was calculated at different growing periods. Based on calculated results, the crop coefficients were modified to obtain the crop coefficients of typical crops in different hydrological years under drip irrigation in the Hetao irrigation area, which are shown in Figure 6.
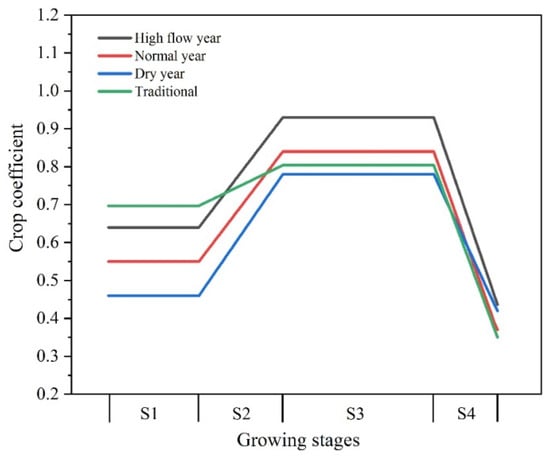
Figure 6.
Crop coefficients of sunflowers in each growth period in different hydrological years. S1, S2, S3, and S4 referred to the initial, crop development, and mid- and late-stages of sunflower growth.
The crop coefficient under drip irrigation was quite different from that under traditional surface irrigation [19]. In the initial stage of crop growth, the sunflower coefficient under drip irrigation under films was lower by 0.15 than that under traditional ground irrigation, since drip irrigation with film covering decreased the soil evaporation, which accounts for a large proportion of actual evapotranspiration in the initial stage of sunflower growth. Then the water use of sunflowers under surface irrigation in the early stage was lower than that under traditional ground irrigation. Similar to Jia [37], the crop evapotranspiration in the early stage under drip irrigation was smaller than that under surface irrigation. Consistent with the result of Amayreh et al., the average crop coefficient during most of the growth stages was below the adjusted FAO crop coefficient [38].
As Yang et al. revealed, in the rapid growth period and mid-growth period, large canopy coverage will become great [39]. The concentrated and large irrigation amount under surface irrigation caused a water deficit for crop growing, which resulted in lower evapotranspiration and a lower Kc. On the other hand, drip irrigation under films with high-frequency irrigation kept the soil wet and then the crop growth was not affected by water deficit. Then, the actual evapotranspiration of sunflowers under drip irrigation was slightly higher than that under surface irrigation [40].
In the mature stage, the average sunflower coefficients under drip irrigation and surface irrigation were 0.41 and 0.35, respectively. Generally, the irrigation was not carried out because sunflowers were prone to root rot caused by concentrated irrigation. The irrigation amount under drip irrigation under films was larger than that under surface irrigation, which led to lower evapotranspiration and coefficient under surface irrigation.
4. Conclusions
Based on the analysis of long-series precipitation data, hydrological years were determined and 2012, 2013, and 2014 were assumed to be high, normal, and low flow years, respectively. Furthermore, water evapotranspiration, groundwater recharge, and water balance in 2012, 2013, and 2014 were calculated and analyzed. Additionally, the crop coefficient was quantified using crop evapotranspiration dividing reference evapotranspiration obtained by the FAO-56 PM method.
Reference crop evapotranspiration varied with time during the whole year, but the difference in reference crop evapotranspiration among varied hydrological years was small. Due to the high groundwater level in the sunflower experimental plot and well-irrigated area in 2013, the groundwater recharge during the sunflower growth period in 2013 was 66.75 mm, which was higher than 42.61 mm in 2014. Using the water balance method, crop evapotranspiration was determined and the results showed that crop evapotranspiration in different hydrological years varied during the growth period.
It was found that the sunflower coefficient in the high flow year was the largest and larger by 0.1 than that in the normal flow year. In addition, the crop coefficient under drip irrigation with films greatly differed from that under traditional surface irrigation. In the early stage of crop growth, the coefficient of sunflowers under drip irrigation with films was lower than that under traditional ground irrigation. In the rapid growth period and mid-growth period, the concentrated and large irrigation amount under surface irrigation caused a water deficit for crop growing, which resulted in lower evapotranspiration and a lower Kc. In the future, simultaneous experiments of drip irrigation and surface irrigation are required so as to prove the difference in crop coefficients under varied irrigation methods.
Author Contributions
Conceived and designed study idea, X.G. and Z.Q.; Performed the experiments and data collection, P.T., B.D., Z.W. and Y.Y.; Analyzed the data, X.G., Z.Q. and W.Y.; Wrote the paper, X.G. and B.D. All authors have read and agreed to the published version of the manuscript.
Funding
This research was supported by project from Start-up Project for Bringing in High-level talent of Inner Mongolia Agricultural University (NDYB2019-6), Nature Science Foundation of Inner Mongolia (2022MS05047) and Higher Education Youth Science and Technology Talent Development Project of Inner Mongolia (NJYT23083).
Data Availability Statement
Data are contained within the article.
Acknowledgments
The authors would like to thank the editor and all the reviewers for their insightful comments and constructive suggestions.
Conflicts of Interest
The authors declare no conflict of interest.
References
- Khouri, N.; Shideed, K.; Kherallah, M. Food security: Perspectives from the Arab World. Food Secur. 2011, 3, 1–6. [Google Scholar] [CrossRef]
- Meng, Z.J.; Gao, Y.; Yu, Y.; Ren, X.M. Crisis of Water Resources on the Ulan Buh Desert Oases, Inner Mongolia, China-A case of study of Dengkou county. J. Integr. Agric. 2013, 12, 1409–1413. [Google Scholar] [CrossRef]
- Jamshidi, S.; Zand-Paras, S.; Kamgar-Haghighi, A.A.; Shahsavar, A.R.; Niyogi, D. Evapotranspiration, crop coefficient, and physiological responses of citrus trees in semi-arid climate conditions. Agric. Water Manag. 2020, 227, 105838. [Google Scholar] [CrossRef]
- Kahlown, M.A.; Ashraf, M. Effect of shallow groundwater table on crop water requirements and crop yields. Agric. Water Manag. 2005, 76, 24–35. [Google Scholar] [CrossRef]
- Liu, Y.; Luo, Y. A consolidated evaluation of the FAO-56 dual crop coefficient approach using the lysimeter data in the North China Plain. Agric. Water Manag. 2010, 97, 31–40. [Google Scholar] [CrossRef]
- Gao, X.Y.; Huo, Z.L.; Bai, Y.N.; Feng, S.Y.; Huang, G.H.; Shi, H.B.; Qu, Z.Y. Soil salt and groundwater change in flood irrigation field and uncultivated land: A case study based on 4-year field observations. Environ. Earth Sci. 2015, 73, 2127–2139. [Google Scholar] [CrossRef]
- Huo, Z.L.; Feng, S.Y.; Huang, G.H.; Zheng, Y.Y.; Wang, Y.H.; Guo, P. Effect of groundwater level depth and irrigation amount on water fluxes at the groundwater table and water use of wheat. Irrig. Drain. 2012, 61, 348–356. [Google Scholar] [CrossRef]
- Chen, J.L.; Kang, S.Z.; Du, T.S.; Qiu, R.J.; Guo, P.; Chen, R.Q. Quantitative response of greenhouse tomato yield and quality to water deficit at different stages. Agric. Water Manag. 2013, 129, 152–162. [Google Scholar] [CrossRef]
- Babajimopoulos, C.; Panoras, A.; Georgoussis, H.; Arampatzis, G.; Hatzigiannakis, E.; Papamichail, D. Contribution to irrigation from shallow water table under field conditions. Agric. Water Manag. 2007, 92, 205–210. [Google Scholar] [CrossRef]
- Saadi, S.; Todorovic, M.; Tanasijevic, L.; Pereira, L.S.; Pizzigalli, C.; Lionello, P. Climate change and Mediterranean agriculture: Impacts on winter wheat and tomato crop evapotranspiration, irrigation requirements and yield. Agric. Water Manag. 2015, 147, 103–115. [Google Scholar] [CrossRef]
- Anderson, R.G.; Alfieri, J.G.; Tirado-Corbalá, R.; Gartung, J.; McKee, L.G.; Prueger, J.H.; Wang, D.; Ayars, J.E.; Kustas, W.P. Assessing FAO-56 dual crop coefficients using eddy covariance flux partitioning. Agric. Water Manag. 2017, 179, 92–102. [Google Scholar] [CrossRef]
- Nguyen, D.C.H.; Ascough, H.J.C.; Maier, H.R.; Dandy, G.C.; Andales, A.A. Optimization of irrigation scheduling using ant colony algorithms and an advanced cropping system model. Environ. Model. Softw. 2017, 97, 32–45. [Google Scholar] [CrossRef]
- Perea, R.G.; Poyato, E.C.; Montesinos, P.; Diaz, J.R. Optimization of irrigation scheduling using soil water balance and genetic algorithms. Water Resour. Manag. 2016, 30, 2815–2830. [Google Scholar] [CrossRef]
- De Medeiros, G.A.; Arruda, F.B.; Sakai, E. Crop coefficient for irrigated beans derived using three reference evaporation methods. Agric. For. Meteorol. 2005, 135, 135–143. [Google Scholar] [CrossRef]
- Er-Raki, S.; Chenbouni, A.; Hoedjes, J.; Ezzahar, J.; Duchemin, B.; Jacob, F. Improvement of FAO-56 method for olive orchards through sequential assimilation of thermal infrared-based estimates of E.T. Agric. Water Manag. 2008, 95, 309–321. [Google Scholar] [CrossRef]
- Gonzalez T., F.; Pavek, M.J.; Holden, Z.J.; Garza, R. Evaluating potato evapotranspiration and crop coefficients in the Columbia Basin of Washington state. Agric. Water Manag. 2023, 286, 108371. [Google Scholar] [CrossRef]
- Elis Marina de Freitas, Gustavo Henrique da Silva, Gabriel Fernandes Costa Guimarães, Thayne Nárgyle Botelho Vital, Joslanny Higino Vieira, Fernando Augusto da Silveira, Carlos Nick Gomes, Fernando França da Cunha, Evapotranspiration and crop coefficient of Physalis peruviana cultivated with recycled paper as mulch. Sci. Hortic. 2023, 320, 112212.
- Fernandez, J.Z.; Alcon, F.; Diaz-Espejo, A.; Hernandez-Santana, V.; Cuevas, M.V. Water productivity and economic analyses for super high density olive orchards. In Proceedings of the IX International Symposium on Irrigation of Horticultural Crops, Matera, Italy, 17–20 June 2019. [Google Scholar]
- Hou, X.H.; Fan, J.L.; Zhang, F.C.; Hu, W.H.; Yan, F.L.; Xiao, C.; Li, Y.P.; Cheng, H.L. Determining water use and crop coefficients of drip-irrigated cotton in south Xinjiang of China under various irrigation amounts. Ind. Crops Prod. 2022, 176, 114376. [Google Scholar] [CrossRef]
- Guo, H.; Li, S.E.; Kang, S.Z.; Du, T.S.; Tong, L.; Hao, X.M.; Ding, R.S. Crop coefficient for spring maize under plastic mulch based on 12-year eddy covariance observation in the arid region of Northwest China. J. Hydrol. 2020, 588, 125108. [Google Scholar] [CrossRef]
- Liu, B.; Han, H.H.; Liu, X.C.; Li, C.; Chen, X.P.; Wu, H.; Luo, Y.F.; Cui, Y.L. Quantifying the effects of advection on single crop coefficients over a humid paddy field for sustainable irrigation. J. Hydrol. 2022, 614, 128552. [Google Scholar] [CrossRef]
- Allen, R.; Pereira, L.; Raes, D.; Smith, M. Crop Evapotranspiration-Guidelines for computing crop water requirements. FAO Irrig. Drain. Pap. 1998, 56, 29–64. [Google Scholar]
- Mahohoma, W. Measurement and Modelling of Water Use of Citrus Orchards. Ph.D. Dissertation, University of Pretoria, Pretoria, South Africa, 2016. [Google Scholar]
- Muniandy, J.M.; Yusop, Z.; Askari, M. Evaluation of reference evapotranspiration models and determination of crop coefficient for Momordica charantia and Capsicum annuum. Agric. Water Manag. 2016, 169, 77–89. [Google Scholar] [CrossRef]
- Peddinti, S.R.; Kambhammettu, B.P. Dynamics of crop coefficients for citrus orchards of central India using water balance and eddy covariance flux partition techniques. Agric. Water Manag. 2019, 212, 68–77. [Google Scholar] [CrossRef]
- Zapata-Sierra, A.J.; Mpreno-Perez, M.F.; Reyes-Requena, R.; Manzano-Agugliaro, F. Root distribution with the use of drip irrigation on layered soils at greenhouses crops. Sci. Total Environ. 2021, 768, 144944. [Google Scholar] [CrossRef]
- Jafari, M.; Kamali, H.; Keshavarz, A.; Momeni, A. Estimation of evapotranspiration and crop coefficient of drip-irrigated orange trees under a semi-arid climate. Agric. Water Manag. 2021, 248, 106769. [Google Scholar] [CrossRef]
- Li, B.; Wim, V.; Shukla, M.K.; Du, T.S. Drip irrigation provides a trade -off between yield and nutritional quality of tomato in the solar greenhouse. Agric. Water Manag. 2021, 249, 106777. [Google Scholar] [CrossRef]
- Garrity, P.D.; Watts, D.G.; Sullivan, C.Y.; Gilley, J.R. Moisture deficits and grain sorghum performance: Evapotranspiration-yield relationships. Agron. J. 1982, 74, 815–820. [Google Scholar] [CrossRef]
- Shi, H.B.; Tian, J.C.; Liu, Q.H. Irrigation and Drainage Engineering; China Water Resources and Hydropower Press: Beijing, China, 2006. [Google Scholar]
- Li, F.H.; Fu, J.P.; Sun, X.F. Experimental study on groundwater utilization by crops. Groundwater 1992, 14, 197–202. [Google Scholar]
- Dai, J.X.; Shi, H.B.; Tian, D.L.; Xia, Y.H.; Li, M.H. Determined of crop coefficient of main grain and oil crops in Inner Mongolia Hetao Irrigation Area. J. Irrig. Drain. 2011, 30, 23–27. [Google Scholar]
- Jensen, M.E. Evapotranspiration and irrigation requirements. In ASCE Mannuals and Reports on Engineering Practice; Utah State University: Logan, UT, USA, 1990; Volume 332. [Google Scholar]
- Kang, S.Z.; Gu, B.J.; Du, T.S.; Zhang, J.H. Crop coefficient and ratio of transpiration to evapotranspiration of winter wheat and maize in a semi-humid region. Agric. Water Manag. 2003, 29, 239–254. [Google Scholar] [CrossRef]
- Gao, X.Y.; Bai, Y.N.; Huo, Z.L.; Huang, G.H.; Xia, Y.H.; Steenhuis, S.T. Deficit irrigation enhances contribution of shallow groundwater to crop water consumption in arid area. Agric. Water Manag. 2017, 185, 116–125. [Google Scholar] [CrossRef]
- Maestre-Valero, J.; Testi, J.; Jimenez-Bello, M.; Castel, J.R.; Intrigliolo, D.S. Evapotranspiration and carbon exchange in a citrus orchard using eddy covariance. Irrig. Sci. 2017, 35, 397–408. [Google Scholar] [CrossRef]
- Jia, Y.L. Effect of Biochar on Soil Water-Heat-Salt Transport and Corn Growth under Different Irrigation Methods; Inner Mongolia Agricultural University: Hohhot, China, 2020. [Google Scholar]
- Amayreh, J.; Al-Abed, N. Developing crop coefficients for field-grown tomato (Lycopersicon esculentum Mill.) under drip irrigation with black plastic mulch. Agric. Water Manag. 2005, 73, 247–254. [Google Scholar] [CrossRef]
- Yang, P.J.; Hu, H.C.; Tian, F.Q.; Zhang, Z.; Dai, C. Crop coefficient for cotton under plastic mulch and drip irrigation based on eddy covariance observation in an arid area of northwestern China. Agric. Water Manag. 2016, 171, 21–30. [Google Scholar] [CrossRef]
- Ding, Y.H.; Gao, X.Y.; Qu, Z.Y.; Jia, Y.L.; Hu, M.; Li, C.J. Effect of biochar application and irrigation methods on soil temperature in farmland. Water 2019, 11, 499. [Google Scholar] [CrossRef]
Disclaimer/Publisher’s Note: The statements, opinions and data contained in all publications are solely those of the individual author(s) and contributor(s) and not of MDPI and/or the editor(s). MDPI and/or the editor(s) disclaim responsibility for any injury to people or property resulting from any ideas, methods, instructions or products referred to in the content. |
© 2024 by the authors. Licensee MDPI, Basel, Switzerland. This article is an open access article distributed under the terms and conditions of the Creative Commons Attribution (CC BY) license (https://creativecommons.org/licenses/by/4.0/).