Article

Characteristics of the Spatial and Temporal Distribution of Drought in Northeast China, 1961–2020

1
School of Chemical and Environmental Engineering, Liaoning University of Technology, Jinzhou 121000, China
2
College of Geographical Science, Inner Mongolia Normal University, Hohhot 010022, China
3
Inner Mongolia Key Laboratory of Disaster and Ecological Security on the Mongolian Plateau, Inner Mongolia Normal University, Hohhot 010022, China
*
Author to whom correspondence should be addressed.
Water 2024, 16(2), 234; https://doi.org/10.3390/w16020234
Submission received: 9 October 2023 / Revised: 4 January 2024 / Accepted: 8 January 2024 / Published: 9 January 2024

Abstract

:
Under global climate warming, the global water cycle is further accelerating, the risk of drought is increasing, and the instability and sustainability of agricultural production are seriously threatened. Northeast China, as the “granary” of China, located in the mid-high latitudes of the Northern Hemisphere, is one of the regions strongly influenced by droughts. Thus, studying the spatial and temporal distribution of drought is helpful for the development of methods for forecasting potential drought hazards in Northeast China. This study used observed data from 86 meteorological stations in Northeast China from 1961 to 2020 to calculate the standardized precipitation evapotranspiration index (SPEI) at different time scales for the past 60 years and analyzed the spatial and temporal characteristics of drought in Northeast China based on the run theory and the Mann-Kendall test. The SPEI at the annual scale showed decreasing trends with no significant mutation point. Seasonally, there was a decreasing trend of the SPEI in summer and autumn and an increasing trend in spring and winter, which indicates that drought in Northeast China has decreased in winter and spring. The annual drought frequency ranged from 25.5% to 37.6%, and the spatial characteristics of the frequency of moderate drought, severe drought, and extreme drought, respectively, showed the following distribution patterns from the western region to the central region and then to the eastern region of Northeast China: “high-low-high”, “low-high-low”, and “gradually decreasing”.

1. Introduction

Meteorological disasters represent a common global challenge. Drought, a common meteorological disaster, is often recognized as a complex and multifaceted phenomenon [1]. Drought is a recurring extreme climatic event characterized by below-average precipitation in a given area for months to years [2]. The complexity of a drought’s internal structure, uncertainty of its frequency, and wide-ranging impacts make it one of the most destructive natural disasters [3,4,5], with devastating impacts on regional agriculture, water resources, the environment, and land desertification [6,7]. Also, droughts have far-reaching impacts in the increasingly globalized world [8,9,10,11].
Drought causes considerable losses in agricultural production [12] and creates ecological and environmental problems. Below et al. [13] found that more than 50% of all deaths associated with natural disasters were caused by drought-induced famine. Keshavarz et al. pointed out that 33% of all disasters worldwide are closely related to droughts [14]. According to statistics, China has lost 70–80 million tons of grain annually owing to drought, accounting for 17% of the total grain production [15]. The northeastern region serves as China’s main production area for cash crops (corn, rice, and soybeans). It accounts for nearly 50% of the national soybean production. The northeastern region suffers from frequent drought disasters because it borders the semi-arid northern region and the Mongolian Plateau [16]. Recently, the severity and extent of droughts in this region have been increasing [17]. Therefore, there is an urgent need to analyze drought risk using a rational and comprehensive methodology to mitigate its adverse effects on agriculture and the economy.
There are a large number of indices currently used to characterize drought. Three of these common drought indices monitor agricultural drought and soil water balance. The Palmer Drought Severity Index (PDSI) [18] includes surface precipitation, soil moisture, and potential evapotranspiration. Considering the effects of temperature and initial weather on drought is a significant advantage of this widely cited index [2]. However, the difficulty in obtaining parameters, the complexity of calculations, and fixed time scales in applying this index have resulted in its ineffective use for long-term studies. McKee et al. combined different timescales with drought and proposed the Standardized Precipitation Index (SPI) [19]. Scientists have widely used the SPI owing to its computational simplicity. However, it does not include the possible effects of temperature; therefore, this index is not applicable in the present era of global warming [20,21,22,23]. As the climate warms, changes in evapotranspiration caused by significant changes in surface meteorological factors (e.g., temperature) have significantly impacted wet and dry conditions in recent decades [24,25]. Vicente-Serrano et al. proposed a Standardized Precipitation Evapotranspiration Index (SPEI) based on SPI calculations that thoroughly consider the possible effects of temperature [26]. The SPEI is considered the most appropriate index for drought studies in various regions [27,28]. The multi-scale nature of the SPEI makes it suitable for different types of drought analyses and monitoring. The SPEI retains the advantages of SPI and PDSI while overcoming their shortcomings. Researchers often use SPEI to analyze the spatial and temporal characteristics of different regions and trends, which has proven to be more effective in characterizing dry and wet conditions in the context of global climate change [21,27,29,30,31,32,33]. Using SPEI to characterize droughts is becoming increasingly common across China, particularly in Northern China [34]. Shi et al. [35] compared SPEI monitoring results with historical drought records in typical areas and found that SPEI has better applicability in the eastern monsoon region.
Recently, run theory has become increasingly popular in identifying the duration and intensity of droughts [36]. Run theory is a time-series analysis method based on selecting appropriate thresholds, i.e., identifying the beginning, persistence, or end of a drought based on the relationship between the drought indicator values and thresholds. Studies have shown that run theory identifies regional drought events, especially annual and seasonal droughts, better than traditional methods [37,38,39,40]. Identifying the duration (D) and intensity (I) of drought through run theory can aid in providing more efficient analyses of drought changes in the northeast.
Numerous studies have used different drought indicators to analyze the characteristics of the spatial and temporal changes in drought in Northeast China [41,42,43]; however, there is little discussion of the combined analysis methods such as drought multiscale and propensity rate [44,45]. Characteristic analysis of different time-scale droughts and drought frequency can help us better understand the evolution of drought events in Northeast China, providing theoretical support for the prevention and mitigation of drought. Understanding the occurrence patterns of drought events is helpful for the government to rationally utilize and allocate water resources, optimize agricultural production layout, and improve agricultural drought resistance, thus promoting the sustainable development of the economy in drought-stricken areas.
Thus, this paper calculated the multi-scale SPEI values based on the observed data of 86 meteorological stations from 1961 to 2020, examined drought durations, intensities, and frequency in Northeast China based on the run theory, and characterized the drought and drought frequency in different time scales. The objectives of this study were (1) to explore the trend of drought in Northeast China by integrating the methods of multiple time scales and propensity rate; (2) to analyze the spatial and temporal evolution characteristics of drought duration, intensity, and frequency in Northeast China at different time scales. The results can reveal temporal-spatial characteristics of droughts in Northeast China and provide scientific basis and data support for agrometeorological disaster prevention and mitigation in Northeast China.

2. Study Area and Data Sources
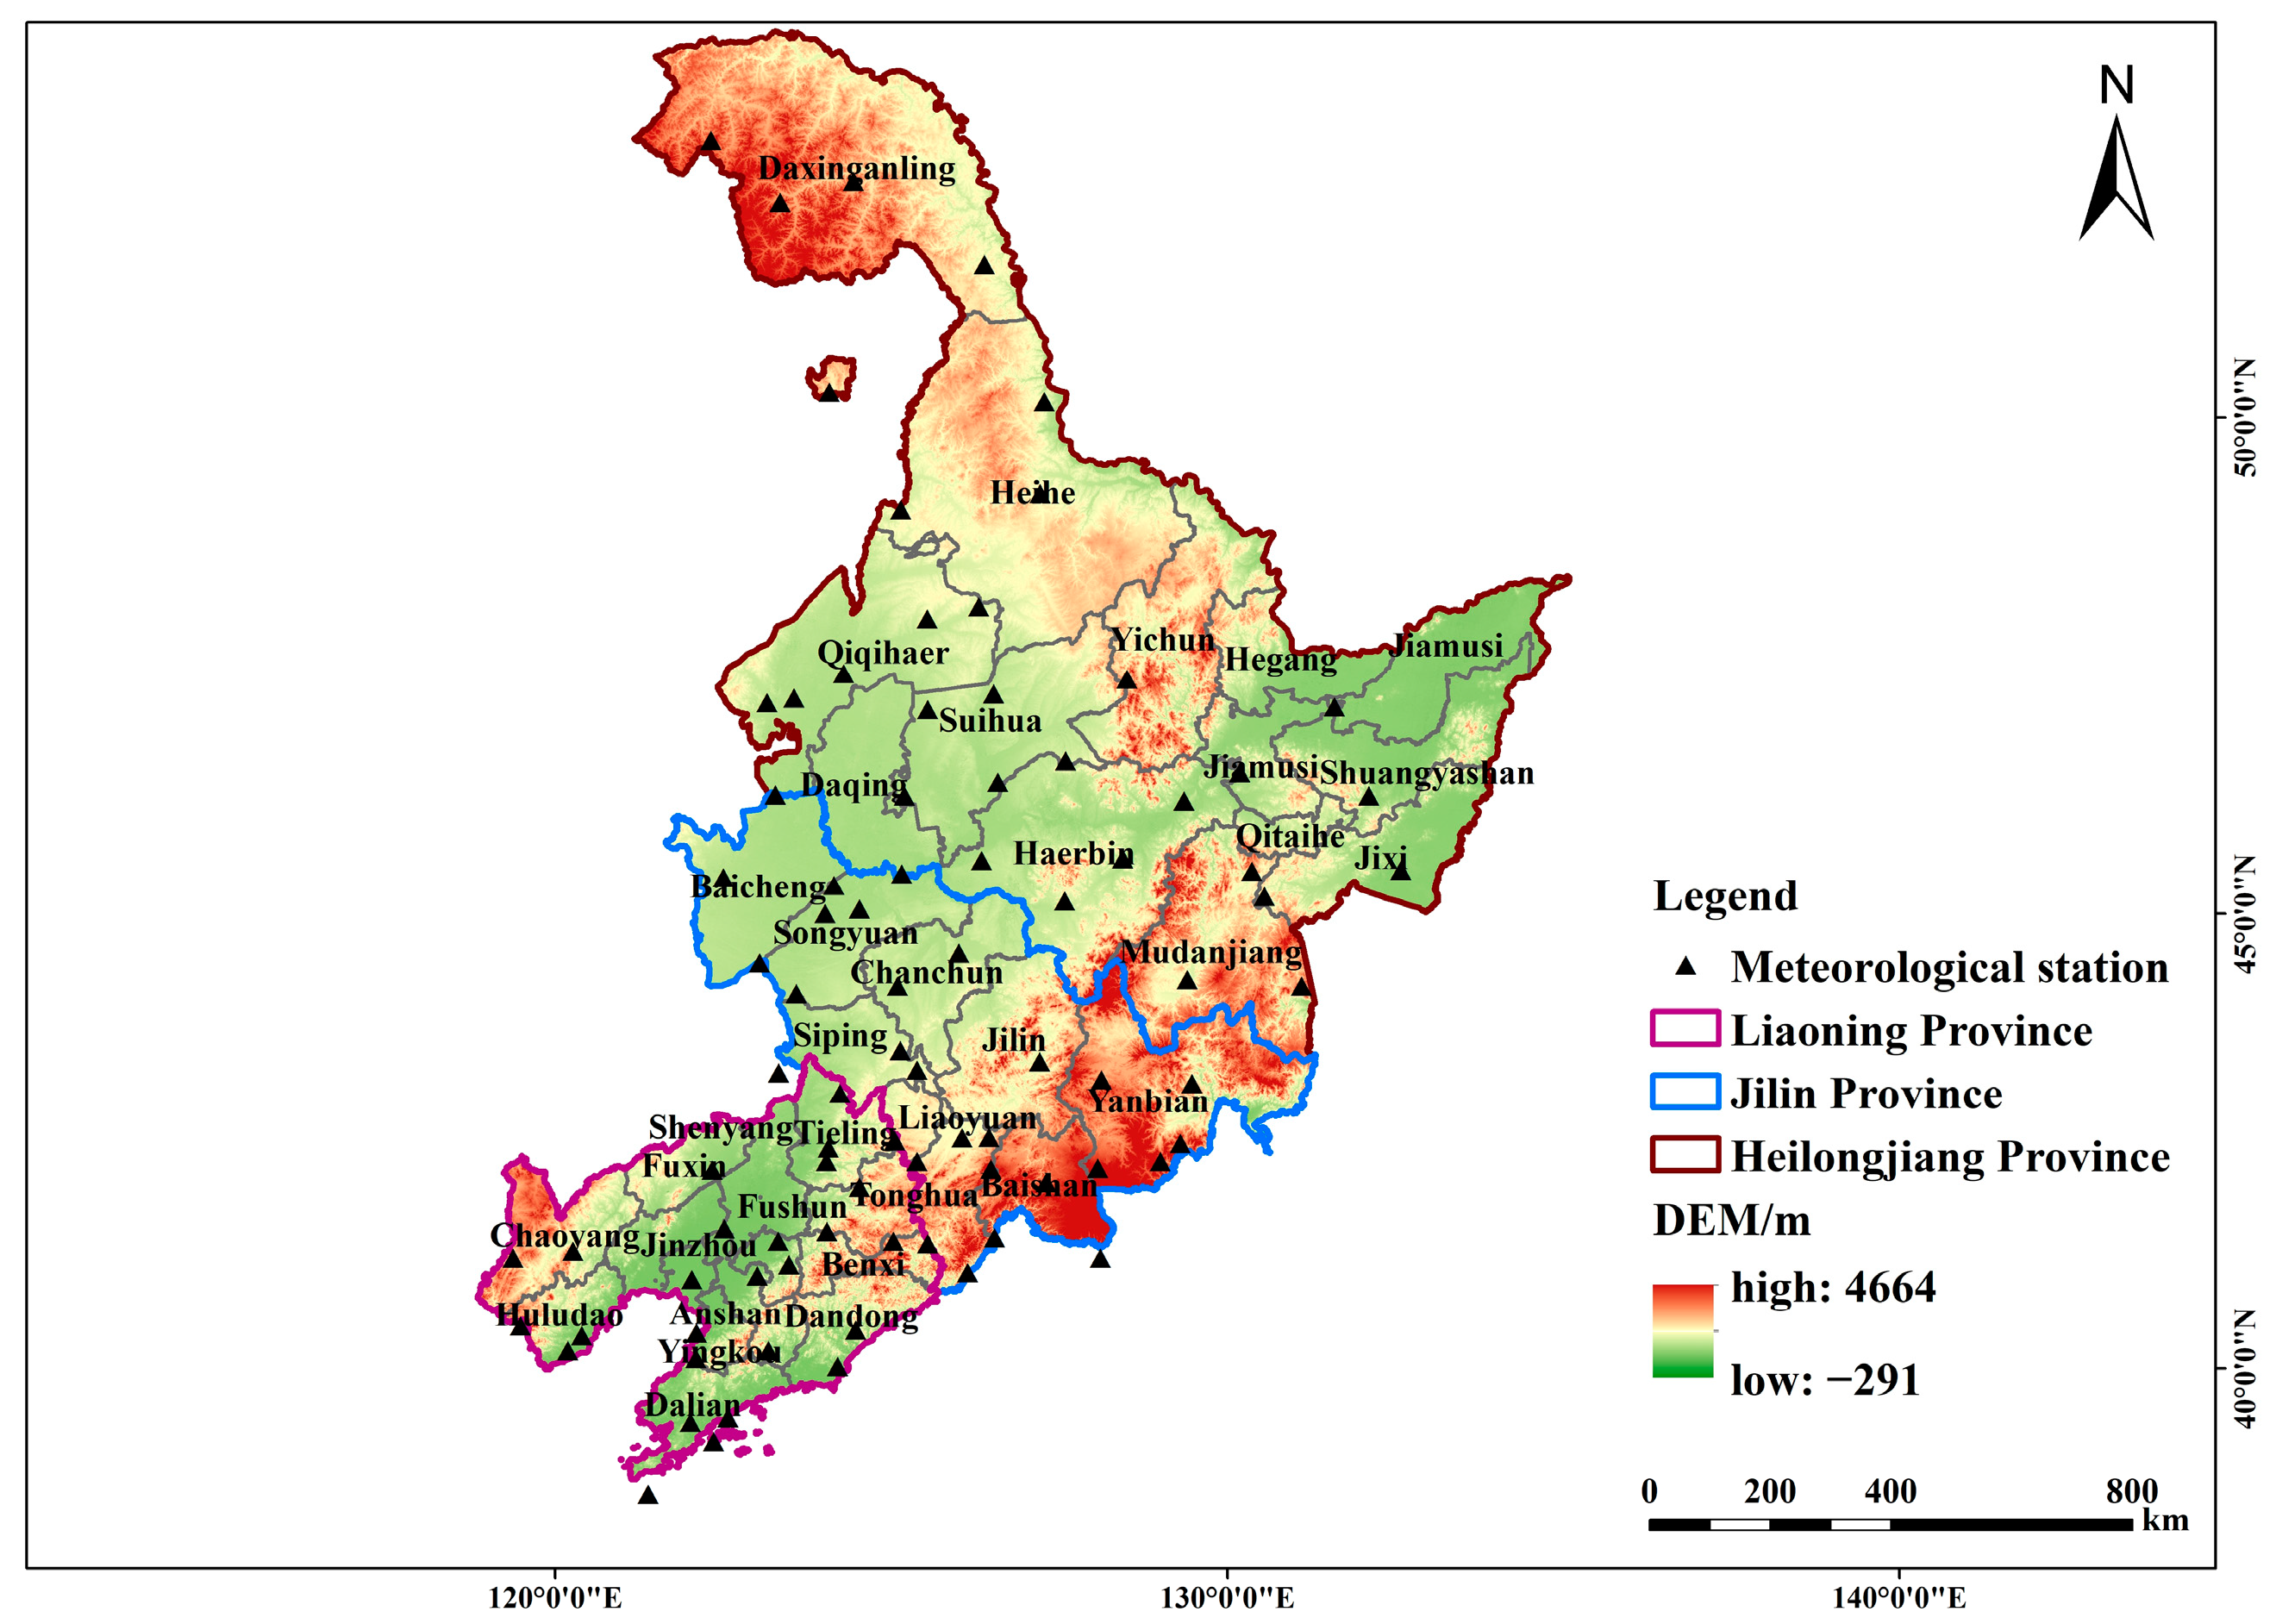
2.1. Study Area

As an agricultural area, Northeast China has an average elevation of approximately 50–100 m and displays flat, deep, and undulating soil layers. The landforms are mainly mountainous but flat with rich and fertile black soil resources. The study area is located at 38°43′–53°33′ N and 115°53′–135°05′ E, with a total area of approximately 845,300 km2. Northeast China is located in the middle temperate zone, with a monsoon climate, average annual temperature of 5.4 °C, and annual precipitation of 400–700 mm in the east and 250–400 mm in the west. However, frequent droughts can always occur in study areas at high latitudes (the winters are frigid and long). Since the 21st century, drought events in the northeastern provinces have occurred more frequently [17].

2.2. Data Sources

The meteorological observation data for this study were obtained from the China Meteorological Science Data Sharing Network (http://cdc.cma.gov.cn, accessed on 10 July 2023). Daily monitoring data from 186 national standard weather stations in Northeast China from 1961 to 2020 were selected. During the processing, the continuity of the weather station data was first checked, deleting weather stations with cumulative data missing for more than 1 year. The remaining anomalous or missing data were corrected and interpolated using the linear method and data from neighboring stations in the same year. Finally, 86 stations were selected from the 186 stations to obtain complete and consistent data. Figure 1 shows the distribution of meteorological stations in the study area.

3. Methodology

3.1. Standardized Precipitation Evapotranspiration Indices

The SPEI was proposed by Vicente-Serrano based on the SPI and is easy to calculate by adding the effects of precipitation and evapotranspiration on drought to the original basis. Thus, the progress of droughts can be characterized by the SPEI from the perspective of surface water scarcity and accumulation. As it reflects a broad scale of events, the impact of temperature rises on drought, and the temporal and spatial changes characterizing drought in the northeastern provinces were caused by recent precipitation and temperature rise. The specific calculation steps are as follows.
  • The calculation formula for potential evapotranspiration is as follows [46]:
P E T = 16 K   ( 10 T I ) m   and
m = 6.75 × 10 7 I 3 7.71 × 10 5 I 2 + 1.79 × 10 2 I + 0.492 ,
where T, I, m, and K are the average monthly temperature (°C), annual heat sum (calculated as the sum of the 12-month heat index), constant (the value of which depends on I), and the correction coefficient as a function of the latitude and month, respectively.
2.
The monthly differences in precipitation and evapotranspiration were calculated as follows:
D i = P i P E T i ,
where Pi and PETi are the monthly precipitation and potential evapotranspiration, respectively.
3.
A three-parameter log-logistic function was used to fit the difference series with the following probability density function:
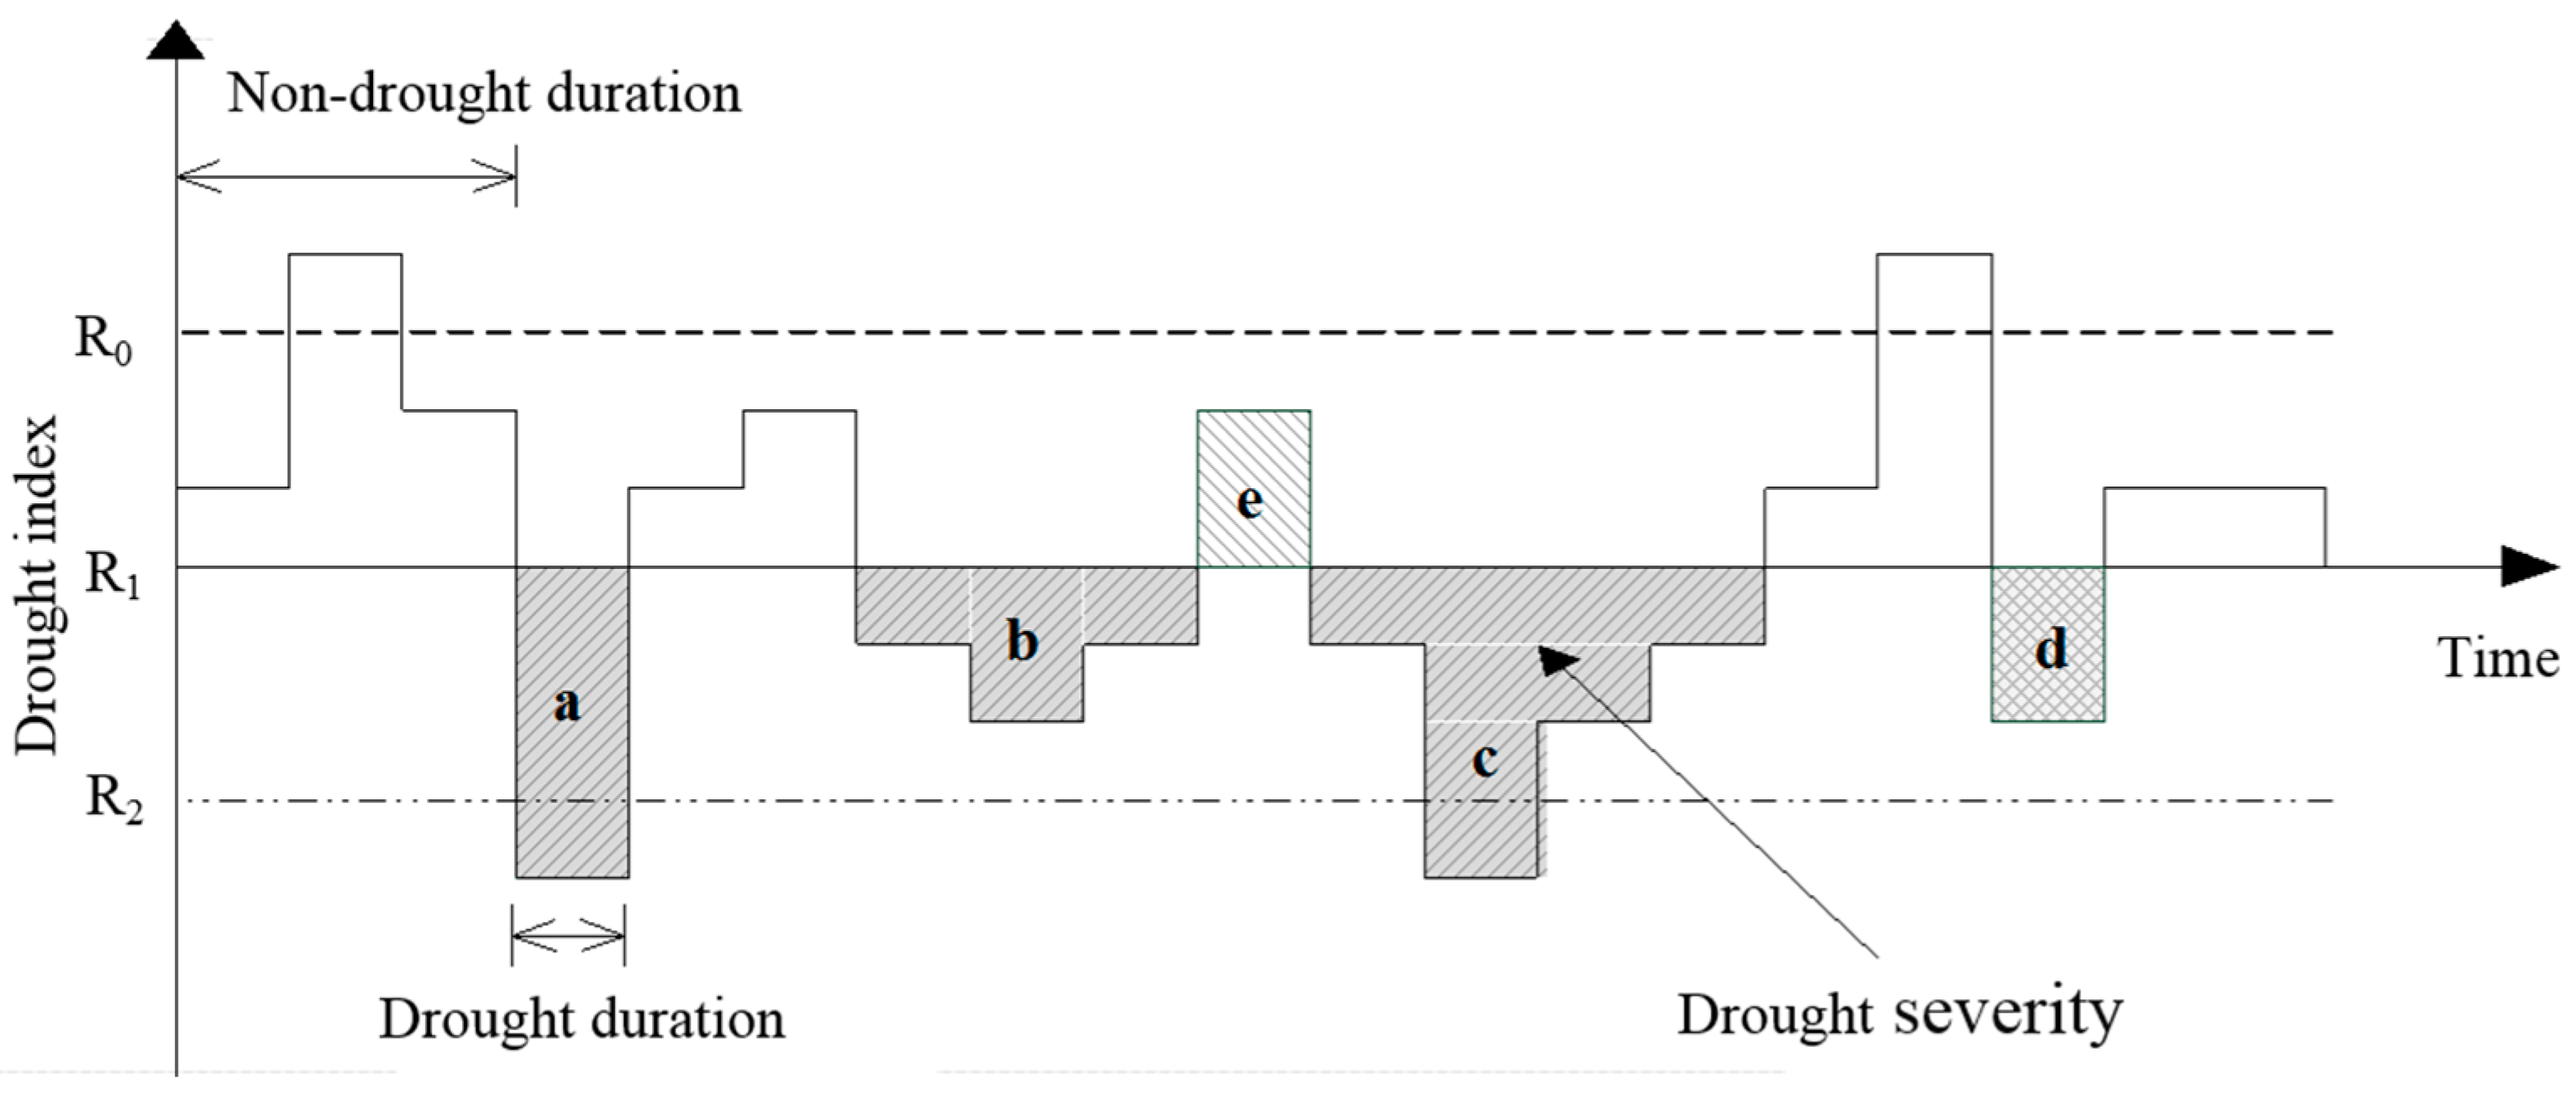
f ( x ) = β α   ( x γ α )   [ 1 + ( x γ α ) ] 2 ,
where α, β, and γ denote scale, shape, and position parameters, respectively. We used Equation (4) to obtain the cumulative probability distribution function of the sequence:
F ( x ) = [ 1 + ( α x γ ) ] 1 .
The normalized F (x) values were used to calculate the SPEI values at different timescales:
S P E I = W C 0 + C 1 W + C 2 W 2 1 + d 1 W + d 2 W 2 + d 3 W 3 .
When the cumulative probability was p > 0.5, we transformed P to 1–P. The constants were C0 = 2.515517, C1 = 0.802853, C2 = 0.010328, d1 = 1.432788, d2 = 0.189269, and d3 = 0.001308.
The magnitude of the SPEI value indicates dryness and humidity. The higher the SPEI value, the wetter it is, and vice versa. Considering factors such as low precipitation in Northeast China, this study focused on the detailed grading of SPEI values in Table 1 under drought conditions in Northeast China based on the national meteorological drought grade standard (GB/T20481-2017) [47].
As Northeast China is often accompanied by a temperate monsoon climate and four distinct seasons, interannual and seasonal variations differ significantly. To better analyze the evolution of the SPEI in Northeast China, the seasonal-scale (SPEI-3) and annual-scale (SPEI-12) SPEI values were used to discuss the drought change state. Spring was defined as March–May, summer as June–August, fall as September–November, and winter as December–February.

3.2. Run Theory

Run theory, also known as the theory of runs or the theory of soft time, is one method for the analysis of time series data, drought characteristics, and conception. A “run” is a phenomenon when events with the same attributes happen persistently, and run length is defined by the duration of events with the same attribution occurrence. Drought duration (D) is a period between the beginning and end of a continuous drought event. Drought severity (S) is a cumulative deficiency of a continuous drought parameter under the critical value. The principle of run theory is shown in Figure 2. When the value of SPI is less than R1, there may be four drought events: a, b, c, and d. On this basis, for a drought event that lasted one unit period (such as a and d), if the drought index value is less than R2 (such as a), it will be defined as a drought event. Otherwise, there is no drought (such as d). When the interval between two drought events (such as b and c) has only one unit period (such as e), and the index value of e in the interval period is less than R0, the two events will be merged into one drought event. The drought duration of the merged drought event is D = d b + d c + 1 , and the severity is S = s b + s c .

3.3. Drought Frequency

Drought frequency is the proportion of months during the study period in which drought occurred about the entire month. A larger value indicates a higher drought frequency:
D F I = ( m M ) × 100 % ,
where DFI is the frequency (%) of drought at a site, m is the number of months in which drought occurs, and M is the total number of months during the study period.

3.4. Mann-Kendall Mutation Test

The Mann-Kendall trend test, recommended by the World Meteorological Organization as a rank-based nonparametric trend test, constructs a standard Z-statistic to represent the trend detection value. The advantage is that the samples do not have to follow a sample-specific distribution and are not disturbed by outliers.
For a time series of n samples, the standardized test statistic Z is:
Z = { S 1 var ( S ) S > 0 0 S = 0 S + 1 var ( S ) S < 0
Among them:
S = i = 1 n 1 j = i + 1 n sgn ( x j x i )
sgn ( x j x i ) = { 1 x j x i > 0 0 x j x i = 0 1 x j x i < 0 ,
Var ( S ) = n ( n 1 ) ( 2 n + 5 ) p = 1 q t p ( t p 1 ) ( 2 t p + 5 ) 18
where xj is the number of j in sequence x, q is the number of arrays, and tp represents the number of data points in the array of p.
The UF statistic measures the difference between the number of rising and falling extremes in a data series. Based on this, the variable UF(S) is:
U F ( S ) = [ S E ( S ) ] Var ( S )
The UB statistic is used to measure the time interval between extremes. Defining the reverse sequence X′= {Xn, Xn−1,…, X1}, repeat the above calculation process to obtain the trend sequence UF′(S), and the UB(S) is:
U B ( S ) = U F ( S )
When UF intersects with UB, it is considered that the intersection point is the mutation point of the time series.

3.5. Climate Propensity Rate

Climate propensity rate is a regression coefficient applied in climate studies that expresses the relationship between temperature and year in a single linear equation. According to this equation, the annual change in temperature can be expressed as a trend rate of change equation, whose slope multiplied by 10 is known as the climate propensity ratio.

4. Results and Analysis

4.1. Spatial and Temporal Variation Characterizations of the SPEI

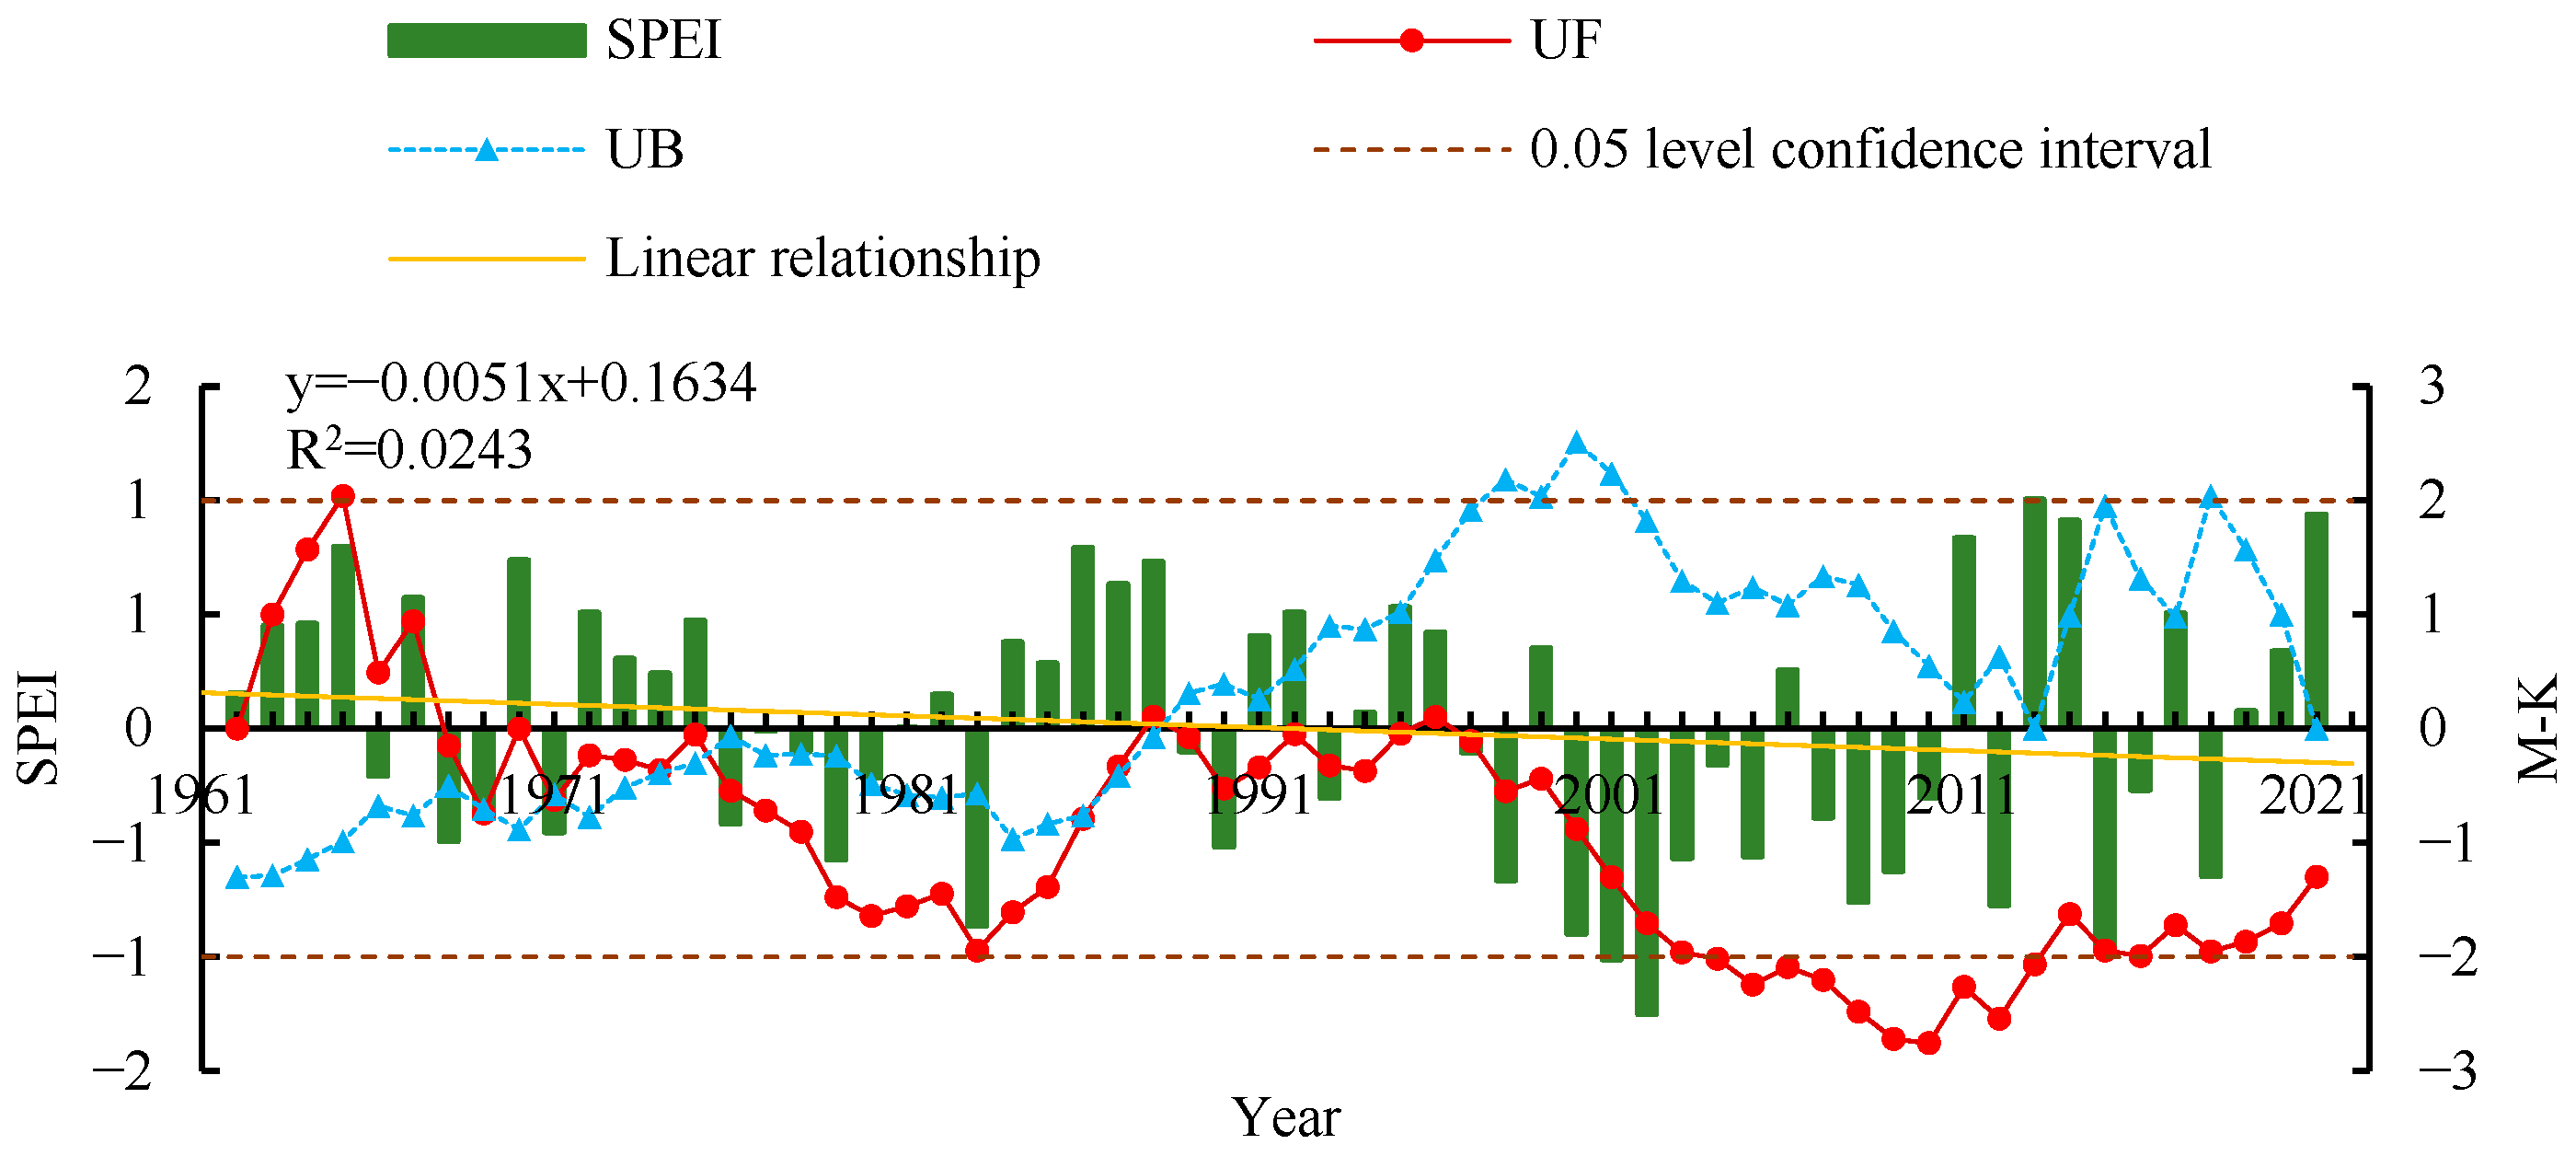
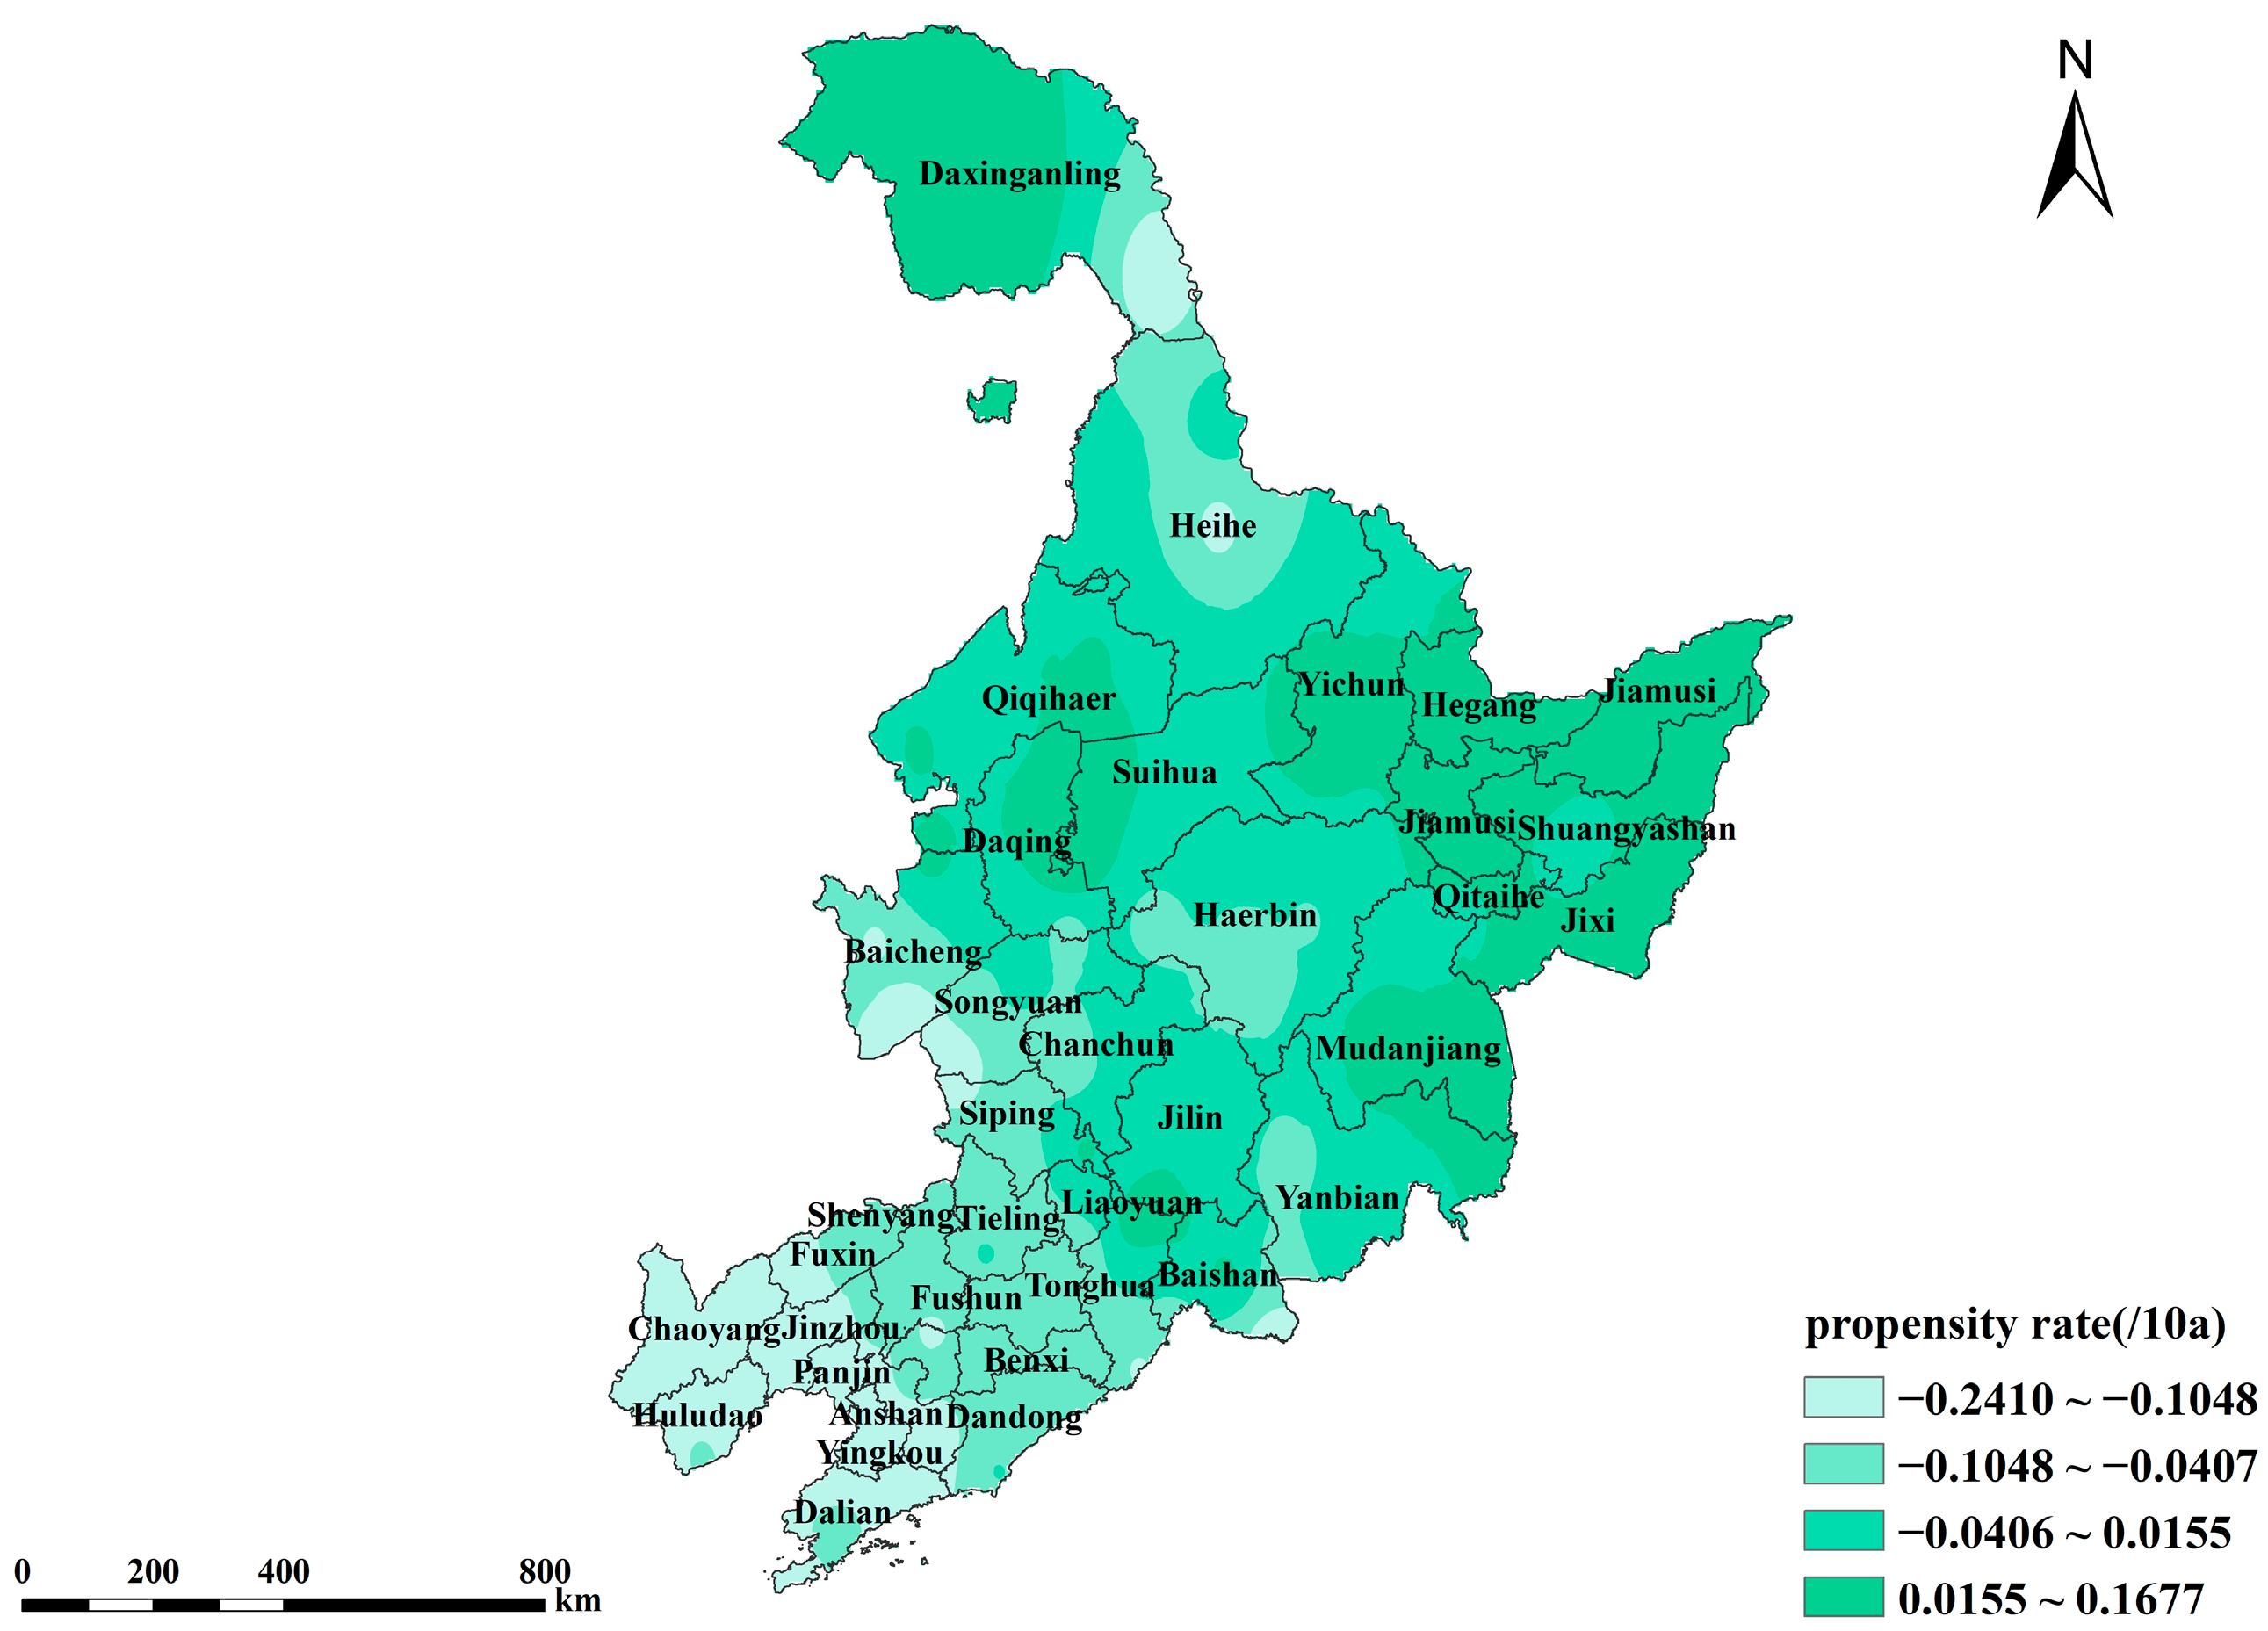
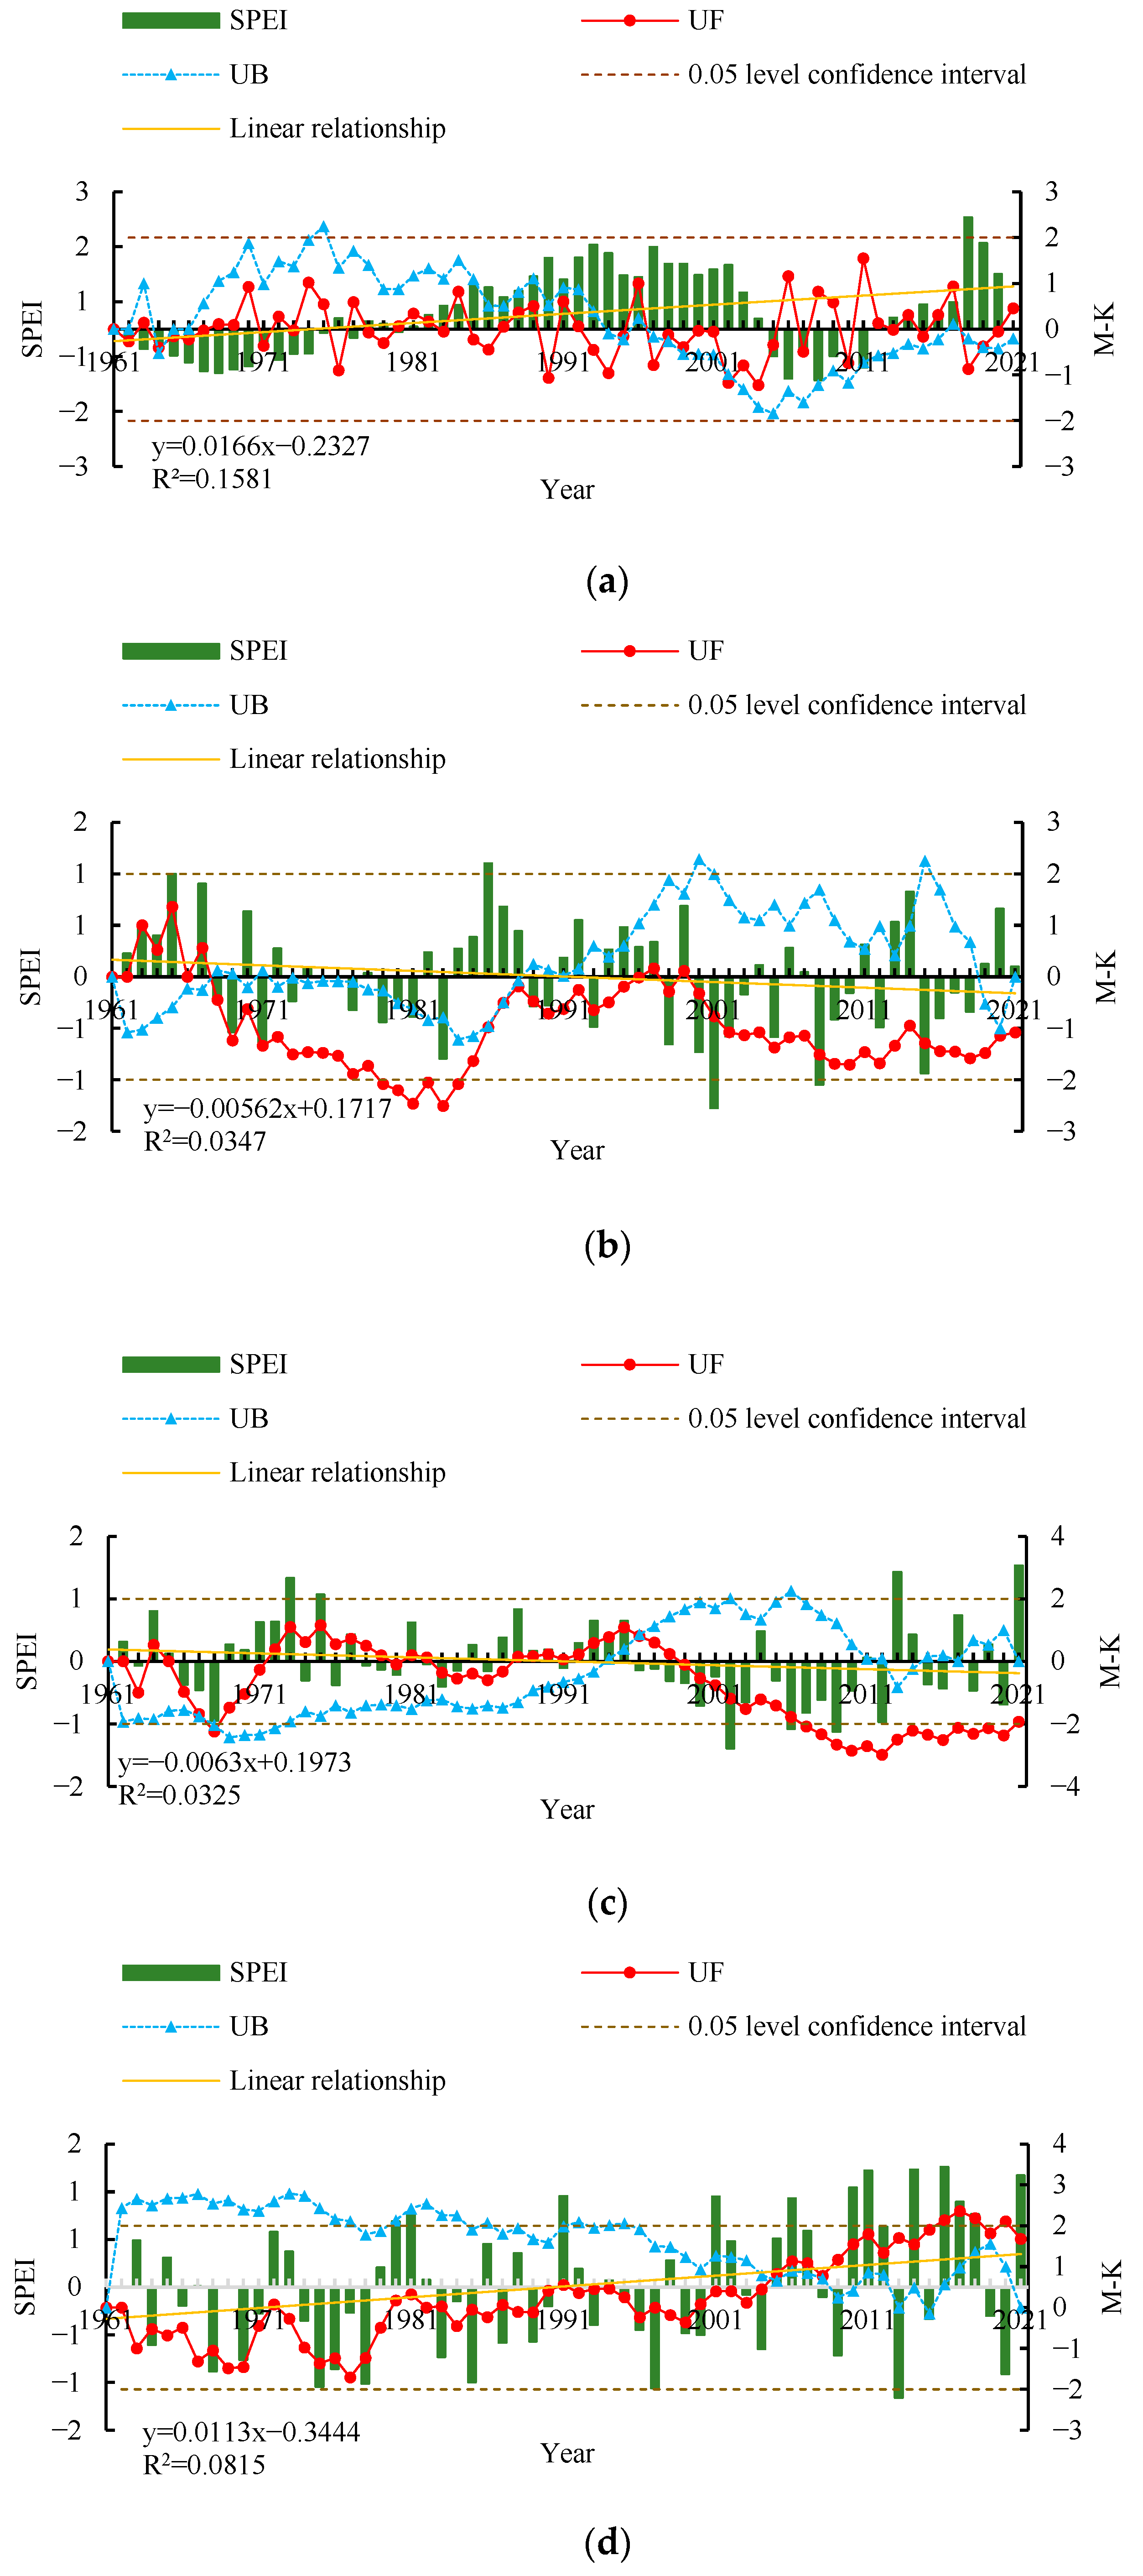
4.1.1. Inter-Annual Variation Characteristics of the SPEI

In this study, the SPEI-12 was calculated for Northeast China from 1961 to 2020, and the M-K mutation test was performed to explore trends of the SPEI-12 (Figure 3). Northeast China as a whole has shown a decreasing trend from 1961 to 2020, with a decrease of 0.051/10 a, ranging from −1.25 to 1.00. Meanwhile, fluctuations in the SPEI values were relatively smooth before 1998. The fluctuations in the SPEI values were relatively smooth from 1999 to 2004; no droughts occurred in 2003. For the remaining years, the SPEI was less than −0.5, which indicated that the drought was relatively severe. From 2009 to 2020, the fluctuation in the SPEI was the most positive and negative. Overall, the annual average SPEI index of Northeast China over the past 60 years was less than −2.0, showing a decreasing trend. This indicates that drought severity in Northeast China has increased significantly. In Figure 3, the UF values were positive from 1961 to 1969 (except 1967 and 1968), indicating an “upward” trend in the SPEI-12 index during this period, in other words, a relatively wet period. All UF values from 1970 to 2020 (except 1987 and 1995) and after 1995 are less than 0, which means that the average annual SPEI index shows a significant downward trend during this period, indicating that this period is a relatively dry period in Northeastern China. Within the critical line at the significance level of 0.05, the UF and UB curves frequently intersected in 1968, 1970–1973, and 1985–1987, indicating an abrupt change from wet to dry.
To further analyze the spatial variability of the inter-annual propensity rate of SPEI, this study analyzed the spatial characteristics of the multi-year average propensity rate of SPEI-12 during the last 60 years in Northeast China (Figure 4). The interannual propensity rates in Northeast China generally showed an increasing trend from the south to the north. Among them, the annual scale propensity rates in Liaoning Province were all negative, ranging from −0.2093 to −0.0131, with the lowest propensity rate in Dawa County of Liaoning Province. Eighteen stations in Jilin Province had negative propensity rates, indicating that most of the stations were in a drought trend; high-value areas were distributed in the southeastern part of Jilin Province, with the highest propensity rate of 0.0554 in Huadain City of Jilin Province and the lowest −0.2554 in Changbai City of Jilin Province. Most of the stations in Heilongjiang Province showed a wet trend, among which Suifenhe City of Heilongjiang Province had the highest propensity rate, with a value of 0.1679, indicating that Suifenhe City had the most apparent wet trend in the past 60 years. Changbai City of Jinlin Province and Yingkou City of Liaoning Province had the lowest tendency rate, with values of −0.2554 and −0.2489, respectively, indicating that the two stations had a drought trend in the past 60 years. This indicated an aggravating drought trend in the southern part of Northeast China, whereas the northern part showed a humid trend.

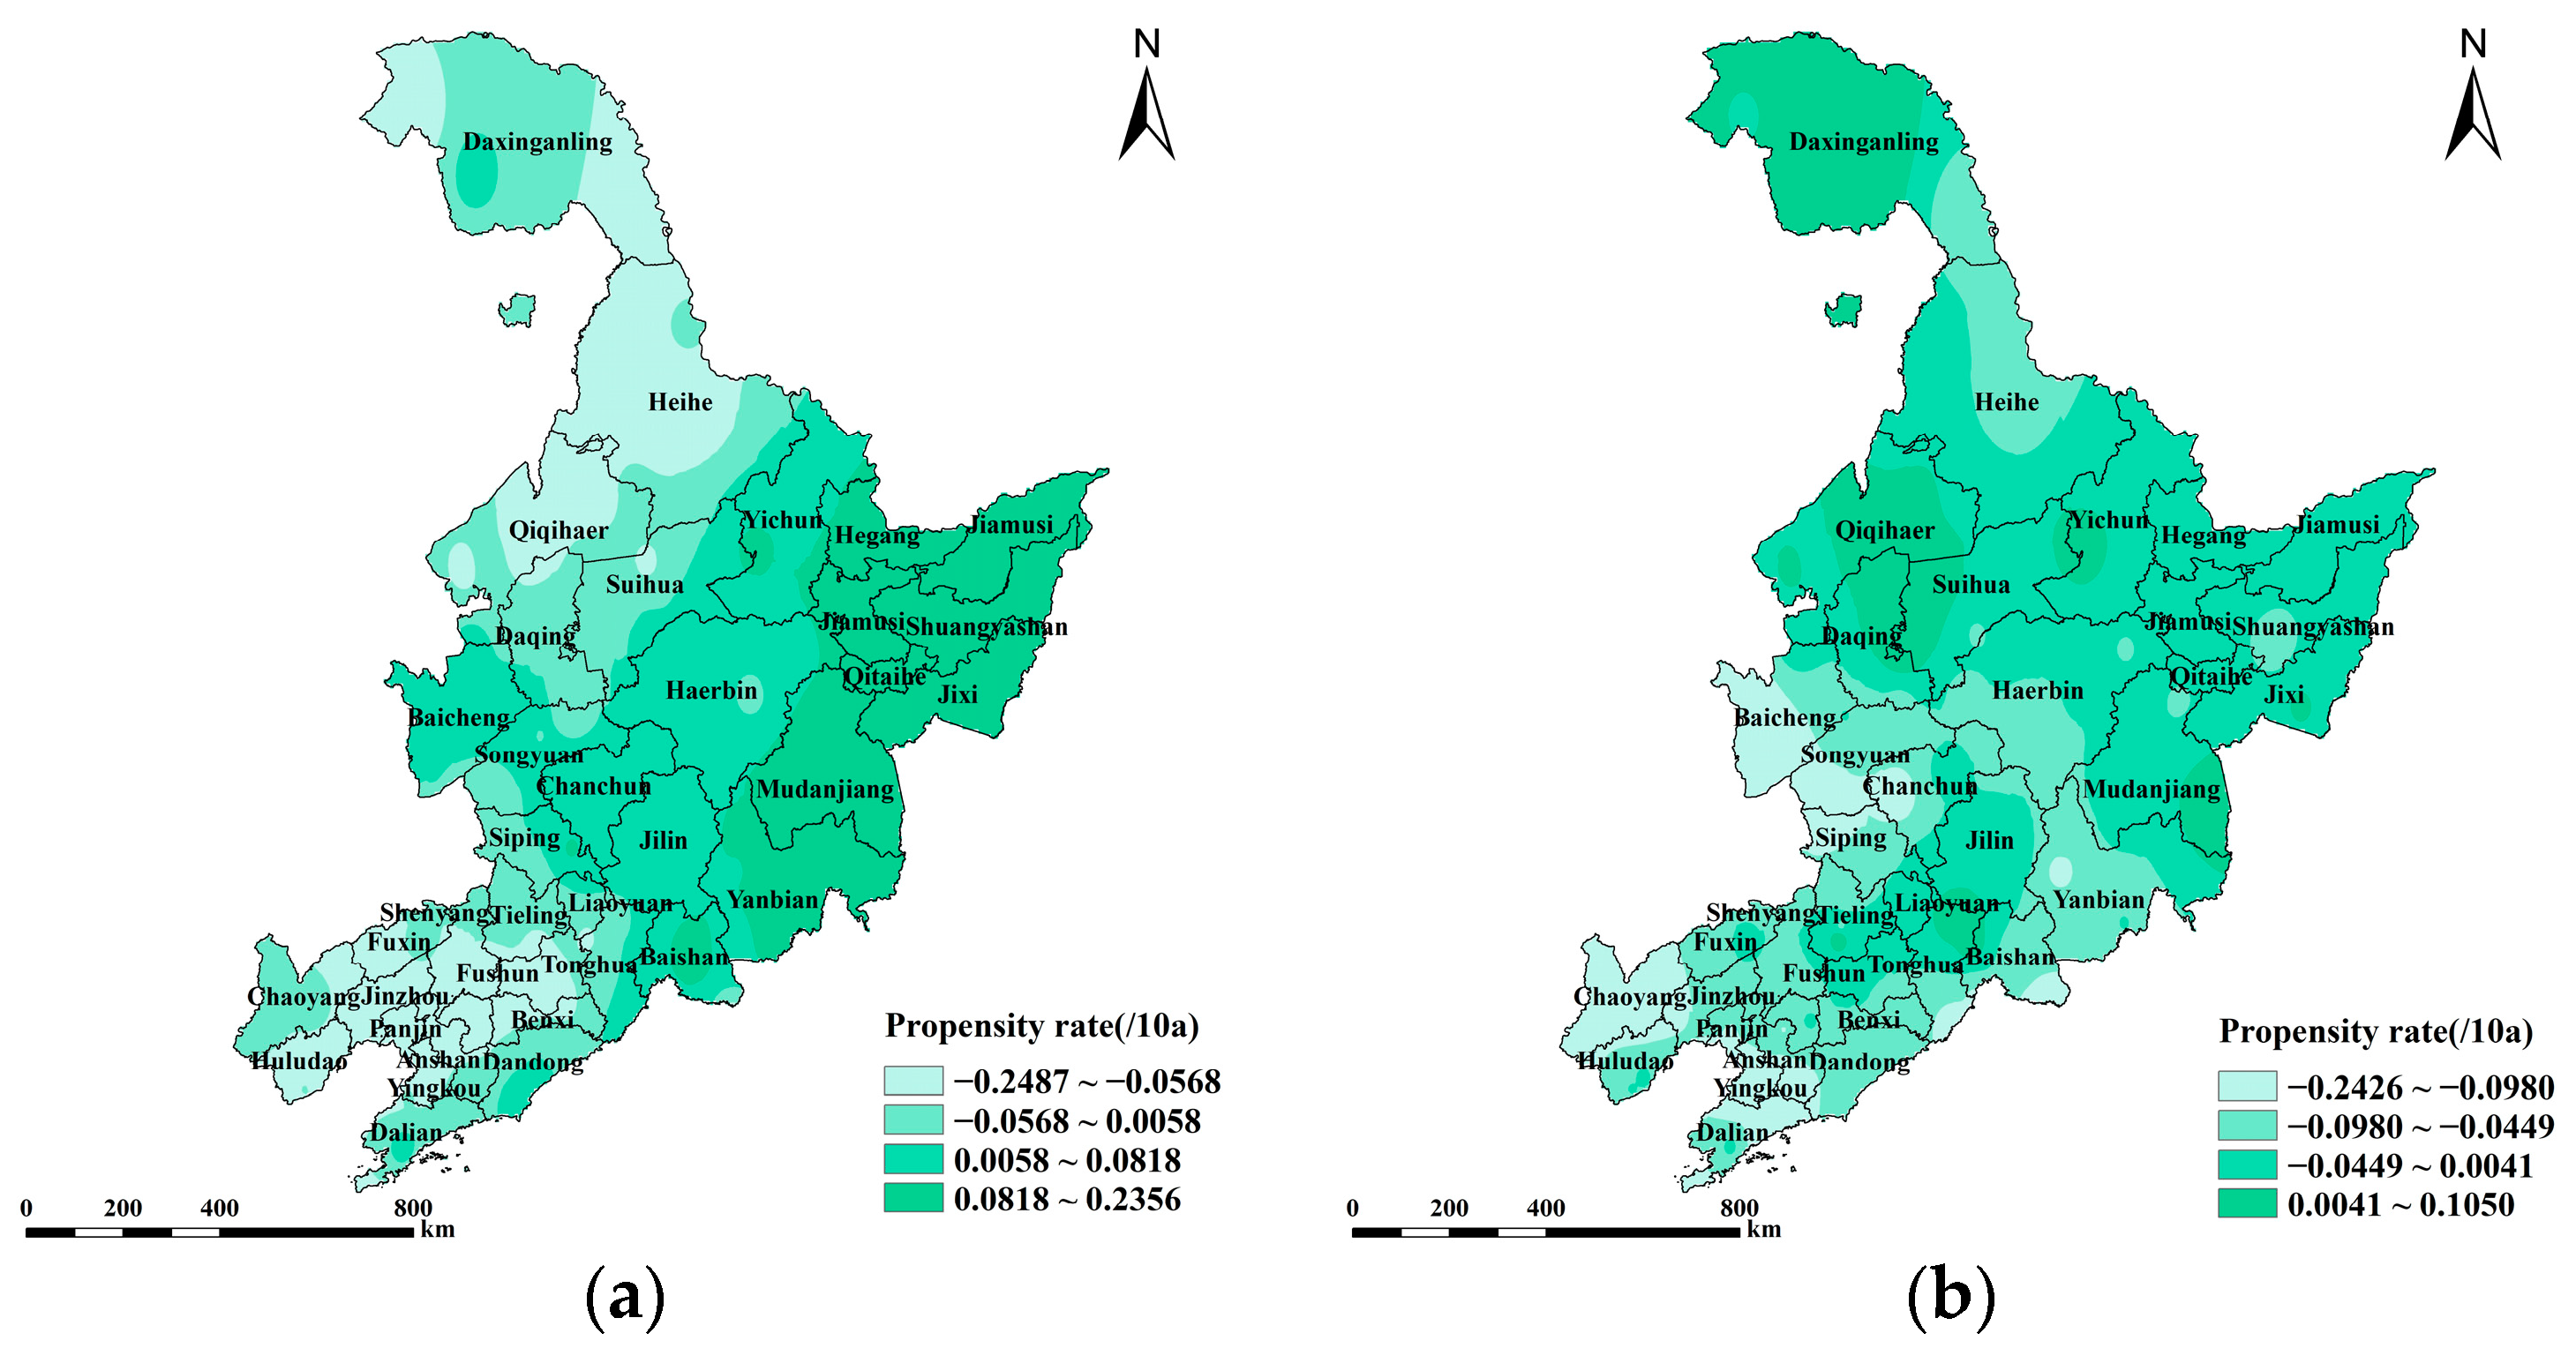
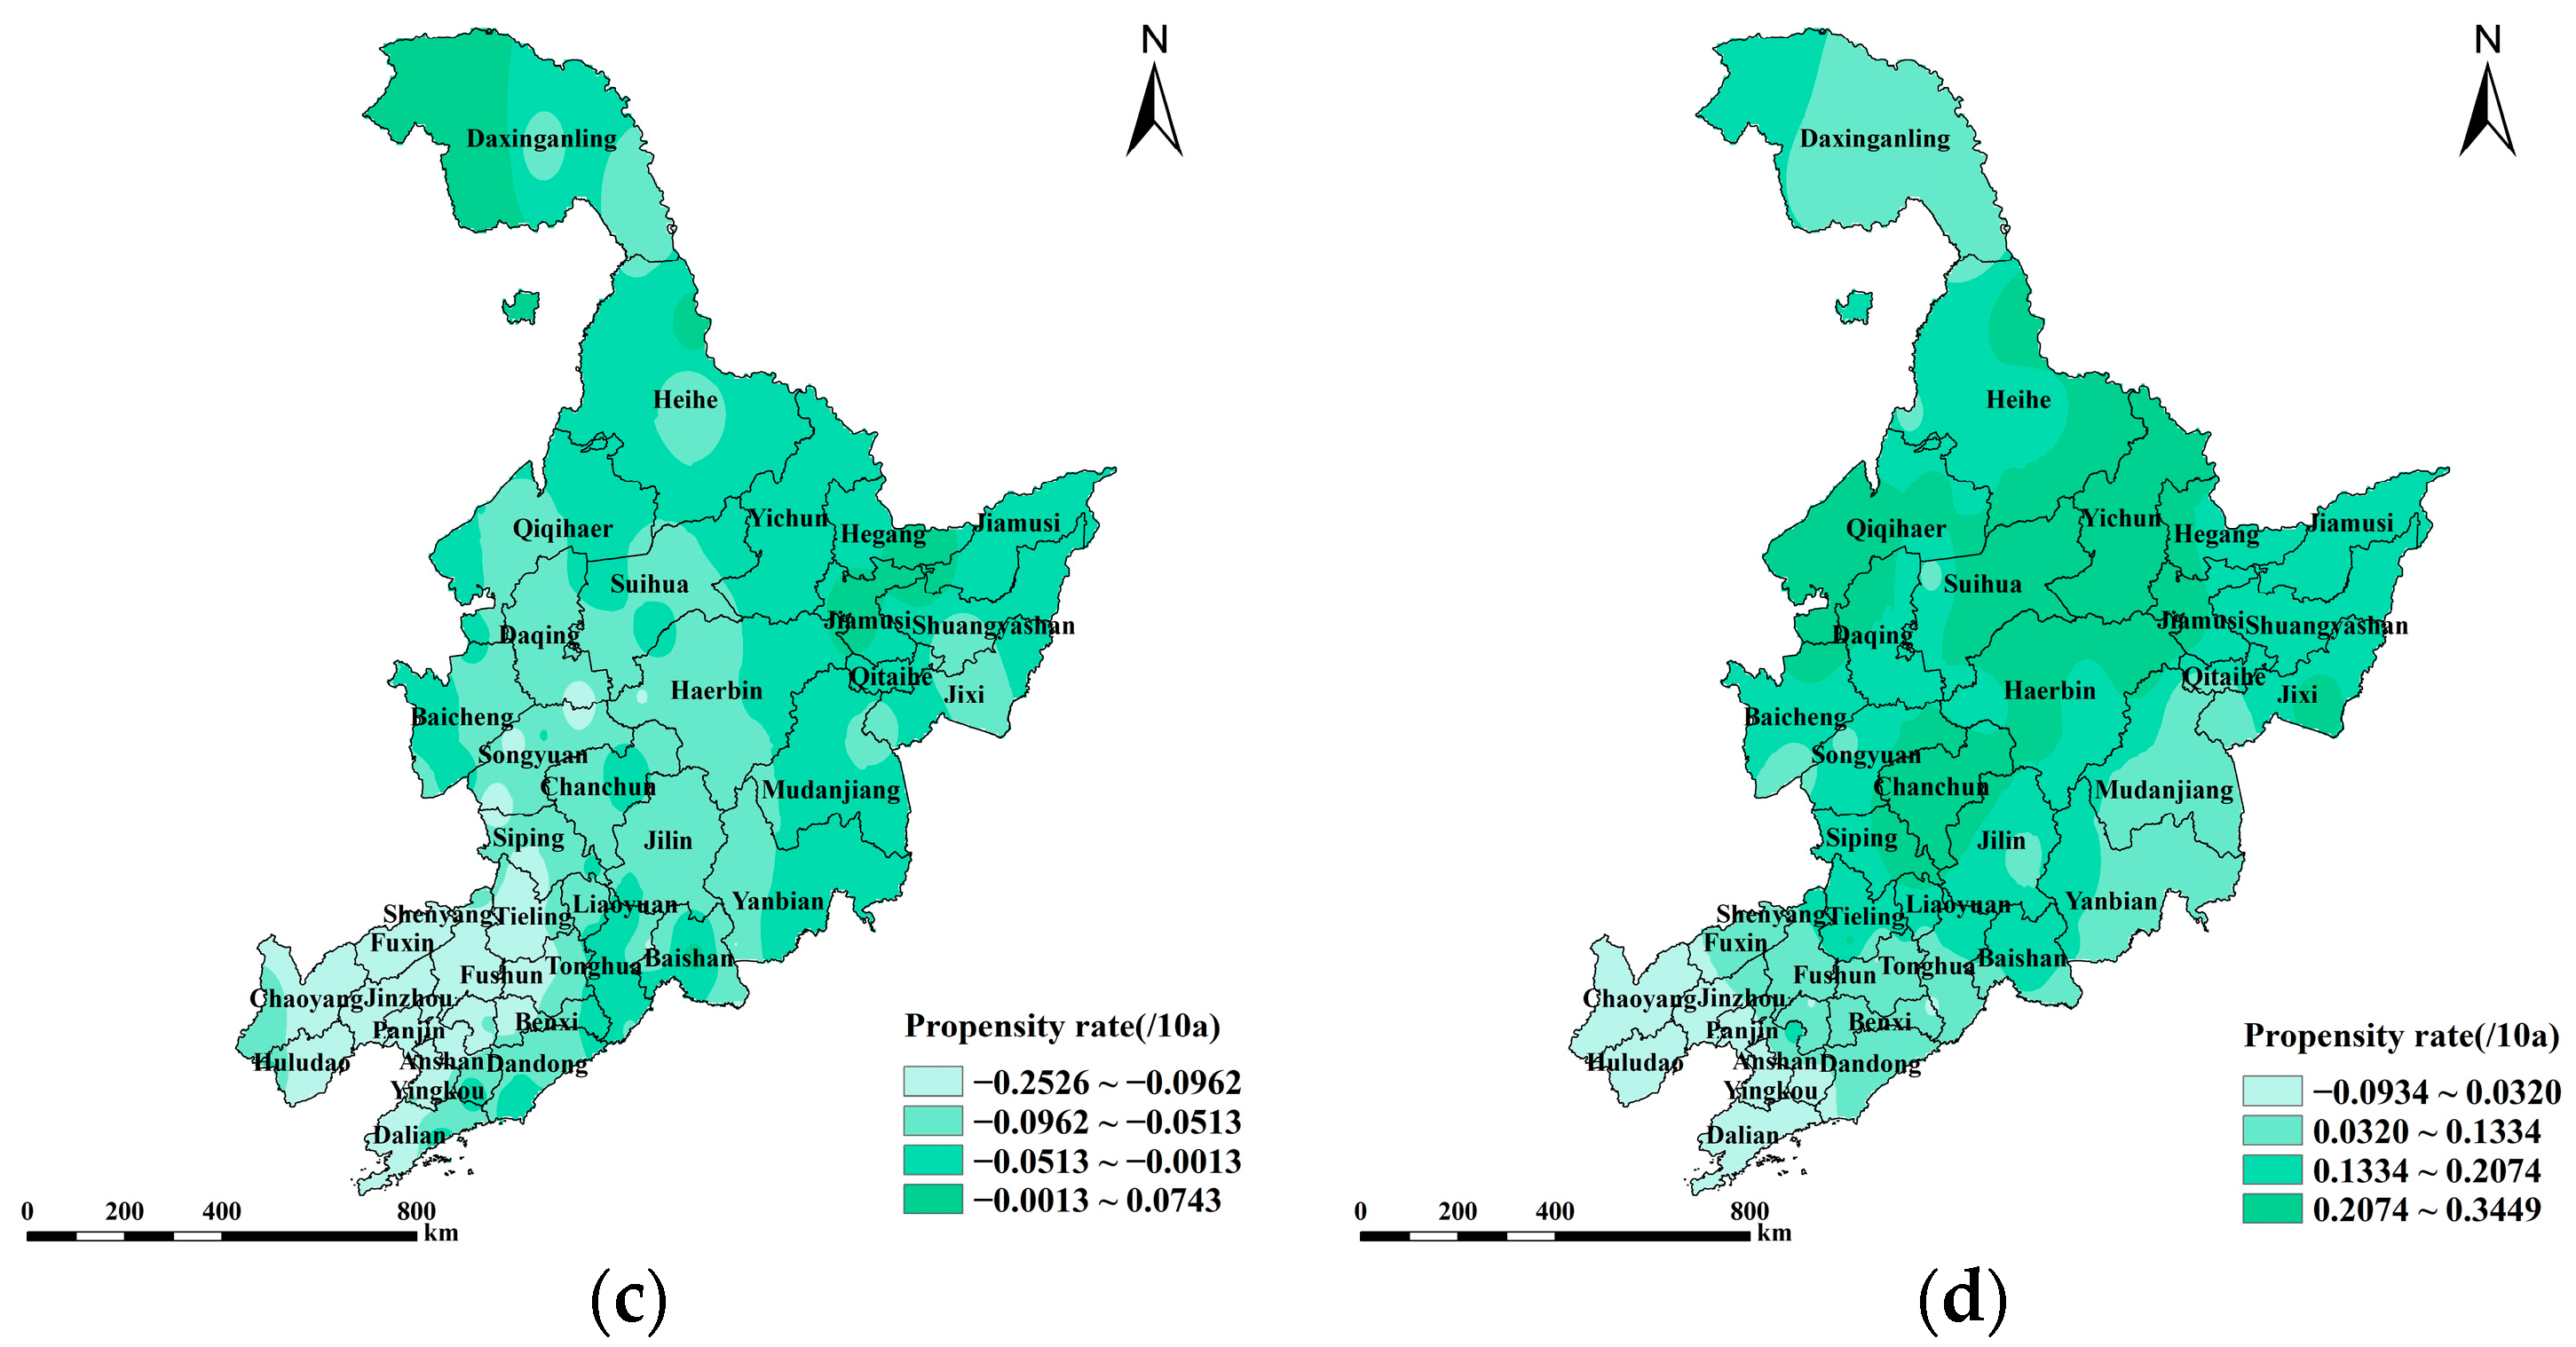
4.1.2. Seasonal Variation Characteristics of the SPEI

To explore the seasonal trends in Northeast China, the variation characterizations of the SPEI-3 based on the M-K test were performed (Figure 5). The slope of the SPEI in the spring of 1961–2020 in Northeastern China is 0.166/10a, with little overall fluctuation (Figure 5a). There were 9 drought years (1965–1969, 1971, 2005, 2007, 2010), which accounted for 15% of the total number of years, and 29 normal years. The value in 2007 was the smallest (−0.93) and the driest spring in the last 60 years. The SPEI-3 experienced mutations in 1963, 1984, 1986, 1988, 2006, and 2010, and before 1988, the UF and UB curves intersected frequently and with UF > 0, indicating that they experienced multiple alternations of dryness and wetness in spring. During the summer (Figure 5b), SPEI values declined at a rate of 0.056/10a over the years. The more severe drought years were mainly concentrated in 2000~2010, with a total of 10 years of drought occurrence, including two years of medium drought in 2000 and 2007, 16.7% of the total number of years of drought occurrence, and 40 years of normal years. The 2000 value was the smallest (−1.27), the driest summer in the last 60 years. The UF and UB curves overlap in 1965, 1984, and 1985, i.e., there was an abrupt summer drought increase in 1965, 1984, and 1985. In autumn (Figure 5c), SPEI values decreased at a rate of 0.063/10a. It is clear from the figure that droughts are mainly concentrated after 2000, with a total of 10 years of drought occurring, 1968, 1999, 2001, 2002, 2005, 2006, 2007, 2008, 2011, and 2019, accounting for 16.7% of the total number of years, three of the medium-drought years were 2001, 2005 and 2008, and there were 38 normal years. The lowest value (−1.39) of SPEI appeared in 2001 and had the driest fall in the last 60 years. The UF and UB curves intersected two times, in 1967 and 1995. The rate of increase in SPEI in winter (Figure 5d) was 0.113/10a, which is related to lower temperatures and less evaporation in winter. Drought occurs more frequently in winter; the occurrence of drought years totaled 16 years, of which four years of medium drought years were 1974, 1977, 1996, and 2012. The occurrence of drought years accounted for 26.7% of the total number of years. There are 27 normal years, and the smallest value of the year 2012 (−1.16) was the driest winter season in the past 60 years. The winter SPEI-3 index UF and UB curves intersected in 2004.
The SPEI-3 index in Northeast China from 1961 to 2020 shows a steady trend, with a decreasing trend in summer and fall and an increasing trend in spring and winter, i.e., it indicates that the drought in spring and winter has been reduced, while the drought in summer and fall has been aggravated.
Then, we analyzed the spatial characterizations of the slope of SPEI in different scales in Northeast China (Figure 6). The slope ranges of SPEI in Northeast China in spring (Figure 6a) were from -0.2487 to 0.2356, and the spatial distribution of the trend of the slope of SPEI gradually decreasing from the eastern region to the western region of Northeast China, with the high-value areas located in the eastern part of Heilongjiang Province around Suifenhe, Mudanjiang and Jixi City, and lower values in the northern part of Heilongjiang Province and the western part of Liaoning Province, with the smallest value in Dawa City of Liaoning Province of −0.2491. The slope ranges of SPEI in Northeast China in summer (Figure 6b) were from −0.2426 to 0.1050, and the spatial distribution shows a decreasing trend from the north to the south, with the high-value area concentrated in the northern part of Heilongjiang Province, in which Suifenhe City has the largest value of 0.1025, and Changbai City of Jinlin Provence has the lowest value of −0.2706; The slope of SPEI in autumn (Figure 6c) had a value of −0.2550 to ~0.0743. Only seven stations had a positive propensity rate, which were concentrated in the northern and eastern parts of Heilongjiang Province. Xingcheng City of Liaoning Province had the lowest value. The spatial distribution of the propensity rate in winter (Figure 5d) is roughly the same as in summer, but the overall values are high, with only 14 stations having negative values. This indicates an overall wet state in winter, with the lowest site being Yingkou City of Liaoning Province with a value of −0.0988 and the highest value near Yilan County of Heilongjiang Province at 0.3457. Generally, the low values of the propensity rate in summer and autumn in Northeast China from 1961 to 2020 tended to be drier, while the high values in winter tended to be moister.

4.2. Spatial and Temporal Characterizations of Drought Duration and Intensity in Northeast China

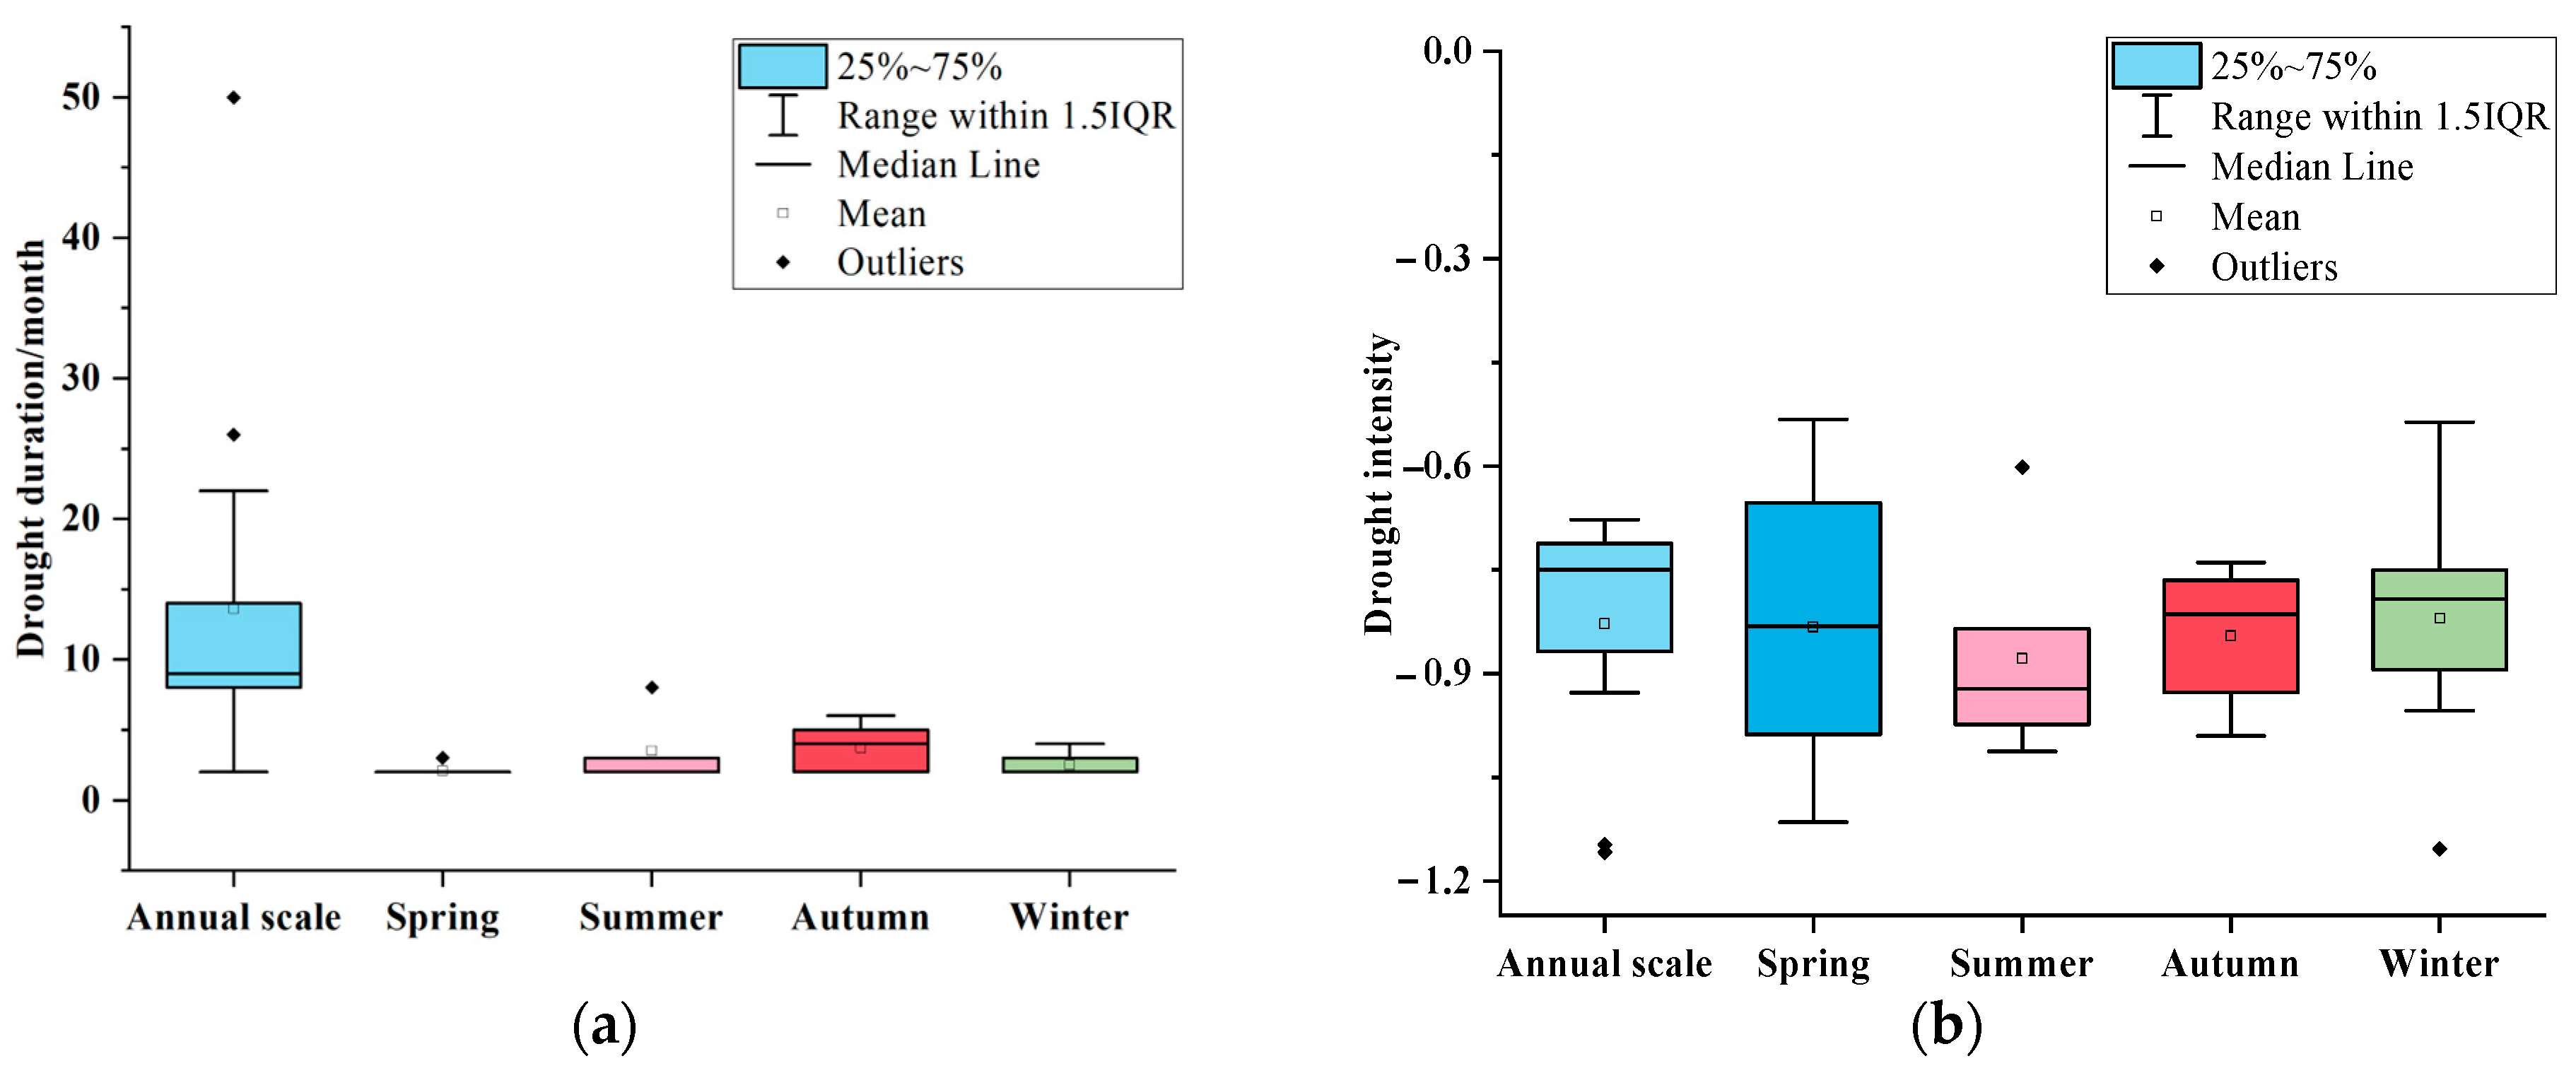
4.2.1. Temporal Characterizations of the Drought Duration and Intensity

The annual and seasonal variation characteristics of the drought duration and intensity can be used to analyze the drought strength. Therefore, this study identified the annual and seasonal drought duration and intensity in Northeast China using the run theory (Figure 7). At the inter-annual scale, the longest duration of droughts was 50 months (July, 1999–August, 2003), and the minimum value of the drought intensity was −1.16, during which a severe drought of up to 8 months occurred from November 2000 to June 2001, which had a severe impact on the climate of Northeast China. Drought also occurred frequently from 2014 to 2019, which is also consistent with the years when droughts occurred in Northeast China. The longer the duration of a drought, the lower the drought intensity, and vice versa.
As shown in Figure 7a, the spring drought in 1975 lasted for three months on a seasonal scale. The summer drought lasted for three months in 2000, and the same phenomenon also happened consecutively in 2001. Droughts in the autumn of 1999, 2001, 2006, and 2011 lasted longer than the others. The winter drought in 2008 lasted for three months. Figure 7b shows that SPEI seasonal drought intensity generally converges with interannual drought intensity. The greatest SPEI drought intensity occurred in the winter of 1996, at −1.15; the spring of 2001 also had a low drought intensity of −1.11.

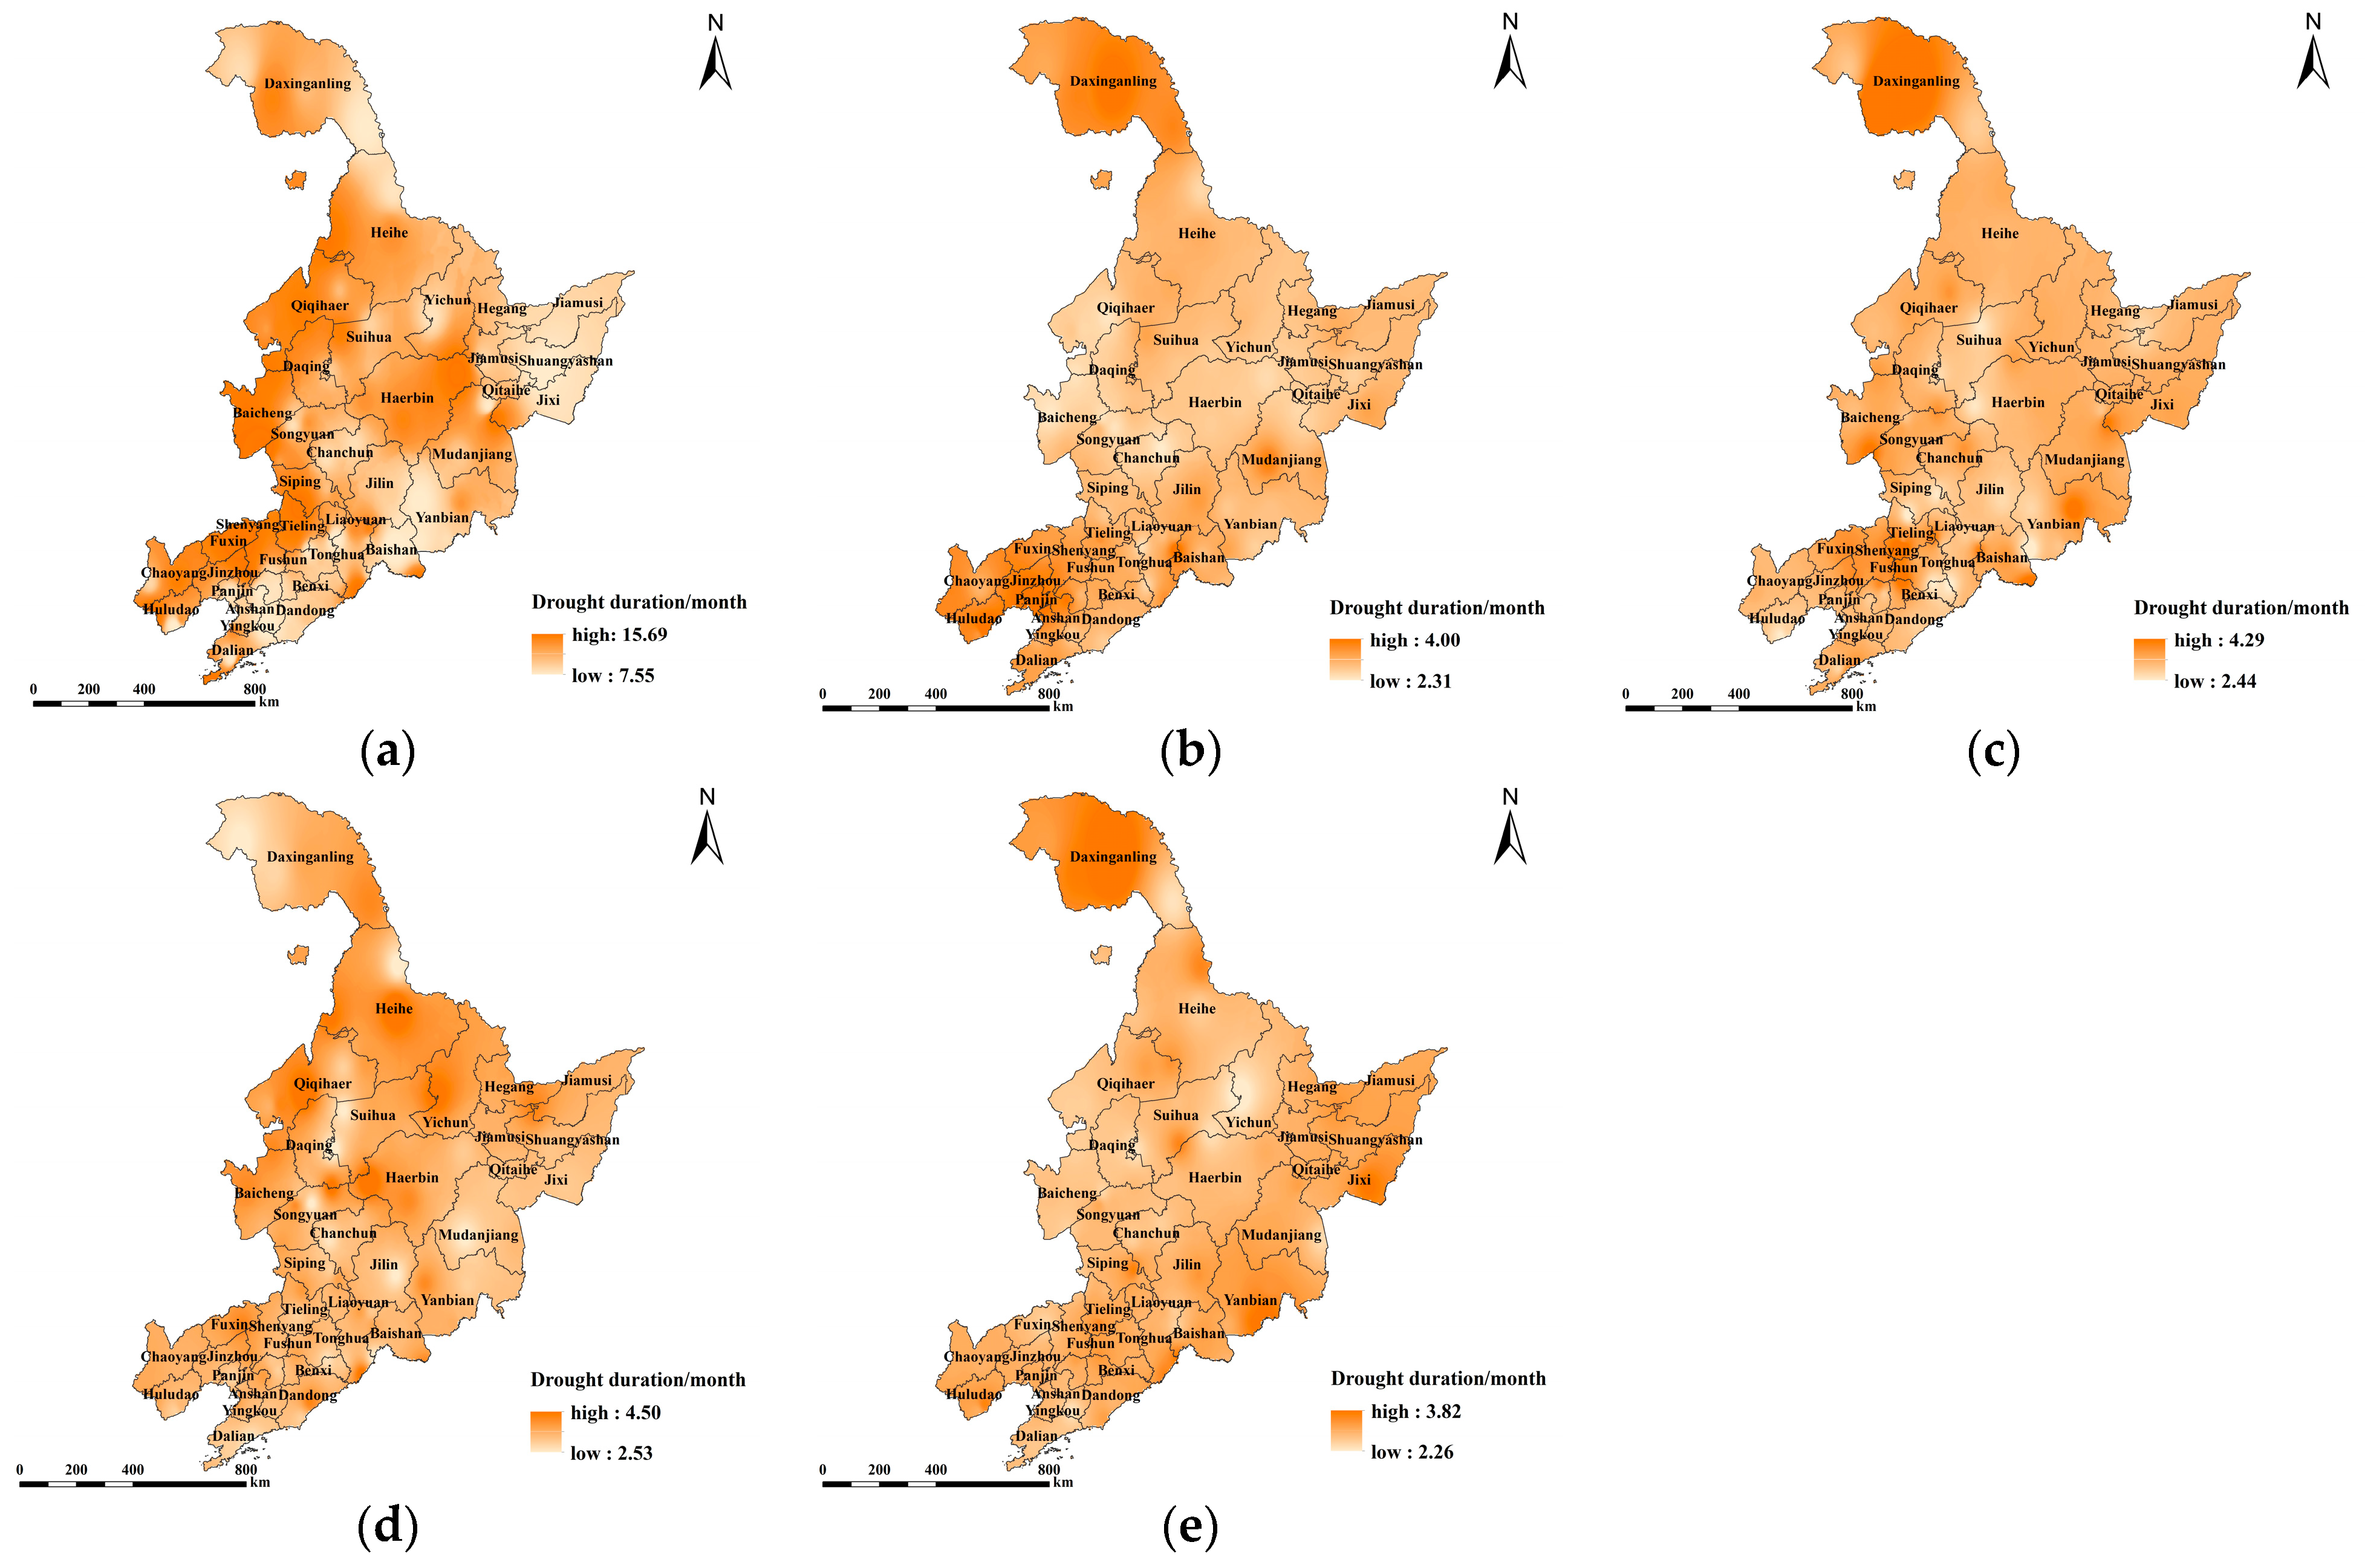
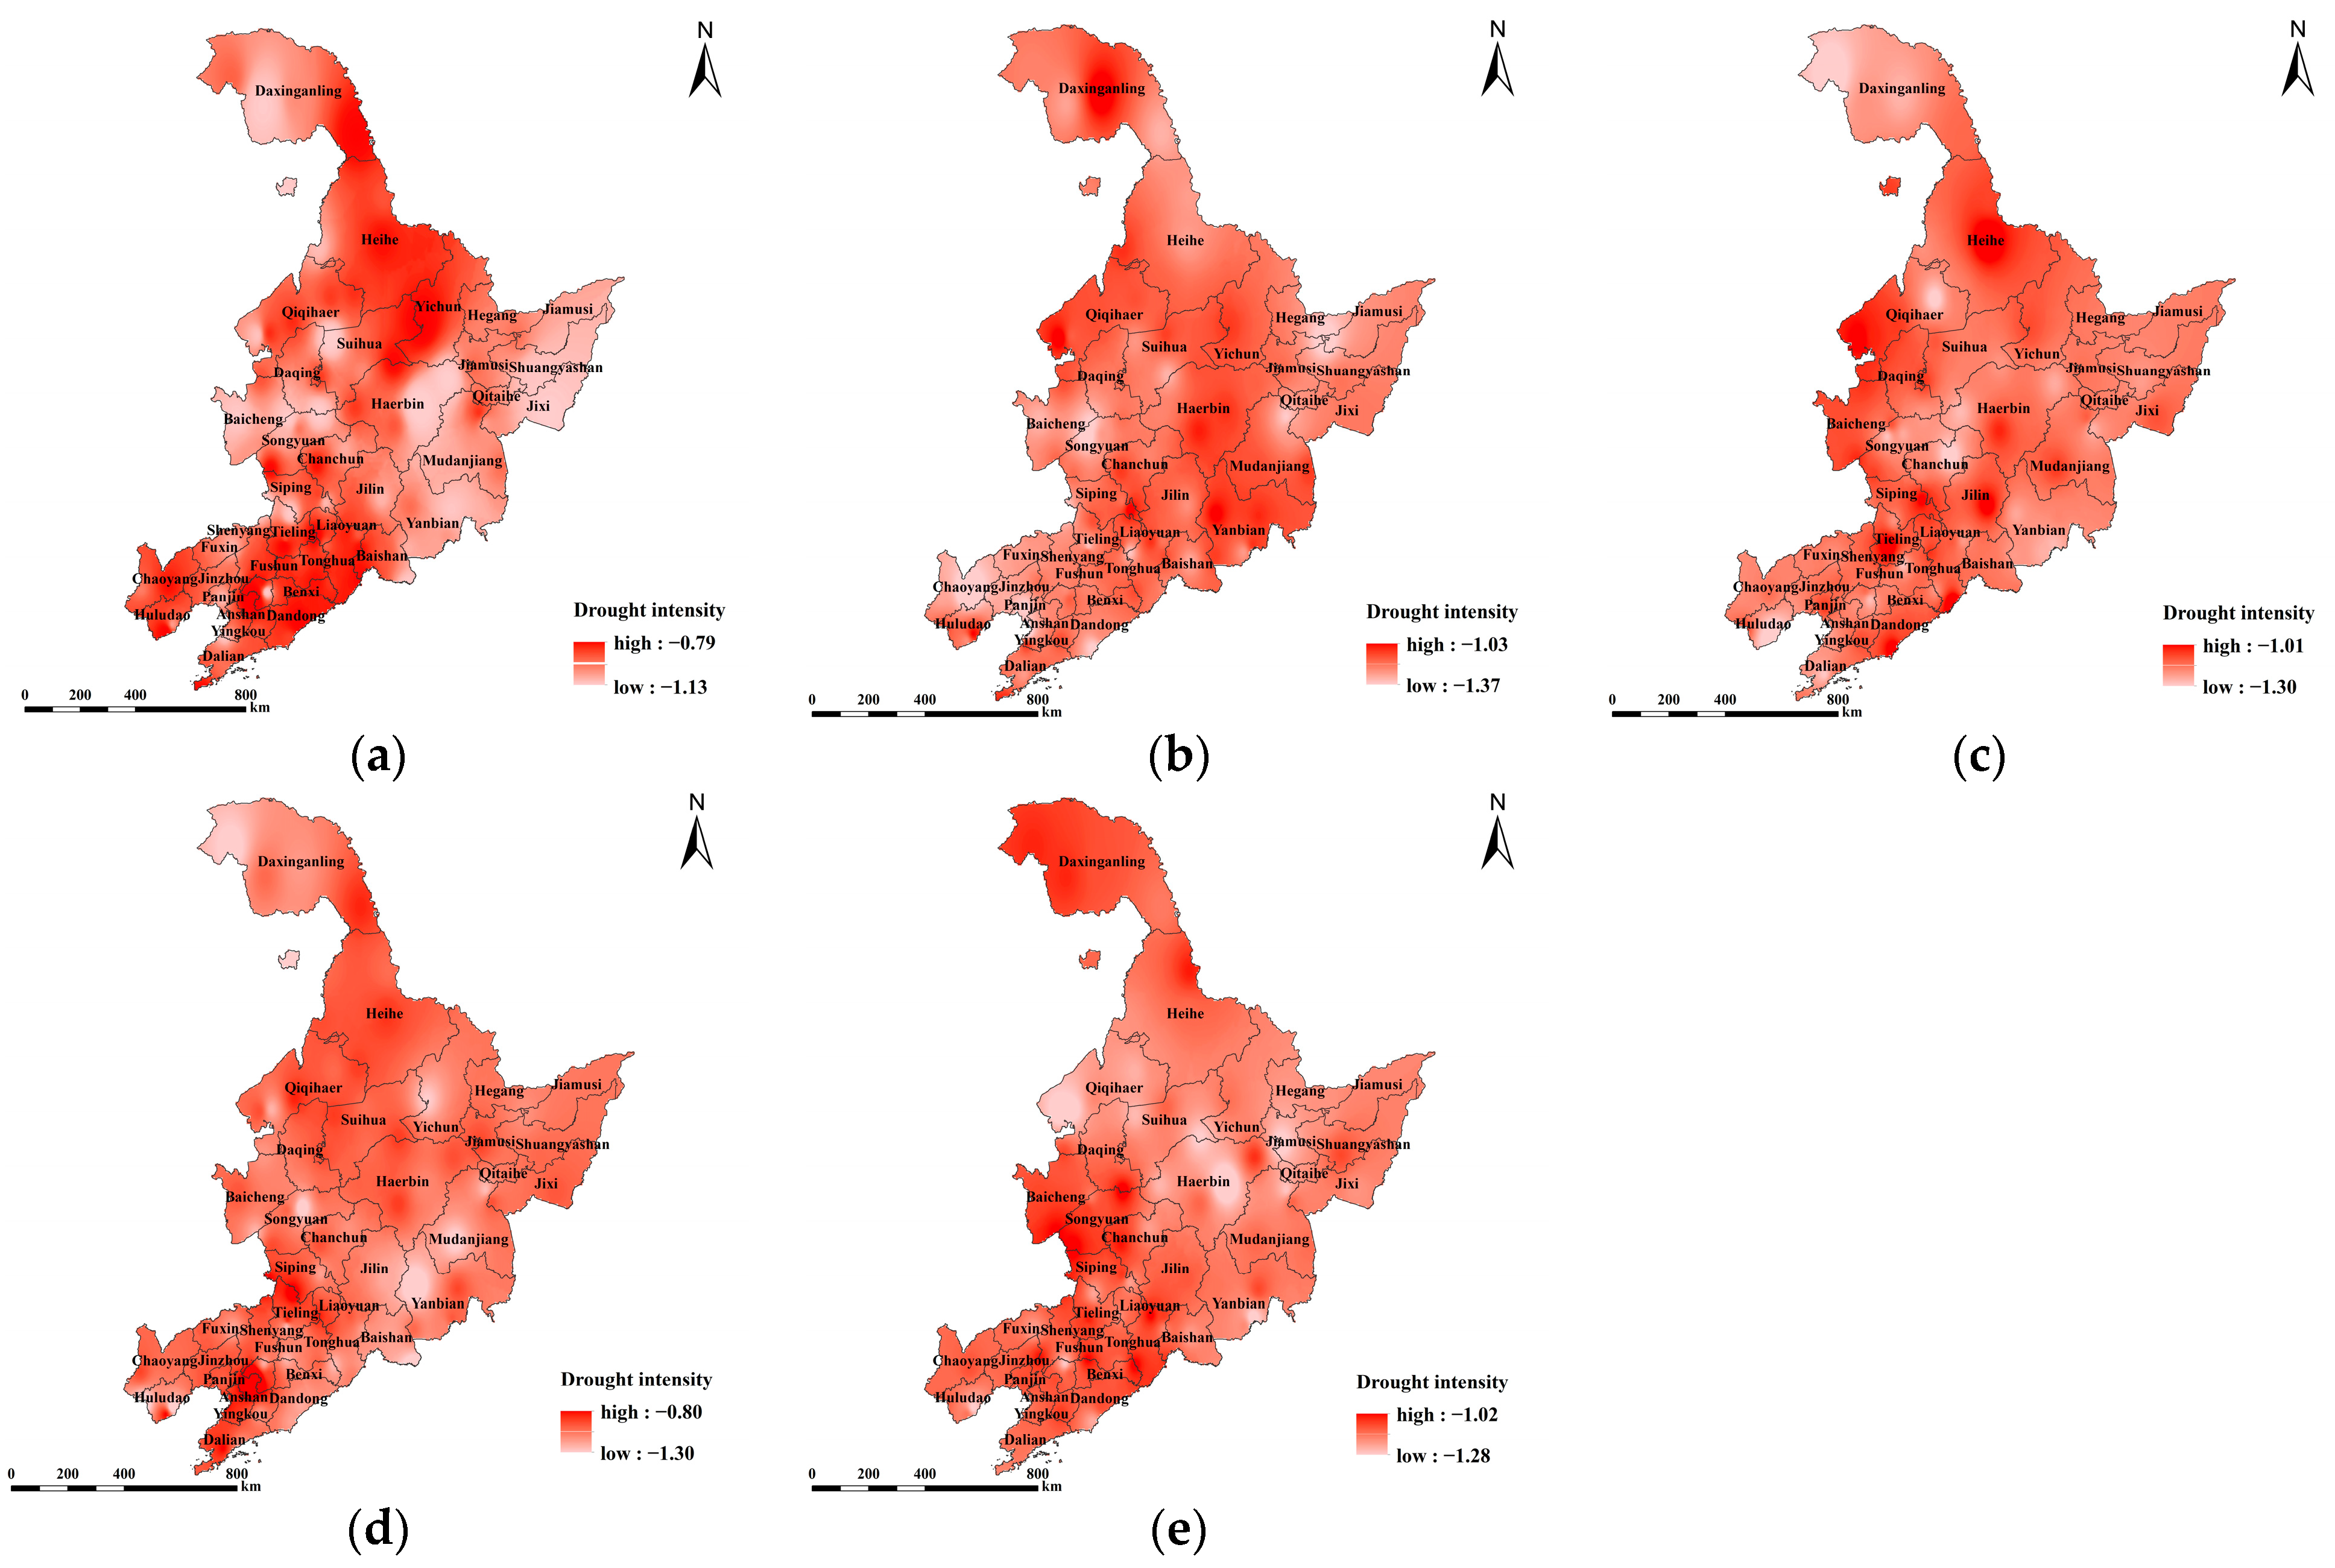
4.2.2. Spatial Characterizations of the Drought Duration and Intensity

To explore the spatial characteristics of the drought duration and intensity in Northeast China from 1961 to 2020, the IDW interpolation method in ArcGIS was utilized to spatially interpolate the processed data and analyze their spatial distribution characteristics.
Figure 8 shows the spatial distributions of the seasonal and interannual drought durations. The range of annual drought durations (Figure 8a) in Northeast China is 7.55 to 15.69 months. Overall, the trend of interannual variability was higher in the west than in the east. The area with the longest drought was Zhangwu County of Liaoning Province (15.71 months). The distributions of drought duration in spring (Figure 8b), summer (Figure 8c), and winter (Figure 8e) differed significantly from the interannual distribution. The region with the longest drought duration was concentrated in the northern part of Heilongjiang Province. Drought duration in autumn (Figure 8d) was more consistent with the interannual variation, and the region with the longest drought duration was located in the northwestern part of Liaoning Province and the western part of Jilin Province (2.53–4.50 months). Longer drought durations in summer and autumn than in spring and winter indicate that although the summer and autumn seasons in Northeast China are characterized by the rainy season, precipitation is concentrated but accompanied by higher temperatures, leading to severe drought.
Figure 9 shows the spatial distribution of seasonal and interannual drought intensities in Northeast China. The spatial distribution of interannual drought intensity (Figure 9a) in the Northeast region ranges from −1.13 to −0.79, and spatially, lower values of drought intensity in the northern parts of Liaoning and Heilongjiang provinces represent more intense droughts. The lowest values of drought intensity occurred near Tonghe County of Heilongjiang Province, with values as low as −1.13. The lowest drought intensity value was in spring, between −1.30 and −1.37. Low-value areas of spring drought intensity (Figure 9b) are concentrated in Jilin Province. The spatial distribution of drought intensity in summer (Figure 9c) was similar to that in spring, with a range of −1.30 to −1.01. The lowest value occurred around Xingcheng City of Liaoning Province, with a value as low as −1.30. Autumn drought intensity (Figure 9d) showed a spatial decreasing trend from north to south, and the low-value area was distributed in Changbai County of Jilin Province and Dunhua City of Jinlin Province, with a value of −1.30. The overall high winter drought intensity (Figure 9e) values indicate a relatively less intense drought. The area of low drought intensity is concentrated in the northern part of Liaoning and Heilongjiang Provinces, with the lowest value occurring in Tonghe County of Heilongjiang Province, with a value of −1.28. The drought intensity generally changed from the north to the south in the four seasons, with a weakening of the aridity trend. The winter drought intensity was more consistent with the spatial distribution of the interannual drought intensity, which was low in the northern part of the south and high in the central part of the study area.

4.3. Spatial and Temporal Variation Characterizations of Drought Frequency in Northeast China

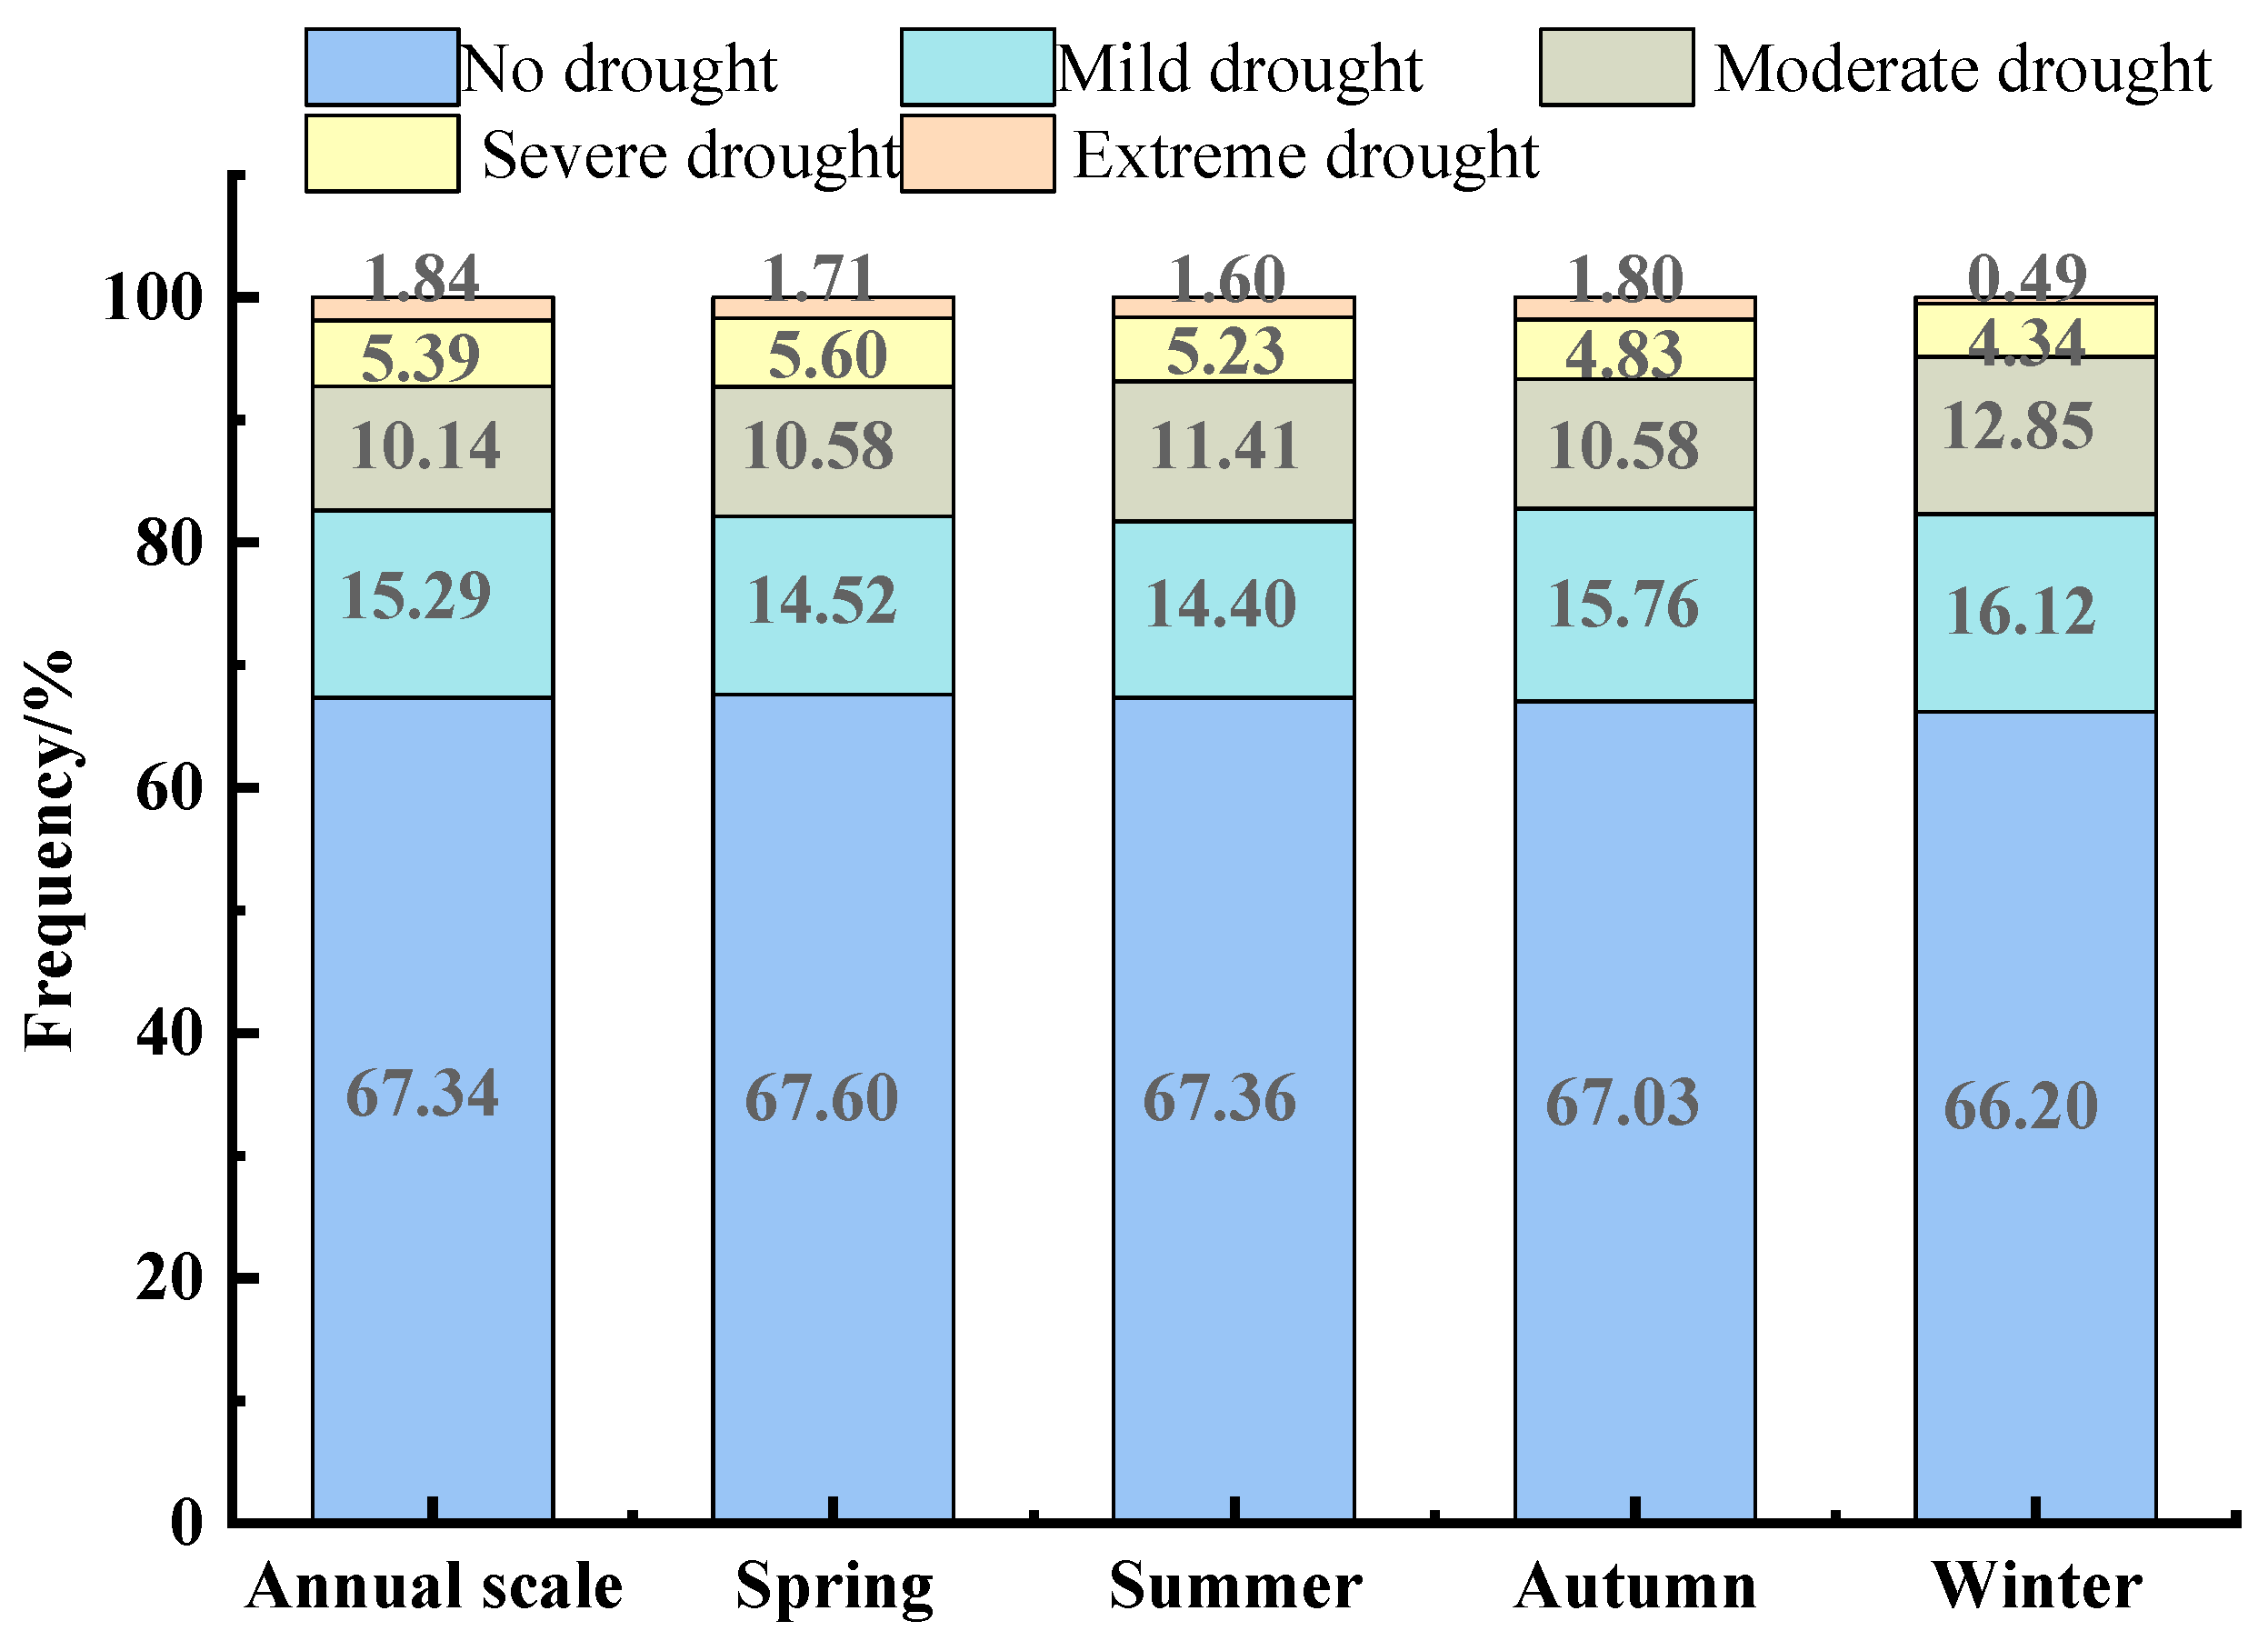
4.3.1. Temporal Characterizations of the Drought Frequency in Northeast China

Figure 10 shows the annual and seasonal drought frequency with different degrees of drought in Northeast China from 1961 to 2020. The drought frequency in Northeast China at the interannual and seasonal scales had apparent similarities. The overall ratio of the frequency of light, moderate, severe, and exceptional droughts was approximately 15:11:5:2. A comparison of the drought frequencies of different grades revealed that light and moderate droughts dominated the study area. The frequency of severe and exceptional droughts was relatively low. The probability of seasonal drought frequency was as follows: winter > fall > summer > spring. The frequency of light drought was approximately 15%. The frequency of moderate drought in winter was higher than that in the other three seasons; the frequency of severe drought in all seasons was approximately 5%. Additionally, the frequency of extreme drought was highest in the fall (1.80%). The frequency of extreme drought in winter was low at only 0.49%.

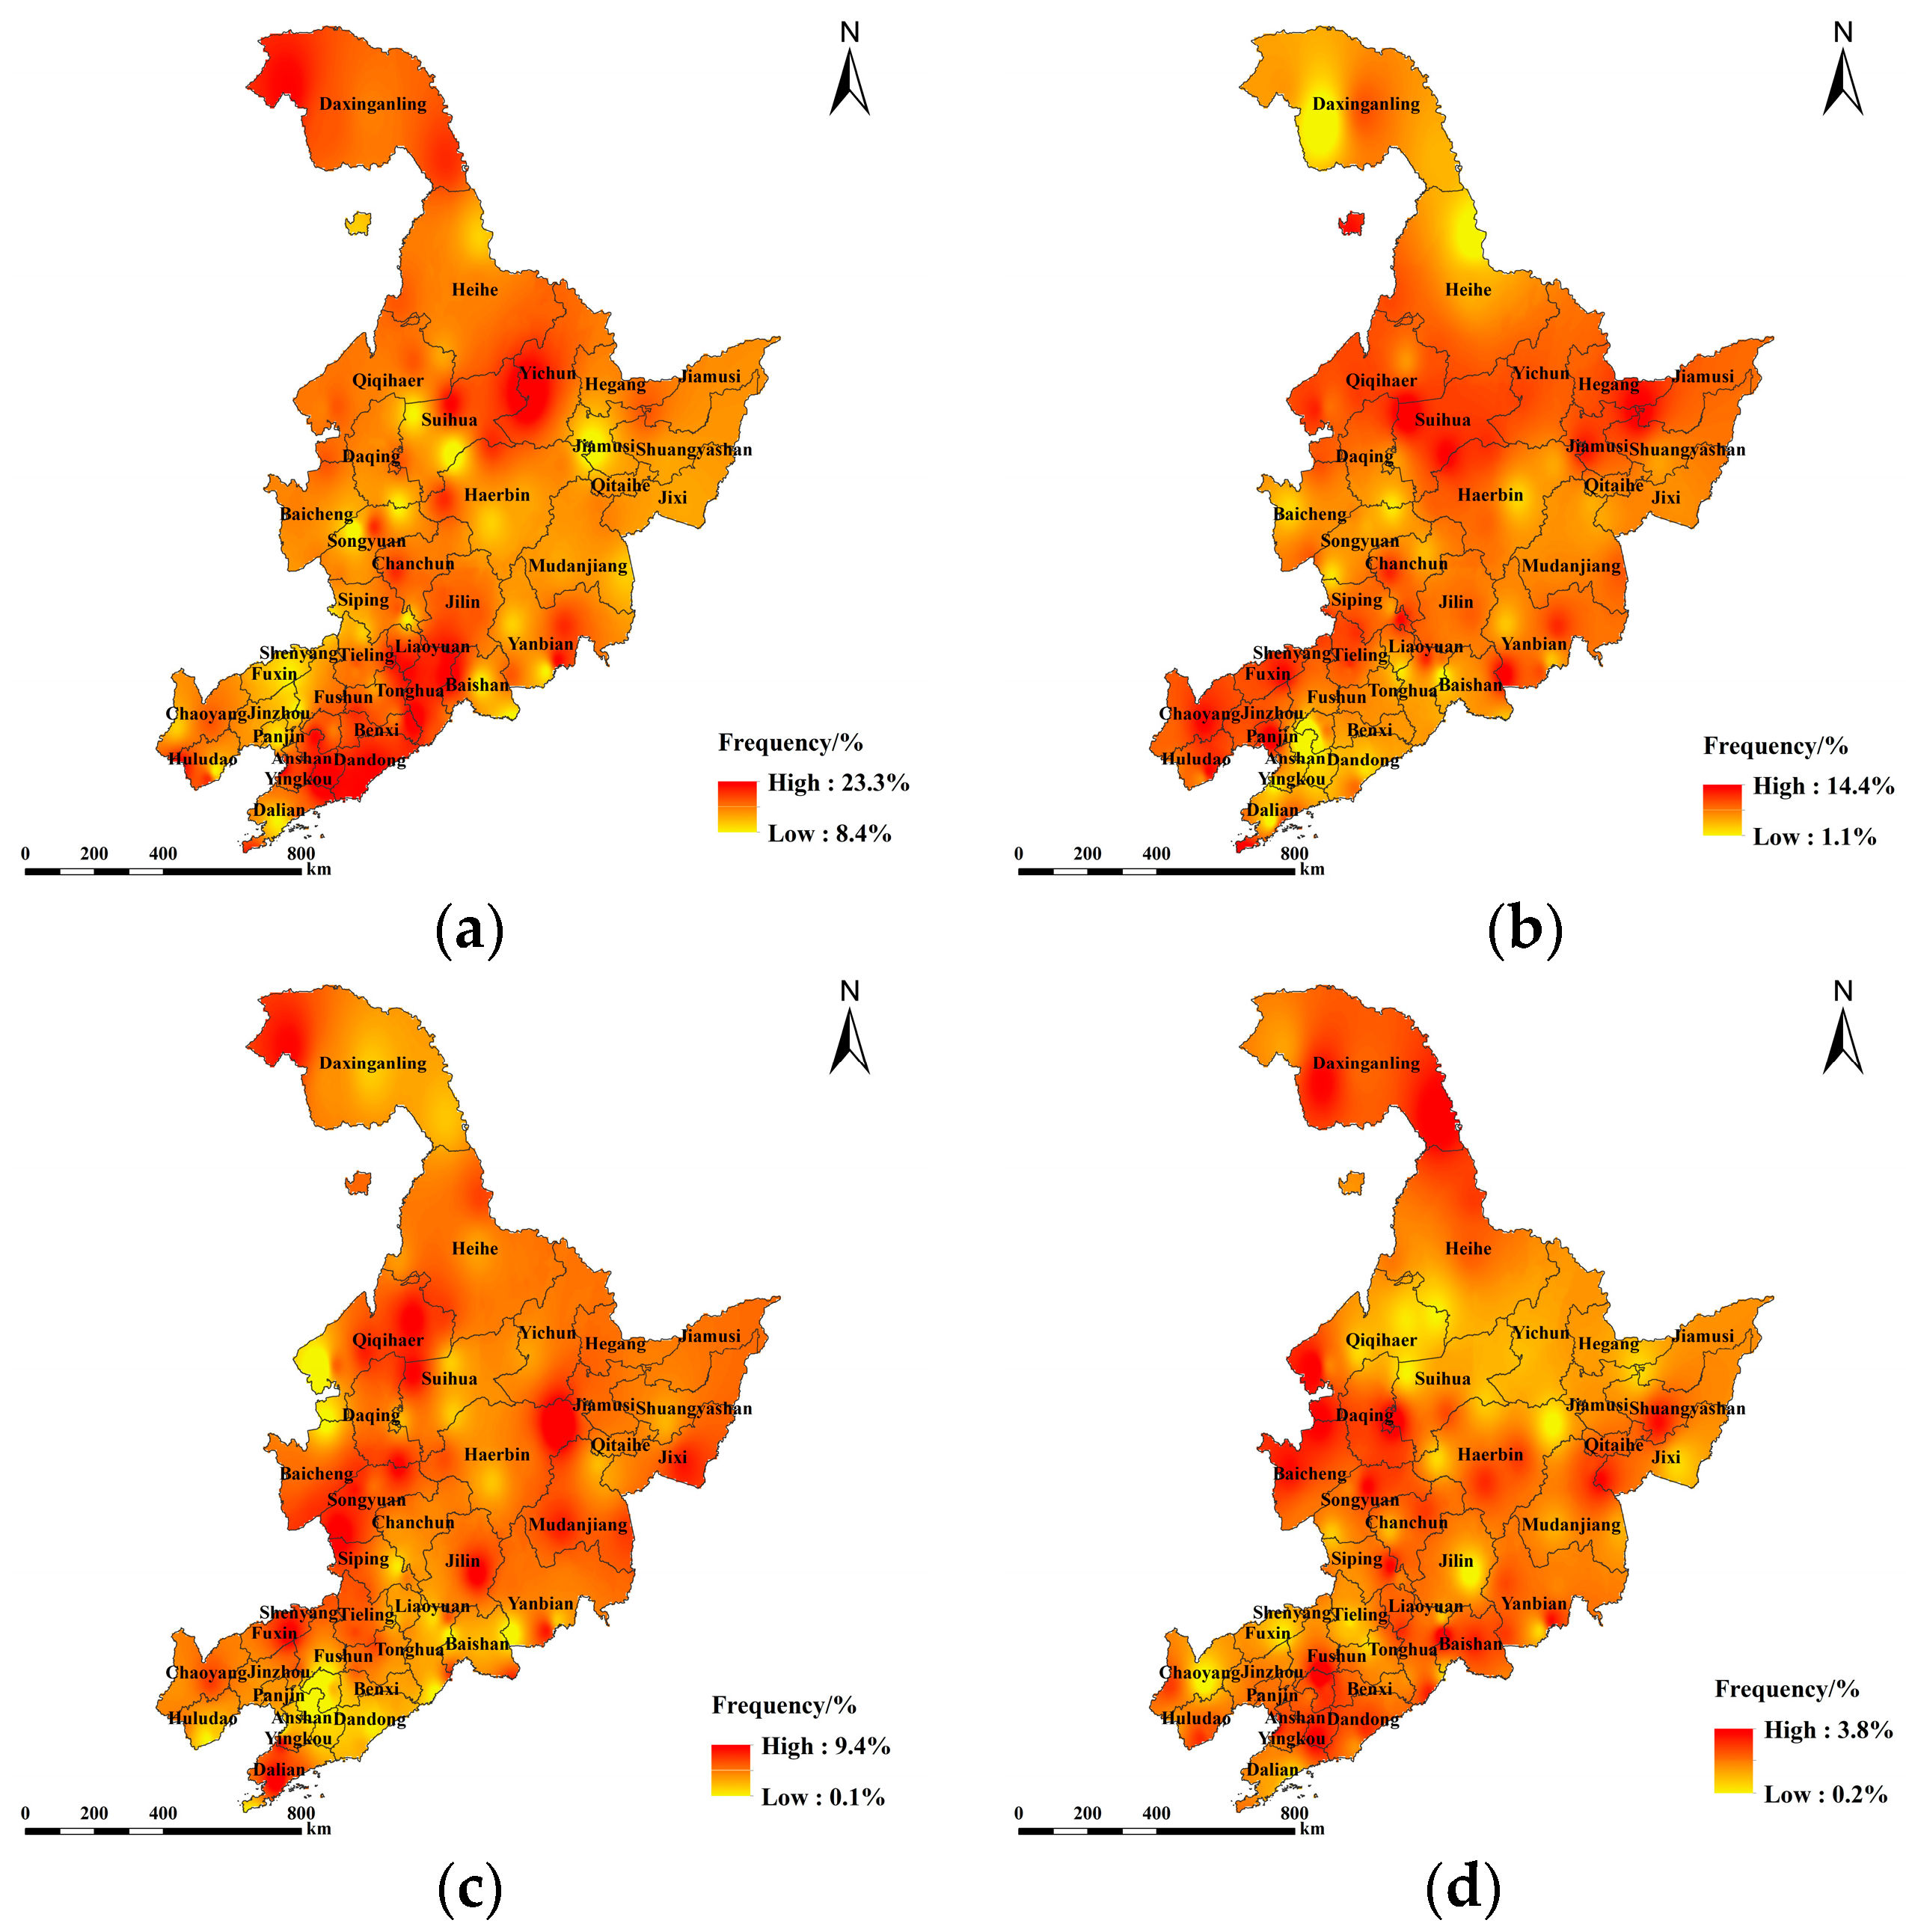
4.3.2. Spatial Characterization of Drought Frequency in Different Drought Degrees in Northeast China

This drought frequency in different drought degrees at each station of Northeast China was calculated over the past 60 years. The interpolation results are presented in Figure 11. There were also significant differences in drought frequency in different drought degrees. The frequency of mild drought (Figure 11a) in Northeast China ranged from 8.4% to 23.3%, showing a spatial distribution characterized by a high level from southeast to northwest and a low level in the rest of the region. The maximum value occurs in the central part of Heilongjiang Province, with a frequency of up to 23.3%, while the low value is concentrated in the western and southern parts of Liaoning Province, with a small amount distributed in the Heilongjiang Province. The spatial distribution of the frequency of moderate droughts (Figure 11b) in Northeast China is roughly opposite to the distribution of light droughts, with higher frequency of moderate drought in central, southwestern, and Northeast China, lower frequency of moderate drought in the north, and drought in western Liaoning Province and southwestern Heilongjiang Province mainly dominated by moderate drought. Anshan City of Liaoning Province was the station with the lowest number of moderate droughts among the three northeastern provinces, with only 7 occurrences, and the southern part of Liaoning Province had the highest number of moderate droughts, with 110 occurrences near Changhai County of Liaoning Province, and the frequency of moderate droughts was as high as 15.51%; The spatial distribution of the frequency of severe drought (Figure 11c) is concentrated in southern Liaoning Province, western Jilin Province, and western and northern Heilongjiang Province, with a relatively even distribution. Among them, Anshan City of Liaoning Province has never experienced a severe drought. The number of severe drought occurrences around Daxinganling of Heilongjiang Province and Changchun City of Jilin Province was high. The station with the highest number of severe drought occurrences was Yilan County of Heilongjiang Province, where severe drought occurred as often as 67 times, with a frequency of 9.54%. There were 65 cities with a frequency of severe drought ranging from 4.23% to 7.48%. The spatial distribution of the frequency of extreme drought (Figure 11d) is mainly concentrated in the eastern part of Liaoning Province, the northwestern part of Jilin Province, and the northern part of Heilongjiang Province; the overall distribution shows more in the northwest and less in the southeast. Shenyang City of Liaoning Province had the highest number of special drought occurrences, totaling 27 occurrences, with a frequency of 3.81%. The least number of occurrences were found in Jiaohe City of Jilin Province and Chaoyang City of Liaoning Province, with only one occurrence of special drought. Among them, Wafangdian City of Liaoning Province and 29 other cities had no more than 10 occurrences of special drought.

5. Discussion

Droughts led to water scarcity, which limits the growth of crops. Long-term continuous drought will lead to a decrease in the quantity and variety of crops, thereby reducing the stability and regenerative capacity of the ecosystem. In this paper, by analyzing the spatiotemporal distribution patterns of droughts in Northeast China, we can assist the government in developing targeted drought resistance strategies for the Northeast drought-stricken areas. At the same time, we can provide a certain scientific basis for relevant departments to adopt reasonable and feasible measures to prevent and resist drought, thereby strengthening and avoiding the threat of drought.
The SPEI has a flexible time scale and fully considers the influence generated by temperature, and the drought events obtained from the treatment tend to be consistent with previous research results [41,48]. Temporal changes in annual-scale drought in Northeast China had prominent interannual characteristics, with the most significant positive and negative fluctuations occurring over the last 10 years; the frequency of severe drought events was higher after 2000. The underlying cause may be global warming and the weakening of the East Asian summer winds in recent years. Yang [49] pointed out that in years with weaker East Asian summer winds, rainfall in northern China is below normal, leading to droughts. At the same time, enhanced East Asian summer winds also bring water vapor into northern China, leading to increased rainfall in northeastern China. However, Wang [50] found that the East Asian summer winds have been weakening since the late 1970s. In terms of the performance of meteorological elements, it is mainly due to the decrease in precipitation and relative humidity and the increase of average and maximum air temperature [51]. The occurrence of severe drought in the 1985–1987 mutation was similar to that reported by Bordi et al. [52] and Yu et al. [53]. Drought became increasingly severe from the 1970s onwards. Ji et al. [54] found that droughts in Northeast China were mainly concentrated in the south and west, and severe droughts mainly occurred in southwest Liaoning, similar to this study. Liu et al. [55] showed that the SPEI had an increasing trend in spring and winter, no significant trend in summer, and a decreasing trend in autumn, which is basically consistent with the results of this study. This study combined the spatial distribution of annual and seasonal propensity rates to analyze drought, which can provide a more comprehensive understanding of the drought characteristics and help to provide the theoretical basis for water resource managers in Northeast China.
The causes of drought are complex and closely related to the climatic conditions, geomorphology, and socioeconomic factors of the study area [56,57,58]. Recently, remote sensing technology has been applied in large-scale, high-resolution applications in the fields of agriculture, meteorology, and hydrology [43,59,60]. Some studies have also proposed the SPEI with a daily scale, which has a more flexible timescale [61,62]. Thus, future research should combine remote sensing with field observation data to better understand the development and distribution of droughts. Besides, while the work presented here assessed drought duration, severity, and frequency in Northeast China, there are some limitations that still need to be addressed. There are other factors that could also be considered, including drought persistence and peak, and the mutual correlations between variables could also be explored [63,64,65]. Thus, a non-stationary approach for the estimation of the joint return period of multidimensional drought variables will be a key addition in future studies.

6. Conclusions

In this study, the Standardized Precipitation Index with two-time scales of 12 and 3 months was calculated and used to identify drought events, including their duration and intensity, based on the run theory in Northeast China. The frequency was analyzed to reveal the spatio-temporal distribution characteristics of droughts. The main conclusions are as follows:
  • From the perspective of the value of SPEI, although there were no extreme drought events in Northeast China from 1961 to 2020, the number of drought years increased significantly. The slope of the interannual SPEI indicates that the drought in the southern part of Northeast China is exacerbating, while the northern part is showing a wetting trend. In summer and autumn, the slope of the SPEI is low, indicating a drying trend and the high value is more common in winter, showing a wet state.
  • From the perspective of the drought duration and intensity, the variations of drought duration are more significant than drought intensity. The drought durations in summer and autumn were longer than that in spring and winter. The spatial distribution characteristics of seasonal drought intensity are generally consistent, showing a gradual weakening from the northern region to the southern region of Northeast China.
  • From the perspective of the frequency of droughts, the frequency of moderate drought in Northeast China is higher than that of severe and extreme drought on the annual scale, and the spatial distribution of severe and extreme drought is similar. The spatial distribution characteristics of drought frequency was a higher frequency in the northern region and a lower frequency in the southern region of Northeast China.

Author Contributions

Conceptualization, R.W. and X.Z.; methodology, R.W.; software, E.G.; validation, R.W., Y.W. and L.C.; formal analysis, R.W. and X.Z.; investigation, R.W.; resources, E.G.; data curation, X.Z.; writing—original draft preparation, R.W. and X.Z.; writing—review and editing, R.W.; visualization, E.G.; supervision, E.G.; project administration, R.W.; funding acquisition, R.W. All authors have read and agreed to the published version of the manuscript.

Funding

This research was funded by “Liaoning Provincial Department of Science and Technology, grant number (2021-BS-257)” Young Talents of Science and Technology in Universities of Inner Mongolia Autonomous Region, grant number (NJYT22028) and “Liaoning Provincial Department of Education, grant number (LJKZ0615 and LJKQZ2021139)”.

Data Availability Statement

The data for this study were obtained from the China Meteorological Science Data Sharing Network (http://cdc.cma.gov.cn, accessed on 10 July 2023).

Acknowledgments

The authors extend their appreciation to the anonymous reviewers for their thoughtful comments and valuable advice.

Conflicts of Interest

The authors declare no conflicts of interest.

References

  1. Van Loon, A.F. Hydrological drought explained. Wiley Interdiscip. Rev. Water 2015, 2, 359–392. [Google Scholar] [CrossRef]
  2. Dai, A. Erratum: Drought under global warming: A review. Wiley Interdiscip. Rev. Clim. Chang. 2012, 3, 617. [Google Scholar] [CrossRef]
  3. Tabari, H.; Abghari, H.; Talaee, P.H. Temporal trends and spatial characteristics of drought and rainfall in arid and semiarid regions of Iran. Hydrol. Process. 2012, 26, 3351–3361. [Google Scholar] [CrossRef]
  4. Touma, D.; Ashfaq, M.; Nayak, M.A.; Kao, S.-C.; Diffenbaugh, N.S. A multi-model and multi-index evaluation of drought characteristics in the 21st century. J. Hydrol. 2015, 526, 196–207. [Google Scholar] [CrossRef]
  5. Zhang, Q.; Qi, T.; Singh, V.P.; Chen, Y.D.; Xiao, M. Regional Frequency Analysis of Droughts in China: A Multivariate Perspective. Water Resour. Manag. 2015, 29, 1767–1787. [Google Scholar] [CrossRef]
  6. Botai, C.M.; Botai, J.O.; Dlamini, L.C.; Zwane, N.S.; Phaduli, E. Characteristics of Droughts in South Africa: A Case Study of Free State and North West Provinces. Water 2016, 8, 439. [Google Scholar] [CrossRef]
  7. Chen, T.; Xia, G.; Liu, T.; Chen, W.; Chi, D. Assessment of Drought Impact on Main Cereal Crops Using a Standardized Precipitation Evapotranspiration Index in Liaoning Province, China. Sustainability 2016, 8, 1069. [Google Scholar] [CrossRef]
  8. Keyantash, J.; Dracup, J.A. The quantification of drought: An evaluation of drought indices. Bull. Am. Meteorol. Soc. 2002, 83, 1167–1180. [Google Scholar] [CrossRef]
  9. Romm, J. The next dust bowl. Nature 2011, 478, 450–451. [Google Scholar] [CrossRef]
  10. Sternberg, T.; Thomas, D.; Middleton, N. Drought dynamics on the Mongolian steppe, 1970–2006. Int. J. Climatol. 2011, 31, 1823–1830. [Google Scholar] [CrossRef]
  11. Svoboda, M.; LeComte, D.; Hayes, M.; Heim, R.; Gleason, K.; Angel, J.; Rippey, B.; Tinker, R.; Palecki, M.; Stooksbury, D.; et al. The drought monitor. Bull. Am. Meteorol. Soc. 2002, 83, 1181–1190. [Google Scholar] [CrossRef]
  12. Han, L.; Zhang, Q.; Yao, Y.; Li, Y.; Jia, J.; Wang, J. Characteristics and origins of drought disasters in Southwest China in nearly 60 years. Acta Geogr. Sin. 2014, 69, 632–639. [Google Scholar]
  13. Below, R.; Grover-Kopec, E.; Dilley, M. Documenting Drought-Related Disasters: A Global Reassessment. J. Environ. Dev. 2007, 16, 328–344. [Google Scholar] [CrossRef]
  14. Keshavarz, M.; Karami, E.; Vanclay, F. The social experience of drought in rural Iran. Land Use Policy 2013, 30, 120–129. [Google Scholar] [CrossRef]
  15. Liu, X.; Zhang, J.; Ma, D.; Bao, Y.; Tong, Z.; Liu, X. Dynamic risk assessment of drought disaster for maize based on integrating multi-sources data in the region of the northwest of Liaoning Province, China. Nat. Hazards 2013, 65, 1393–1409. [Google Scholar] [CrossRef]
  16. Chen, Z.; He, X.; Cook, E.R.; He, H.-S.; Chen, W.; Sun, Y.; Cui, M. Detecting dryness and wetness signals from tree-rings in Shenyang, Northeast China. Palaeogeogr. Palaeoclimatol. Palaeoecol. 2011, 302, 301–310. [Google Scholar] [CrossRef]
  17. Yu, X.; He, X.; Zheng, H.; Guo, R.; Ren, Z.; Zhang, D.; Lin, J. Spatial and temporal analysis of drought risk during the crop-growing season over northeast China. Nat. Hazards 2014, 71, 275–289. [Google Scholar] [CrossRef]
  18. Palmer, W.C. Meteorological Drought; Research Paper 45; U.S. Department of Commerce, Weather Bureau: Washington, DC, USA, 1965. [Google Scholar]
  19. McKee, B.T.; Nolan, J.; Kleist, J. The relationship of drought frequency and duration to time scales. In Proceedings of the 8th Conference on Applied Climatology, Boston, MA, USA, 17–22 January 1993; pp. 179–184. [Google Scholar]
  20. Ionita, M.; Scholz, P.; Chelcea, S. Spatio-temporal variability of dryness/wetness in the Danube River Basin. Hydrol. Process. 2015, 29, 4483–4497. [Google Scholar] [CrossRef]
  21. Li, X.; He, B.; Quan, X.; Liao, Z.; Bai, X. Use of the Standardized Precipitation Evapotranspiration Index (SPEI) to Characterize the Drying Trend in Southwest China from 1982–2012. Remote Sens. 2015, 7, 10917–10937. [Google Scholar] [CrossRef]
  22. Toernros, T.; Menzel, L. Addressing drought conditions under current and future climates in the Jordan River region. Hydrol. Earth Syst. Sci. 2014, 18, 305–318. [Google Scholar] [CrossRef]
  23. Vicente-Serrano, S.M.; Begueria, S.; Lorenzo-Lacruz, J.; Julio Camarero, J.; Lopez-Moreno, J.I.; Azorin-Molina, C.; Revuelto, J.; Moran-Tejeda, E.; Sanchez-Lorenzo, A. Performance of Drought Indices for Ecological, Agricultural, and Hydrological Applications. Earth Interact. 2012, 16, 1–27. [Google Scholar] [CrossRef]
  24. Tang, W.J.; Yang, K.; Qin, J.; Cheng, C.C.K.; He, J. Solar radiation trend across China in recent decades: A revisit with quality-controlled data. Atmos. Chem. Phys. 2011, 11, 393–406. [Google Scholar] [CrossRef]
  25. Fan, Z.-X.; Thomas, A. Decadal changes of reference crop evapotranspiration attribution: Spatial and temporal variability over China 1960–2011. J. Hydrol. 2018, 560, 461–470. [Google Scholar] [CrossRef]
  26. Vicente-Serrano, S.M.; Begueria, S.; Lopez-Moreno, J.I. A Multiscalar Drought Index Sensitive to Global Warming: The Standardized Precipitation Evapotranspiration Index. J. Clim. 2010, 23, 1696–1718. [Google Scholar] [CrossRef]
  27. Begueria, S.; Vicente-Serrano, S.M.; Reig, F.; Latorre, B. Standardized precipitation evapotranspiration index (SPEI) revisited: Parameter fitting, evapotranspiration models, tools, datasets and drought monitoring. Int. J. Climatol. 2014, 34, 3001–3023. [Google Scholar] [CrossRef]
  28. Yao, N.; Li, L.; Feng, P.; Feng, H.; Li Liu, D.; Liu, Y.; Jiang, K.; Hu, X.; Li, Y. Projections of drought characteristics in China based on a standardized precipitation and evapotranspiration index and multiple GCMs. Sci. Total Environ. 2020, 704, 135245. [Google Scholar] [CrossRef]
  29. Gao, X.; Zhao, Q.; Zhao, X.; Wu, P.; Pan, W.; Gao, X.; Sun, M. Temporal and spatial evolution of the standardized precipitation evapotranspiration index (SPEI) in the Loess Plateau under climate change from 2001 to 2050. Sci. Total Environ. 2017, 595, 191–200. [Google Scholar] [CrossRef]
  30. Lee, S.-H.; Yoo, S.-H.; Choi, J.-Y.; Bae, S. Assessment of the Impact of Climate Change on Drought Characteristics in the Hwanghae Plain, North Korea Using Time Series SPI and SPEI: 1981–2100. Water 2017, 9, 579. [Google Scholar] [CrossRef]
  31. Tan, C.; Yang, J.; Li, M. Temporal-Spatial Variation of Drought Indicated by SPI and SPEI in Ningxia Hui Autonomous Region, China. Atmosphere 2015, 6, 1399–1421. [Google Scholar] [CrossRef]
  32. Jiang, R.; Xie, J.; He, H.; Luo, J.; Zhu, J. Use of four drought indices for evaluating drought characteristics under climate change in Shaanxi, China: 1951–2012. Nat. Hazards 2015, 75, 2885–2903. [Google Scholar] [CrossRef]
  33. Tam, B.Y.; Szeto, K.; Bonsal, B.; Flato, G.; Cannon, A.J.; Rong, R. CMIP5 drought projections in Canada based on the Standardized Precipitation Evapotranspiration Index. Can. Water Resour. J. 2019, 44, 90–107. [Google Scholar] [CrossRef]
  34. Zuo, D.; Cai, S.; Xu, Z.; Peng, D.; Kan, G.; Sun, W.; Pang, B.; Yang, H. Assessment of meteorological and agricultural droughts using in-situ observations and remote sensing data. Agric. Water Manag. 2019, 222, 125–138. [Google Scholar] [CrossRef]
  35. Shi, X.; Yang, Y.; Ding, H.; Chen, F.; Shi, M. Analysis of the Variability Characteristics and Applicability of SPEI in Mainland China from 1985 to 2018. Atmosphere 2023, 14, 790. [Google Scholar] [CrossRef]
  36. Yevjevich, V. An objective approach to definitions and investigations of continental hydrologic droughts: Vujica Yevjevich: Fort Collins, Colorado State University, 1967, 19 p. (Hydrology paper no. 23). J. Hydrol. 1969, 7, 353. [Google Scholar] [CrossRef]
  37. Sen, Z. Statistical-Analysis of Hydrologic Critical Droughts. J. Hydraul. Div. 1980, 106, 99–115. [Google Scholar] [CrossRef]
  38. Zhai, L.; Feng, Q. Spatial and temporal pattern of precipitation and drought in Gansu Province, Northwest China. Nat. Hazards 2009, 49, 1–24. [Google Scholar] [CrossRef]
  39. Dash, B.K.; Rafiuddin, M.; Khanam, F.; Islam, M.N. Characteristics of meteorological drought in Bangladesh. Nat. Hazards 2012, 64, 1461–1474. [Google Scholar] [CrossRef]
  40. Burke, E.J.; Brown, S.J. Regional drought over the UK and changes in the future. J. Hydrol. 2010, 394, 471–485. [Google Scholar] [CrossRef]
  41. Yang, G.; Shao, W.; Wang, H.; Han, D. Drought Evolution Characteristics and Attribution Analysis in Northeast China. Procedia Eng. 2016, 154, 749–756. [Google Scholar] [CrossRef]
  42. Sun, X.; Wang, M.; Li, G.; Wang, Y. Regional-scale drought monitor using synthesized index based on remote sensing in Northeast China. Open Geosci. 2020, 12, 163–173. [Google Scholar] [CrossRef]
  43. Zhang, L.; Yao, Y.; Bei, X.; Jia, K.; Zhang, X.; Xie, X.; Jiang, B.; Shang, K.; Xu, J.; Chen, X. Assessing the Remotely Sensed Evaporative Drought Index for Drought Monitoring over Northeast China. Remote Sens. 2019, 11, 1960. [Google Scholar] [CrossRef]
  44. Wang, X.; Shen, H.; Zhang, W.; Cao, J.; Qi, Y.; Chen, G.; Li, X. Spatial and temporal characteristics of droughts in the Northeast China Transect. Nat. Hazards 2015, 76, 601–614. [Google Scholar] [CrossRef]
  45. Pei, Z.; Wu, B. Spatial-Temporal Characteristics of Spring Maize Drought in Songnen Plain, Northeast China. Water 2023, 15, 1618. [Google Scholar] [CrossRef]
  46. Thornthwaite, C.W. An approach toward a rational classification of climate. Geogr. Rev. 1948, 38, 55–94. [Google Scholar] [CrossRef]
  47. GB/T 20481-2017; General Administration of Quality Supervision, Inspection and Quarantine of the People’s Republic of China. Grades of Meteorological Drought. Standards Press of China: Beijing, China, 2017. (In Chinese)
  48. Xue, L.; Kappas, M.; Wyss, D.; Putzenlechner, B. Assessing the Drought Variability in Northeast China over Multiple Temporal and Spatial Scales. Atmosphere 2016, 154, 1506. [Google Scholar] [CrossRef]
  49. Yang, H.; Zhi, X.; Gao, J.; Liu, Y. Variation of East Asian Summer Monsoon and Its Relationship with Precipitation of China in Recent 111 Years. Agric. Sci. Technol. 2011, 12, 1711–1716. [Google Scholar]
  50. Wang, H.J. The weakening of the Asian monsoon circulation after the end of 1970′s. Adv. Atmos. Sci. 2001, 18, 376–386. [Google Scholar]
  51. Zhang, X.; Liu, X.; Wang, W.; Zhang, T.; Zeng, X.; Xu, G.; Wu, G.; Kang, H. Spatiotemporal variability of drought in the northern part of northeast China. Hydrol. Process. 2018, 32, 1449–1460. [Google Scholar] [CrossRef]
  52. Bordi, I.; Fraedrich, K.; Jiang, J.M.; Sutera, A. Spatio-temporal variability of dry and wet periods in eastern China. Theor. Appl. Climatol. 2004, 79, 81–91. [Google Scholar] [CrossRef]
  53. Yu, M.; Li, Q.; Hayes, M.J.; Svoboda, M.D.; Heim, R.R. Are droughts becoming more frequent or severe in China based on the Standardized Precipitation Evapotranspiration Index: 1951–2010? Int. J. Climatol. 2014, 34, 545–558. [Google Scholar] [CrossRef]
  54. Ji, L.; Wu, Y.; Ma, J.; Song, C.; Zhu, Z.; Zhao, A. Spatio-temporal variations and drought of spring maize in Northeast China between 2002 and 2020. Environ. Sci. Pollut. Res. 2023, 30, 33040–33060. [Google Scholar] [CrossRef] [PubMed]
  55. Yue, Y.; Liu, H.; Mu, X.; Qin, M.; Wang, T.; Wang, Q.; Yan, Y. Spatial and temporal characteristics of drought and its correlation with climate indices in Northeast China. PLoS ONE 2021, 16, e0259774. [Google Scholar] [CrossRef] [PubMed]
  56. Gebremeskel Haile, G.; Tang, Q.; Sun, S.; Huang, Z.; Zhang, X.; Liu, X. Droughts in East Africa: Causes, impacts and resilience. Earth Sci. Rev. 2019, 193, 146–161. [Google Scholar] [CrossRef]
  57. Vido, J.; Nalevanková, P. Drought in the Upper Hron Region (Slovakia) between the Years 1984–2014. Water 2020, 12, 2887. [Google Scholar] [CrossRef]
  58. Zhang, Y.; Xia, J.; Yang, F.; She, D.; Zou, L.; Hong, S.; Wang, Q.; Yuan, F.; Song, L. Analysis of Drought Characteristic of Sichuan Province, Southwestern China. Water 2023, 15, 1601. [Google Scholar] [CrossRef]
  59. Wambura, F.J.; Dietrich, O. Analysis of Agricultural Drought Using Remotely Sensed Evapotranspiration in a Data-Scarce Catchment. Water 2020, 12, 998. [Google Scholar] [CrossRef]
  60. Zhang, Q.; Shi, R.; Xu, C.-Y.; Sun, P.; Yu, H.; Zhao, J. Multisource data-based integrated drought monitoring index: Model development and application. J. Hydrol. 2022, 615, 128644. [Google Scholar] [CrossRef]
  61. Wang, Q.; Zeng, J.; Qi, J.; Zhang, X.; Zeng, Y.; Shui, W.; Xu, Z.; Zhang, R.; Wu, X.; Cong, J. A multi-scale daily SPEI dataset for drought characterization at observation stations over mainland China from 1961 to 2018. Earth Syst. Sci. Data 2021, 13, 331–341. [Google Scholar] [CrossRef]
  62. Wang, Q.; Wu, J.; Li, X.; Zhou, H.; Yang, J.; Geng, G.; An, X.; Liu, L.; Tang, Z. A comprehensively quantitative method of evaluating the impact of drought on crop yield using daily multi-scale SPEI and crop growth process model. Int. J. Biometeorol. 2017, 61, 685–699. [Google Scholar] [CrossRef]
  63. Naderi, K.; Moghaddasi, M.; Shokri, A. Drought Occurrence Probability Analysis Using Multivariate Standardized Drought Index and Copula Function Under Climate Change. Water Resour. Manag. 2022, 36, 2865–2888. [Google Scholar] [CrossRef]
  64. Wen, Y.; Zhou, L.; Kang, L.; Chen, H.; Guo, J. Drought risk analysis based on multivariate copula function in Henan Province, China. Geomat. Nat. Hazards Risk 2023, 14, 2223344. [Google Scholar] [CrossRef]
  65. Hou, Z.; Wang, B.; Zhang, Y.; Zhang, J.; Zhu, D. Drought Hazard Analysis in the Jilin Province Based on a Three-Dimensional Copula Method. Water 2023, 15, 2775. [Google Scholar] [CrossRef]
Figure 1. Distribution of meteorological stations in Northeast China.
Water 16 00234 g001
Figure 2. Identification of drought characteristics based on SPEI using the run theory.
Water 16 00234 g002
Figure 3. Temporal variation characterizations of the SPEI-12 based on the M-K test in Northeast China from 1961 to 2020.
Water 16 00234 g003
Figure 4. Spatial characterizations of the propensity rate of the SPEI-12 in Northeast China from 1961 to 2020.
Water 16 00234 g004
Figure 5. Changes in SPEI-3 and M-K Mutation in the three northeast provinces from 1961 to 2020. (a) Spring; (b) summer; (c) autumn; (d) winter.
Water 16 00234 g005
Figure 6. Spatial distribution map of the seasonal propensity rate in Northeast China from 1961 to 2020. (a) Spring; (b) summer; (c) autumn; (d) winter.
Water 16 00234 g006aWater 16 00234 g006b
Figure 7. The seasonal variation characteristics of the drought duration and intensity in Northeast China from 1961 to 2020. (a) Drought duration; (b) drought intensity.
Water 16 00234 g007
Figure 8. The annual and seasonal spatial distribution of drought duration in Northeast China. (a) Annual scale; (b) spring; (c) summer; (d) autumn; (e) winter.
Water 16 00234 g008
Figure 9. The spatial distribution of drought intensity in Northeast China. (a) Annual scale; (b) spring; (c) summer; (d) autumn; (e) winter.
Water 16 00234 g009
Figure 10. The annual and seasonal variation characteristics of drought frequency in Northeast China from 1961 to 2020.
Water 16 00234 g010
Figure 11. The frequency distribution of droughts in different degrees in Northeast China. (a) Mild drought; (b) moderate drought; (c) severe drought; (d) extreme drought.
Water 16 00234 g011
Table 1. Classification of meteorological drought levels [47].
Drought LevelDrought FreeMild DroughtModerate DroughtSevere DroughtExtreme Drought
SPEI>−0.5(−1.0, −0.5](−1.5, −1.0](−2.0, −1.5]≤−2.0
Disclaimer/Publisher’s Note: The statements, opinions and data contained in all publications are solely those of the individual author(s) and contributor(s) and not of MDPI and/or the editor(s). MDPI and/or the editor(s) disclaim responsibility for any injury to people or property resulting from any ideas, methods, instructions or products referred to in the content.

