
Study on the Spatial–Temporal Variations and Driving Factors of Water Yield in the Yiluo River Basin

Abstract
1. Introduction
2. Materials and Methods
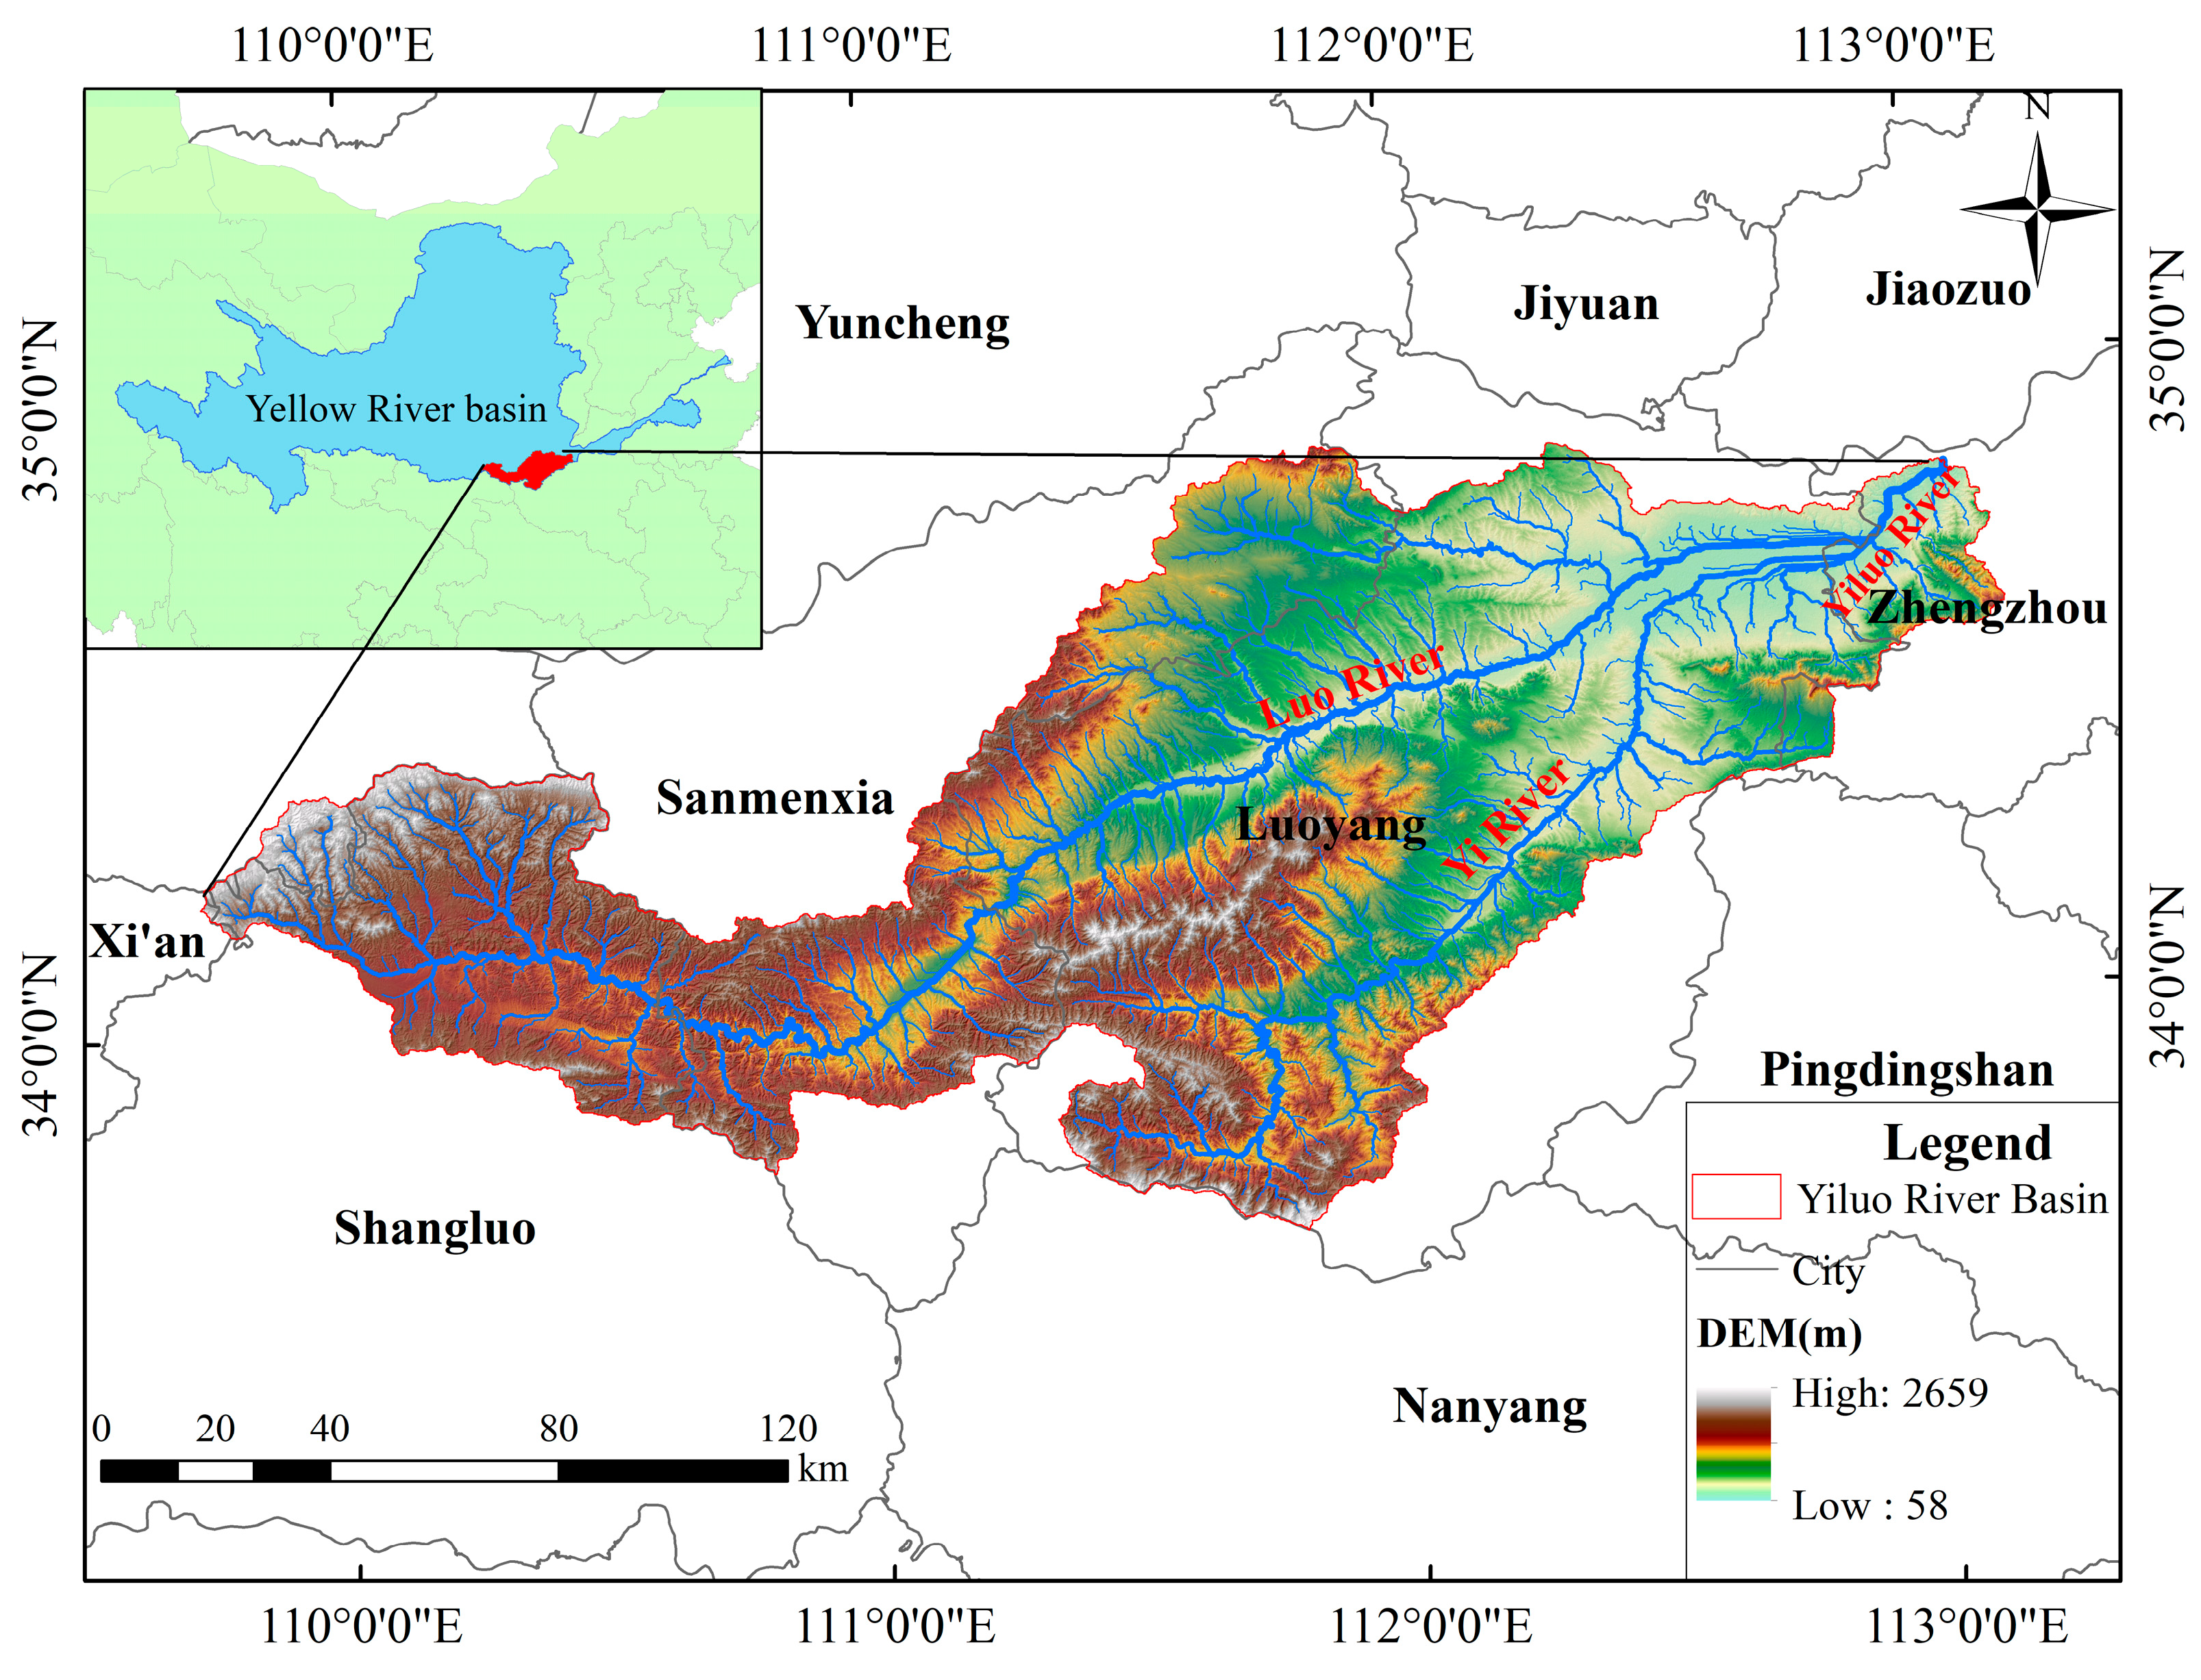
2.1. Study Area
2.2. Data Source and Processing
2.3. InVEST Model
2.4. Study Framework
3. Results
3.1. Temporal Variation Characteristics of WY in the YLRB
3.2. Spatial Variation Characteristics of WY in the YLRB
3.3. ST Pattern of WY at the Sub-Watershed Scale
3.4. Changes in WY Depth and WY of Different LU Types
3.5. Analysis of the Driving Factors Influencing the ST Variation of WY
4. Discussion
5. Conclusions
- (1)
- The overall WY (average water depth) of the YLRB in 2010, 2015, and 2020 was 26.93 × 10⁸ m3 (136.50 mm), 22.86 × 10⁸ m3 (113.38 mm), and 26.81 × 10⁸ m3 (137.61 mm), respectively. The spatial pattern of watershed WY remains consistent across various periods, illustrating spatial variation in the depth of low WY in the central and western regions and high WY depth in the eastern region.
- (2)
- At the sub-watershed scale, the YR Basin, the LR Basin, and the Yiluo River section account for 24%, 69%, and 7% of the total WY in the YLRB, respectively. From 2010 to 2020, the WY of the three basins initially decreased and then increased.
- (3)
- Significant variations exist in WY capacity across diverse LU types. The land types with the highest WY capacity in the YLRB are developed land and undeveloped land. The average WY depth is 315.16 mm and 241.47 mm, respectively. The WA has the lowest WY capacity, with an average WY depth of 0.01 mm.
- (4)
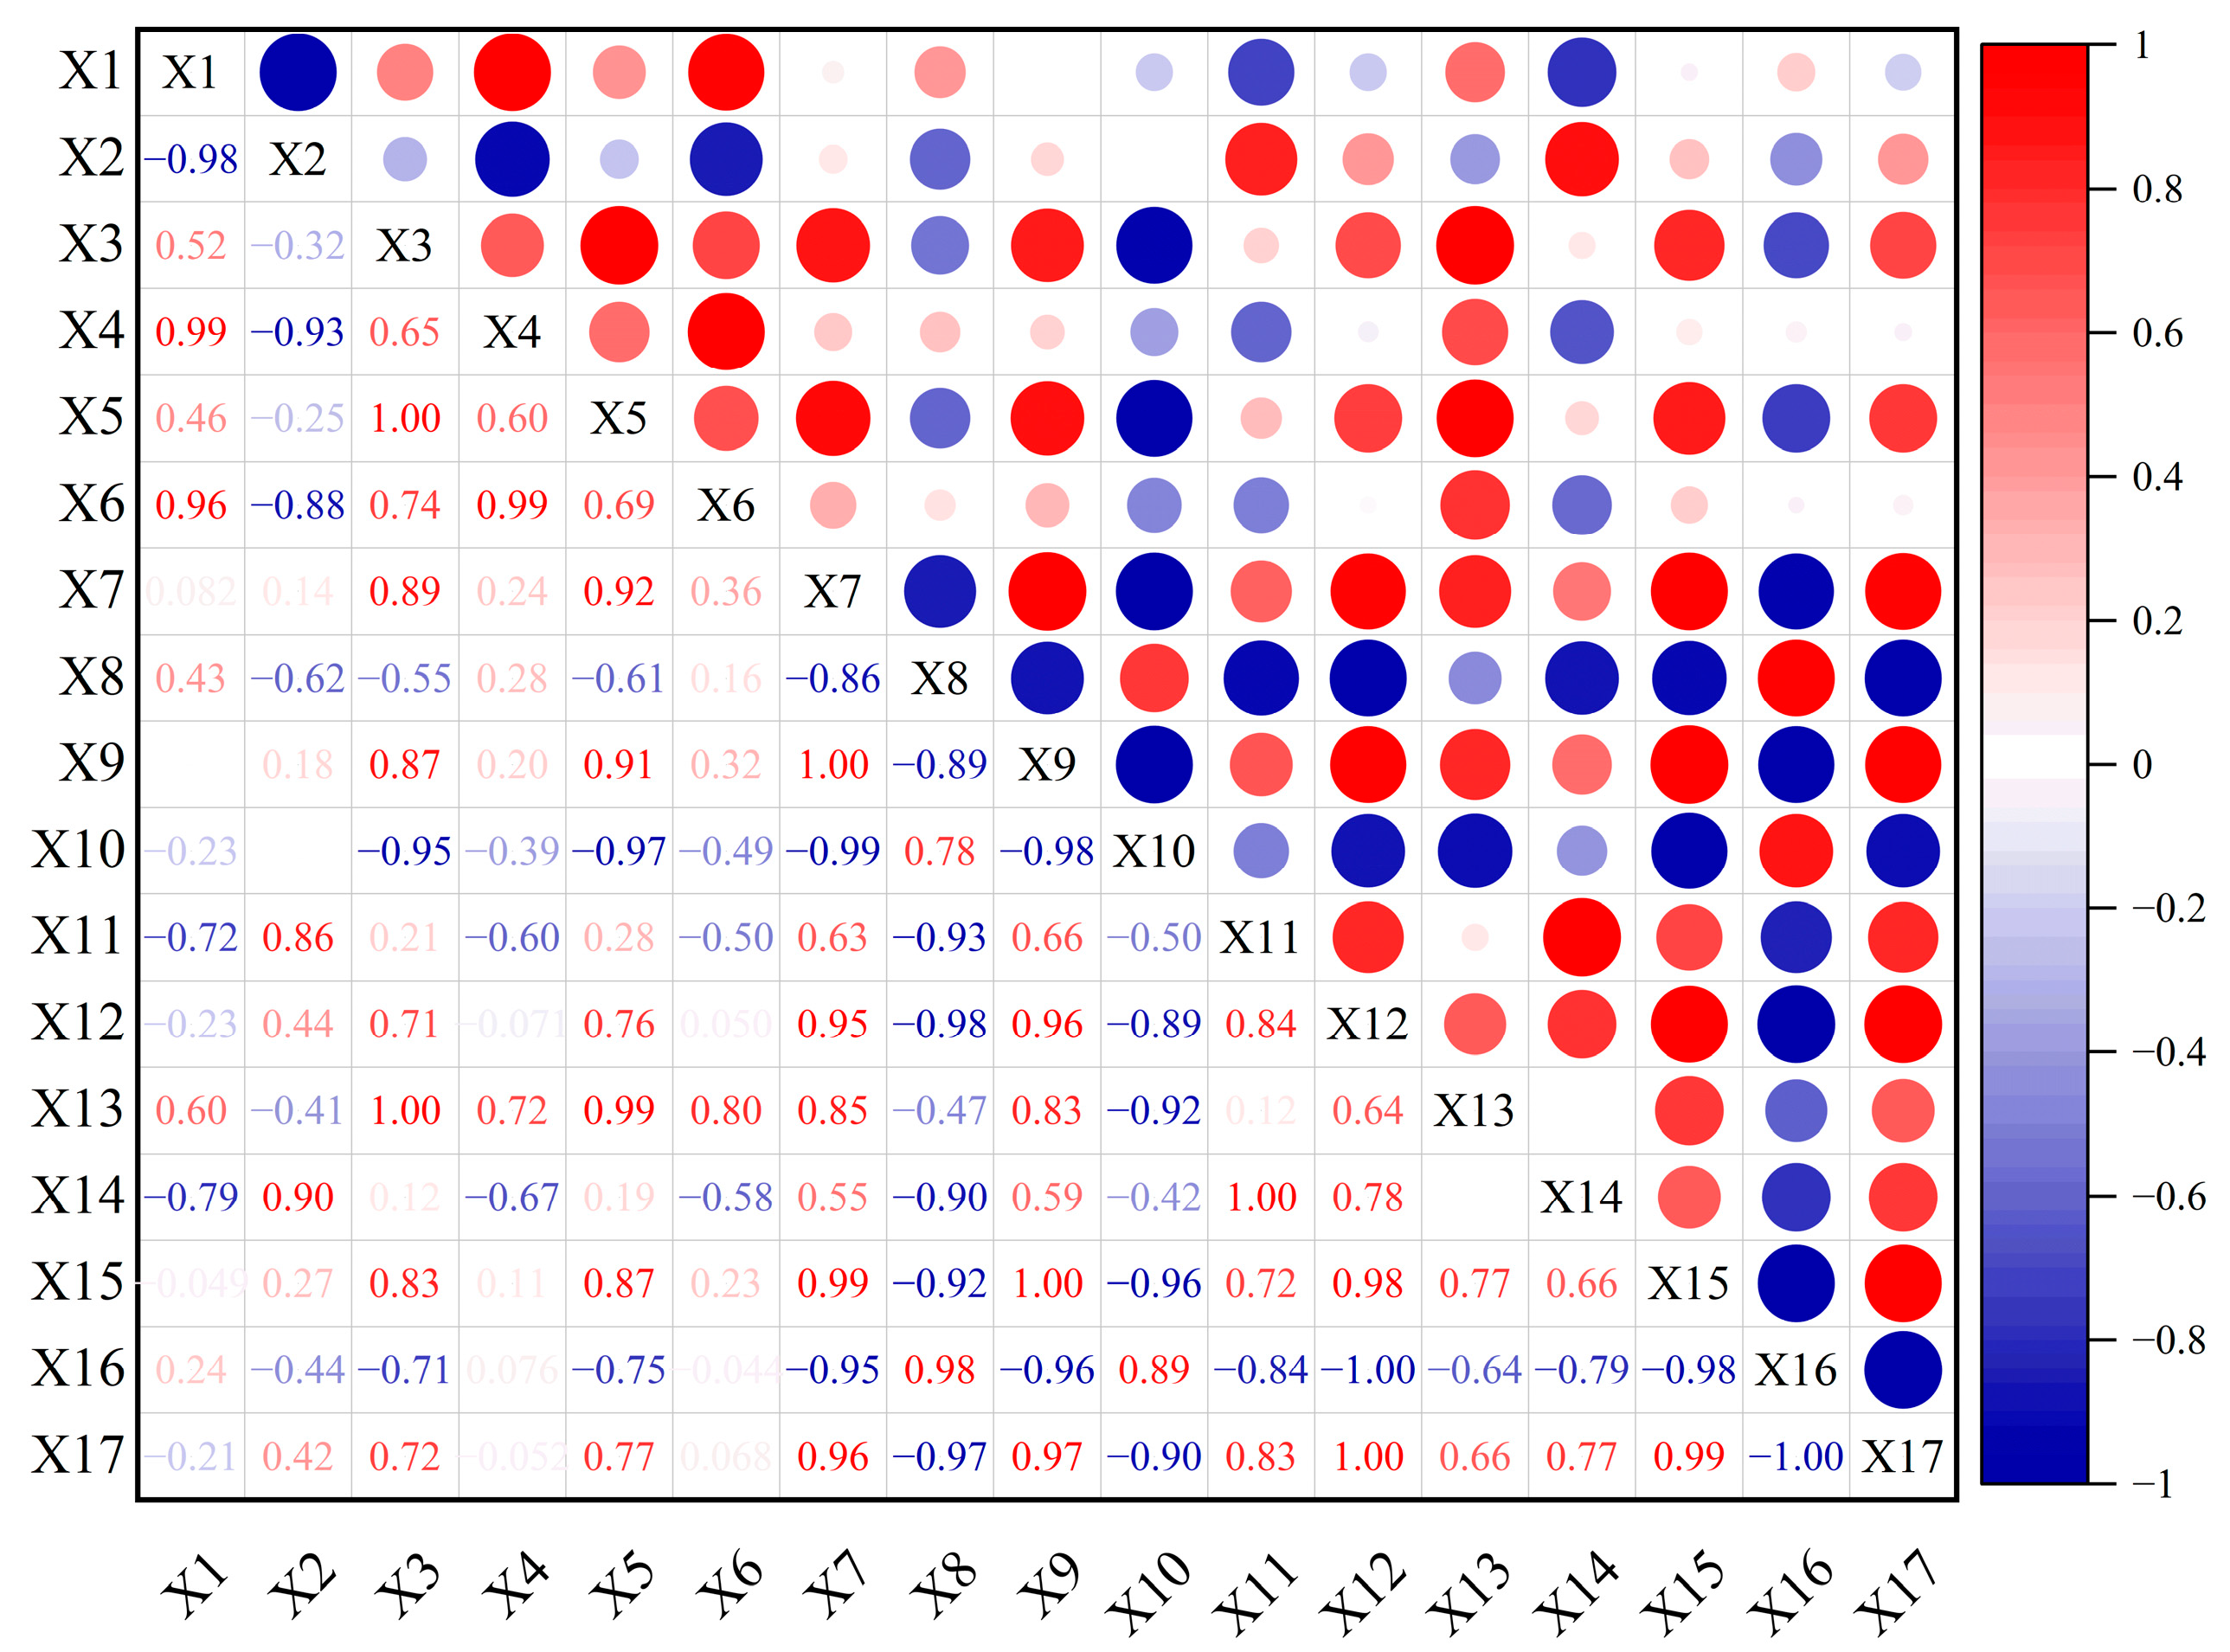
- WY was significantly positively correlated with slope, precipitation, actual evapotranspiration, percentage of CL, and NDVI. It showed a significant negative correlated with altitude, WA, and population density.
Author Contributions
Funding
Data Availability Statement
Acknowledgments
Conflicts of Interest
Abbreviations
| WY | Water yield |
| ST | Spatial and temporal |
| YLRB | Yiluo River Basin |
| YR | Yi River |
| LR | Luo River |
| LU | Land use |
| CL | Cultivated land |
| FL | Forest land |
| GL | Grassland |
| WA | Water area |
| CSL | Construction land |
| UL | Unused land |
References
- Costanza, R.; d’Arge, R.; De Groot, R.; Farber, S.; Grasso, M.; Hannon, B.; Limburg, K.; Naeem, S.; O’neill, R.V.; Paruelo, J. The value of the world’s ecosystem services and natural capital. Nature 1997, 387, 253–260. [Google Scholar] [CrossRef]
- Wang, X.J.; Liu, G.X.; Lin, D.R.; Lin, Y.B.; Lu, Y.; Xiang, A.C.; Xiao, S.M. Water yield service influence by climate and land use change based on InVEST model in the monsoon hilly watershed in South China. Geomat. Nat. Hazards Risk 2022, 13, 2024–2048. [Google Scholar] [CrossRef]
- Yang, D.; Liu, W.; Tang, L.Y.; Chen, L.; Li, X.Z.; Xu, X.L. Estimation of water provision service for monsoon catchments of South China: Applicability of the InVEST model. Landsc. Urban Plan. 2019, 182, 133–143. [Google Scholar] [CrossRef]
- Yang, J.X.; Ma, X.; Zhao, X.Y.; Li, W.Q. Spatiotemporal of the Coupling Relationship between Ecosystem Services and Human Well-Being in Guanzhong Plain Urban Agglomeration. Int. J. Environ. Res. Public Health 2022, 19, 12535. [Google Scholar] [CrossRef] [PubMed]
- Li, Z.H.; Xia, J.; Deng, X.Z.; Yan, H.M. Multilevel modelling of impacts of human and natural factors on ecosystem services change in an oasis, Northwest China. Resour. Conserv. Recycl. 2021, 169, 105474. [Google Scholar] [CrossRef]
- Pessacg, N.; Flaherty, S.; Brandizi, L.; Solman, S.; Pascual, M. Getting water right: A case study in water yield modelling based on precipitation data. Sci. Total Environ. 2015, 537, 225–234. [Google Scholar] [CrossRef] [PubMed]
- Wei, H.; Wang, Y.; Liu, J.; Cao, Y.; Zhang, X. Spatiotemporal Variations of Water Eutrophication and Non-Point Source Pollution Prevention and Control in the Main Stream of the Yellow River in Henan Province from 2012 to 2021. Sustainability 2023, 15, 14754. [Google Scholar] [CrossRef]
- Fanaei, F.; Shahryari, T.; Mortazavi, M.; Nasseh, N.; Pourakbar, M.; Barikbin, B. Hazard identification and integrated risk assessment of drinking water supply system from catchment to consumer based on the World Health Organization’s Water Safety Plan. Desalination Water Treat. 2023, 286, 257–273. [Google Scholar] [CrossRef]
- Wang, X.Z.; Wu, J.Z.; Liu, Y.L.; Hai, X.Y.; Shanguan, Z.P.; Deng, L. Driving factors of ecosystem services and their spatiotemporal change assessment based on land use types in the Loess Plateau. J. Environ. Manag. 2022, 311, 114835. [Google Scholar] [CrossRef]
- Momiyama, H.; Kumagai, T.; Egusa, T. Model analysis of forest thinning impacts on the water resources during hydrological drought periods. For. Ecol. Manag. 2021, 499, 119593. [Google Scholar] [CrossRef]
- Ramteke, G.; Singh, R.; Chatterjee, C. Assessing Impacts of Conservation Measures on Watershed Hydrology Using MIKE SHE Model in the Face of Climate Change. Water Resour. Manag. 2020, 34, 4233–4252. [Google Scholar] [CrossRef]
- Wang, Q.F.; Qi, J.Y.; Wu, H.; Zeng, Y.; Shui, W.; Zeng, J.Y.; Zhang, X.S. Freeze-Thaw cycle representation alters response of watershed hydrology to future climate change. Catena 2020, 195, 104767. [Google Scholar] [CrossRef]
- Guo, Q.; Yu, C.X.; Xu, Z.H.; Yang, Y.; Wang, X. Impacts of climate and land-use changes on water yields: Similarities and differences among typical watersheds distributed throughout China. J. Hydrol. Reg. Stud. 2023, 45, 101294. [Google Scholar] [CrossRef]
- Li, J.H. Identification of ecosystem services supply and demand and driving factors in Taihu Lake Basin. Environ. Sci. Pollut. Res. 2022, 29, 29735–29745. [Google Scholar] [CrossRef] [PubMed]
- Leh, M.D.K.; Matlock, M.D.; Cummings, E.C.; Nalley, L.L. Quantifying and mapping multiple ecosystem services change in West Africa. Agric. Ecosyst. Environ. 2013, 165, 6–18. [Google Scholar] [CrossRef]
- Marquès, M.; Bangash, R.F.; Kumar, V.; Sharp, R.; Schuhmacher, M. The impact of climate change on water provision under a low flow regime: A case study of the ecosystems services in the Francoli river basin. J. Hazard. Mater. 2013, 263, 224–232. [Google Scholar] [CrossRef] [PubMed]
- Redhead, J.W.; Stratford, C.; Sharps, K.; Jones, L.; Ziv, G.; Clarke, D.; Oliver, T.H.; Bullock, J.M. Empirical validation of the InVEST water yield ecosystem service model at a national scale. Sci. Total Environ. 2016, 569, 1418–1426. [Google Scholar] [CrossRef]
- Huang, W.Y.; Wang, P.; He, L.; Liu, B.Y. Improvement of water yield and net primary productivity ecosystem services in the Loess Plateau of China since the “Grain for Green” project. Ecol. Indic. 2023, 154, 110707. [Google Scholar] [CrossRef]
- Lei, J.R.; Zhang, L.; Wu, T.T.; Chen, X.H.; Li, Y.L.; Chen, Z.Z. Spatial-temporal evolution and driving factors of water yield in three major drainage basins of Hainan Island based on land use change. Front. For. Glob. Chang. 2023, 6, 1131264. [Google Scholar] [CrossRef]
- Wang, H.X.; Huang, L.T.; Zhang, H.T.; Fu, Y.C.; Guo, W.X.; Jiao, X.Y.; Zhou, H.T.; Zhu, Y.W. Development of a decision framework for river health and water yield ecosystem service in watershed. J. Hydrol. 2023, 623, 129773. [Google Scholar] [CrossRef]
- Li, Y.L.; He, Y.; Liu, W.Q.; Jia, L.P.; Zhang, Y.R. Evaluation and Prediction of Water Yield Services in Shaanxi Province, China. Forests 2023, 14, 229. [Google Scholar] [CrossRef]
- Wang, P.; Xu, M.X. Dynamics and interactions of water-related ecosystem services in the Yellow River Basin, China. J. Geogr. Sci. 2023, 33, 1681–1701. [Google Scholar] [CrossRef]
- Yang, J.; Xie, B.P.; Zhang, D.G.; Tao, W.Q. Climate and land use change impacts on water yield ecosystem service in the Yellow River Basin, China. Environ. Earth Sci. 2021, 80, 72. [Google Scholar] [CrossRef]
- Duolaiti, X.; Kasimu, A.; Reheman, R.; Aizizi, Y.; Wei, B.H. Assessment of Water Yield and Water Purification Services in the Arid Zone of Northwest China: The Case of the Ebinur Lake Basin. Land 2023, 12, 533. [Google Scholar] [CrossRef]
- Shao, Q.F.; Han, L.B.; Lv, L.F.; Shao, H.Y.; Qi, J.G. Spatiotemporal Variation and Factors Influencing Water Yield Services in the Hengduan Mountains, China. Remote Sens. 2023, 15, 4087. [Google Scholar] [CrossRef]
- Yu, J.; Yuan, Y.W.; Nie, Y.; Ma, E.J.; Li, H.J.; Geng, X.L. The Temporal and Spatial Evolution of Water Yield in Dali County. Sustainability 2015, 7, 6069–6085. [Google Scholar] [CrossRef]
- Song, W.; Deng, X.Z.; Yuan, Y.W.; Wang, Z.; Li, Z.H. Impacts of land-use change on valued ecosystem service in rapidly urbanized North China Plain. Ecol. Model. 2015, 318, 245–253. [Google Scholar] [CrossRef]
- Legesse, D.; Vallet-Coulomb, C.; Gasse, F. Hydrological response of a catchment to climate and land use changes in Tropical Africa: Case study South Central Ethiopia. J. Hydrol. 2003, 275, 67–85. [Google Scholar] [CrossRef]
- Cuo, L.; Beyene, T.K.; Voisin, N.; Su, F.G.; Lettenmaier, D.P.; Alberti, M.; Richey, J.E. Effects of mid-twenty-first century climate and land cover change on the hydrology of the Puget Sound basin, Washington. Hydrol. Process. 2011, 25, 1729–1753. [Google Scholar] [CrossRef]
- Wang, C.H.; Hou, Y.L.; Xue, Y.J. Water resources carrying capacity of wetlands in Beijing: Analysis of policy optimization for urban wetland water resources management. J. Clean. Prod. 2017, 161, 1180–1191. [Google Scholar] [CrossRef]
- Stone, M.C.; Hotchkiss, R.H.; Hubbard, C.M.; Fontaine, T.A.; Mearns, L.O.; Arnold, J.G. Impacts of Climate Change on Missouri Rwer Basin Water Yield. JAWRA J. Am. Water Resour. Assoc. 2001, 37, 1119–1129. [Google Scholar] [CrossRef]
- Zhang, L.; Cheng, L.; Chiew, F.; Fu, B.J. Understanding the impacts of climate and landuse change on water yield. Curr. Opin. Environ. Sustain. 2018, 33, 167–174. [Google Scholar] [CrossRef]
- Li, Y.; Piao, S.L.; Li, L.Z.X.; Chen, A.P.; Wang, X.H.; Ciais, P.; Huang, L.; Lian, X.; Peng, S.S.; Zeng, Z.Z.; et al. Divergent hydrological response to large-scale afforestation and vegetation greening in China. Sci. Adv. 2018, 4, eaar4182. [Google Scholar] [CrossRef] [PubMed]
- Lang, Y.; Song, W.; Zhang, Y. Responses of the water-yield ecosystem service to climate and land use change in Sancha River Basin, China. Phys. Chem. Earth Parts A/B/C 2017, 101, 102–111. [Google Scholar] [CrossRef]
- Hou, J.; Qin, T.L.; Liu, S.S.; Wang, J.W.; Dong, B.Q.; Yan, S.; Nie, H.J. Analysis and Prediction of Ecosystem Service Values Based on Land Use/Cover Change in the Yiluo River Basin. Sustainability 2021, 13, 6432. [Google Scholar] [CrossRef]
- Li, Y.Z.; Wang, H.L.; Zhang, X.; Li, C.H.; Tian, Z.H.; Zhang, Q.F.; Lv, X.Z.; Qin, T.L. Spatiotemporal variations and driving factors of reference evapotranspiration in the Yiluo river basin. Front. Earth Sci. 2023, 10, 1048200. [Google Scholar] [CrossRef]
- Liu, X.M.; Dai, X.Q.; Zhong, Y.D.; Li, J.J.; Wang, P. Analysis of changes in the relationship between precipitation and streamflow in the Yiluo River, China. Theor. Appl. Climatol. 2013, 114, 183–191. [Google Scholar] [CrossRef]
- Huang, Y.; Li, X.P.; Zhao, N.; Niu, X.L.; Yin, D.X.; Qin, L. Analysis on Characteristics of Temporal and Spatial Changes of Land Use in the Yiluo River Basin. Spectrosc. Spectr. Anal. 2022, 42, 3180–3186. [Google Scholar] [CrossRef]
- Hou, J.; Yan, D.H.; Qin, T.L.; Liu, S.S.; Lv, X.Z.; Wang, J.W.; Yan, S.; Zhang, X.; Li, C.H.; Abebe, S.A.; et al. Attribution identification of natural runoff variation in the Yiluo River Basin. J. Hydrol. Reg. Stud. 2023, 48, 101455. [Google Scholar] [CrossRef]
- Ling, M.H.; Yang, Y.Q.; Xu, C.Y.; Yu, L.L.; Xia, Q.Y.; Guo, X.M. Temporal and Spatial Variation Characteristics of Actual Evapotranspiration in the Yiluo River Basin Based on the Priestley-Taylor Jet Propulsion Laboratory Model. Appl. Sci. 2022, 12, 9784. [Google Scholar] [CrossRef]
- Fan, Z.; Wang, X.B.; Zhang, H.J. Water security assessment and driving mechanism in the ecosystem service flow condition. Environ. Sci. Pollut. Res. 2023, 30, 104833–104851. [Google Scholar] [CrossRef] [PubMed]
- Hou, J.; Yan, D.H.; Qin, T.L.; Liu, S.S.; Yan, S.; Li, J.; Abebe, S.A.; Cao, X.C. Evolution and attribution of the water yield coefficient in the Yiluo river basin. Front. Environ. Sci. 2022, 10, 1067318. [Google Scholar] [CrossRef]
- Peng, J.; Liu, Z.; Liu, Y.; Wu, J.; Han, Y. Trend analysis of vegetation dynamics in Qinghai–Tibet Plateau using Hurst Exponent. Ecol. Indic. 2012, 14, 28–39. [Google Scholar] [CrossRef]
- Zhang, L.; Dawes, W.; Walker, G. Response of mean annual evapotranspiration to vegetation changes at catchment scale. Water Resour. Res. 2001, 37, 701–708. [Google Scholar] [CrossRef]
- Zhou, W.Z.; Liu, G.H.; Pan, J.J.; Feng, X.F. Distribution of available soil water capacity in China. J. Geogr. Sci. 2005, 15, 3–12. [Google Scholar] [CrossRef]
- Hu, Y.X.; Yu, X.X.; Liao, W.; Liu, X.X. Spatio-Temporal Patterns of Water Yield and Its Influencing Factors in the Han River Basin. Resour. Environ. Yangtze Basin 2022, 31, 73–82. [Google Scholar]
- Yang, J.; Huang, X. The 30 m annual land cover dataset and its dynamics in China from 1990 to 2019. Earth Syst. Sci. Data 2021, 13, 3907–3925. [Google Scholar] [CrossRef]
- Liu, J.Y.; Zhang, Z.X.; Xu, X.L.; Kuang, W.H.; Zhou, W.C.; Zhang, S.W.; Li, R.D.; Yan, C.Z.; Yu, D.S.; Wu, S.X.; et al. Spatial patterns and driving forces of land use change in China during the early 21st century. J. Geogr. Sci. 2010, 20, 483–494. [Google Scholar] [CrossRef]
- Peng, S.Z.; Ding, Y.X.; Liu, W.Z.; Li, Z. 1 km monthly temperature and precipitation dataset for China from 1901 to 2017. Earth Syst. Sci. Data 2019, 11, 1931–1946. [Google Scholar] [CrossRef]
- Peng, S.Z.; Ding, Y.X.; Wen, Z.M.; Chen, Y.M.; Cao, Y.; Ren, J.Y. Spatiotemporal change and trend analysis of potential evapotranspiration over the Loess Plateau of China during 2011–2100. Agric. For. Meteorol. 2017, 233, 183–194. [Google Scholar] [CrossRef]
- Fischer, G.; Nachtergaele, F.; Prieler, S.; Van Velthuizen, H.; Verelst, L.; Wiberg, D. Global Agro-Ecological Zones Assessment for Agriculture (GAEZ 2008); IIASA: Laxenburg, Austria; FAO: Rome, Italy, 2008; 10p. [Google Scholar]
- Yang, J. Study on Grassland Ecosystem Service and Its Trade-off and Synergy in The Yellow River Basin. Ph.D. Thesis, Gansu Agricultural University, Lanzhou, China, 2022. [Google Scholar]
- Farley, K.A.; Jobbágy, E.G.; Jackson, R.B. Effects of afforestation on water yield: A global synthesis with implications for policy. Glob. Chang. Biol. 2005, 11, 1565–1576. [Google Scholar] [CrossRef]
- Gu, D.J. Analysis on Effects of Land Use and Land Cover Change on Hydrology and Water Resource in Changsha-Zhuzhou-Xiangtan Agglomeration. Master’s Thesis, Hunan Normal University, Changsha, China, 2014. [Google Scholar]
- Wang, Y.H.; Dai, E.F.; Ma, L.; Yin, L. Spatiotemporal and influencing factors analysis of water yield in the Hengduan Mountain region. J. Nat. Resour. 2020, 35, 371–386. [Google Scholar] [CrossRef]
- Sun, X.Y.; Guo, H.W.; Lian, L.S.; Liu, F.; Li, B.F. The Spatial Pattern of Water Yield and Its Driving Factors in Nansi Lake Basin. J. Nat. Resour. 2017, 32, 669–679. [Google Scholar] [CrossRef]
- Xu, J.; Xiao, Y.; Xie, G.D.; Wang, S.; Zhu, W.B. Spatiotemporal analysis of water supply service in the Dongjiang Lake Basin. Acta Ecol. Sin. 2016, 36, 4892–4906. [Google Scholar]
- Li, S.M.; Xie, G.D.; Zhang, C.X.; Ge, L.Q. Flow Process of Water Conservation Service of Forest Ecosystem. J. Nat. Resour. 2010, 25, 585–593. [Google Scholar]
- Zhao, L.X.; Xu, S.F.; Zhao, X.; Li, X.T.; Sun, J.G. Analysis on runoff variation characteristics and trend in Yiluo River Basin in Henan Province. China Flood Drought Manag. 2020, 30, 70–73+97. [Google Scholar] [CrossRef]
- Li, H.X. Attribution Analysis of Runoff Change in Yiluo River Basin Based on Budyko Model. Master’s Thesis, Zhengzhou University, Zhengzhou, China, 2022. [Google Scholar]
- Yang, J.; Xie, B.P.; Zhang, D.G. Spatio-temporal variation of water yield and its response to precipitation and land use change in the Yellow River Basin based on InVEST model. Chin. J. Appl. Ecol. 2020, 31, 2731–2739. [Google Scholar] [CrossRef]
- Zhu, C.X.; Zhong, S.Z.; Long, Y.; Yan, D. Spatiotemporal variation of ecosystem services and their drivers in the Yellow River Basin China. Chin. J. Ecol. 2023, 42, 2502–2513. [Google Scholar] [CrossRef]
- Zhu, D.S.; Lv, X.Z.; Ni, Y.X.; Wei, Y.C. An analysis of the changes in the water yield coefficient in the Yiluo River basin from 2001 to 2018. China Rural. Water Hydropower 2022, 9, 139–145. [Google Scholar]
- Hou, G.R.; Bi, H.X.; Wei, X.; Zhou, Q.Z.; Kong, L.X.; Wang, J.S.; Jia, J.B. Water Conservation Funtion of Litters and Soil in Three Kinds of Woodlands in Gully Region of Loess Plateau. J. Soil Water Conserv. 2018, 32, 357–363+371. [Google Scholar] [CrossRef]
- Kuria, F.W.; Vogel, R.M. A global water supply reservoir yield model with uncertainty analysis. Environ. Res. Lett. 2014, 9, 095006. [Google Scholar] [CrossRef]
- Cong, W.C.; Sun, X.Y.; Guo, H.; Shan, R.F. Comparison of the SWAT and InVEST models to determine hydrological ecosystem service spatial patterns, priorities and trade-offs in a complex basin. Ecol. Indic. 2020, 112, 106089. [Google Scholar] [CrossRef]


| LU Type | LU Type Code | Maximum Root Depth | Vegetation Evapotranspiration Coefficient |
|---|---|---|---|
| Cultivated land (CL) | 1 | 2100 | 0.65 |
| Forest land (FL) | 2 | 5200 | 1.00 |
| Grassland (GL) | 3 | 2300 | 0.65 |
| Water area (WA) | 4 | 100 | 1.00 |
| Construction land (CSL) | 5 | 100 | 0.30 |
| Unused land (UL) | 6 | 100 | 0.50 |
| Datasets | Data | Source |
|---|---|---|
| LU datasets | LU | https://zenodo.org/records/5816591 (accessed on 3 September 2023) [47,48] |
| Meteorological datasets | Average annual precipitation Average annual temperature potential evapotranspiration | http://www.geodata.cn (accessed on 5 September 2023) [49,50] |
| Soil datasets | Sand, silt, clay, OM | HWSD v1.1 [51] |
| Vector datasets | DEM (Digital elevation model) Watershed and sub-watershed | http://www.resdc.cn/ (accessed on 1 September 2023) |
| NDVI datasets | Normalized Difference Vegetation Index | http://www.resdc.cn/ (accessed on 16 September 2023) [43] |
| Social and economic data | Population density GDP Proportions of secondary and tertiary industry | People’s government of the counties and districts in the YLRB, previous years’ statistical yearbooks [38] |
| 2010 | 2015 | 2020 | |
|---|---|---|---|
| Total WY (m3) | 26.93 × 10⁸ | 22.86 × 10⁸ | 26.81 × 10⁸ |
| Average WY depth (mm) | 136.50 | 113.38 | 137.61 |
| Standard deviation | 84.06 | 79.59 | 88.89 |
| Sub-Watershed | Year | 2010 | 2015 | 2020 |
|---|---|---|---|---|
| YR | Average WY depth (mm) | 143.05 | 135.62 | 152.14 |
| WY (billion m3) | 6.00 | 5.68 | 6.36 | |
| LR | Average WY depth (mm) | 125.7 | 94.9 | 122.06 |
| WY (billion m3) | 19.04 | 15.46 | 18.47 | |
| Yiluo River section | Average WY depth (mm) | 177.37 | 161.28 | 186.27 |
| WY (billion m3) | 1.89 | 1.72 | 1.99 |
| LU Type | 2010 | 2015 | 2020 | 2010–2015 Change Value | 2015–2020 Change Value | 2010–2020 Change Value | ||||||
|---|---|---|---|---|---|---|---|---|---|---|---|---|
| Area km2 | Proportion % | Area km2 | Proportion % | Area km2 | Proportion % | Area km2 | Proportion % | Area km2 | Proportion % | Area km2 | Proportion % | |
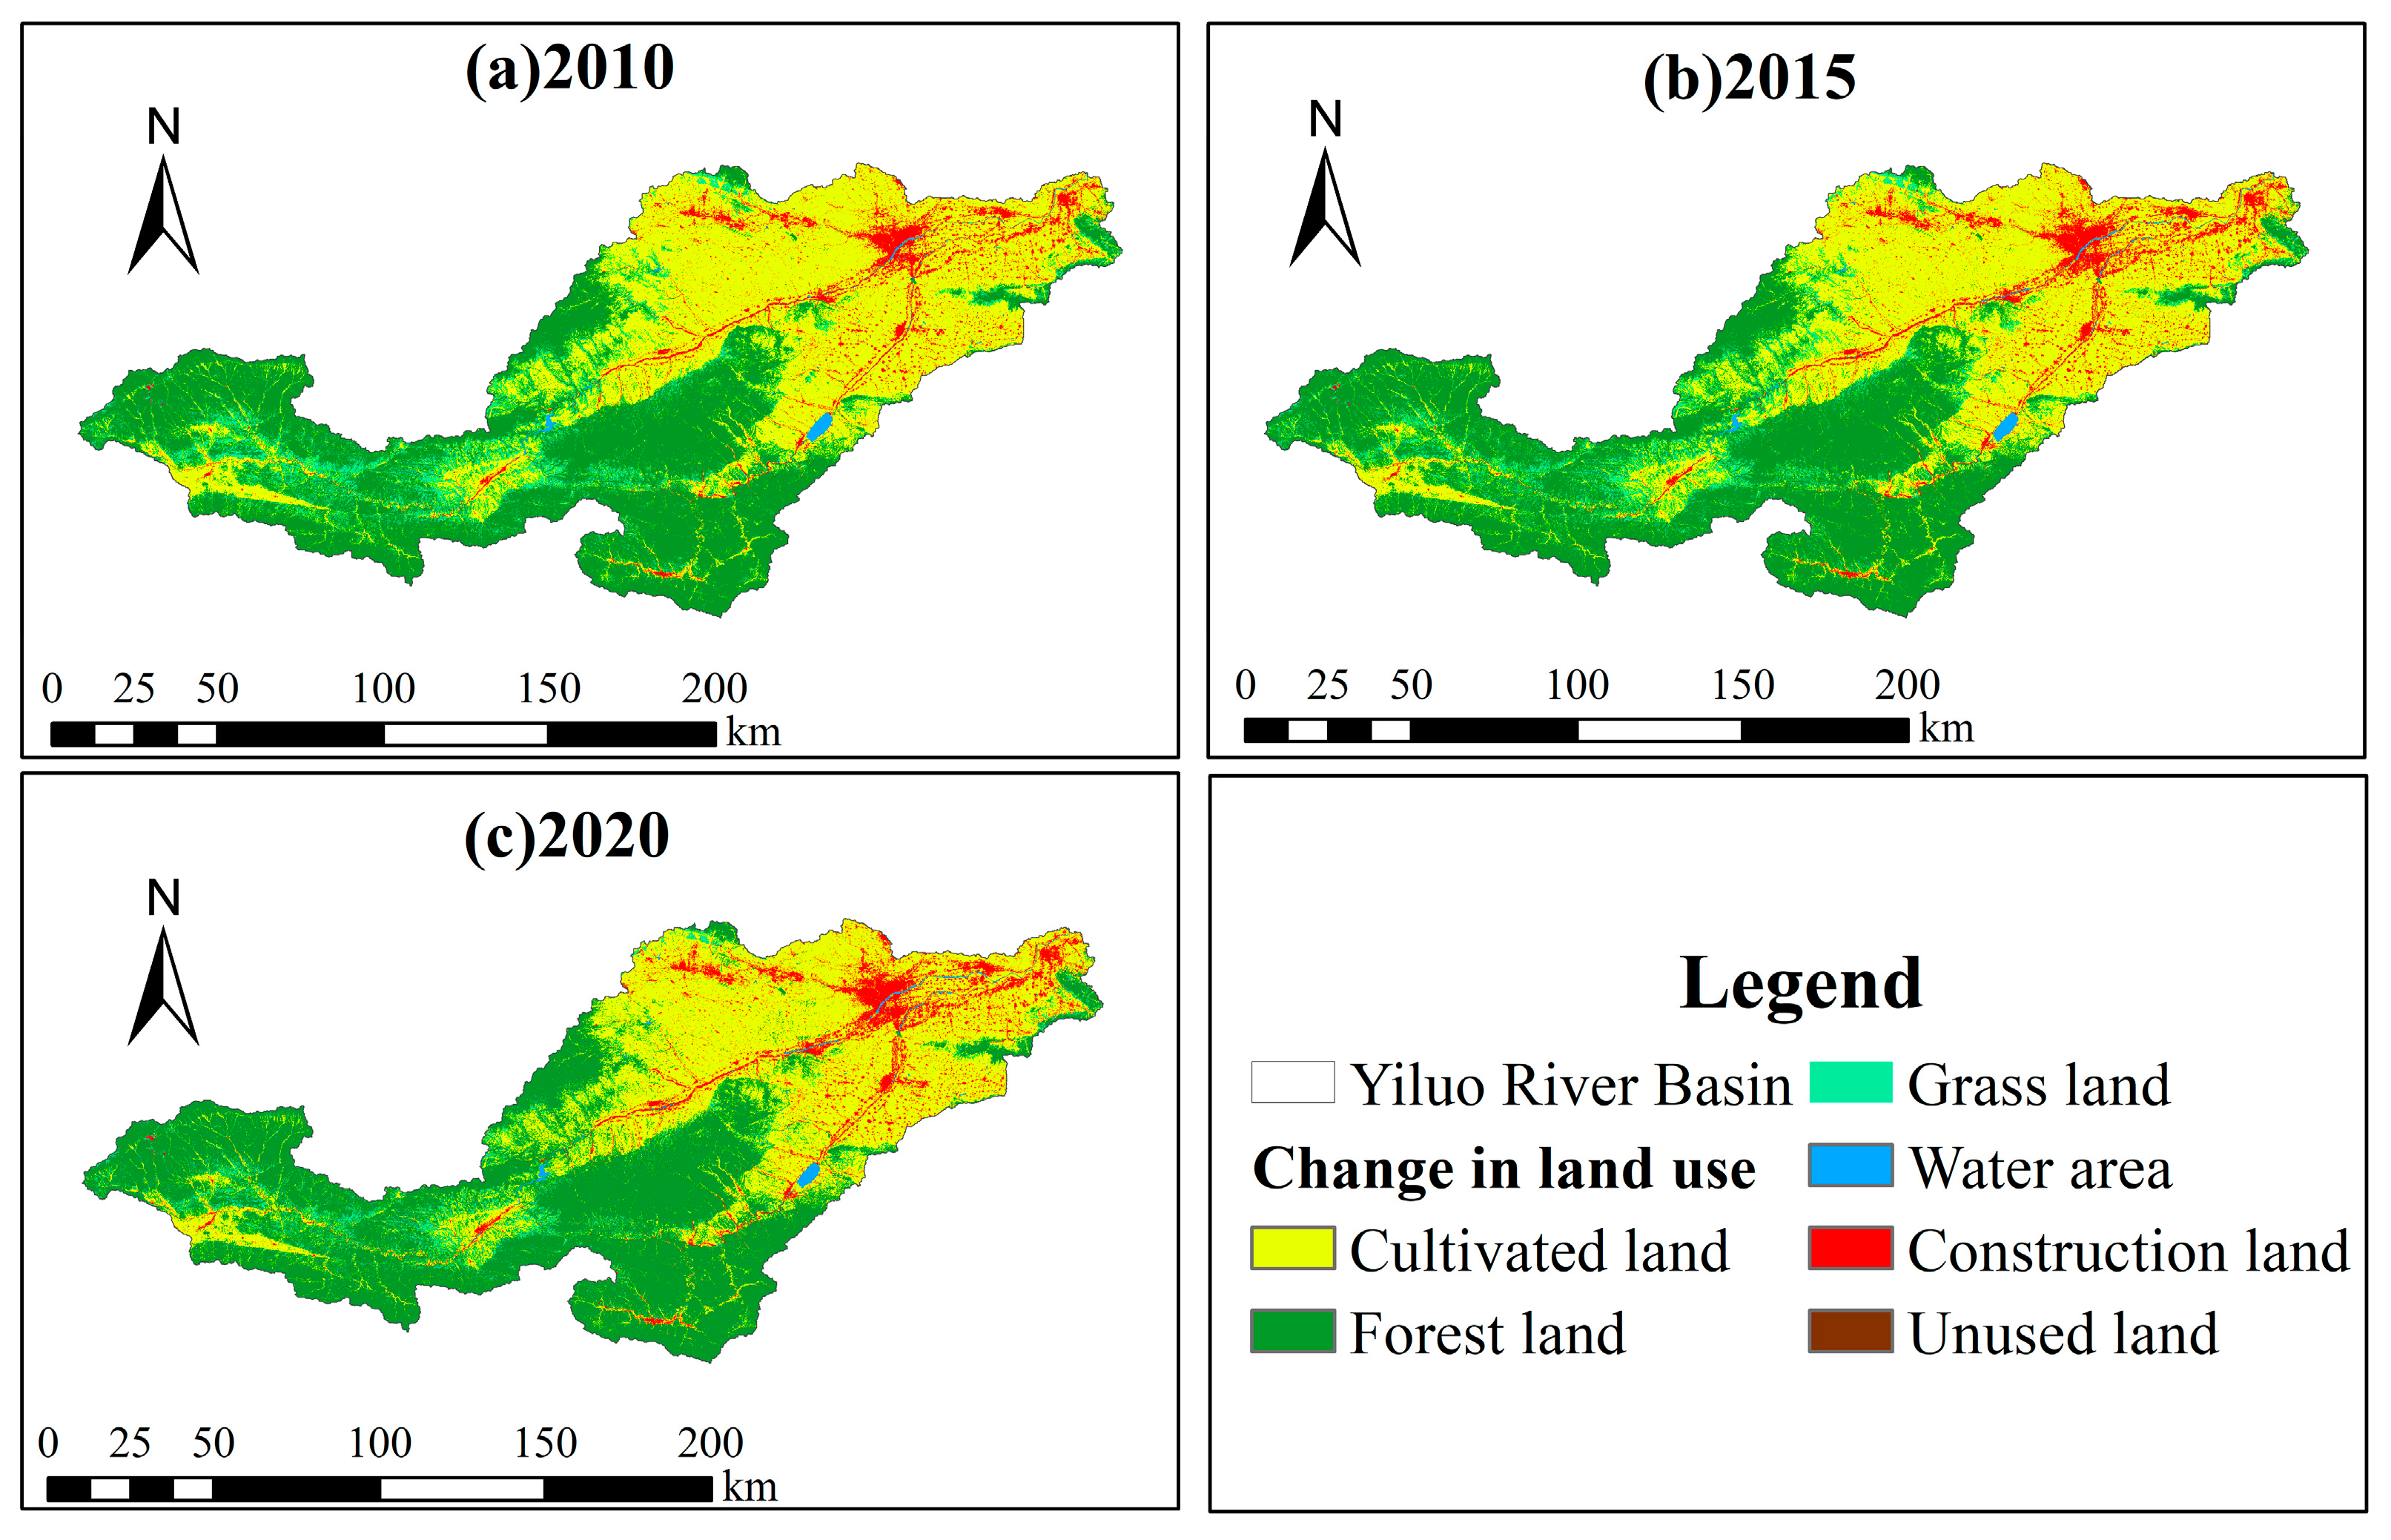
| CL | 8439.8 | 44.9 | 8116.8 | 43.2 | 8075.8 | 43.0 | −323.0 | −1.7 | −41.0 | 0.2 | −364.0 | −1.9 |
| FL | 7994.3 | 42.6 | 8253.1 | 44.0 | 8577.6 | 45.7 | 258.8 | 1.4 | 324.5 | 1.7 | 583.3 | 3.1 |
| GL | 1181.3 | 6.3 | 1040.1 | 5.5 | 666.9 | 3.6 | −141.2 | −0.8 | −373.2 | −2.0 | −514.4 | −2.7 |
| WA | 91.4 | 0.5 | 98.8 | 0.5 | 96.8 | 0.5 | 7.4 | 0 | −2.0 | 0 | 5.4 | 0 |
| CSL | 1072.2 | 5.7 | 1270.1 | 6.8 | 1361.8 | 7.2 | 197.9 | 1.1 | 91.6 | 0.5 | 289.5 | 1.5 |
| UL | 0.5 | 0 | 0.6 | 0 | 0.6 | 0 | 0.1 | 0 | 0.1 | 1.5 | 0.2 | 0 |
Disclaimer/Publisher’s Note: The statements, opinions and data contained in all publications are solely those of the individual author(s) and contributor(s) and not of MDPI and/or the editor(s). MDPI and/or the editor(s) disclaim responsibility for any injury to people or property resulting from any ideas, methods, instructions or products referred to in the content. |
© 2024 by the authors. Licensee MDPI, Basel, Switzerland. This article is an open access article distributed under the terms and conditions of the Creative Commons Attribution (CC BY) license (https://creativecommons.org/licenses/by/4.0/).
Share and Cite
Cao, Y.; Zhang, X.; Wei, H.; Pan, L.; Sun, Y. Study on the Spatial–Temporal Variations and Driving Factors of Water Yield in the Yiluo River Basin. Water 2024, 16, 223. https://doi.org/10.3390/w16020223
Cao Y, Zhang X, Wei H, Pan L, Sun Y. Study on the Spatial–Temporal Variations and Driving Factors of Water Yield in the Yiluo River Basin. Water. 2024; 16(2):223. https://doi.org/10.3390/w16020223
Chicago/Turabian StyleCao, Yongxiao, Xianglong Zhang, Huaibin Wei, Li Pan, and Yanwei Sun. 2024. "Study on the Spatial–Temporal Variations and Driving Factors of Water Yield in the Yiluo River Basin" Water 16, no. 2: 223. https://doi.org/10.3390/w16020223
APA StyleCao, Y., Zhang, X., Wei, H., Pan, L., & Sun, Y. (2024). Study on the Spatial–Temporal Variations and Driving Factors of Water Yield in the Yiluo River Basin. Water, 16(2), 223. https://doi.org/10.3390/w16020223