Article

Estimation of the Potential for Soil and Water Conservation Measures in a Typical Basin of the Loess Plateau, China

1
State Key Laboratory of Soil Erosion and Dryland Farming on the Loess Plateau, Institute of Soil and Water Conservation, Northwest A&F University, No. 26 Xinong Road, Yangling 712100, China
2
Institute of Water Resources and Hydropower Engineering, Xi’an University of Technology, No. 5 South Jinhua Road, Xi’an 710048, China
3
Xi’an Mineral Resources Investigation Centre of the China Geological Survey, No. 66 Fengqi West Road, Xi’an 710100, China
*
Author to whom correspondence should be addressed.
Water 2024, 16(19), 2868; https://doi.org/10.3390/w16192868
Submission received: 5 September 2024 / Revised: 30 September 2024 / Accepted: 5 October 2024 / Published: 9 October 2024
(This article belongs to the Special Issue Soil Erosion and Soil and Water Conservation)

Abstract

:
Abstract: In the context of the large-scale management of the Loess Plateau and efforts to reduce water and sediment in the Yellow River, this study focuses on a typical watershed within the Loess Plateau. The potential for vegetation restoration in the Kuye River Basin is estimated based on the assumption that vegetation cover should be relatively uniform under similar habitat conditions. The potential for terrace restoration is assessed through an analysis of topographic features and soil layer thickness, while the potential for silt dam construction is evaluated by considering various hydrological and geomorphological factors. Based on these assessments, the overall potential for soil erosion control in the watershed is synthesized, providing a comprehensive understanding of target areas for ecological restoration within the Kuye River Basin. The study demonstrates that the areas with the greatest potential for vegetation restoration in the Kuye River Basin are concentrated in the upper and middle reaches of the basin, which are in closer proximity to the river. The total potential for terracing is 1013.85 km2, which is primarily distributed across the river terraces, farmlands, and gentle slopes on both sides of the riverbanks. Additionally, the potential for the construction of check dams is 14,390 units. The target areas for terracing measures in the Kuye River Basin are primarily situated in the middle and lower reaches of the basin, which are in closer proximity to the river. Conversely, the target areas for forest, grass, and check dams, as well as other small watershed integrated management measures, are predominantly located in the hill and gully areas on the eastern and southern sides of the basin. The implementation of the gradual ecological construction of the watershed, based on the aforementioned objectives, will facilitate the protection, improvement, and rational utilization of soil, water, and other natural resources within the watershed.

1. Introduction

The Yellow River Basin is crucial to China’s ecological security, functioning as a vital ecological barrier, a central area for resources and energy, and a highly productive region [1,2,3,4]. Its significance extends to China’s economic and social development as well as its ecological stability. The Yellow River, which traverses the Loess Plateau—a region characterized by extensive gullies and severe soil erosion—has prompted the implementation of various soil and water conservation measures [5]. These include converting croplands to forests and grasslands, constructing terraced fields on slopes, and erecting check dams in gullies [6,7].
According to the Soil and Water Conservation Bulletin of the Yellow River Basin, by 2022, the cumulative area of preliminary soil and water erosion control measures in the Yellow River Basin is expected to reach 268,800 km2. This includes 64,615 km2 of terraced fields, 133,551 km2 of soil and water conservation forests, 24,487 km2 of grasslands, and 46,152 km2 of closure control measures. The construction of check dams totals 57,200 units, including 6423 large check dams, 11,000 medium check dams, and 39,800 small check dams. These extensive conservation efforts have led to a marked reduction in the sediment load carried by the Yellow River. Notably, the average annual sediment transport at Tongguan Station has decreased by over 60% from the 1950s to the 2000s [8,9].
Miyawaki [10] has established basic principles in the vegetation–ecological restoration of forests through vegetation surveys in Japan and Southeast Asia. Pu [11] explored the potential of terracing by analyzing the current status of arable land resources, technical forces, and current policies in Shaanxi, Gansu, and Ningxia. According to a study conducted by Gao [12], a proportional push algorithm was used to determine the check dam construction potential, and a target push algorithm was used to determine the suitable scale of the basin, and the flood control capacity of the two check dams in the basin was checked. In the context of the large-scale management of the Loess Plateau and efforts to reduce water and sediment in the Yellow River, key questions arise regarding the remaining potential for terrace and silt dam construction. To what extent can vegetation be restored? From the perspective of overall watershed health, how can slope stabilization measures be effectively balanced with gully control measures? Few studies have comprehensively addressed these issues.
The Kuye River Basin, located in the upper reaches of the middle section of the Yellow River, is characterized by a diverse range of erosion types, including wind, water, and gravity erosion, all of which contribute to substantial soil erosion within the region [13]. To address this critical issue, a series of soil erosion control and ecological construction projects have been implemented. These initiatives include the construction of terraces, check dams, the comprehensive management of small watersheds, and the conversion of farmland to forest and grassland. These measures have significantly contributed to reducing the sediment load within the basin [14]. The exploration of soil erosion control potential in the Kuye River Basin holds considerable theoretical and practical value. It provides crucial insights for guiding ecological construction efforts on the Loess Plateau and for maintaining the ecological health of the Yellow River.

2. Materials and Methods

2.1. Study Area

The Kuye River Basin, the second largest tributary in the middle reaches of the Yellow River, is located between 109°00′–110°52′ E and 38°28′–39°52′ N (Figure 1). The basin covers an area of 8706 km2, with a main stream length of 242 km and an average gradient of approximately 3.44‰. The Wenjiachuan Hydrological Station serves as the control station for the river’s confluence with the Yellow River.
The Kuye River Basin is located in the northern temperate zone and features a semi-arid continental monsoon climate. The long-term average annual temperature is 7.9 °C, with a multi-year average precipitation of 419 mm and an evaporation range of 900 to 1200 mm. Precipitation is highly unevenly distributed throughout the year, with the majority occurring as intense rainfall events concentrated between July and September. The long-term average total annual runoff for the Kuye River is 759 million m3, with an average annual runoff depth of 88.7 mm and an average flow rate of 24.1 m3/s. The basin’s average annual sediment transport is approximately 74 million metric tons.
Topographically, the Kuye River Basin features elevated terrain in the northwest and low-lying areas in the southeast. The region above Shenmu is characterized by dunes and quicksand, situated on the southeastern edge of the Maowusu Desert, with minimal surface undulation. In contrast, the area below Shenmu presents a hill and gully landscape with fragmented terrain, including ravines, valleys, longitudinal ridges, and mountainous regions. This lower section is marked by significant soil erosion, with rugged topography where the river cuts through bedrock, creating steep slopes, high banks, and a limited number of tributaries.

2.2. Data Sources

The precipitation data for 2018 were obtained from the China Meteorological Data Service Center (https://data.cma.cn/ accessed on 10 April 2020). This study collected over 30 years of monthly rainfall data from 108 national meteorological stations across the Loess Plateau and surrounding areas.
Soil data were obtained from the National Tibetan Plateau Science Data Center (http://data.tpdc.ac.cn/zh-hans/ accessed on 13 June 2020), utilizing the Chinese soil dataset from the World Soil Database with a spatial resolution of 1 km.
The digital elevation model (DEM) data were acquired from the International Scientific Data Mirror (http://www.gscloud.cn accessed on 20 June 2023) of the Computer Network Information Center of the Chinese Academy of Sciences, based on ASTER GDEM version 1 data with a spatial resolution of 30 m.
The land use data for 2018 were sourced from the 1:100,000 China Land Use Database. These data were derived through human–computer interactive interpretation based on Landsat TM and HJ-1 satellite imagery from the China Environment Satellite series.
The 2018 data on terraces and check dams were acquired through remote sensing interpretation and statistical surveys conducted by the Upper and Middle Reaches Bureau of the Yellow River.
The vegetation data for 2018 were sourced from the publicly available MODND1M China 500M NDVI Monthly Synthesis product from the Geospatial Data Cloud (http://www.gscloud.cn accessed on 27 September 2023), which offers a monthly temporal resolution and a spatial resolution of 500 m. The maximum synthesis method was employed to derive the NDVI values for each year, which were subsequently utilized to calculate vegetation cover ( V C ) using a likelihood dichotomous model.
V C = N D V I N D V I m i n N D V I m a x N D V I m i n

2.3. Methodology for Calculating Ecological Building Potential

The potential for vegetation restoration in the Kuye River Basin is estimated based on the assumption that vegetation cover should be relatively uniform under similar habitat conditions. The potential for terrace restoration is assessed through an analysis of topographic features and soil layer thickness, while the potential for silt dam construction is evaluated by considering various hydrological and geomorphological factors. Based on these assessments, the overall potential for soil erosion control in the watershed is synthesized, providing a comprehensive understanding of target areas for ecological restoration within the Kuye River Basin (Figure 2).
(1)
Calculation of vegetation restoration potential
Vegetation distribution is influenced by various factors, including soil type, topography, and climate. Consequently, the Kuye River Basin was initially categorized into two distinct zones: the wind–sand zone and the loess hills and gullies zone. Each of these zones was further subdivided based on topographic features and precipitation patterns.
The Kuye River Basin, located in an arid and semi-arid zone, exhibits a strong correlation between precipitation and NDVI. Pearson correlation coefficients for precipitation and the NDVI were calculated for each meteorological station, revealing that most coefficients exceeded 0.3. Vegetation recovery within the watershed varied significantly with precipitation levels. In regions receiving less than 375 mm of precipitation, the NDVI change was 9.55%. For precipitation ranging from 375 to 575 mm, the NDVI change averaged 17.18%, with the most substantial change of 19.73% observed between 425 and 450 mm. In areas with precipitation exceeding 575 mm, the rate of vegetation recovery decreased to approximately 8.88%. Moisture conditions are the primary limiting factor for vegetation recovery in the Kuye River Basin. Inadequate moisture often leads to dry soil layers, low survival rates, and smaller tree sizes in areas receiving less than 450 mm of rainfall annually [15].
Therefore, the annual precipitation levels were classified into 14 categories, as shown in Table 1.
Terrain factors are categorized into four distinct classes based on slope and aspect, as outlined in Table 2. On the Loess Plateau, the gully ridge line serves as the boundary. The area above the ridge is referred to as the inter-gully region, while the area below is the gully region. The inter-gully region primarily consists of slopes, typically with gradients of less than 15°, whereas the gully region is mainly composed of channels, with slopes generally exceeding 15°. Therefore, 15° was chosen as the threshold for slope delineation.
To generate a four-digit elevation code that integrates the encoded precipitation and terrain factor layers, the terrain factor code is first multiplied by 100, followed by the addition of the precipitation code. This method encodes the terrain characteristics in the thousands and hundreds digits, while the precipitation information is captured in the tens and units digits of the four-digit code. As a result, a single code effectively represents both raster features. Subsequently, vegetation cover statistics were computed for each zone and stand code, including the mean, 75th percentile, 90th percentile, and maximum values.
In habitats with similar conditions, vegetation cover should be relatively consistent [16]. For instance, if the current maximum vegetation cover in a particular zone—characterized by uniform soil types, aridity index, and topographic features—is 0.9, it is reasonable to assume that the potential for vegetation restoration in this area also reaches 0.9. This suggests that all other areas within the zone where vegetation cover is less than 0.9 have the potential to achieve the maximum cover of 0.9. To mitigate potential statistical bias, the 90th percentile of vegetation cover was used as the estimate for vegetation restoration potential under specific land conditions. For cultivated lands, water bodies, and built-up areas with slopes of 0–5°, the vegetation indices were maintained as is. In cases where the vegetation cover exceeded the 90th percentile under current conditions, the existing value was utilized.
(2)
Calculation method of terrace construction potential
The positioning and dimensions of terraces are predominantly influenced by topographical characteristics and soil strata thickness [17,18]. In the Kuye River Basin, the primary forms of erosion are gully erosion and wind-blown sand, with topography being the most significant factor due to the depth of the soil layer in the loess hill and gully areas. The Soil and Water Conservation Law of the People’s Republic of China stipulates that terracing is allowed on sloped farmland below 25°, with other regional standards of China also providing guidelines for terracing based on slope classifications of 5°, 10°, and 15°. Thus, this study categorized the terrace deployment potential into five distinct zones based on ground slope and land use conditions: The Level 1 potential areas are the hilly gully zone of the Kuye River Basin, with a ground slope of 0–5° and a land use type of dryland. The Level 2 potential areas are also the hilly gully zone of the Kuye River Basin, with a ground slope of 5–10° and a land use type of dryland. The Level 3 potential area is the hilly gully zone of the Kuye River Basin, with a ground slope of 10–15° and a land use type of dryland. The Level 4 potential area is the wind–sand area of the Kuye River Basin, with a ground slope of 0–5° and a land use type of dryland. The Level 5 potential area is the hilly gully area of the Kuye River Basin, with a ground slope of 15–25° and a land use type of dryland.
The identification of potential terrace zones is conducted using the overlay analysis module of ArcGIS 10.2 software. This analysis integrates inputs from a land use map, a slope classification map, and a governance zoning map. The overlay analysis is performed based on the specified analytical concepts, resulting in the final delineation of terrace potential zones.
(3)
Calculation method for the construction potential of check dams
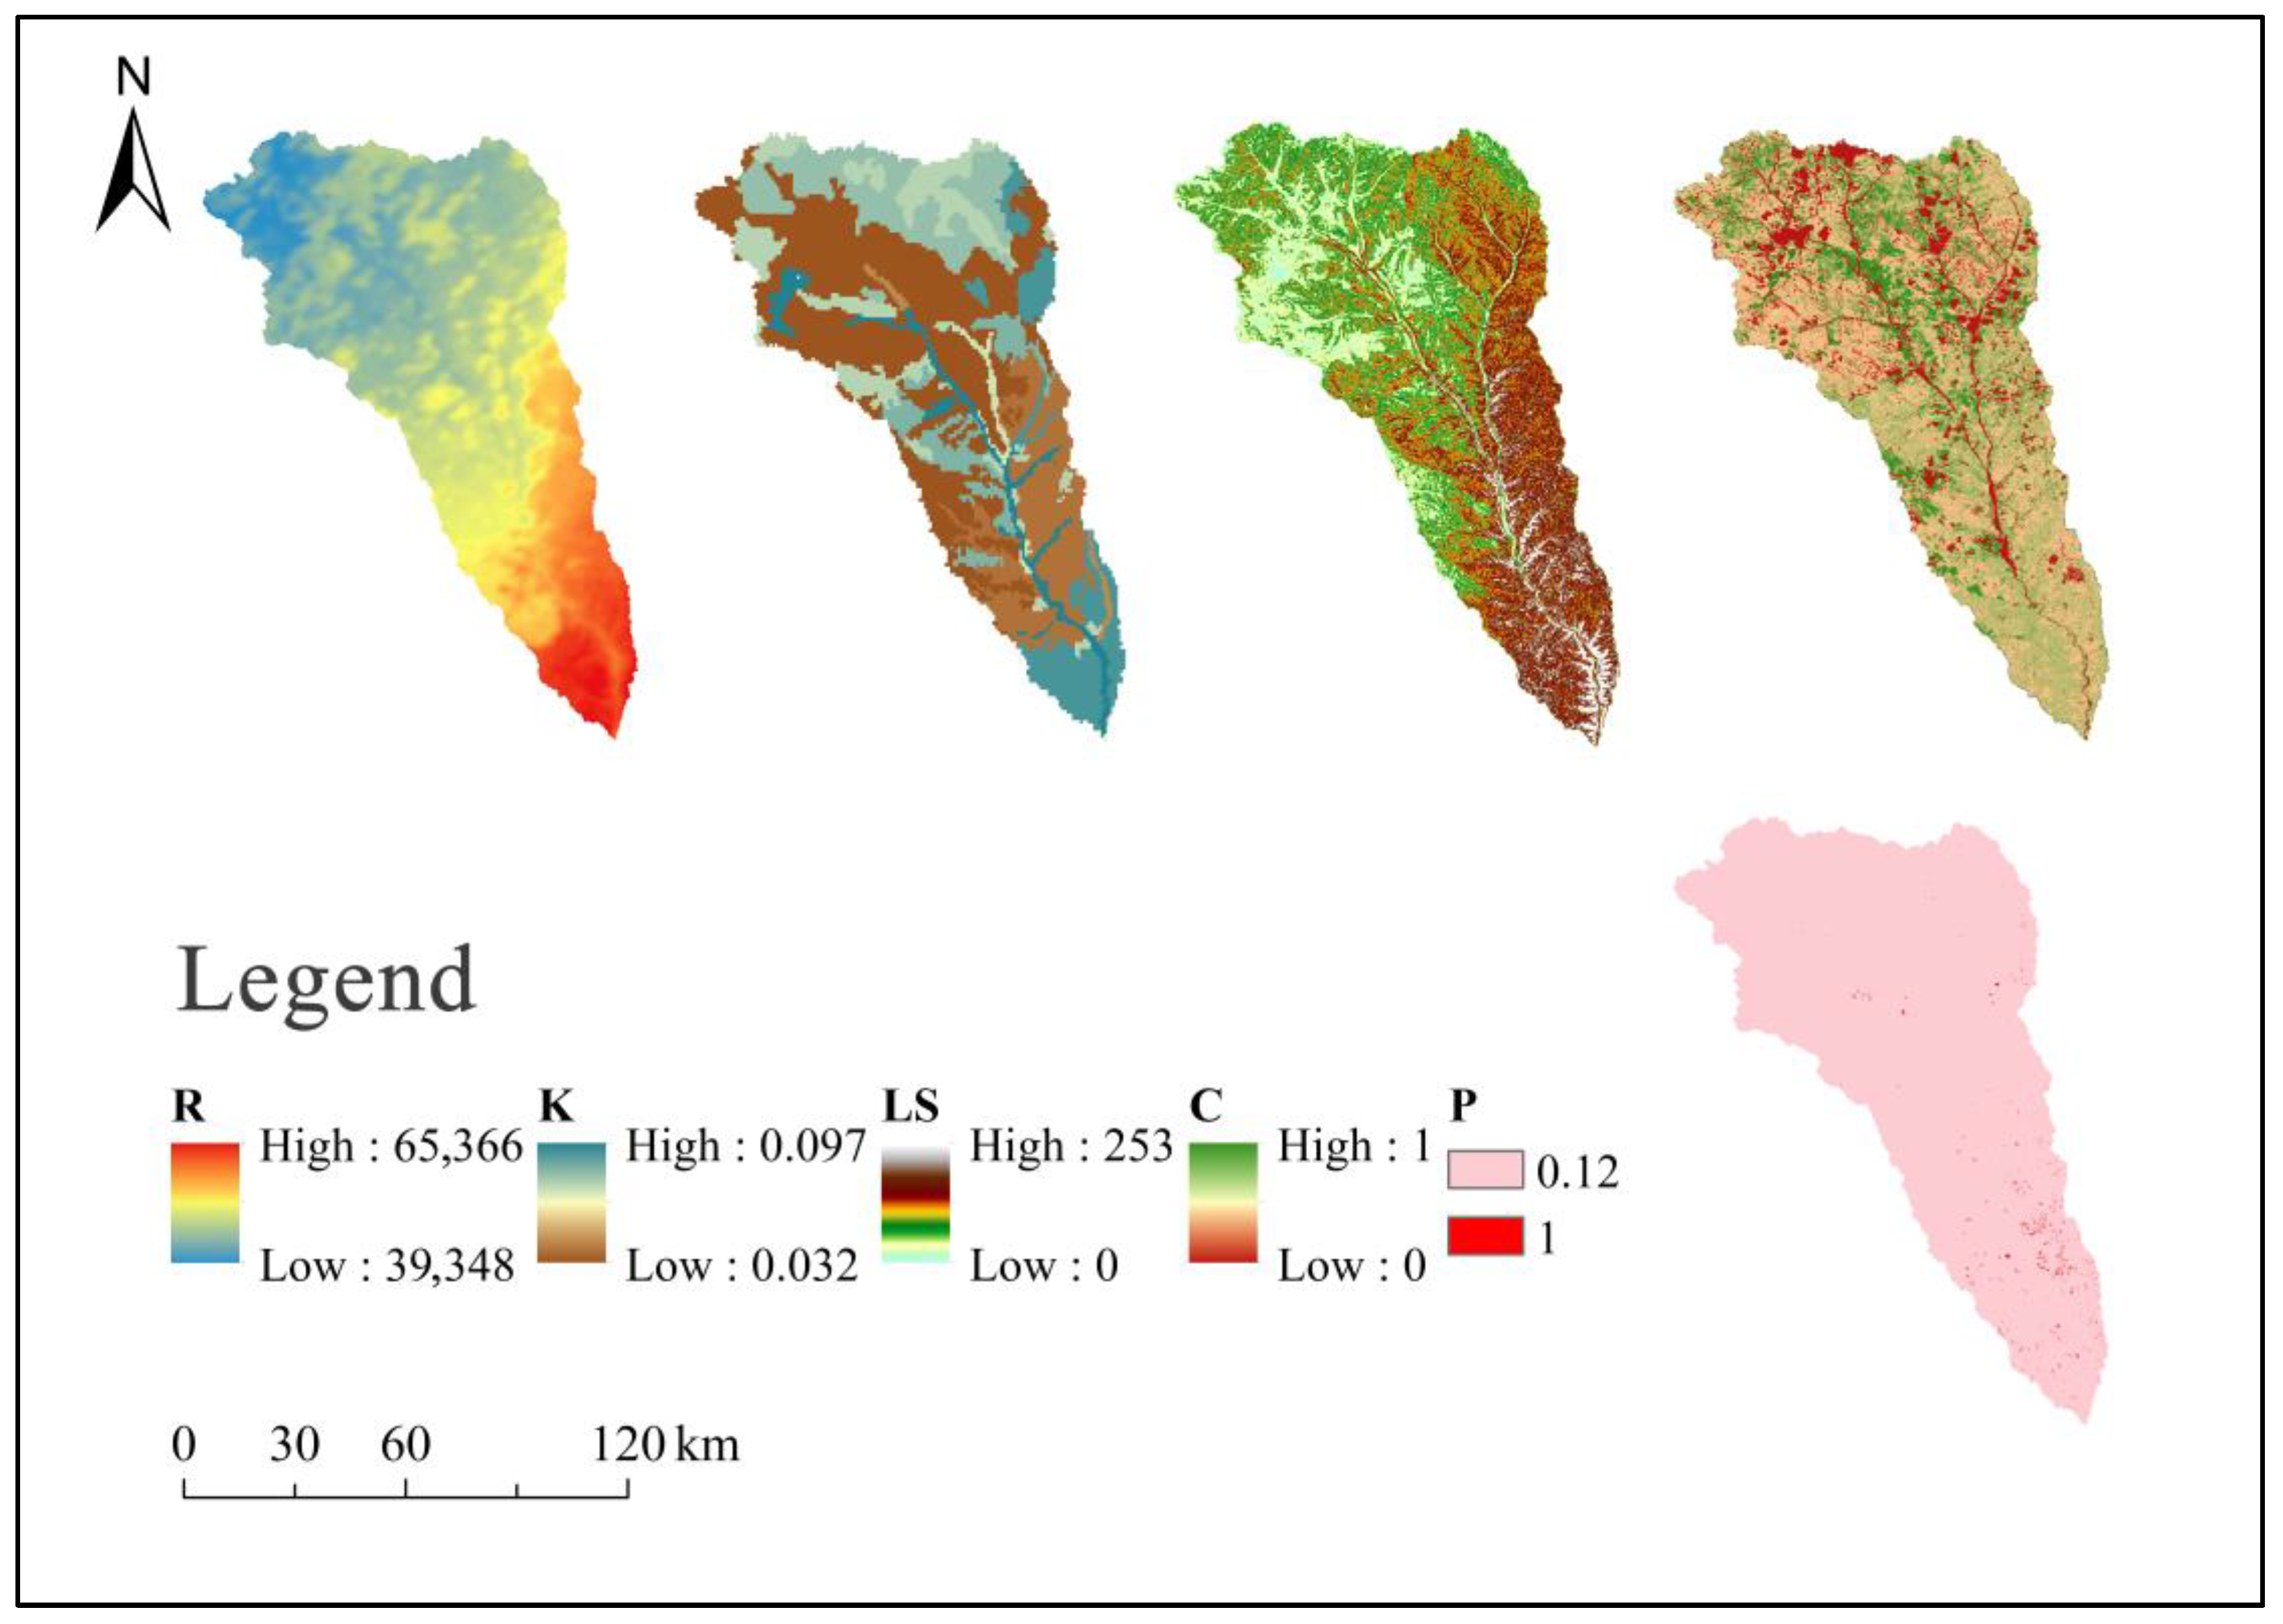
The primary factor influencing the construction of check dams is the soil erosion modulus. The calculation of this modulus is based on the Revised Universal Soil Loss Equation (RUSLE), with adjustments made to the relevant factors in the formula. It is further combined with calculations derived from ArcGIS software (Figure 3). The calculation formula is as follows:
A = R·K·S·L·C·P
where A is the average annual soil loss, t×/(hm2 × a); R is the rainfall erosivity factor, MJ × mm/(hm2 × h × a); K is the soil erodibility factor, t × hm2 × h/(hm2 × MJ × mm); S is the slope factor; L is the slope length factor; C is the crop cover-management factor; and P is the factor for soil and water conservation measures.
The rainfall erosivity factor (R) was determined using the empirical formula proposed by Wischmeier et al. [19,20], which calculates the multi-year average rainfall erosivity based on monthly rainfall data. While this method is intended to be applied across the United States, many scholars have also used this formula to conduct relevant studies in the Loess Plateau region in recent years [21,22,23,24].
R = i = 1 12 1.735 × 10 1.5 × lg P i 2 P 0.8188
where  P  and  P i  are the average annual and monthly rainfall, mm, respectively.
The multi-year average rainfall erosivity (R) value was derived from the collected monthly rainfall data for the study area using the appropriate formulae. This R value was then simulated using the semi-variance function in GS+ 7.0, where the Gaussian model was identified as the optimal fit. Subsequently, the rainfall erosivity factor for the Kuye River Basin was obtained by applying the Gaussian model with Kriging interpolation within the Geostatistics Module of ArcGIS.
The soil erodibility factor (K) was estimated using the methodology described in the Estimation of Soil Erosion and Productivity Impacts (EPIC) model, established by Williams [25]. Yao used the EPIC model, along with the Shirazi and Torri formulas, to estimate and compare the K values for soil erodibility in typical small watersheds of the Loess Plateau [26]. Yao found that the K values from the EPIC model fell within the range of observed values, suggesting that the EPIC model may be more suitable for typical small watersheds in the Loess Plateau. In recent years, many scholars have also applied this formula to the Loess Plateau [27,28]. This method takes into account soil organic matter and particle composition:
K = 0.1317 × {0.2 + 0.3exp[−0.0256SAN(1 − SIL/100)]} × [SIL/(CLA + SIL)]0.3 × {1.0 − 0.25C/[C + exp(3.72 − 2.95C)]} × {1.0 − 0.7SN1/[SN1 + exp(−5.51 + 22.9SN1)]}
where SAN is the sand content, %; SIL is the silt content, %; CLA is the clay content, %; C is the organic carbon content, %; and SN1 = 1 − SAN/100. Based on the soil type of the Kuye River Basin and its attribute data, the soil erodibility K value was calculated and obtained.
The Slope and Length Factor (LS) is calculated using the formula proposed by McCool et al. within the Revised Universal Soil Loss Equation (RUSLE):
S = 10.8sinθ + 0.03θ < 9%
S = 16.8sinθ − 0.5θ ≥ 9%
L = (λ/22.1) m
where λ is the horizontal projected slope length, m; m is the variable slope length index; and θ is the slope gradient, °.
The Kuye River Basin was initially subdivided into eight sub-regions using the LS factor calculation tool developed by Zhang et al. [29], based on 30 m DEM data. The LS factor values for each sub-region were calculated individually and then aggregated to derive the LS factor values for the entire Kuye River Basin.
The crop cover management factor (C) was defined for gently sloping arable land (below 5°) in the Cave Wild River area, where the predominant crops are maize and wheat, with a C value of 0.25 based on the studies by Zhang et al. [30]. For sloping arable land with gradients above 5°, where legumes, potatoes, and grains are the primary crops, the C value is set at 0.40. The C values for paddy fields, water bodies, and built-up areas are assigned as zero, while unused land is assigned a C value of one. Jiao et al. [31] and Zhang et al. [32], through their research, concluded that when the effective vegetation cover in the Loess Plateau region exceeds 60%, soil erosion is significantly reduced. Based on this understanding, and drawing on the results from the RUSLE manual as well as the studies by Zhang et al. [30], and Wang et al. [33], the C values for various vegetation coverages were determined, as shown in Table 3.
The factor representing soil and water conservation measures (P) has been reported to be as high as 0.12 for horizontal terraces in the Kuye River Basin, where it has been demonstrated that sand reduction benefits can reach up to 88%. In the absence of specific evidence for other land types, the value of P for these areas has been assigned a default value of 1.
This study integrates the relevant specifications for check dam construction with field research findings to determine the density of key check dams across various soil erosion moduli [34,35,36]. The results are as follows: For a soil erosion modulus exceeding 15,000 t/(km2 × a), the control area for key check dams is typically 3 km2. For a soil erosion modulus ranging from 12,000 to 15,000 t/(km2 × a), the control area is 4 km2. For a soil erosion modulus between 10,000 and 12,000 t/(km2 × a), the control area is 5 km2. For a modulus of 8000 to 10,000 t/(km2 × a), the control area is 6 km2; for a modulus of 6000 to 8000 t/(km2 × a), the control area is 7 km2; and for a modulus below 6000 t/(km2 × a), the control area is 8 km2. The potential number of key check dams in each subarea can be calculated by dividing the area of each soil erosion zone by the respective key check dam control area.

3. Results and Analyses

3.1. Potential for Vegetation Restoration

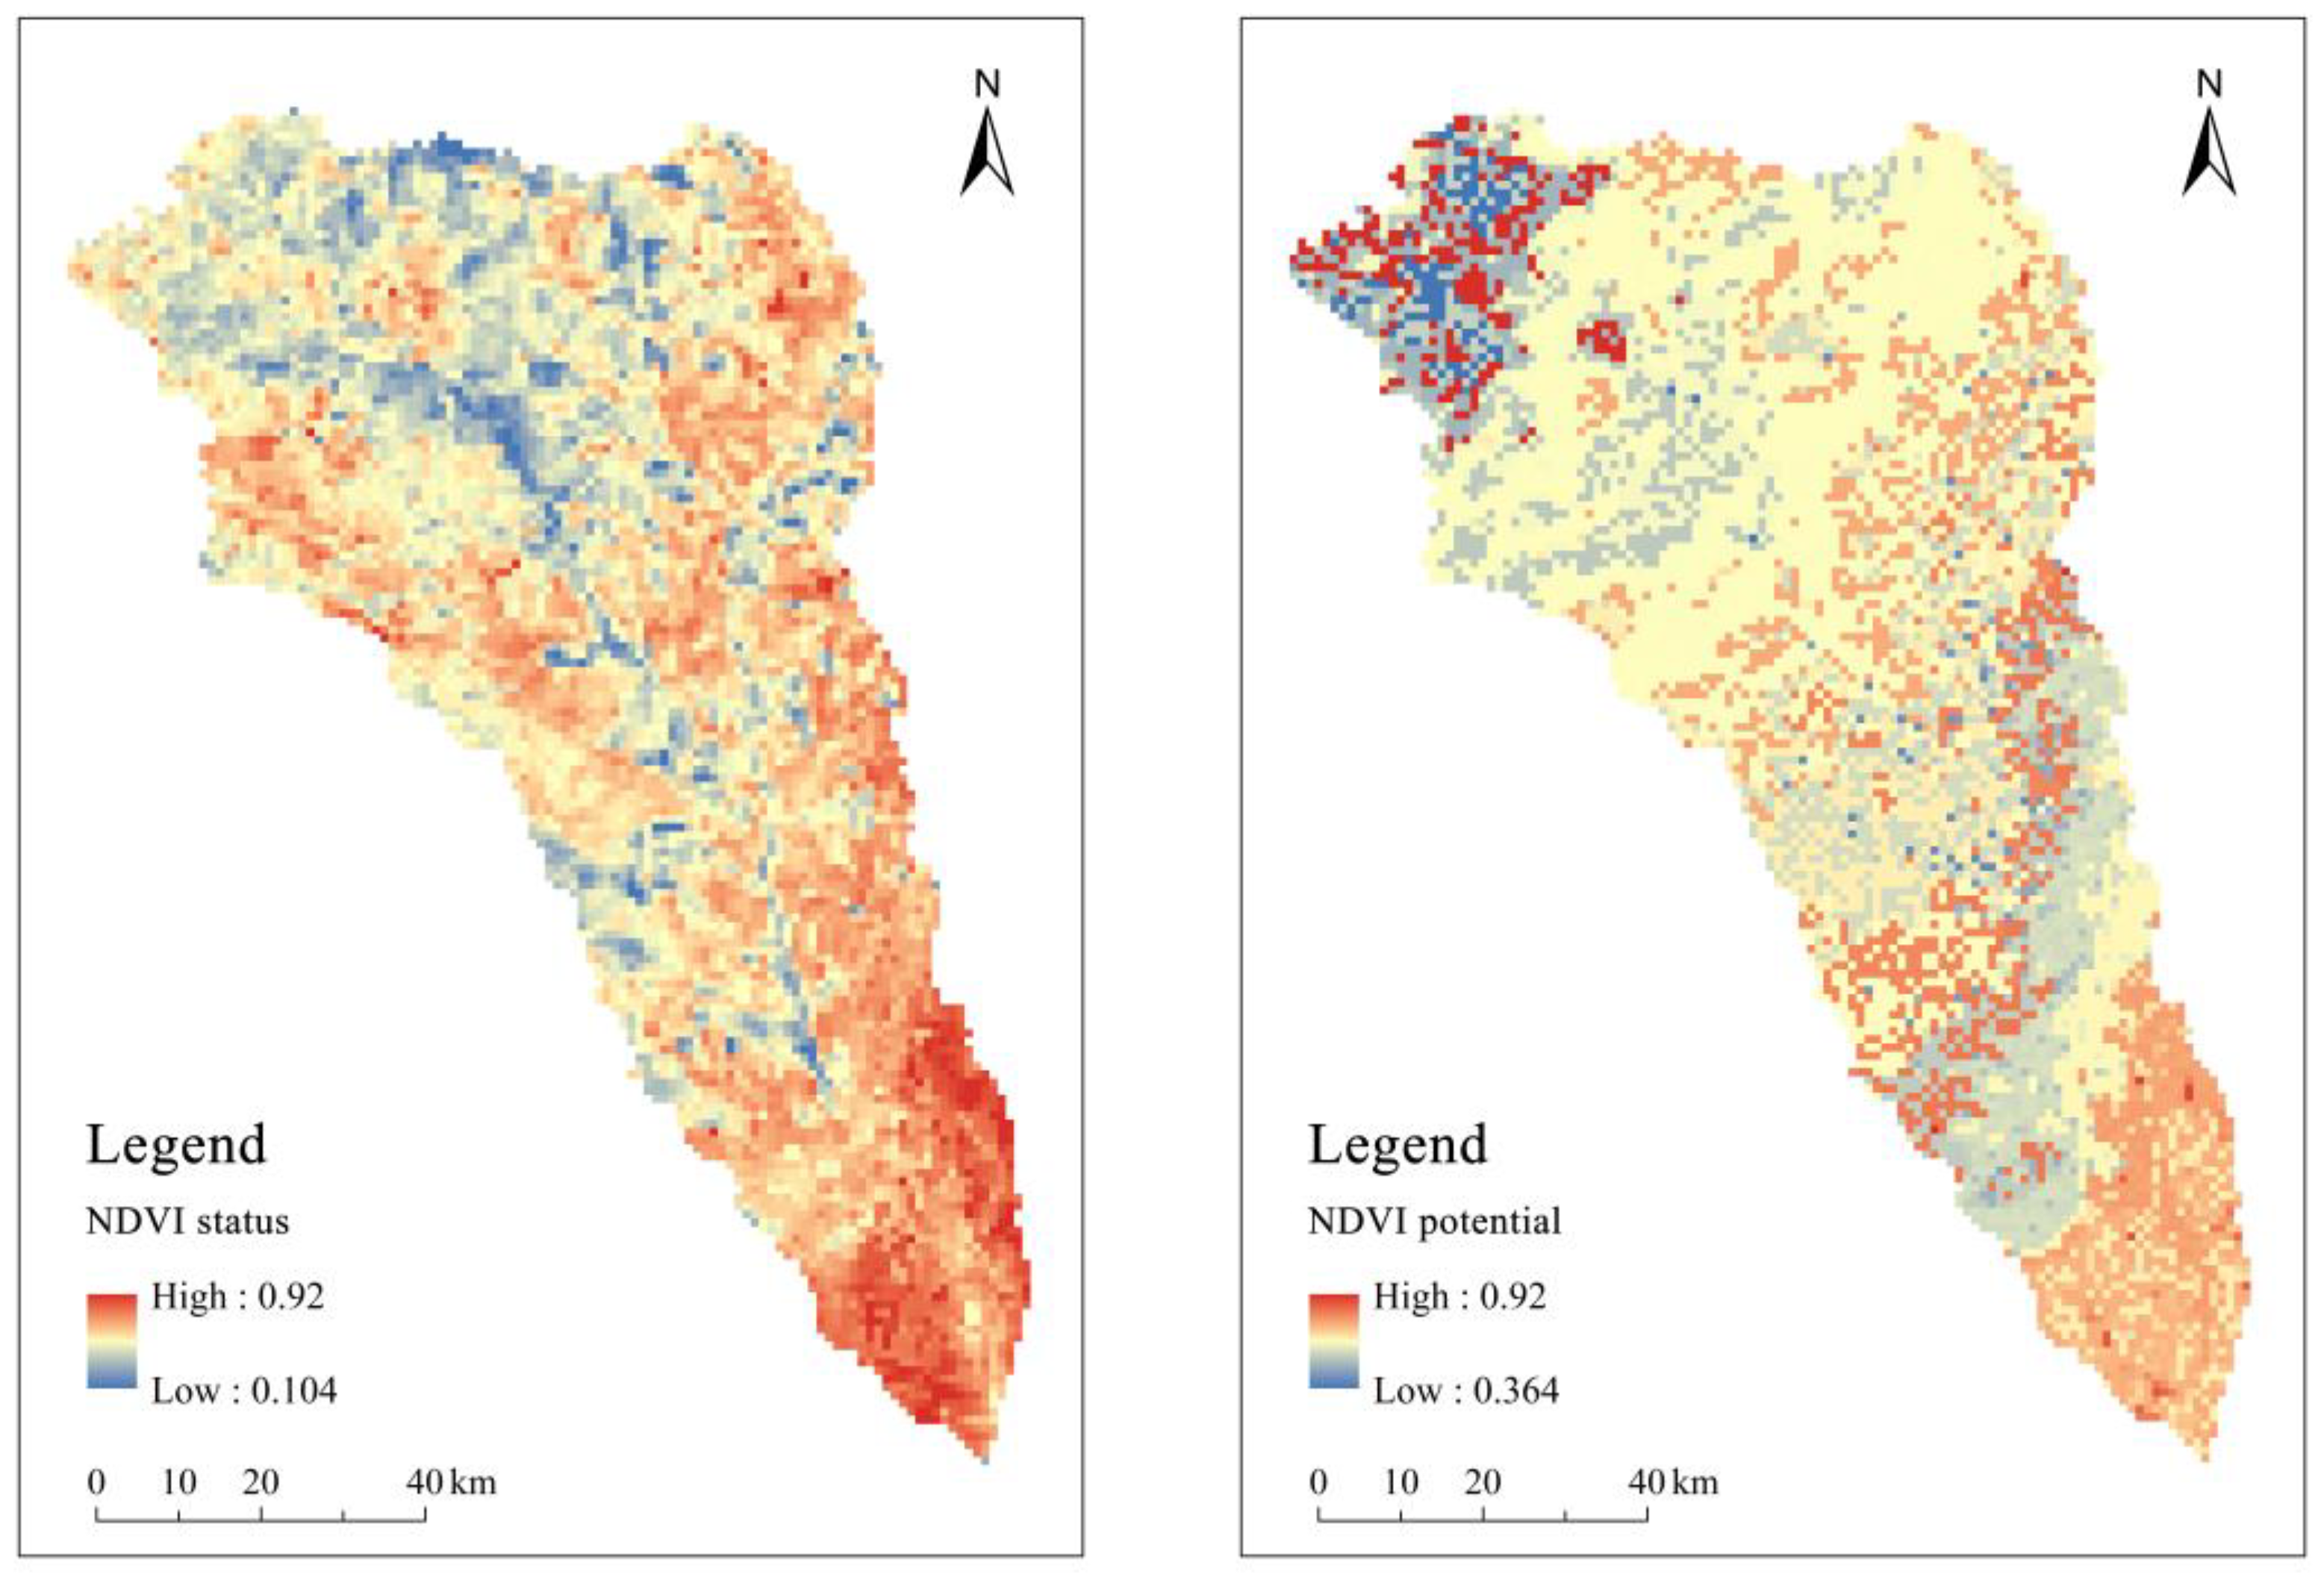
An investigation into the current distribution of vegetation in the Kuye River Basin can offer valuable insights into future vegetation trends. Figure 4 illustrates both the present vegetation distribution and the potential for vegetation restoration within the basin. The analysis reveals that the mean potential for vegetation cover in the Kuye River Basin is 69.75%, with a noticeable decline from the southeast to the northwest.
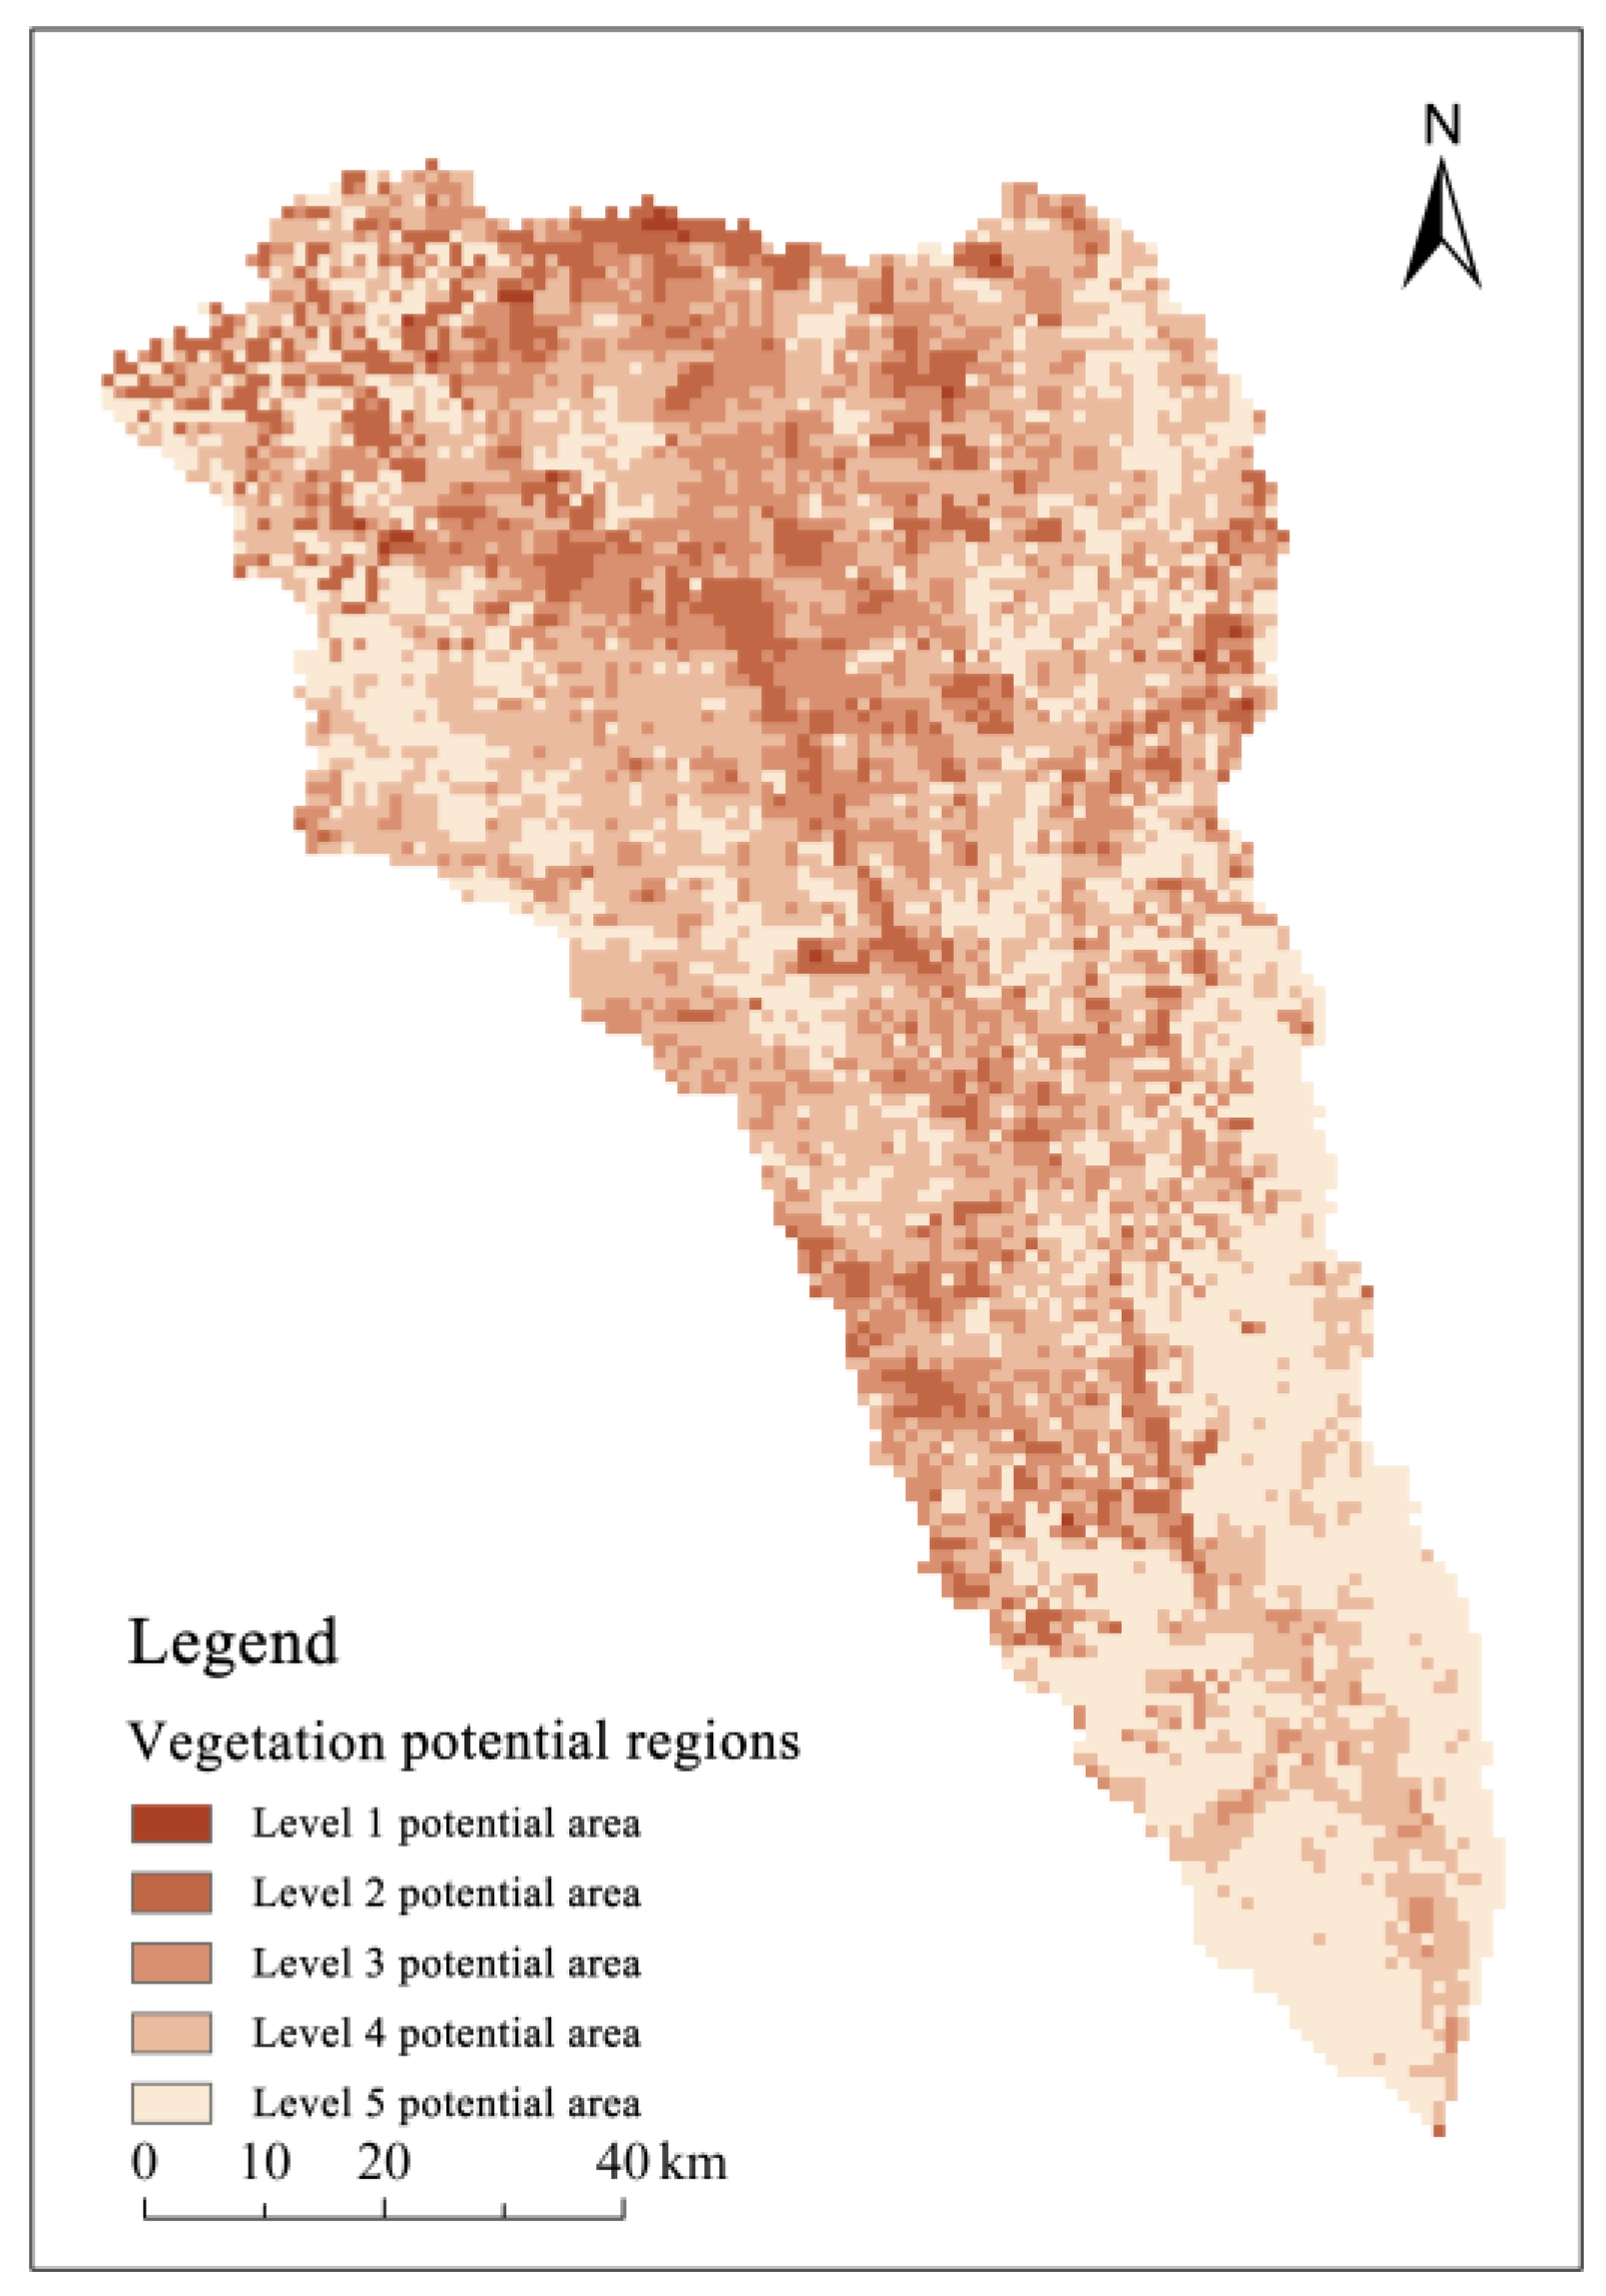
The vegetation restoration potential index can be determined using the current vegetation status and the vegetation restoration potential map. The distribution of potential restoration areas is as follows: Level 1 potential covers 21.97 km2, accounting for 0.25% of the total area; Level 2 potential extends over 845.83 km2, or 9.78% of the total area; Level 3 potential encompasses 1883.39 km2, representing 21.79% of the total area; Level 4 potential includes 3204.55 km2, or 37.07% of the total area; and Level 5 potential covers 2689.27 km2, or 31.11% of the total area (Table 4).
Regarding spatial distribution (Figure 5), the areas within the Kuye River Basin with the highest potential for vegetation restoration are concentrated in the upper and middle reaches, closer to the river. In contrast, the southeast region, which currently has relatively favorable conditions for existing vegetation, shows a comparatively lower potential for further restoration.

3.2. Potential for Terracing

The total potential area for terrace deployment in the Kuye River Basin is 1013.85 km2. Within this, the area classified as Level 1 potential is 142.80 km2, representing 14.08% of the total. The Level 2 potential area is 241.70 km2, or 23.85% of the total. The Level 3 potential area constitutes 15.04% of the total, amounting to 84.16 km2. The Level 4 potential area covers 38.71% of the total, while the Level 5 potential area comprises 8.32% (Table 5).
In terms of spatial distribution, Level 1 potential areas are primarily found in river terraces, loess regions, and gentle slopes on both sides of the river. Level 2 potential areas are predominantly located in the eastern part of the Kuye River Basin and along the left bank of the river. Level 3 and Level 5 potential areas are intermittently distributed in the ditch areas of the hill and gully regions. Level 4 potential areas are concentrated in ditches and terraces within the wind-swept sandy regions (Figure 6).

3.3. Potential for Check Dam Construction

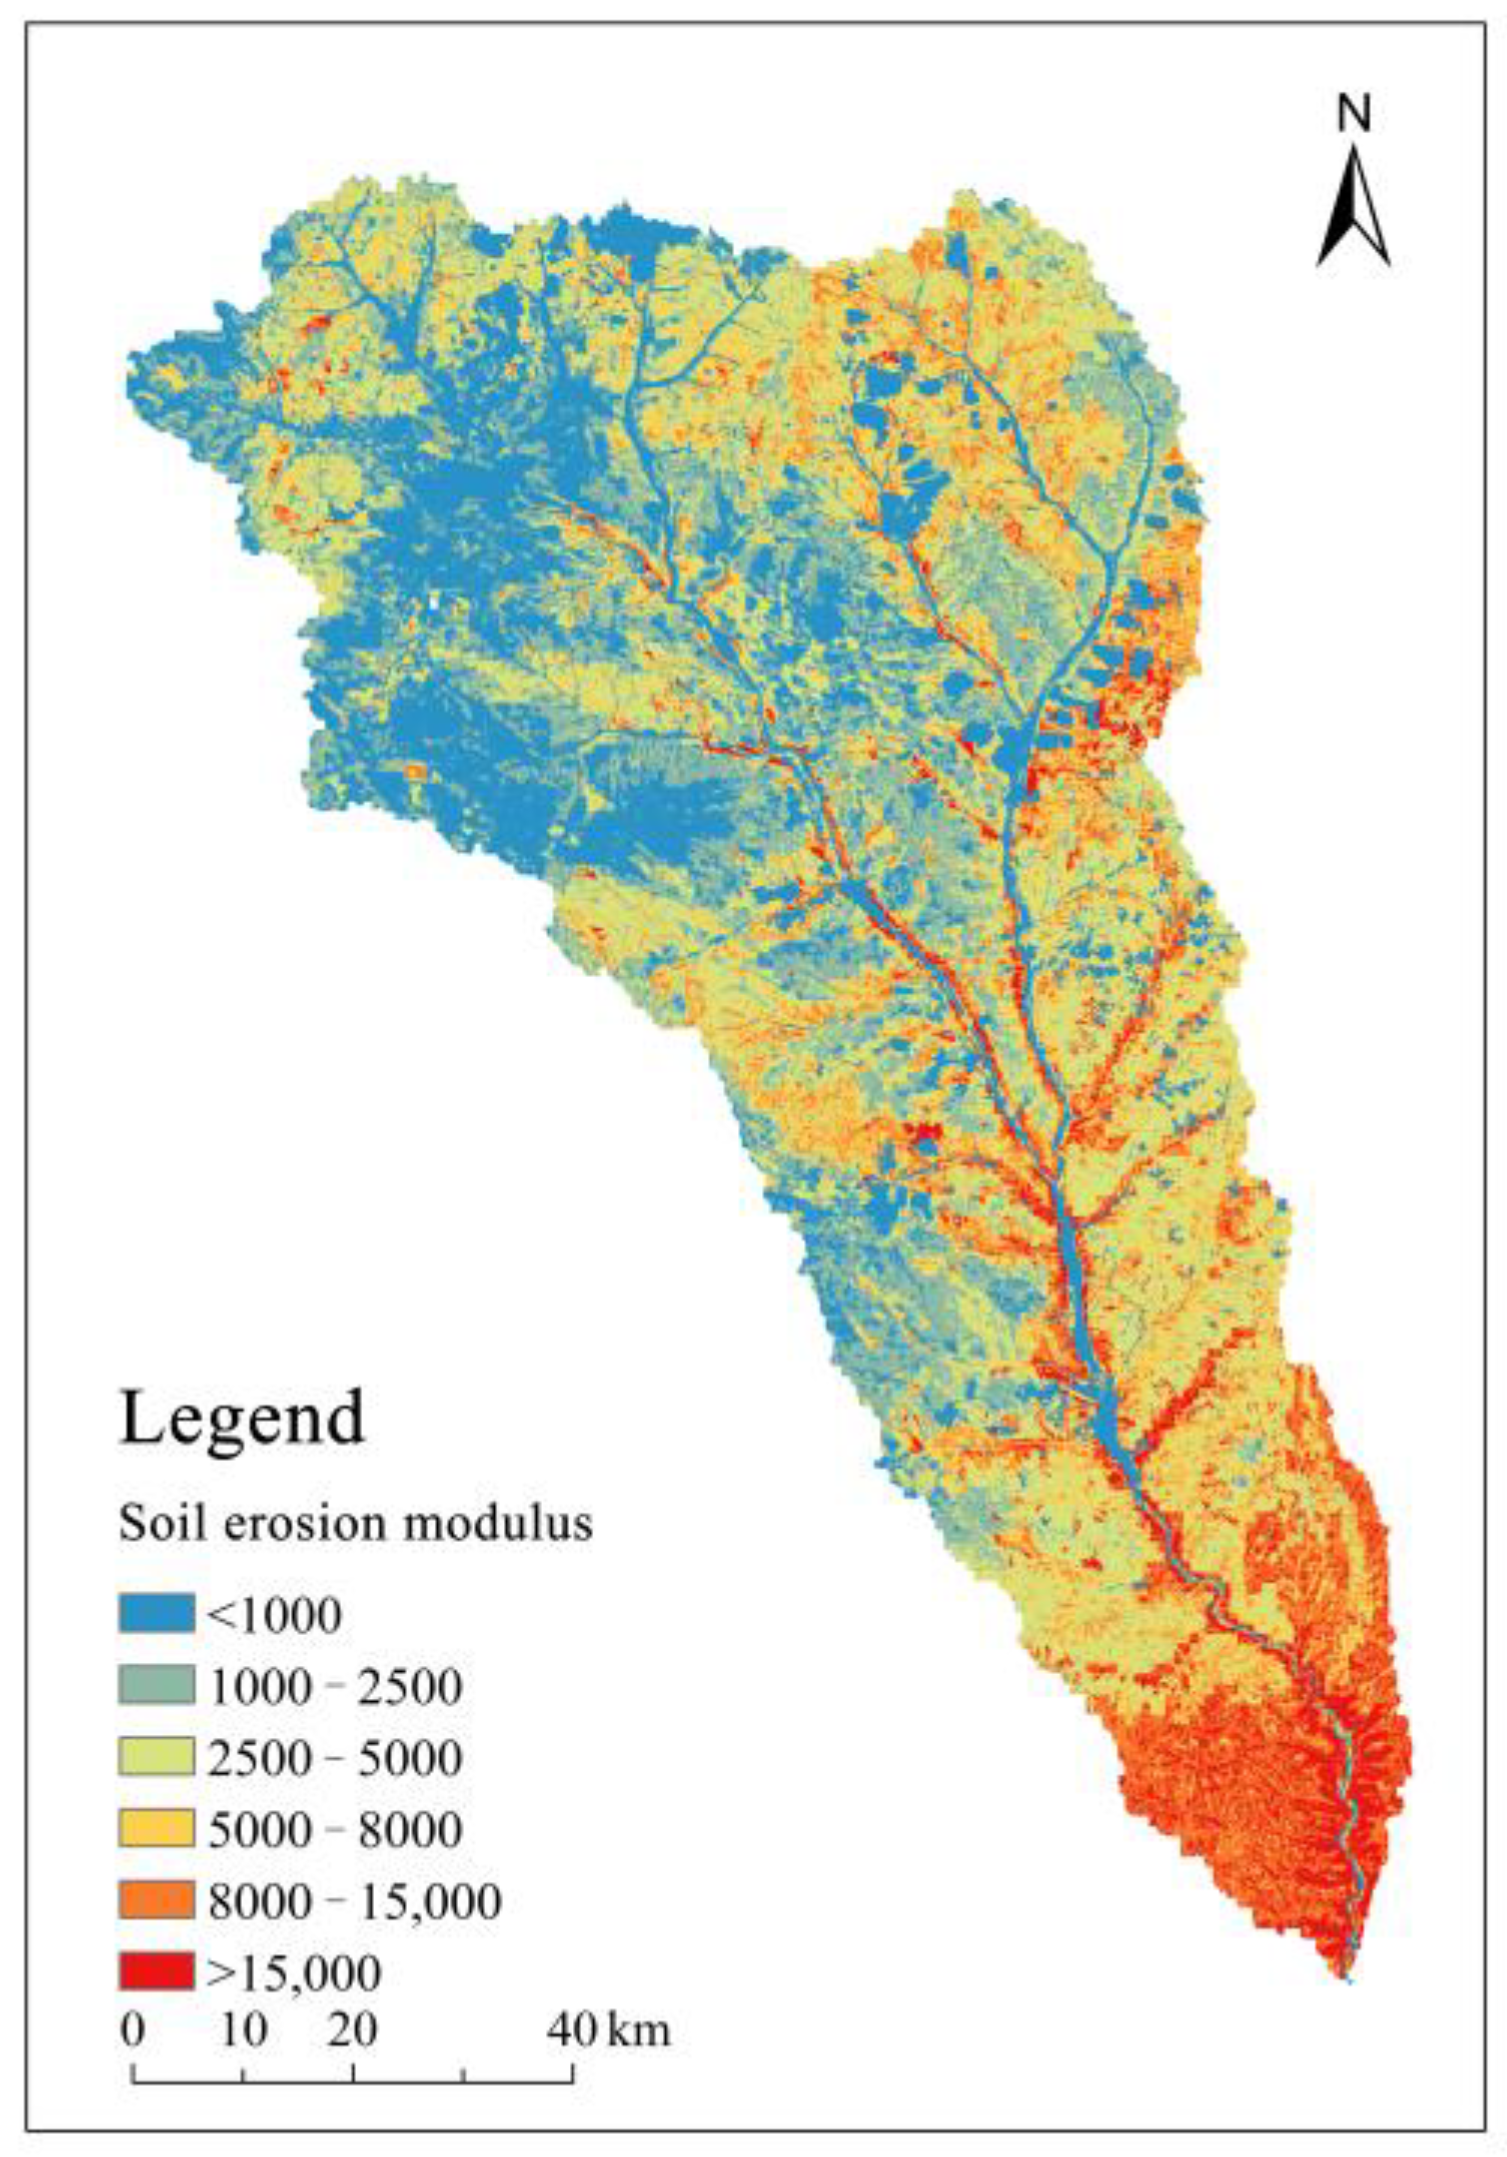
The average soil erosion modulus for the Kuye River Basin (Figure 7) is calculated at 4962.7 t/(km2 × a). Within this, 21.46% of the area falls within the 0–1000 t/(km2 × a) range, predominantly situated in the sandy and windy regions of the basin’s northwestern part. It is important to note that this erosion modulus may be underestimated in this region due to the exclusion of wind erosion in the RUSLE model. Areas with a soil erosion modulus of 1000–2500 t/(km2 × a) account for 20.22%, those with 2500–5000 t/(km2 × a) represent 25.49%, areas with 5000–8000 t/(km2 × a) make up 15.47%, and those exceeding 8000 t/(km2 × a) comprise 17.35%. The highest soil erosion moduli are predominantly observed in the hill and gully regions located downstream of the Kuye River Basin.
A digital elevation model (DEM) with a resolution of 30 m was used to divide the Kuye River Basin into 1534 subareas, with the boundaries of the sub-watersheds serving as the control areas. The resulting area statistics are detailed in Table 6.
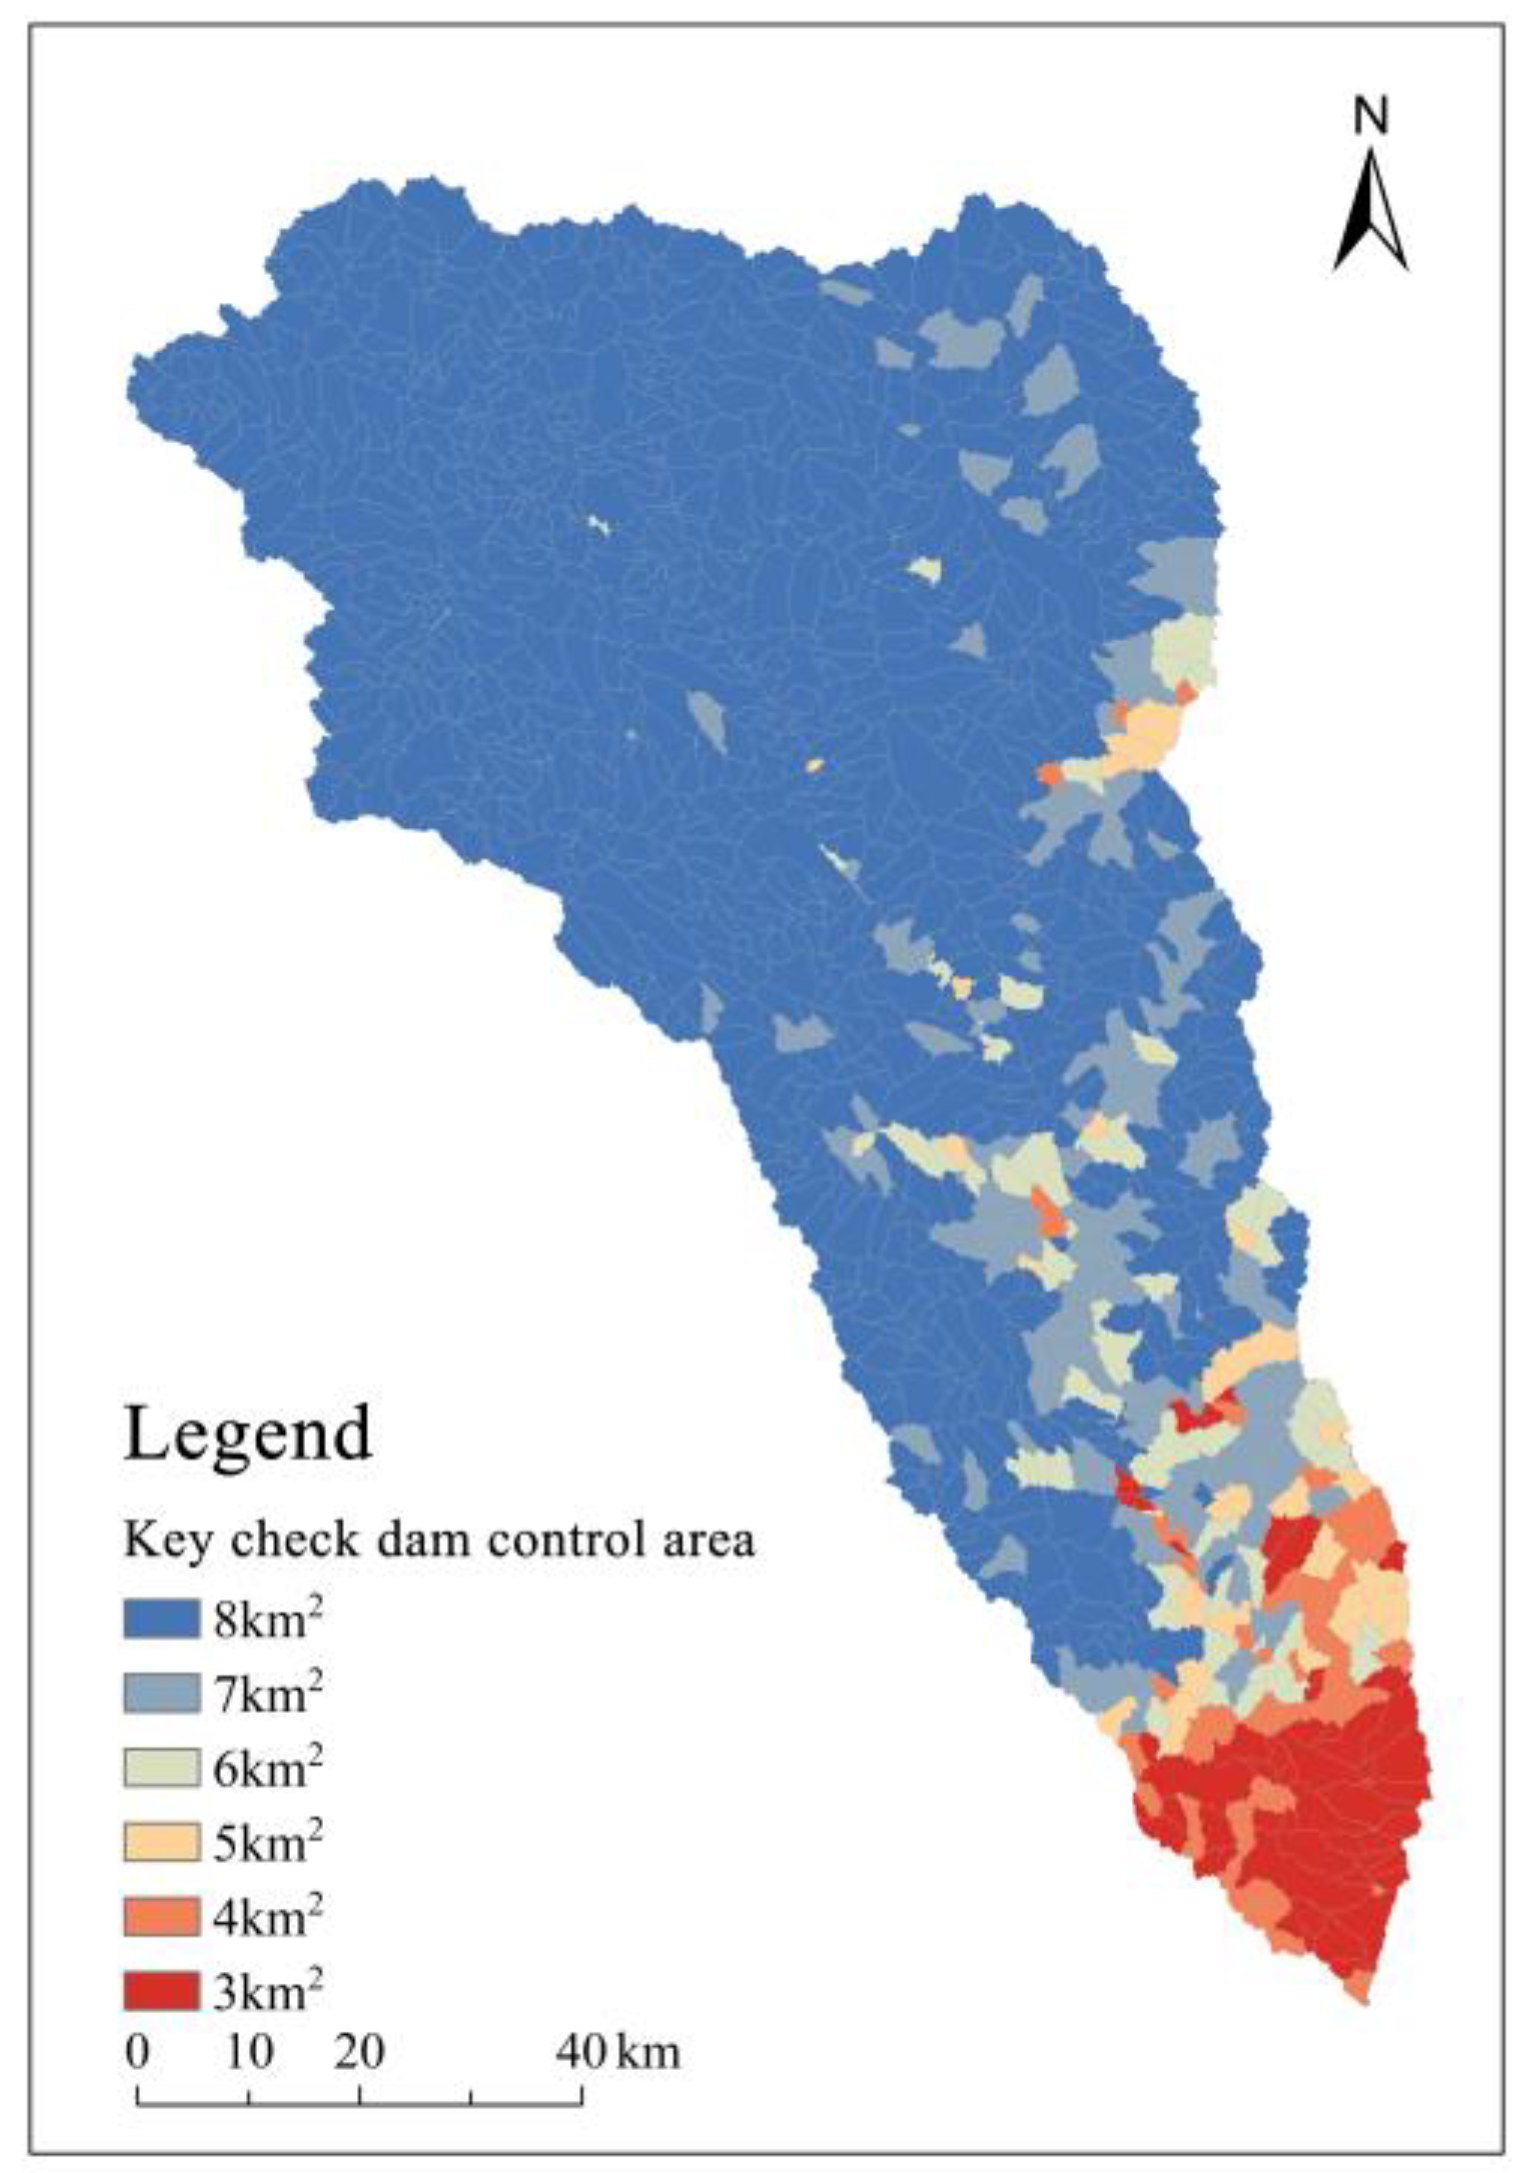
The average soil erosion modulus for each subarea was calculated using the sub-watershed boundaries. Subsequently, the control area for the backbone dams was determined according to the previously described methodology for varying soil erosion moduli (Figure 8).
The data summary indicates that the potential for constructing key check dams in the Kuye River Basin is 870 units. In this context, the ratio of large (key) check dams to medium-sized check dams to small-sized check dams is 1:2.04:13.50. Consequently, the potential number of medium-sized dams is 1775, and the potential number of small-sized dams is 11,745. The total potential for constructing key check dams, medium-sized dams, and small-sized dams combined is 14,390.

4. Discussion

4.1. Effects on Hydrological Processes of Soil and Water Conservation Measures

The establishment of vegetation has been widely recognized as an effective strategy for mitigating soil erosion, while simultaneously promoting both ecological and economic benefits. The mechanisms by which vegetation reduces runoff and sediment transport can be delineated into four primary processes: (1) Canopy interception, whereby the canopy redistributes precipitation, disperses rainwater, and modifies raindrop size and velocity. This process mitigates the erosive impact of raindrops, reduces direct damage to the soil surface, prevents the clogging of soil pores, enhances infiltration, and ultimately decreases surface runoff. (2) The role of grass and litter, which includes reducing rainfall intensity, increasing surface roughness, improving the slope’s resistance to erosion, and delaying the onset of surface runoff. (3) Root systems, which play a critical role in enhancing soil properties, such as compaction and bulk density, thereby increasing the soil’s resilience to erosive forces. (4) The relationship between vegetation and soil infiltration capacity, where forest and grassland-based soil and water conservation measures increase soil infiltration, thereby converting surface runoff into subsurface flow.
Sloping agricultural lands are the primary source of soil erosion in the Kuye River Basin. Due to the deep soil layers in the hill and gully regions, terracing is the predominant slope management practice. The efficacy of terraces in terms of water retention and soil conservation is primarily attributed to alterations in micro-topography following terrace construction. Based on observations from small plots and horizontal terraces, Wu et al. [37] reported that horizontal terraces can reduce slope erosion by 88%, leaving only 12% of the original erosion level, approaching 17%. Consequently, the soil and water conservation factor (P) for terraces can be interpreted, to some extent, as the ratio of the slope length and gradient factor of the terraces to that of the original slope. Additionally, through an analysis of terrain indices in sample plots, Gao [38] demonstrated that following the implementation of terracing, flow lengths were significantly reduced, with the maximum flow length decreasing from 143.86 m pre-terracing to 30.96 m post-terracing. This reduction in flow length also led to corresponding decreases in the stream power index and sediment transport capacity index, with the maximum values of these indices dropping from 2567.67 to 181.77 and 226.82 to 36.82, respectively.
Following the construction of check dams, the portion of the gully below the siltation surface—previously subject to severe erosion—becomes stabilized as sediment deposition prevents further erosion. The area above the siltation surface experiences a reduction in erosion due to the elevation of the erosion base level, which inhibits further downcutting of the channel and the collapse or expansion of the gully banks. This transition converts the system from an erosional regime to one of aggradation or equilibrium, thereby substantially reducing the overall erosion. The regulatory function of check dams on watershed hydrology and sediment dynamics is manifested through both direct sediment trapping and indirect erosion mitigation. Direct sediment trapping occurs as the dam physically intercepts sediment upstream. Indirect erosion mitigation is evident in three key ways: first, the creation of dam-impounded land covers the most severely eroded sections of the gully, preventing further erosion in these areas; second, the elevation of the erosion base level reduces the potential energy available for erosive processes, thereby decreasing the likelihood of gravitational erosion; and third, the reduction in flow velocity and erosive energy downstream of the dam decreases downstream erosion, a process that can be characterized as the “offsite erosion reduction” effect of check dams.

4.2. Objectives of Construction of Soil and Water Conservation Measures

The Loess Plateau employs three main vegetation restoration methods: closure, grass planting, and tree planting. It is crucial to select restoration techniques that are scientifically sound and locally appropriate. Given the variations in vegetation restoration strategies across different precipitation zones, we propose the following approach: in regions with precipitation below 375 mm, restoration should focus primarily on closure. For areas between 375 and 450 mm of rainfall, restoration efforts should emphasize grassland restoration. In regions with precipitation exceeding 450 mm, tree planting should be the primary restoration strategy. Thus, vegetation restoration within the 375–450 mm rainfall line should prioritize grass planting, while areas with precipitation greater than 450 mm should focus on tree planting.
Currently, sand delivery from the Huayuankou station is approximately 100 million tons, with the sand retention capacity of the check dams at its maximum. The anticipated peak in check dam sand retention failure is projected for 2035. Gao [38] suggests that future check dam construction should prioritize the middle and upper reaches of the Yellow River. Consequently, the primary areas in the Kuye River Basin requiring management for gully formation are the loess hills and gullies with rainfall levels below 450 mm, situated in the Loess Plateau’s hinterland. Furthermore, check dam construction should be implemented gradually and strategically, avoiding a hasty or indiscriminate approach, to prevent potential adverse impacts on the Yellow River’s water and sediment resources.
In line with soil and water conservation principles [38], it is recommended that all sloping arable land in the basin be reallocated to more sustainable uses. For sloping arable land characterized by a slow concentration and continuity, the construction of terraces is advised. For other types of sloping arable land, retirement and conversion to grassland or forest is the preferred approach. Data from the Loess Plateau indicate that terraced fields produce more than twice the yield of sloping arable land [39], while land equipped with check dams can yield up to four times as much [40]. Thus, the cessation of ploughing on these lands is unlikely to significantly affect regional food supply. Additionally, following the principle of “offsite” erosion reduction, robust gully-head protection projects should be implemented. These projects should be designed to absorb and disperse the erosive energy of incoming water from slopes, thereby mitigating gully erosion [41].
The slope gradient is a critical indicator of geomorphological development and a fundamental factor in soil and water conservation strategies. Slope classifications are generally divided into three categories: gentle slope (0–5°), moderate slope (5–45°), and steep cliff (>45°). In accordance with the Technical Procedures for Land Use Status Survey issued by the China Agricultural Zoning Committee in 1984 and the Law of the People’s Republic of China on Soil and Water Conservation, revised on 25 December 2010, slope values were reclassified into four categories in ArcGIS: <5°, 5–25°, 25–45°, and >45°.
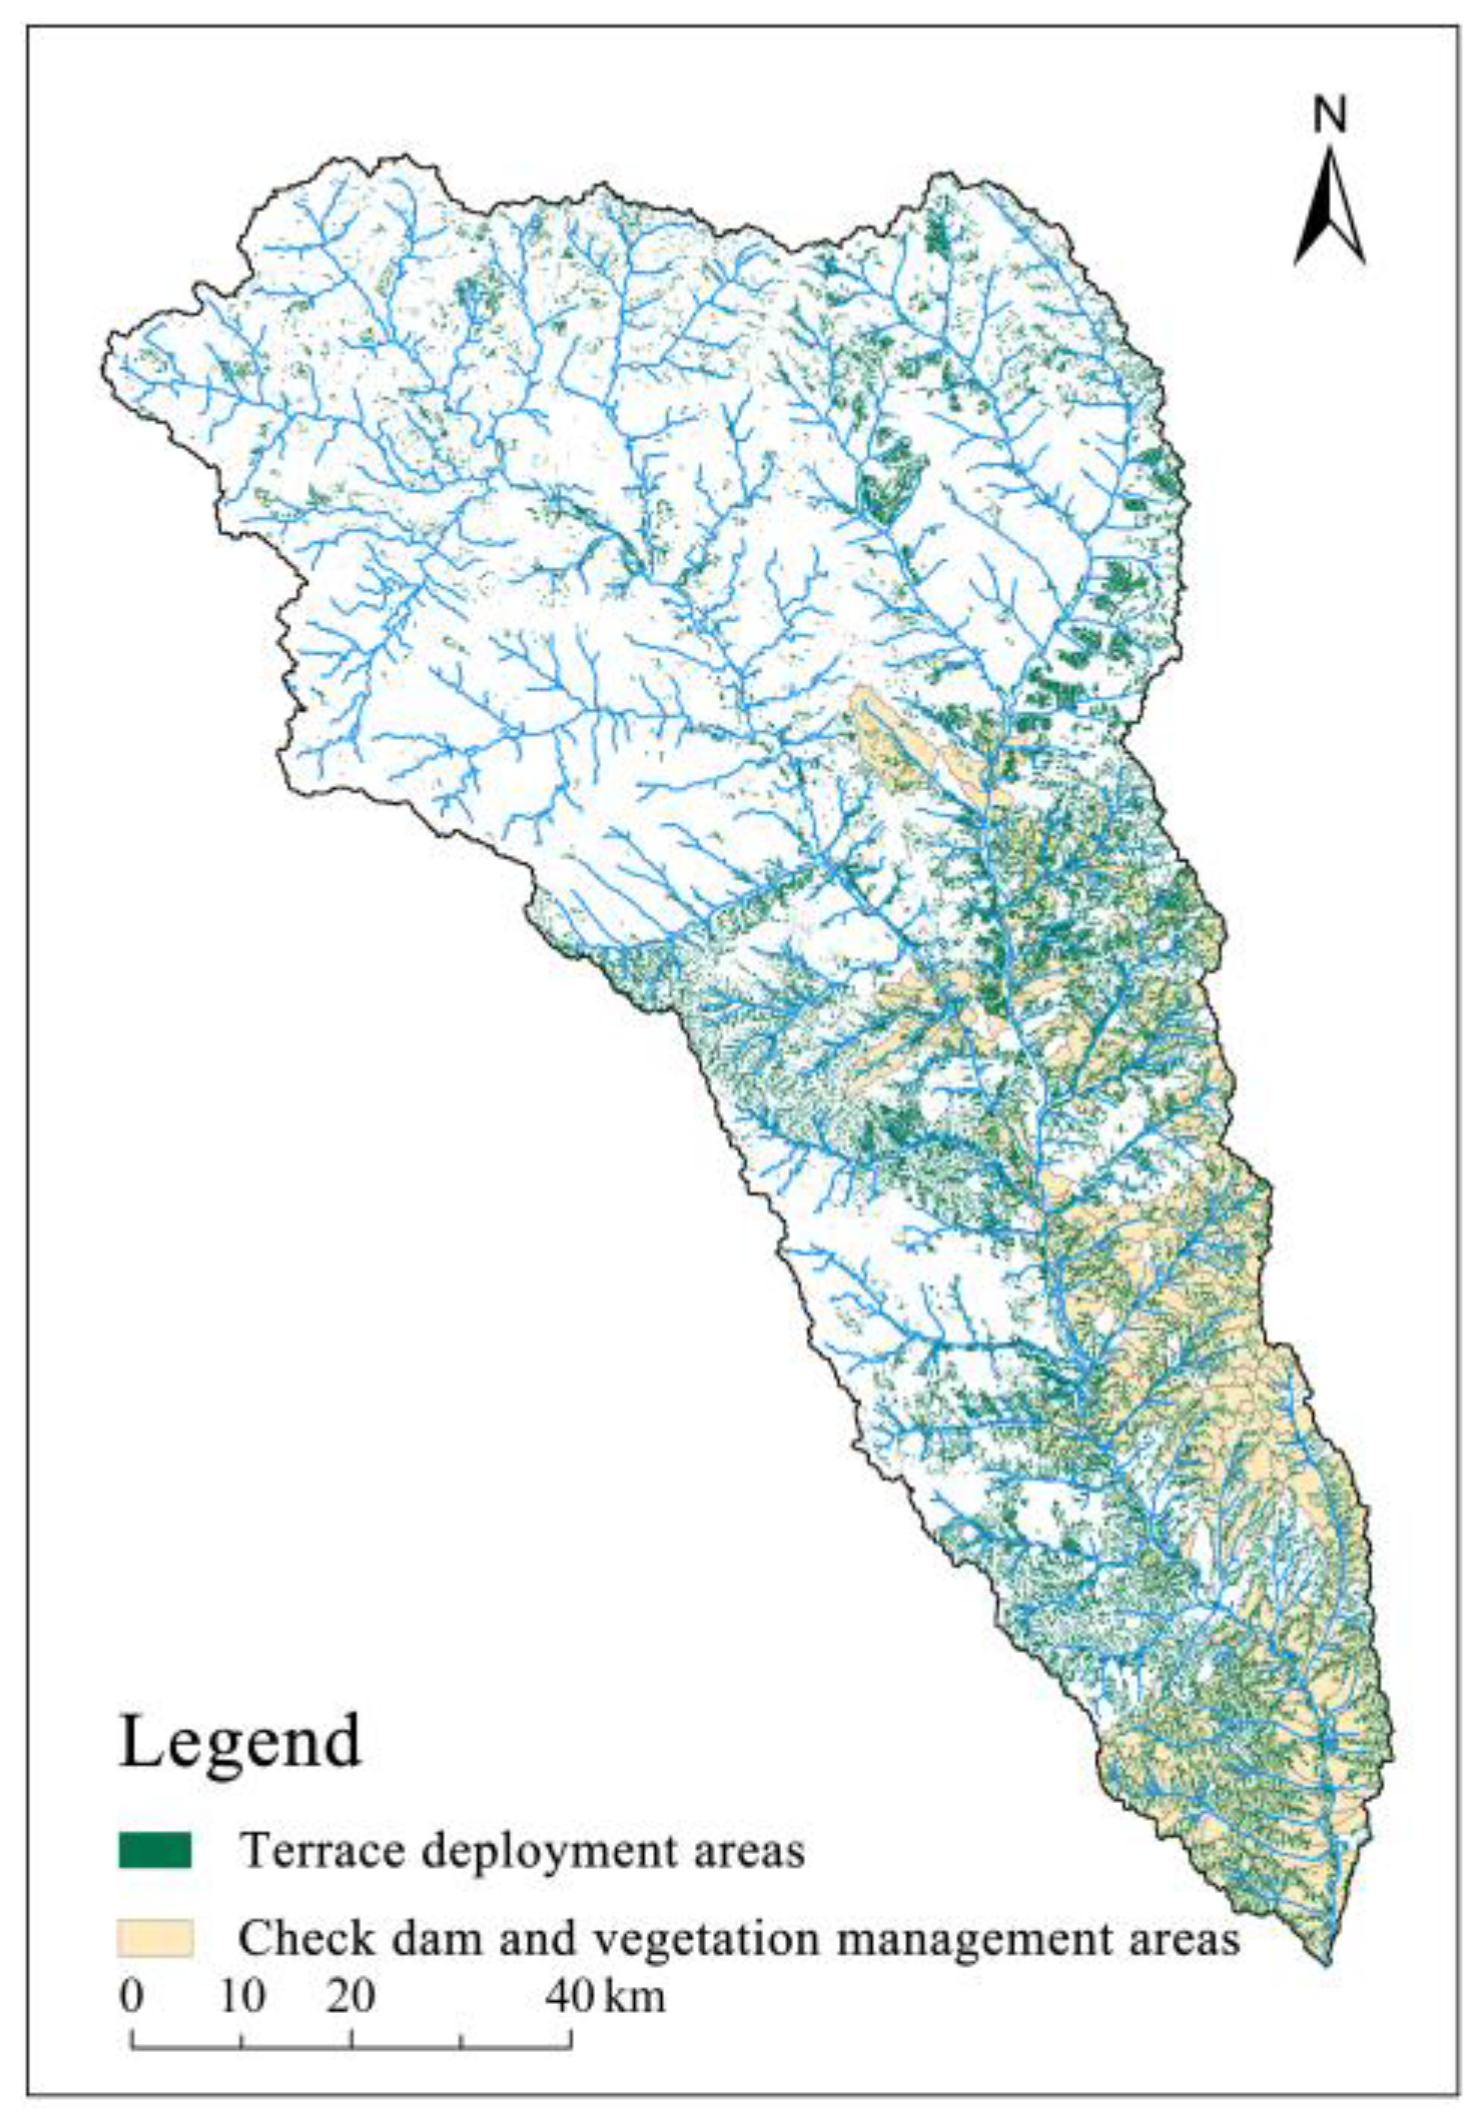
Land use data for the watershed were reclassified into six categories using the ArcGIS 10.2 platform, adhering to standard land use classification criteria. These categories included arable land, forest land, grassland, watersheds, construction land, and unused land. Cultivated land, construction land, and unused land were extracted and overlaid with slope data. It was determined that land with slopes between 5° and 25° could be effectively restored as terraces. Conversely, land with slopes greater than 45° should be managed using an integrated model for small watersheds, which combines slope forest and grassland measures with ditch silt dam interventions (Figure 9).
The areas designated for terracing measures in the Kuye River Basin are predominantly concentrated in the eastern region, with other areas being distributed intermittently. In contrast, the implementation of integrated management measures for small watersheds—including forestation, grassland restoration, and the construction of check dams—is primarily targeted at the southeastern part of the basin. This region, characterized by its hill and gully terrain, has a notably higher concentration of these measures compared to the northwestern region, which is more affected by wind and sand.
In alignment with the principles of soil erosion management, and considering the requirements for economic and social development as well as ecological security, it is essential to adjust the land use structure through a unified planning approach [42,43]. Additionally, a well-coordinated deployment of engineering, vegetation, and agricultural measures for soil erosion prevention and control should be implemented [44,45]. This strategy will contribute to the establishment of a comprehensive system for managing and mitigating soil erosion.

5. Conclusions

Vegetation controls soil and water loss in watersheds through mechanisms such as canopy interception, surface material attenuation, root-induced improvements in soil erosion resistance, and enhanced soil infiltration. The effectiveness of terraces in water retention and soil conservation is attributed to microtopographic changes induced by terrace construction. Check dams contribute to soil and water conservation by trapping sediment and raising the erosion base level.
The areas with the highest potential for vegetation restoration in the Kuye River Basin are predominantly located in the upper and middle reaches, closer to the river. The total potential for terracing in the basin is 1013.85 km2, with Level 1 potential primarily concentrated in river terraces, loess areas, and gently sloping regions on both sides. The potential for key check dams in the Kuye River Basin is estimated at 870 units, with medium-sized check dams having a potential of 1775 units and small-sized check dams a potential of 11,745 units, yielding a total potential of 14,390 check dams.
The areas earmarked for terracing measures are chiefly situated in the middle and lower reaches of the basin, in proximity to the river. Conversely, the areas designated for integrated management measures, including forestation, grassland restoration, and the construction of check dams, are predominantly located in the hill and gully regions to the east and south of the basin. The northwest region, characterized by wind and sand, shows a lesser distribution of these measures.
The strategic implementation of these measures, based on the outlined targets, will facilitate the protection, enhancement, and sustainable utilization of soil, water, and other natural resources within the watershed.

Author Contributions

Methodology, B.W.; Resources, J.M. and Z.Z.; Writing—original draft, B.L.; Writing—review & editing, P.L.; Funding acquisition, Z.L. and P.L. All authors have read and agreed to the published version of the manuscript.

Funding

This research was funded by Zhanbin Li and Peng Li and grants from the National Natural Science Foundation of China (2022YFF1300800 and U2243201).

Data Availability Statement

Restrictions apply to the availability of these data. The precipitation data were obtained from the China Meteorological Data Service Center and are available at https://data.cma.cn/ (accessed on 4 September 2024) with the permission of the China Meteorological Data Service Center. The soil data were obtained from the National Tibetan Plateau Science Data Center and are available at http://data.tpdc.ac.cn/zh-hans/ (accessed on 4 September 2024) with the permission of the National Tibetan Plateau Science Data Cente. The DEM data and vegetation data were obtained from the International Scien-tific Data Mirror and are available at http://www.gscloud.cn (accessed on 4 September 2024) with the permission of the International Scien-tific Data Mirror.

Conflicts of Interest

We declare that we do not have any commercial or associative interest that represents a conflict of interest in connection with the work submitted.

References

  1. Lu, D.; Sun, D. Development and management tasks of the Yellow River Basin: A preliminary understanding and suggestion. Acta Geogr. Sin. 2019, 74, 2431–2436. (In Chinese) [Google Scholar]
  2. Xi, J. Speech at the Symposium on Ecological Protection and High—Quality Development of the Yellow River Basin. China Water Resour. 2019, 20, 1–3. (In Chinese) [Google Scholar]
  3. Yao, W. Development Opportunity and Scientific Positioning of Soil and Water Conservation of the Yellow River in the New Era. Yellow River 2019, 41, 1–7. (In Chinese) [Google Scholar]
  4. Zuo, Q. Research Framework for Ecological Protection and High-Quality Development in the Yellow River Basin. Yellow River 2019, 41, 1–6+16. (In Chinese) [Google Scholar]
  5. Zhao, G.; Mu, X.; Wen, Z.; Wang, F.; Gao, P. Soil Erosion, Conservation, and Eco-Environment Changes in the Loess Plateau of China. Land Degrad. Dev. 2013, 24, 499–510. [Google Scholar] [CrossRef]
  6. Li, S.; Yang, L.; Wang, G.; Hou, J.; Xin, Z.; Liu, G.; Fu, B. The management of soil and water conservation in the Loess Plateau of China: Present situations, problems, and counter-solutions. Acta Ecol. Sin. 2019, 39, 7398–7409. (In Chinese) [Google Scholar]
  7. Liu, G.; Shangguan, Z.; Yao, W.; Yang, Q.; Zhao, M.; Dang, X.; Guo, M.; Wang, G.; Wang, B. Ecological Effects of Soil Conservation in Loess Plateau. Bull. Chin. Acad. Sci. 2017, 32, 11–19. (In Chinese) [Google Scholar]
  8. Hu, C. Changes in runoff and sediment loads of the Yellow River and its management strategies. J. Hydroelectr. Eng. 2016, 35, 1–11. (In Chinese) [Google Scholar]
  9. Yao, W.; Gao, Y.; Zhang, X. Relationship evolution between runoff and sediment transport in the Yellow River and related scientific issues. Sci. Soil Water Conserv. 2020, 18, 1–11. (In Chinese) [Google Scholar]
  10. Miyawaki, A. Restoration of living environment based on vegetation ecology: Theory and practice. Ecol. Res. 2004, 19, 83–90. [Google Scholar] [CrossRef]
  11. Pu, H. Shaanxi-Gansu-Ningxia Terrace Construction Project of National Comprehensive Agricultural Development: Urgency and Potential Analysis of Langcha Project Construction in Xiji of Ningxia. Value Eng. 2013, 32, 100–101. (In Chinese) [Google Scholar]
  12. Gao, Y.; Tian, J.; Li, J. Check-dam construction potential analysis based on efficient use of water and soil resources. Yellow River 2019, 41, 106–109. (In Chinese) [Google Scholar]
  13. He, Y.; Mu, X.; Jiang, X.; Song, J. Runoff Variation and Influencing Factors in the Kuye River Basin of the Middle Yellow River. Front. Environ. Sci. 2022, 10, 877535. [Google Scholar] [CrossRef]
  14. Liu, X.; Li, H.; Li, X.; Gao, Y. Analysis on the cause of sharp decrease of runoff and sediment from Kuye River in Loess Plateau. J. Hydraul. Eng. 2022, 53, 296–305. (In Chinese) [Google Scholar]
  15. Gao, H.; Pang, G.; Li, Z.; Cheng, S. Evaluating the potential of vegetation restoration in the Loess Plateau. Acta Geogr. Sin. 2017, 72, 863–874. (In Chinese) [Google Scholar]
  16. Zhao, Z.; Dai, E. Vegetation cover dynamics and its constraint effect on ecosystem services on the Qinghai-Tibet Plateau under ecological restoration projects. J. Environ. Manag. 2024, 356, 120535. [Google Scholar] [CrossRef]
  17. Chen, D.; Wei, W.; Daryanto, S.; Tarolli, P. Does terracing enhance soil organic carbon sequestration? A national-scale data analysis in china. Sci. Total Environ. 2020, 721, 137751. [Google Scholar] [CrossRef]
  18. Pang, G.; Yang, Q.; Wang, C.; Li, R.; Zhang, L. Quantitative assessment of the influence of terrace and check dam construction on watershed topography. Front. Earth Sci. 2020, 14, 360–375. [Google Scholar] [CrossRef]
  19. Wischmeier, W.H.; Smith, D.D. Rainfall energy and its relationship to soil loss. Trans. Am. Gephys. Union 1958, 39, 285–291. [Google Scholar] [CrossRef]
  20. Wischmeier, W.H. A rainfall erosion index for a universal soil-loss equation1. Soil Sci. Soc. Am. J. 1959, 23, 246–249. [Google Scholar] [CrossRef]
  21. Qu, Y. Research on the control of soil and water loss in the Yellow River Basin in the new era Based on GIS and RUSLE. In Proceedings of the 4th International Conference on Economic Development and Innovation (EDI 2023), Hong Kong, China, 19–20 August 2023; pp. 93–99. [Google Scholar]
  22. Wang, Y.; Wu, C.; Zhao, Z.; Yu, B.; Liu, G. Assessing spatiotemporal heterogeneity of coastal organic nonpoint source pollution via soil erosion in Yellow River Delta, China. Ecol. Indic. 2024, 166, 112519. [Google Scholar] [CrossRef]
  23. Zhang, Y.; Zhang, P.; Liu, Z.; Xing, G.; Chen, Y.; Wang, Q. Dynamic analysis of soil erosion in the affected area of the lower Yellow River based on RUSLE model. Heliyon 2024, 10, e23819. [Google Scholar] [CrossRef] [PubMed]
  24. Yuan, S.; Xu, Q.; Zhao, K.; Zhou, Q.; Wang, X.; Zhang, X.; Chen, W.; Ji, X. Dynamic analyses of soil erosion and improved potential combining topography and socio-economic factors on the Loess Plateau. Ecol. Indic. 2024, 160, 111814. [Google Scholar] [CrossRef]
  25. Williams, J.R.; Renard, K.G.; Dyke, P.T. EPIC: A new method for assessing erosion’s effect on soil productivity. J. Soil Water Conserv. 1983, 38, 381–383. [Google Scholar] [CrossRef]
  26. Yao, L.; Xu, Y.; Hu, J.; Wang, Z.; Yao, W.; Shen, Z. Study on Soil Erodibilty Factor K on Soil Cover Area of Pisha Sandstone Region. J. Basic Sci. Eng. 2020, 28, 763–773. (In Chinese) [Google Scholar]
  27. Li, P.; Xie, Z.; Yan, Z.; Dong, R.; Tang, L. Assessment of vegetation restoration impacts on soil erosion control services based on a biogeochemical model and RUSLE. J. Hydrol. Reg. Stud. 2024, 53, 101830. [Google Scholar] [CrossRef]
  28. Wang, X.; Xiao, F.; Feng, X.; Fu, B.; Zhou, Z.; Chan, C. Soil conservation on the Loess Plateau and the regional effect: Impact of the ‘Grain for Green’ Project. Earth Environ. Sci. Trans. R. Soc. Edinb. 2019, 109, 461–471. [Google Scholar] [CrossRef]
  29. Zhang, H.; Yang, Q.; Li, R.; Liu, Q.; Moore, D.; He, P.; Ritsema, C.J.; Geissen, V. Extension of a GIS procedure for calculating the RUSLE equation LS factor. Comput. Geosci. 2013, 52, 177–188. [Google Scholar] [CrossRef]
  30. Zhang, Y.; Liu, B.; Shi, P.; Jiang, S. Crop cover factor estimating for soil loss prediction. Acta Ecologica Sinica. 2001, 7, 1050–1056. (In Chinese) [Google Scholar]
  31. Jiao, J.; Wang, W.; Li, J. Effective Cover Rate of Woodland and Grassland for Soil and Water Conservation. Chin. J. Plant Ecol. 2000, 5, 608–612. (In Chinese) [Google Scholar]
  32. Zhang, G.; Liang, Y. A Summary of Impact of Vegetation Coverage on Soil and Water Conservation Benefit. Res. Soil Water Conserv. 1996, 2, 104–110. (In Chinese) [Google Scholar]
  33. Wang, W.; Jiao, J. Quantitative Evaluation on Factors Influencing Soil Erosion in China. Bull. Soil Water Conserv. 1996, 5, 1–20. (In Chinese) [Google Scholar]
  34. Guo, W.; Wang, W.; Xu, Q.; Hu, J.; Zhu, L. Distribution, failure risk and reinforcement necessity of check-dams on the loess plateau: A review. J. Mt. Sci. 2021, 18, 11. [Google Scholar] [CrossRef]
  35. Tian, P.; Zhao, G.; Mu, X.; Wang, F.; Gao, P.; Mi, Z. Check dam identification using multisource data and their effects on streamflow and sediment load in a chinese loess plateau catchment. J. Appl. Remote Sens. 2013, 7, 63–72. [Google Scholar] [CrossRef]
  36. Yan, Q.; Lei, T.; Yuan, C.; Lei, Q.; Yang, X.; Zhang, M.; Su, G.; An, L. Effects of watershed management practices on the relationships among rainfall, runoff, and sediment delivery in the hilly-gully region of the loess plateau in china. Geomorphology 2015, 228, 735–745. [Google Scholar] [CrossRef]
  37. Wu, F.; Zhang, Y.; Wang, J. Study on the Benefits of Level Terrace on Soil and Water Conservation. Sci. Soil Water Conserv. 2004, 1, 34–37. (In Chinese) [Google Scholar]
  38. Gao, H.; Li, Z.; Jia, L.; Li, P.; Xu, G.; Ren, Z.; Pang, G.; Zhao, B. Capacity of soil loss control in the Loess Plateau based on soil erosion control degree. J. Geogr. Sci. 2016, 26, 457–472. [Google Scholar] [CrossRef]
  39. Shi, P.; Feng, C.; Gao, H.; Li, P.; Zhang, X.; Zhu, T.; Li, Z.; Xu, G.; Ren, Z.; Xiao, L. Has “Grain for Green” threaten food security on the Loess Plateau of China? Ecosyst. Health Sustain. 2020, 6, 1709560. [Google Scholar] [CrossRef]
  40. Ma, A. Analysis on Monitoring Increasing Production Benefis with Silt Arresters. Yellow River 2012, 34, 92–93+96. (In Chinese) [Google Scholar]
  41. Adugna, O.; Alemu, D. Evaluation of brush wood with stone check dam on gully rehabilitation. J. Clean WAS 2017, 1, 10–13. [Google Scholar] [CrossRef]
  42. Chi, W.; Zhao, Y.; Kuang, W.; He, H. Impacts of anthropogenic land use/cover changes on soil wind erosion in China. Sci. Total Environ. 2019, 668, 204–215. [Google Scholar] [CrossRef]
  43. Nut, N.; Mihara, M.; Jeong, J.; Ngo, B.; Sigua, G.; Prasad, P.; Reyes, M. Land use and land cover changes and its impact on soil erosion in stung sangkae catchment of cambodia. Multidisciplinary Digital Publishing Institute. 2021, 16. [Google Scholar] [CrossRef]
  44. Grimaldi, S.; Angeluccetti, I.; Coviello, V.; Vezza, P. Cost-effectiveness of soil and water conservation measures on the catchment sediment budget–the laaba watershed case study, burkina faso. Land Degrad. Dev. 2015, 26, 737–747. [Google Scholar] [CrossRef]
  45. Hengsdijk, H.; Meijerink, G.; Mosugu, M. Modeling the effect of three soil and water conservation practices in tigray, ethiopia. Agric. Ecosyst. Environ. 2005, 105, 29–40. [Google Scholar] [CrossRef]
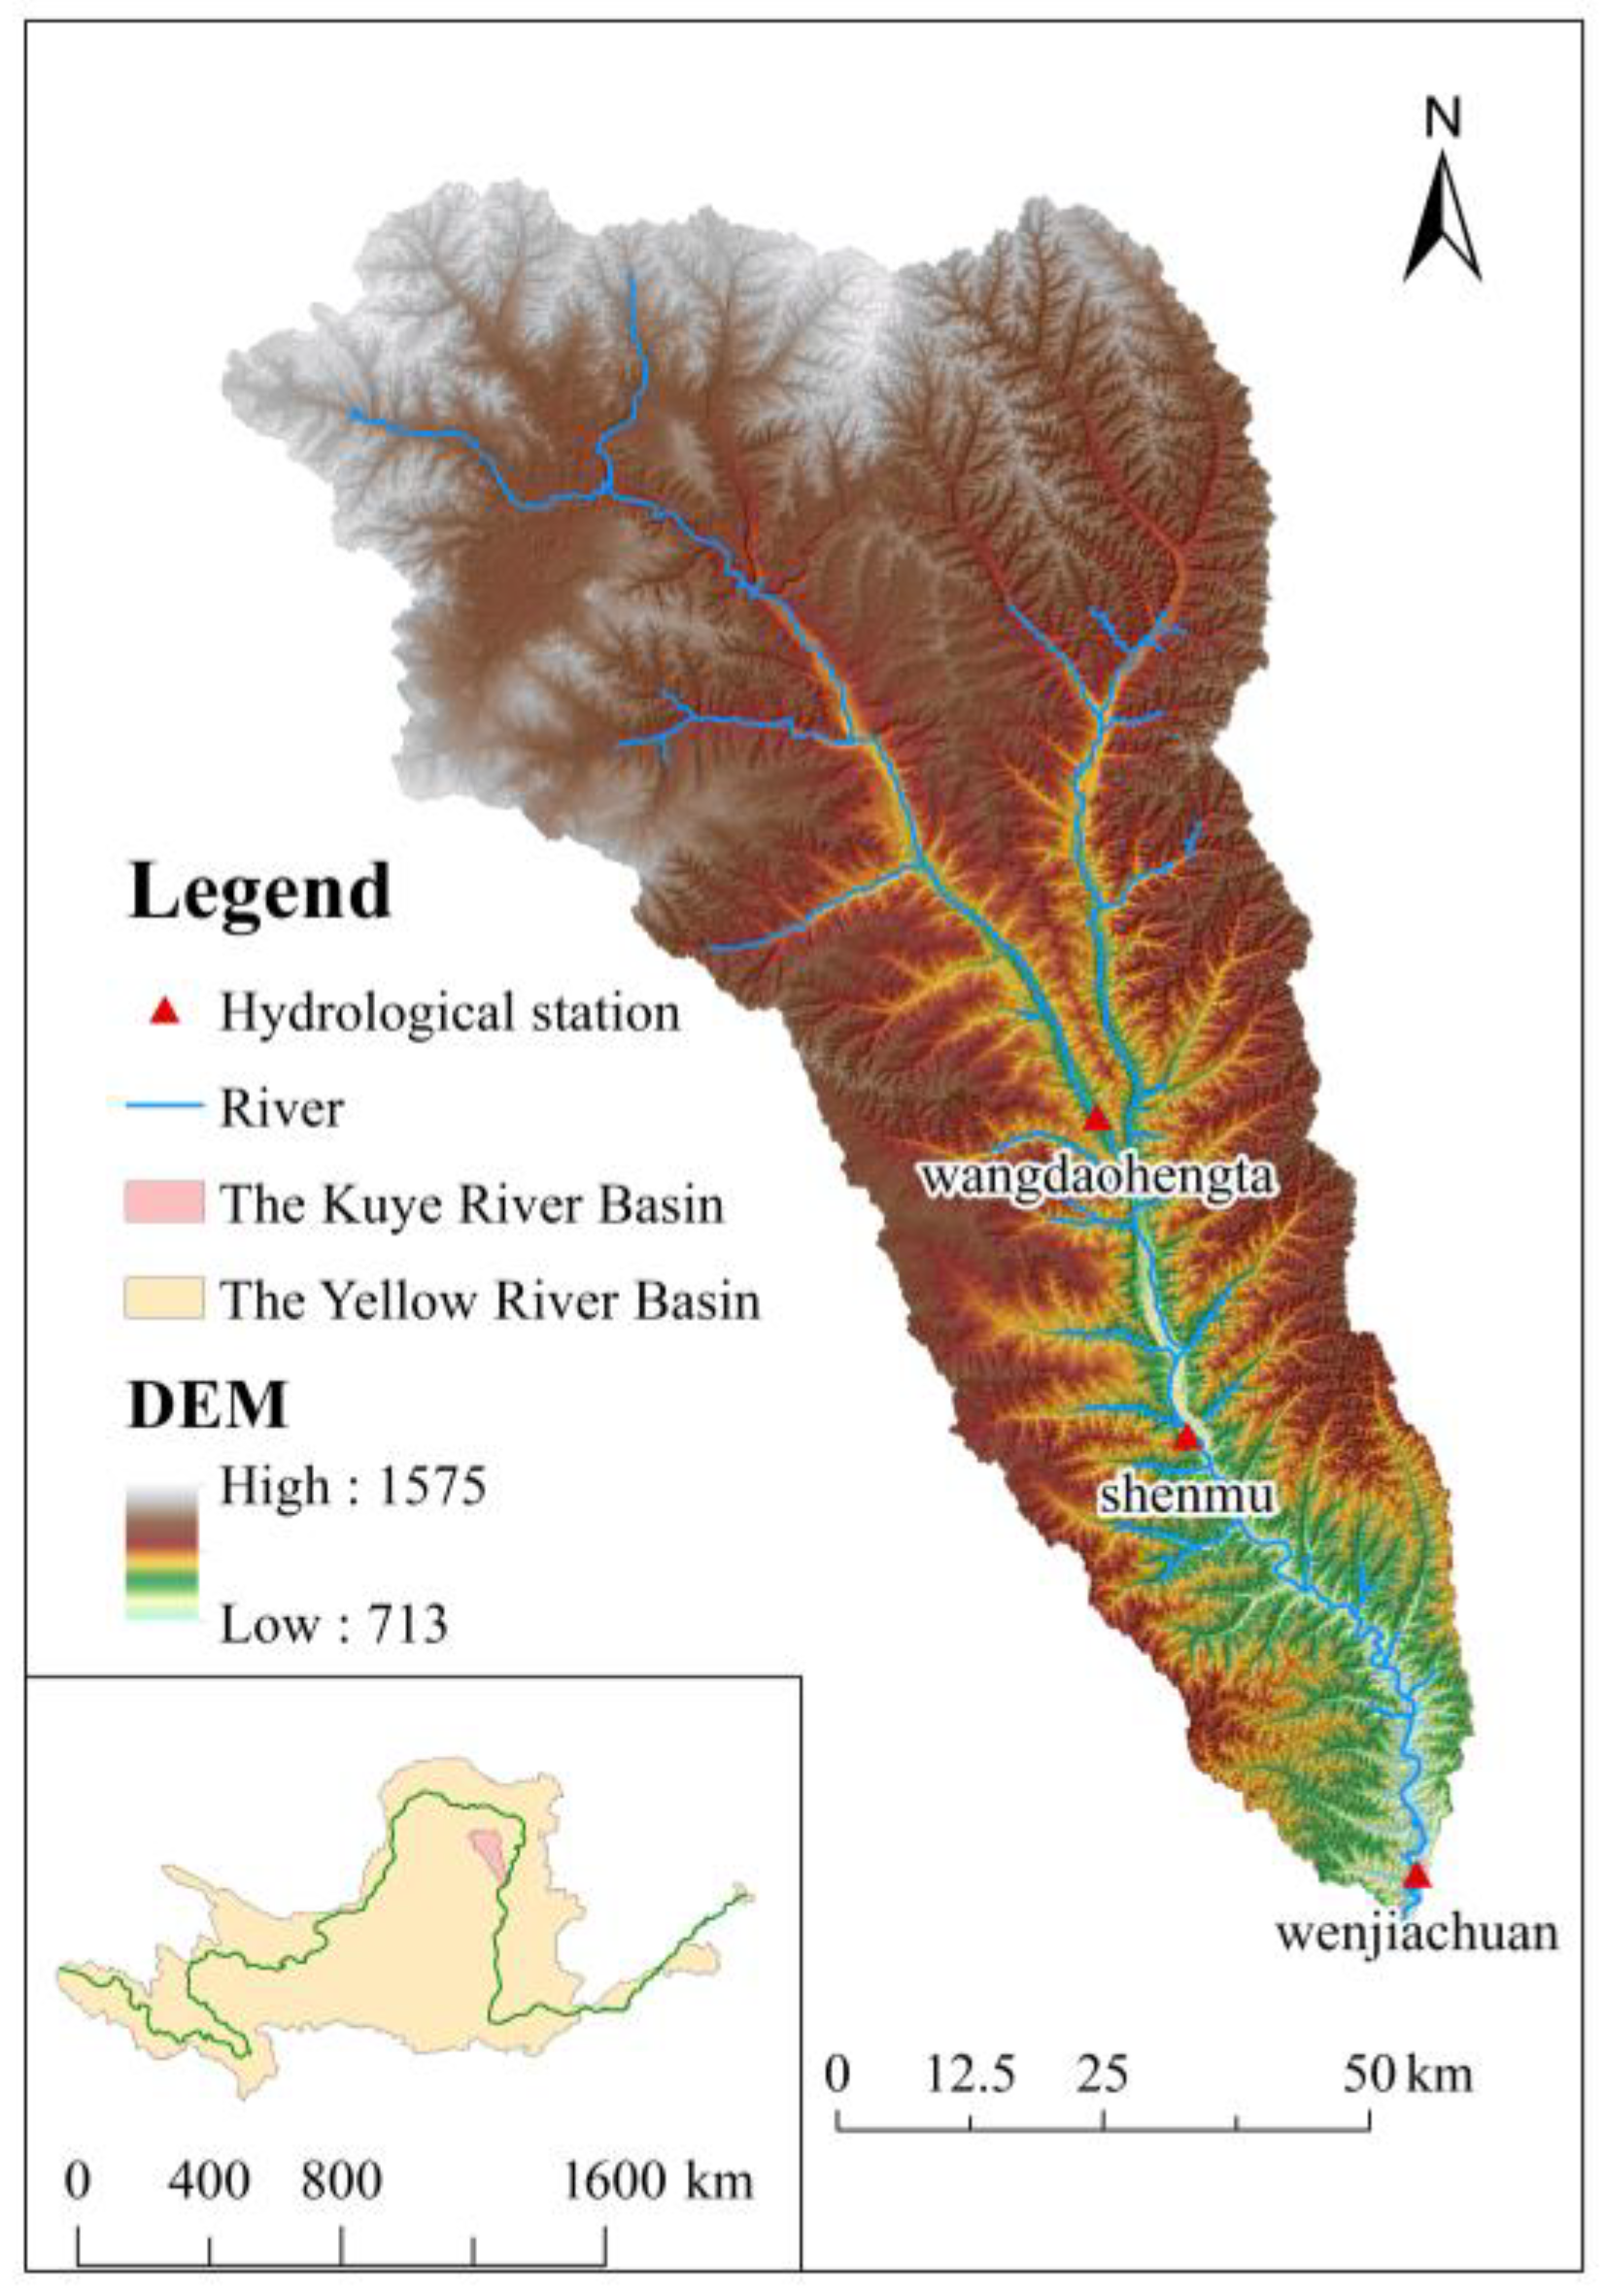
Figure 1. Geographic location of the Kuye River Basin.
Water 16 02868 g001
Figure 2. Flowchart of the overall methodology.
Water 16 02868 g002
Figure 3. Distribution of soil erosion factors in the Kuye River Basin.
Water 16 02868 g003
Figure 4. Map of the current status of the NDVI and its restoration potential in the Kuye River Basin.
Water 16 02868 g004
Figure 5. Index of revegetation potential of the Kuye River Basin.
Water 16 02868 g005
Figure 6. Classification of potential for terracing in the Kuye River Basin.
Water 16 02868 g006
Figure 7. Soil erosion modulus in the Kuye River Basin.
Water 16 02868 g007
Figure 8. Spatial distribution of the key check dam control area.
Water 16 02868 g008
Figure 9. Soil and water conservation measures’ construction target area of the Kuye River Basin.
Water 16 02868 g009
Table 1. Aridity index codes (0.1 mm).
EncodingsLower BoundaryUpper Boundary
134003500
235003600
336003700
437003800
538003900
639004000
740004100
841004200
942004300
1043004400
1144004500
1245004600
1346004700
1447004800
Table 2. Terrain factor coding scheme.
EncodingsTopographic Features
11Slope less than 15°, shady slope
12Slope less than 15°, sunny slope
21Slope greater than 15°, shady slope
22Slope greater than 15°, sunny slope
Table 3. C values for different vegetation cover in the Kuye River Basin.
Vegetation Cover/%0–2020–4040–6060–8080–100
woodland0.250.120.060.020.004
grassland0.450.240.150.090.043
Table 4. Potential for vegetation establishment in the Kuye River Basin.
Potential ZoningArea/km2Proportion/%
Level 1 potential area21.970.25
Level 2 potential area845.839.78
Level 3 potential area1883.3921.79
Level 4 potential area3204.5537.07
Level 5 potential area2689.2731.11
Total8645100.00
Table 5. Table of potential for terracing of the Kuye River Basin.
Potential ZoningArea/km2Proportion/%
Level 1 potential area142.8014.08
Level 2 potential area241.7023.84
Level 3 potential area152.4715.04
Level 4 potential area392.5038.71
Level 5 potential area84.378.32
Total1013.85100.00
Table 6. Descriptive statistics of sub-watershed area (km2).
StatisticQuantitiesAverage ValueStandard DeviationMinimumMaximumP25P50P75
Results15345.535.530.154.871.484.377.89
Disclaimer/Publisher’s Note: The statements, opinions and data contained in all publications are solely those of the individual author(s) and contributor(s) and not of MDPI and/or the editor(s). MDPI and/or the editor(s) disclaim responsibility for any injury to people or property resulting from any ideas, methods, instructions or products referred to in the content.