Abstract
Digital technology is gradually emerging as a new driving force in the field of water resources management. In this paper, we conduct a thorough analysis of panel data from 30 provinces in China spanning from 2013 to 2022. Utilizing the fixed-effects model, the mediation effect model, a panel threshold model, and a coupling coordination degree model, this study empirically examines the impact of digital technology on water resources management. The findings are as follows: (1) The direct impact of digital technology on water resources management is significantly positive at the 1% level, with notable regional variations. (2) Digital technology improves water management through green innovation. (3) In the process of digital technology promoting water resources management, green innovation exhibits a threshold effect, with an estimated threshold value of 1.840. (4) During the sample period, the national coupling coordination degree of digital technology and water resources management was barely coordinated, showing the following characteristics: Eastern China > Western China > Central China. These research conclusions will offer valuable insights and directions for advancing sustainable water resources management strategies and fostering the deep integration of digital technology and water resources management.
1. Introduction
Water, a precious and indispensable natural resource on earth, serves as the cornerstone of economic and social development and is pivotal in maintaining ecological health [1]. Integrated water resources management strives to sustainably and effectively manage land, water, and other related resources more effectively in a sustainable way [2]. Nevertheless, there is a formidable challenge posed by safeguarding natural ecosystems while fulfilling fundamental human needs and navigating the myriad conflicts surrounding these resources. The United Nations Water Scarcity report estimates that by 2025, 1.8 billion people will live in water-scarce regions, highlighting the urgent need for innovative water resources management. As the largest developing country in the world, China is also one of the countries with severe shortages of water resources per capita, a situation wherein unreasonable utilization of water resources and water pollution are widespread. Additionally, climate change is exacerbating water scarcity [3]. Currently, research on water resources management primarily focuses on three aspects. At the macro level, scholars have conducted comprehensive evaluations of water resources carrying capacity and water management performance [4,5]. From the spatio-temporal perspective, scholars have further explored the balance distribution of water resources and the phenomenon of decoupling, stating that the distribution of water resources in China shows a trend of a transition from “highly balanced” to “highly unbalanced” from east to west [6]. At the micro-level, traditional water resources management approaches encounter difficulties in real-time data collection and analysis and smart decision-making. However, artificial intelligence and big data play pivotal roles in water quality monitoring and water supply-and-demand forecasting [7]. Evidence shows that innovative water resources management requires collaborative efforts regarding technology [8], funding [9], policies and regulations [10], and other aspects.
In today’s world, the process of globalization is accelerating rapidly, and a digital information technology revolution led by a new round of technological and industrial revolution is sweeping across the globe [11]. Also, research on digital technology is increasingly abundant. The connotations and evolution of digital technology indicate a collection and paradigm of various intelligent and innovative technologies used for connectivity, communication, and automation [12]. The German government introduced the Future Cision for the Development of Digital Technology in 2013, known as the “paradigm” of Industry 4.0. Nowadays, the scope of digital technology has expanded from data-based technologies such as cloud computing and artificial intelligence to technologies with physical manifestations, gradually forming a comprehensive technological application system [13]. According to the Digital China Development Report (2023), in 2022, China filed nearly 32,000 PCT international patent applications in the information sector, accounting for 37% of the global total [14]. Against the backdrop of the digital transformation across industries, digital-related topics such as digitalization, the digital economy, and digital finance have become popular [15,16,17]. For example, Costa et al. used a combination of qualitative and quantitative methods to conclude that digital technology offers significant advantages in improving crop yields and reducing environmental footprints [18]. Additionally, the relationship between digital technology and natural resources has attracted the attention of many scholars. Digital technology can play an active role in improving production efficiency, reducing the demand for natural resources, decreasing the use of non-renewable resources, and enhancing the effectiveness of environmental monitoring [19]. However, the long-term effects of digital transformation on environmental sustainability remain uncertain, with this process being described as a potential “accelerator”. In the initial stages, digitalization directly increases resource and energy consumption without necessarily improving energy efficiency [20]. Furthermore, the abundance of natural resources also influences the pace of digital transformation. Studies have shown that regions with abundant resources tend to have relatively weaker digital transformation efforts [21].
Digital technologies centered on artificial intelligence, big data, cloud computing, and 5G base stations are leading the way in making profound changes to the water resources management models of China, offering new ideas for reshaping the governance forms and patterns of water resources [22]. The application of digital technology has significantly enhanced the capability to acquire, process, and analyze water resources information, making it possible to refine the management of water resources [23]. What is more, digital technology facilitates information exchange and cooperation between water resources management organizations, enterprises, and the public, breaking down information silos and fostering a favorable multi-stakeholder governance landscape. In this process, the information and knowledge spillover effects of green technologies are fully unleashed [24]. However, despite the promising application prospects of digital technology in water resources management, issues such as its effectiveness, underlying mechanisms, and impact differences at various stages remain to be explored in depth. Therefore, an in-depth study of the relationship between digital technology and water resources management is of great significance for achieving sustainable and efficient comprehensive water resources management and helping humans cope with the water resources crisis.
In summary, academia has made substantial achievements in the research on digital technology and water resources management, but few studies have analyzed the interactive relationship between digital technology and water resources management. Therefore, based on the panel data of 30 provinces in China (excluding Tibet) from 2013 to 2022, we constructed an evaluation index system for digital technology and water resources management in China and employed the entropy weight–TOPSIS method to conduct measurements. Subsequently, we utilized the fixed-effects model, mediation effect model, and panel threshold model to uncover the influence effects between digital technology and water resources management. Finally, a coupling coordination degree model is applied to further analyze the coordination relationship between digital technology and water resources management. This paper aims to provide theoretical support and empirical evidence for digital technology to promote water resources management. Compared with existing research, the unique main contributions of this paper are as follows: (1) This paper empirically analyses the impact of digital technology on water resources management. (2) With green innovation as the mechanism variable, this paper analyzes the mechanism of green innovation in mediating the impact of digital technology on water resources management and further explores its threshold effect. (3) We carried out an analysis of the coupling coordination degree between digital technology and water resources management, which will help deepen the understanding of how digital technology empowers water resources management and provide valuable insights for the effective application of digital technology and the sustainable management of water resources.
Hypothesis 1.
Digital technology can significantly enhance water resources management.
Hypothesis 2.
Digital technology can enhance the level of water resources management by promoting green innovation.
Hypothesis 3.
Digital technology presents a green innovation threshold for the development of water resources management.
2. Materials and Methods
2.1. Model Formulation
2.1.1. Entropy Weight–TOPSIS
The entropy weight–TOPSIS method integrates the advantages of both the entropy weight method and the TOPSIS method. It uses the entropy weight method to calculate the weights of each indicator, effectively excluding the interference of subjective biases. Building upon this foundation, it draws upon the core concept of the TOPSIS method, in which evaluation benchmarks are constructed based on the optimal and worst solutions within the decision space. By calculating the relative distances between each evaluation alternative and these two extreme solutions, it quantifies the degree of closeness to the ideal solution, thereby facilitating precise ranking of the alternatives [25]. The corresponding calculation equations are as follows:
In the above equations, M(xjn) represents the maximum value in the sample, and m(xjn) represents the minimum value. En represents the entropy value of each indicator, and Wn represents the weight of each index. D represents the Euclidean distance. P represents the comprehensive index.
2.1.2. Benchmark Regression Model
To explore the direct impact of digital technology on water resources management, by referring to the practices of Wang et al. [26], the following benchmark regression model was constructed.
In Equation (11), represents the province, and represents the time period. WRM stands for the dependent variable, water resources management, while DT represents the core explanatory variable, digital technology. , , and represent the estimated coefficients. is used to control for individual fixed effects, and is used to control for time fixed effects. represents the random disturbance term.
2.1.3. Mediation Effect Model
According to Hypothesis 2, digital technology may have an impact on water resources management through green innovation. By referring to the work by Irfan et al. [27] and Sun et al. [28], the benchmark regression model was constructed.
In Equations (12) and (13), GI represents green innovation, and the meanings of the other variables and parameters are consistent with those noted previously in the text.
2.1.4. Threshold Effect Model
To further examine the relationship between digital technology, green innovation, and water resources management, by referring to the practice of Cheikh and Rault [29], the single-threshold model and the double-threshold model were constructed.
In Equations (14) and (15), thrit represents the threshold variable; I(·) is an indicator function that takes a value of 1 when the threshold condition inside the parentheses is met and 0 otherwise; θ represents the threshold value for the single-threshold model; θ1 represents the first threshold value for the double-threshold model; and θ2 represents the second threshold value for the double-threshold model.
2.1.5. Coupling Coordination Degree Model
The coupling coordination degree model includes the degree of coupling and the degree of coordination, which can be used to measure the degree of interaction between two or more systems. By referring to the practices of Tomal [30], the coupling coordination degree model was constructed.
In Equations (16)–(18), U1 and U2 represent the digital technology and water resources management levels, respectively; C represents the coupling degree; T represents the comprehensive coordination index of digital technology and water resources management; and α = β = 0.5, indicating digital technology and water resources management are of the same importance. D represents the evaluation result for the coupling coordination degree.
2.2. Variable Indicators and Data Source
2.2.1. Description of Indicators
The dependent variable was water resources management (WRM). Water resources management is a process aimed at balancing water use as a basis for ensuring the livelihoods of a growing population while protecting and preserving water resources to ensure the sustainability of a water supply [31]. Based on the research conducted by Bozorg-Haddad et al. [32] and Maurya et al. [33], an evaluation index system for water resources management was constructed (see Table 1). Based on Equations (1)–(10), the level of water resources management in China during the sample period was calculated.

Table 1.
Comprehensive index system for WRM [34].
The independent variable was digital technology (DT). Based on the availability of data and drawing on the research by Liu et al. [35], an evaluation index system for digital technology was constructed (see Table 2). Based on Equations (1)–(10), the level of digital technology development in China during the sample period was calculated.

Table 2.
Comprehensive index system for DT [36,37].
To make the empirical results more scientifically reliable, we selected the following control variables: urbanization level (City), measured by the proportion of urban population to the total population; economic level (Eco), measured by the logarithm of the Gross Regional Product (GRP) per capita; population density (Pop), expressed as the ratio of the population of each province to the total area; infrastructure (Inf), expressed as the per capita urban road area and the number of urban roads per capita; population density (Pop), expressed as the ratio of the population of each province to the area of each province; and infrastructure (Inf), expressed as the area of urban roads per capita.
The mediator variable was green innovation (GI). Green innovation adheres to the principles of reducing energy consumption and promoting environmental protection, serving as an indicator of the degree of greenness in regional innovation capabilities. Technological innovations that meet the criteria of “green environmental protection and scientific quality” are recognized as green patents, which enable the output of green innovation to be visually quantified. Referring to the study by Chen et al. [38], in this paper, we select the logarithm of green patent grants to represent GI.
2.2.2. Data Source
The data used in this paper is obtained from China Statistical Yearbook [39], China Environmental Statistics Yearbook, China Science and Technology Statistics Yearbook, the China Research Data Services Platform (CNRDS), as well as provincial statistical yearbooks and bulletins. Missing values were filled in through interpolation methods.
3. Results
3.1. Data Description
Descriptive statistics of the variables are presented in Table 3.

Table 3.
Descriptive statistics [40].
Table 3 shows that the mean value of digital technology (DT) is 0.185, the maximum value is 0.589, and the minimum value is 0.038, indicating that there is a significant difference between the development levels of digital technology in China. The minimum value of water resources management (WRM) is 0.316, and the maximum value is 0.825, with a difference of 0.509 between the minimum and maximum values, reflecting a huge disparity in the levels of water resources management among different provinces; the minimum value of green innovation (GI) is 3.434, and the maximum value is 10.722, also indicating an uneven development of green innovation among regions. The three important variables all have relatively large variation ranges, reflecting the developmental disparities among different regions in China.
3.2. Scatter Plots
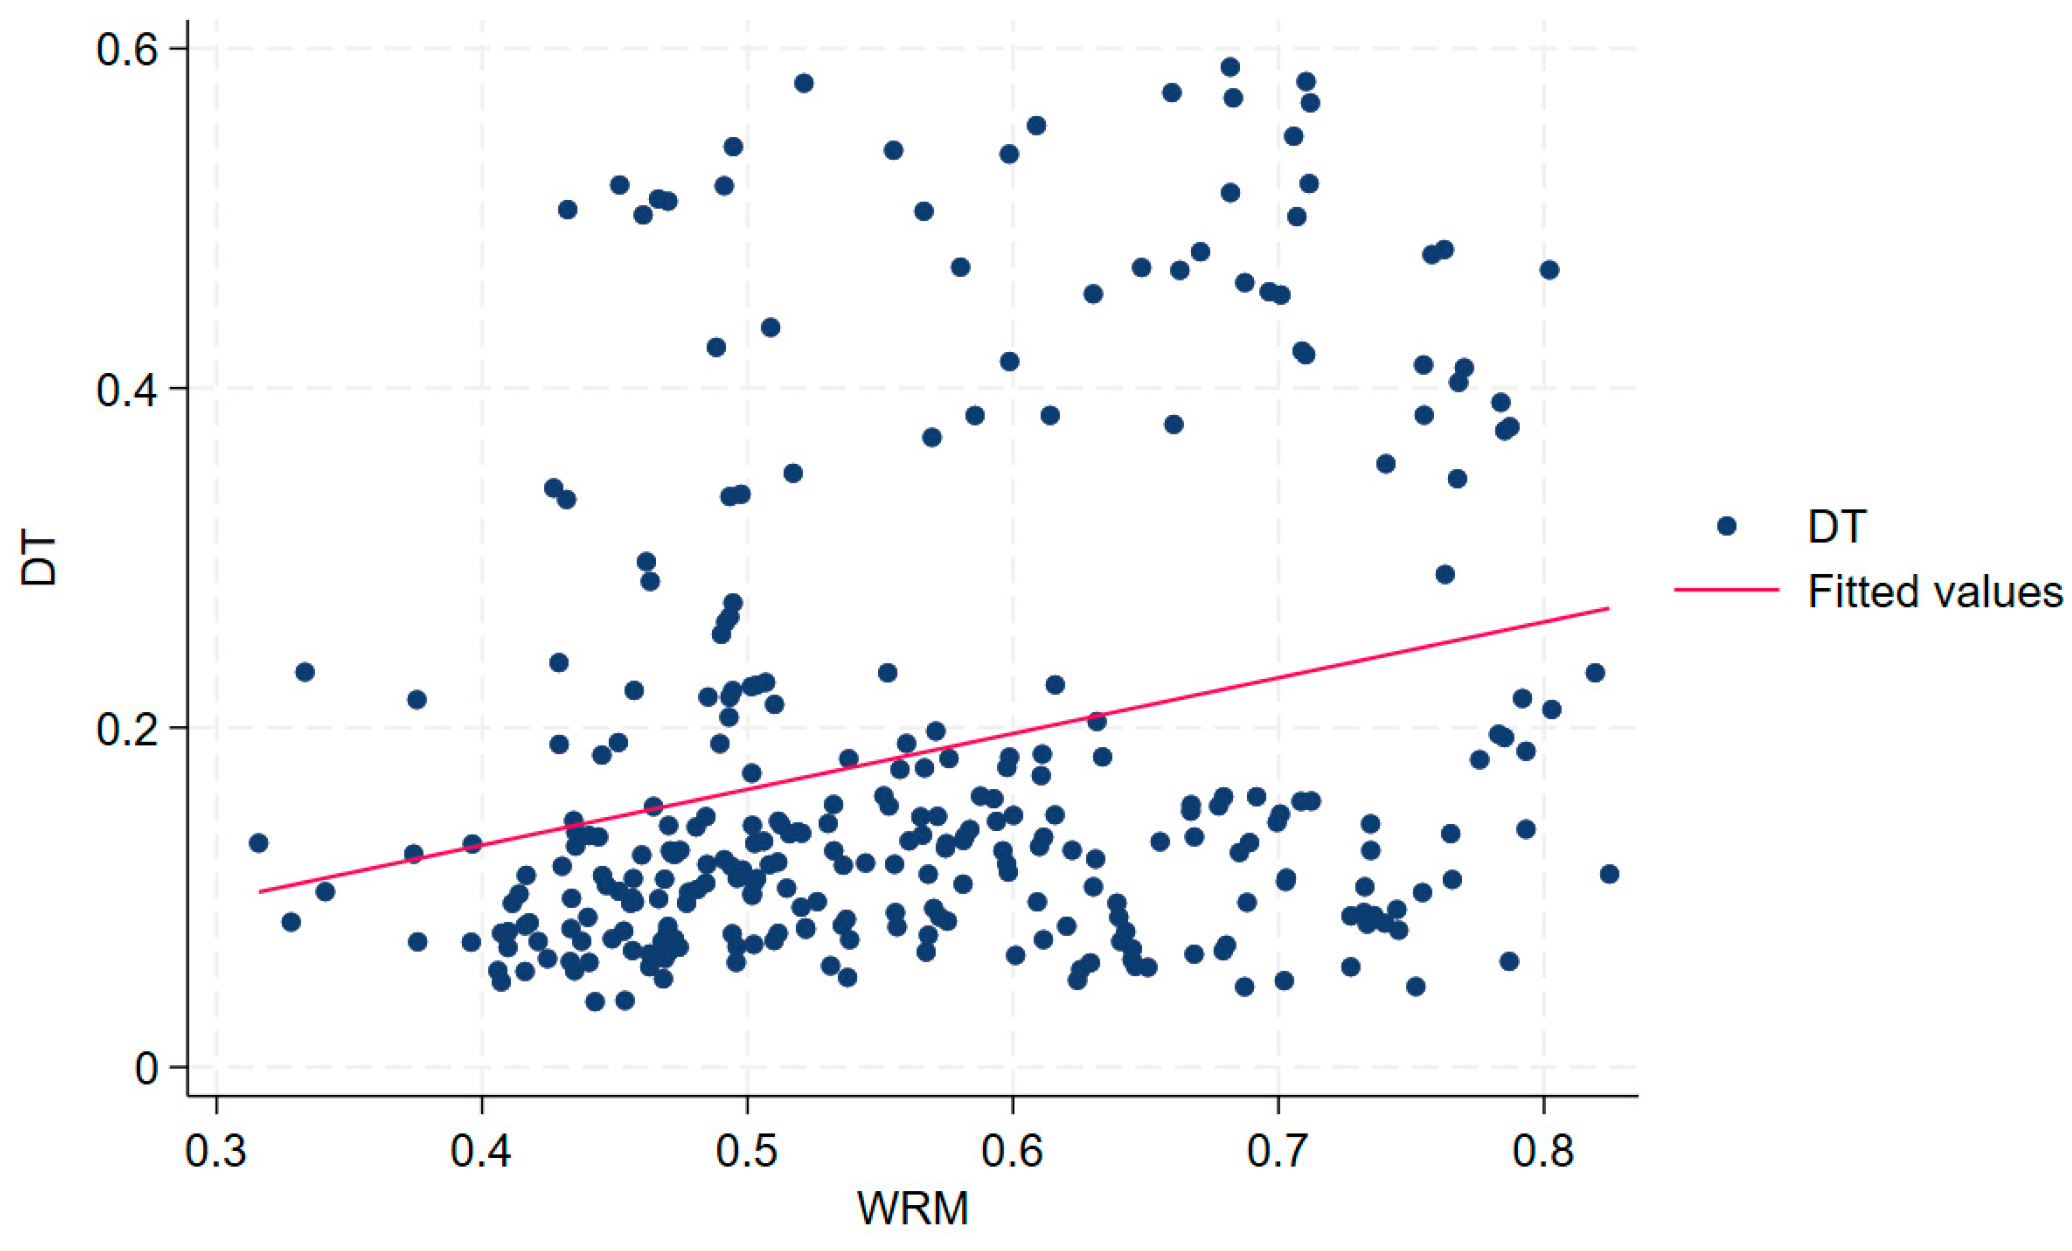
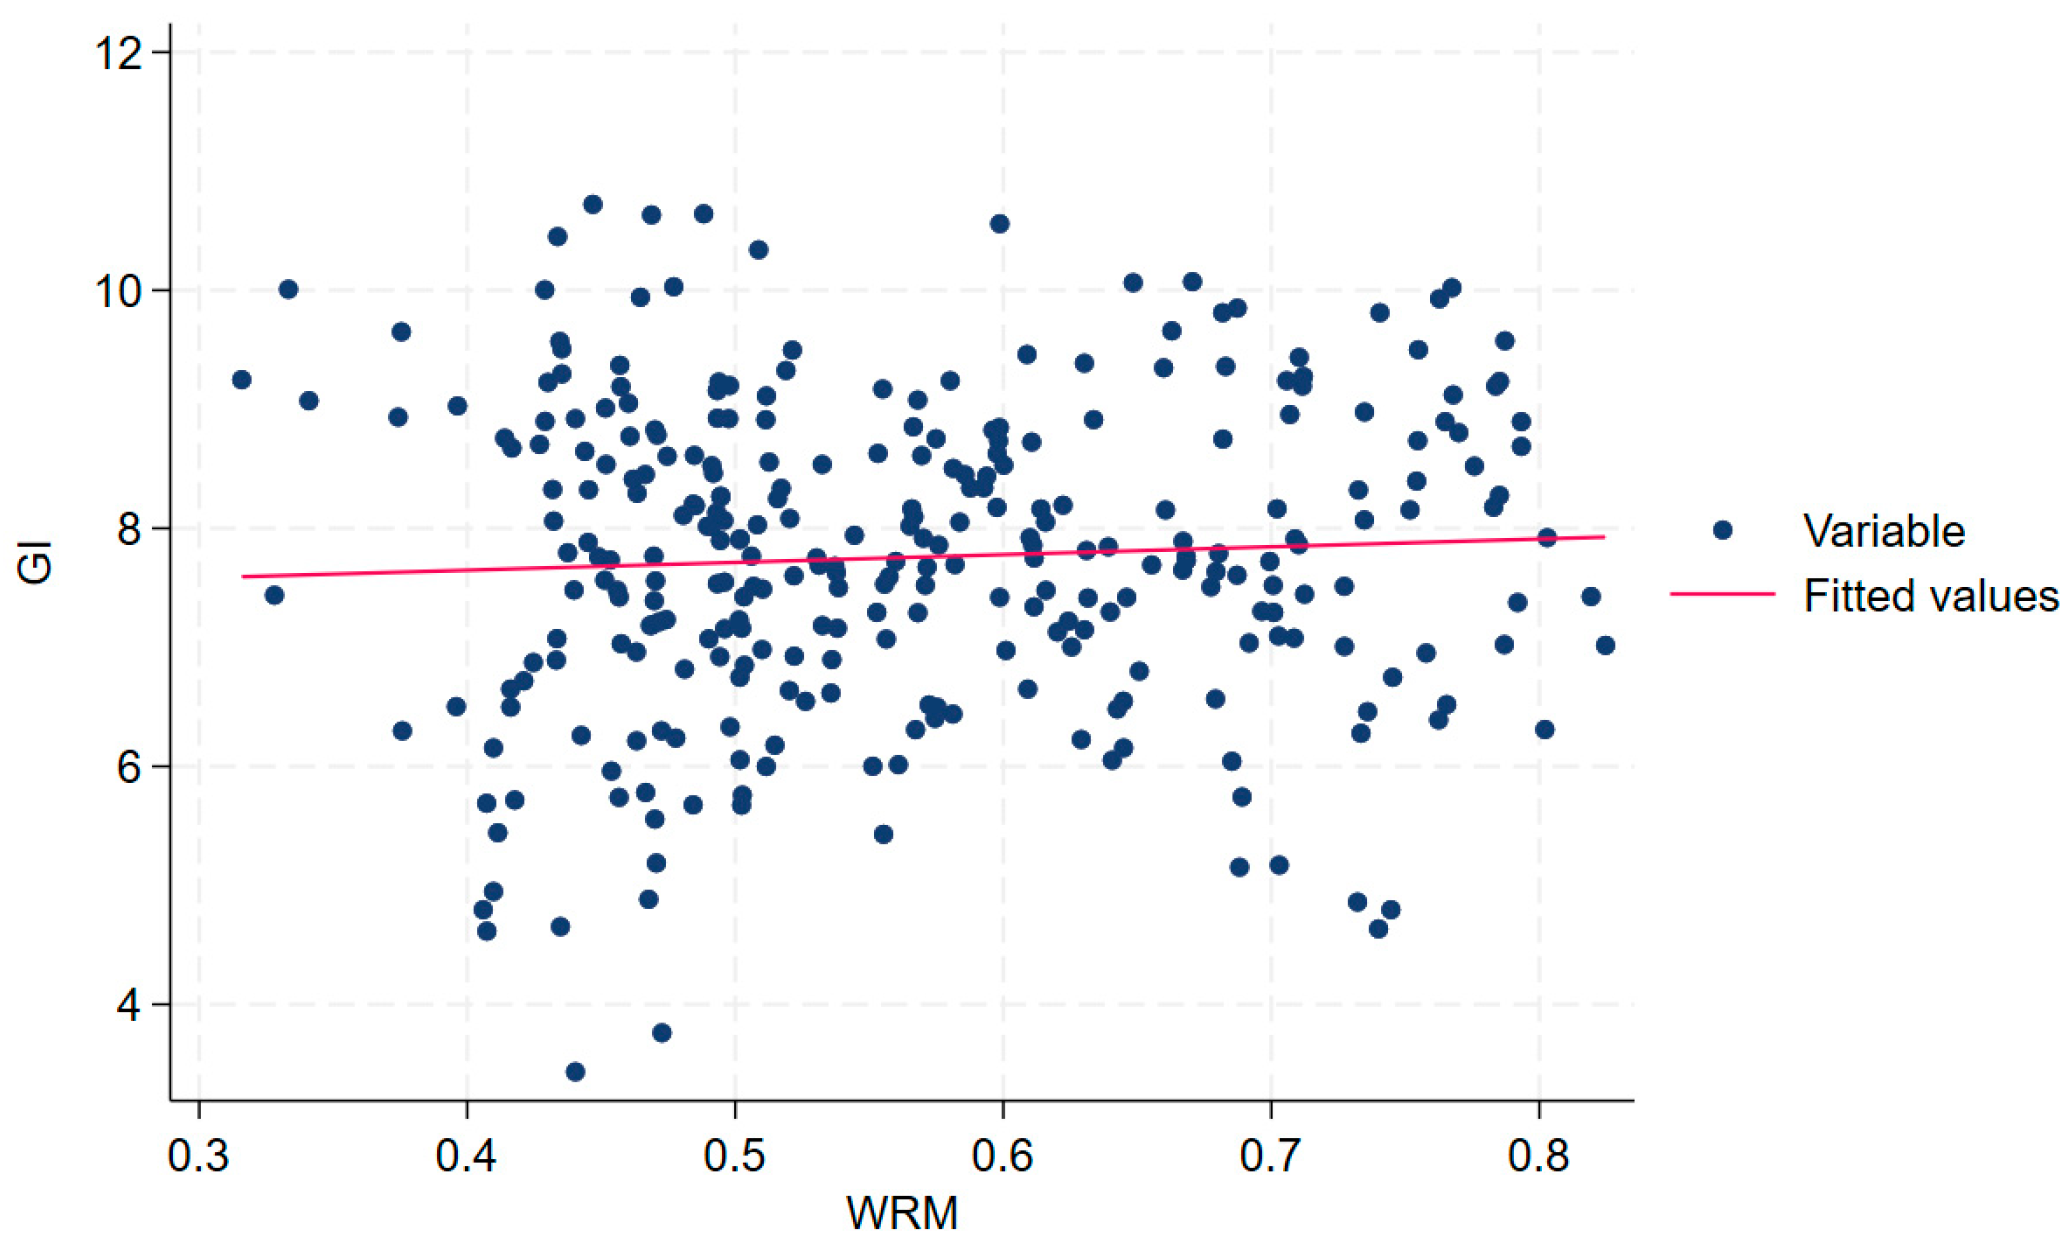
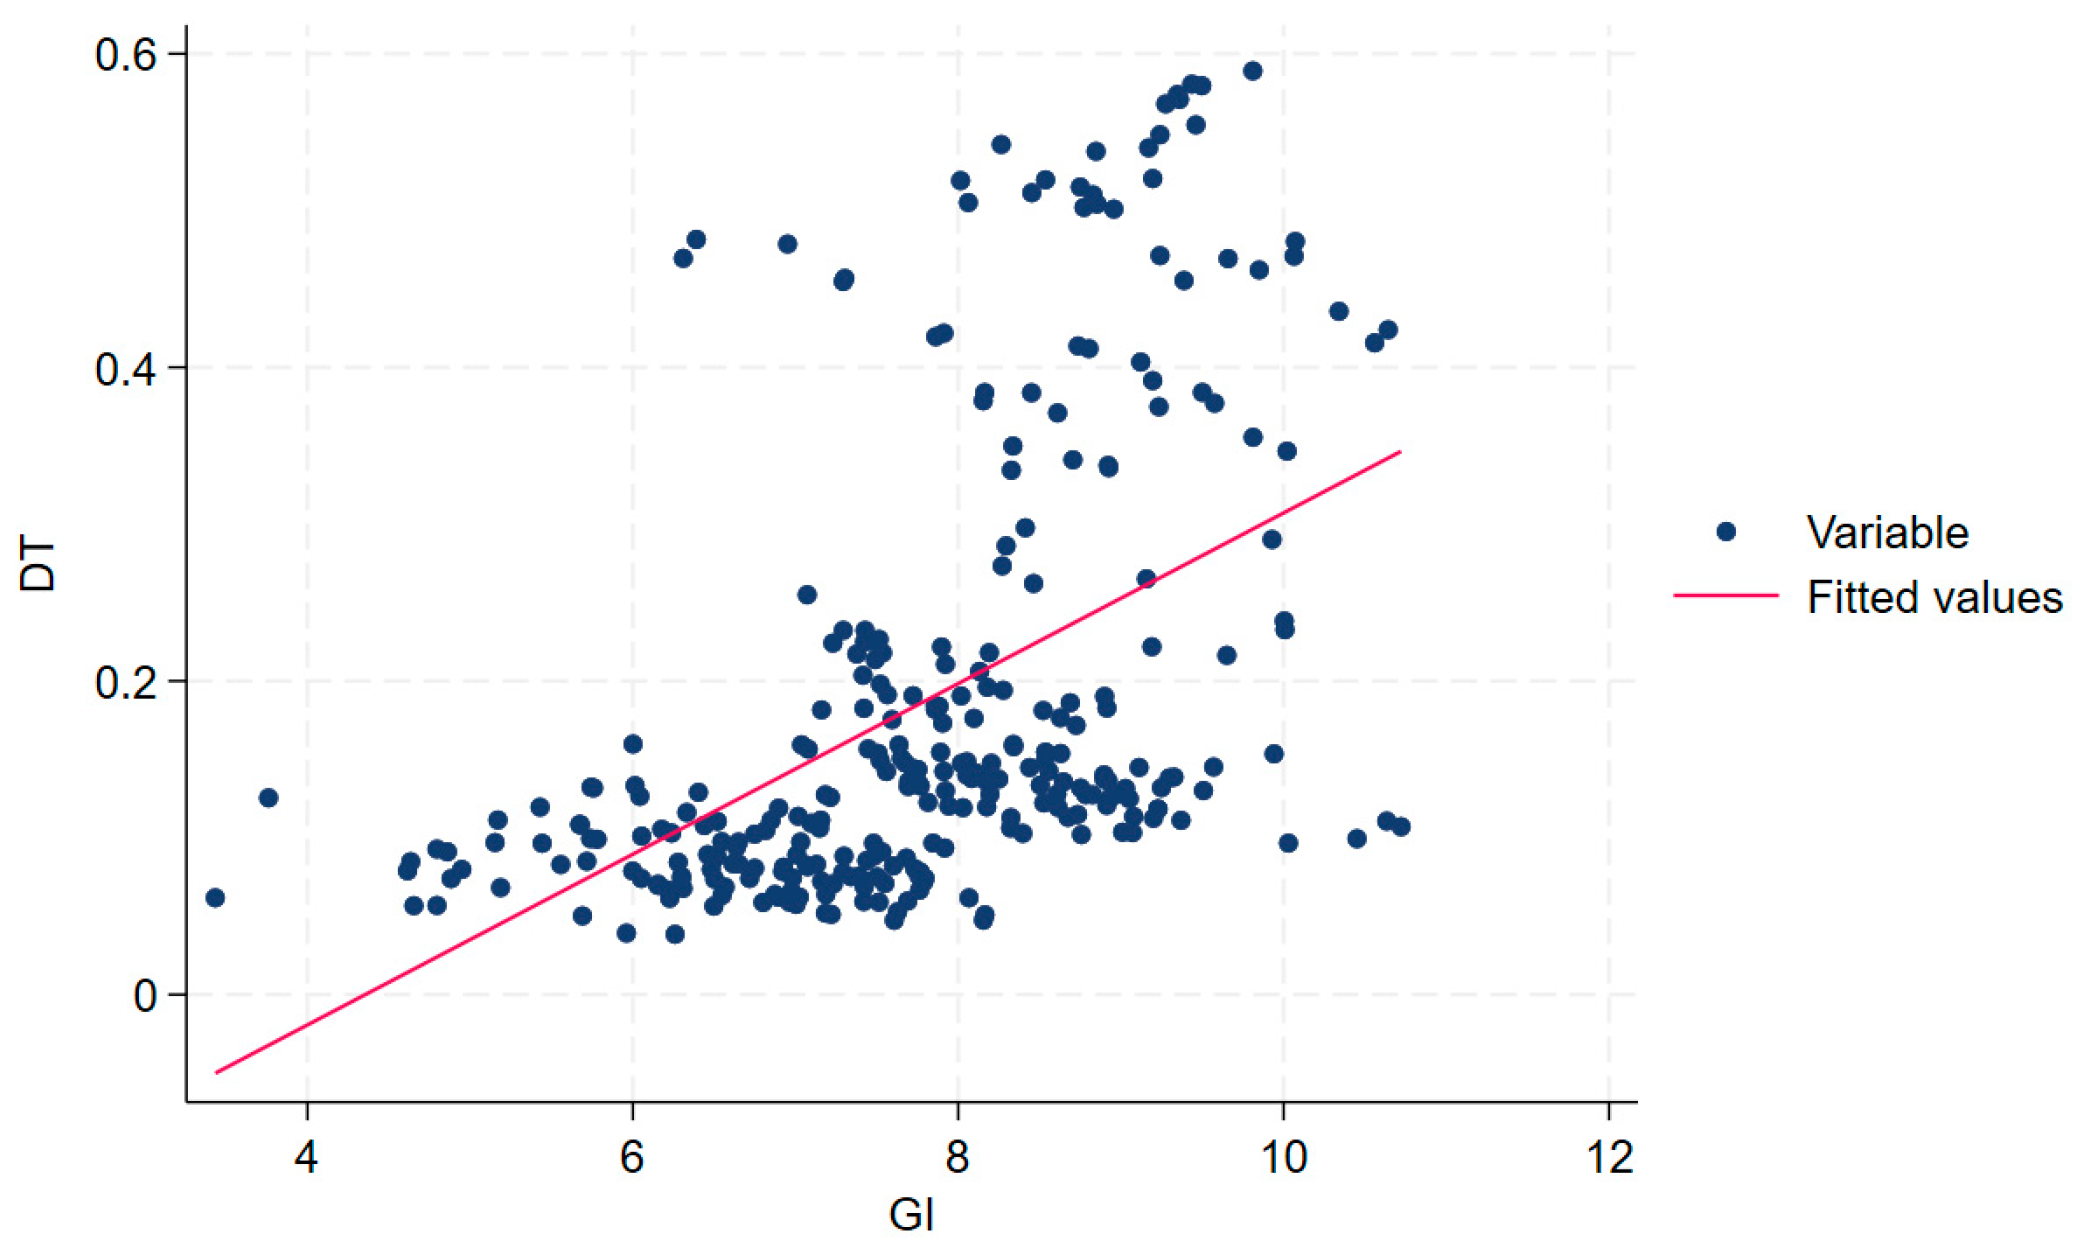
In order to visualize the correlation trends between digital technology, green innovation, and water resources management, scatter plots and fitting curves were developed, as shown in Figure 1, Figure 2 and Figure 3.
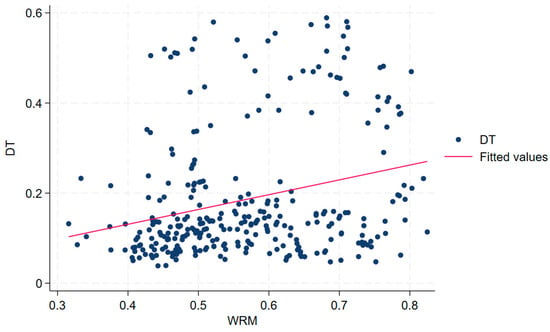
Figure 1.
Digital technology and water resources management.
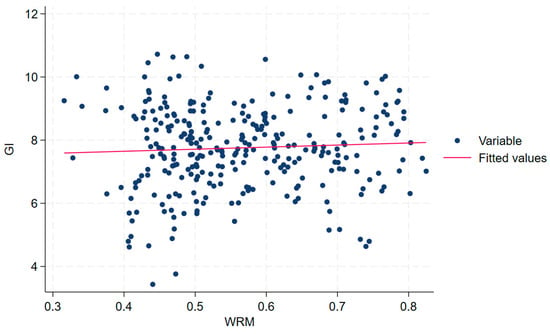
Figure 2.
Green innovation and water resources management.
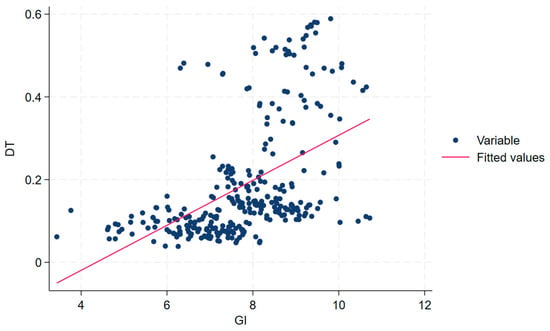
Figure 3.
Digital technology and green innovation.
From Figure 1, Figure 2 and Figure 3, it can be observed that any two variables in digital technology, water resources management, and green innovation have positive correlations with each other, thus initially confirming the theoretical logic of the hypotheses presented earlier. However, further empirical tests of the quantitative relationships between relevant variables are needed through econometric models.
3.3. Benchmark Estimation Analysis
We conducted a regression analysis on the impact of digital technology on water resources management, with the specific results shown in Table 4.

Table 4.
Results of the benchmark regression.
According to Table 4, column (1) shows the situation without introducing control variables and without controlling for individual and time effects. The estimated coefficient of digital technology is 0.287 and remained significant at the 1% level, indicating that digital technology can significantly promote water resources management, and the estimated coefficient remained significantly positive after controlling for individual and time effects. As shown in column (3), after introducing further control variables such as economic level, environmental regulation, government support, financial level, and human capital, the estimated coefficient of digital technology is 0.252 and significant at the 1% level. Column (4), based on column (3), further controls for individual and time effects. The estimation result shows that the coefficient of digital technology for water resources management is remarkably positive at the 1% level, demonstrating that digital technology has a direct and pronounced positive effect on improving water resources management. The possible reason is that the application of digital technology enhances the effectiveness of the real-time monitoring and intelligent analysis of water resources, effectively eases the contradiction between the supply and demand of water resources, enhances the scientific and efficient allocation of water resources, and has a direct and significant positive impact on the improvement of water resources management; thus, hypothesis 1 is verified.
Nowadays, the development of digital technology is vigorously advocated; thus, this conclusion is consistent with existing research findings. Digital technology has significant advantages in improving water resource allocation efficiency and precision management [41]. From the perspective of digital application effects, Cassidy et al. found that digitization can effectively reduce unprofitable water use through the implementation of optimized algorithms and early-warning systems, elevating water use efficiency to a new level [42]. In summary, digital technology can play a facilitating role in water resources management.
3.4. Endogeneity Test and Robustness Test
An instrumental variable method was employed. In the benchmark regression analysis of how digital technology empowers water resources management mentioned above, there may be bidirectional causality between digital technology and water resources management, leading to endogeneity issues. Referring to the approach employed by Yuan and Pan [43], in this paper, we selected the lagging one-period core explanatory variable of digital technology as an instrumental variable to re-validate the original model. The estimation was conducted using the two-stage least squares method (IV-2SLS), and the results are presented in column (1) of Table 5.

Table 5.
Results of the endogeneity test and robustness test.
The four municipalities directly under the control of the central government were excluded. Considering the unique economic scale, administrative level, and population sizes of municipalities directly under the control of the central government, we re-examined the data after excluding Beijing, Tianjin, Shanghai, and Chongqing, the four municipalities that may cause interference. The results are presented in column (2) of Table 5.
A control variable was added. There are many factors that affect digital technology and water resources management, and omitted variables may lead to endogeneity issues. There are significant differences in the demand for and utilization of water resources among different industries, and the degree of acceptance and application depth of digital technology also vary among industries. Therefore, industrial structure was selected as a supplementary control variable and added to the model; it is measured according to the ratio of the added value of the secondary industry to that of the tertiary industry. Financial level is one of the important indicators for measuring the stage of economic development and resource allocation capability of a region or country. The abundance of financial resources directly affects the investment scale, technological innovation capabilities, and policy implementation effects of water resources management. Therefore, the financial level, represented by the ratio of the added value of the financial industry to the GDP, was used as a supplementary control variable.
Bilateral trimming at the 1% level was carried out. To prevent potential extreme values from affecting the estimation results, we performed bilateral trimming of the data at the 1% level and re-analyzed the processed data. The re-estimated results are presented in column (4) of Table 5.
From Table 5, it can be concluded that the p-values corresponding to the Kleibergen–Paap rk LM statistic are all 0.000, and the Kleibergen–Paap rk Wald F statistic is greater than the critical value at the 10% level of the Stock–Yogo weak identification test, indicating that the selected instrumental variable is reasonable. In column (1), the coefficient estimate for digital technology is 0.636, which is significant at the 1% statistical significance level, confirming the robustness and reliability of the benchmark regression results. Additionally, after removing samples from municipalities directly under the control of the central government, adding control variables, and conducting bilateral trimming at the 1% level, the coefficients of the impact of digital technology on water resources management remain significantly positive, indicating that digital technology still has a positive effect on water resources management, fully demonstrating the robustness of the conclusion of Hypothesis 1.
3.5. Mechanism Effect Test
To reveal the transmission mechanism of digital technology with respect to water resources management, green innovation was introduced into Equations (12) and (13) for testing. The results are presented in Table 6.

Table 6.
Results of the mediation effect test.
In Table 6, column (1) shows that digital technology has a significant positive impact on green innovation. Column (2) presents the regression results with green innovation as the mediating variable. The estimated coefficient of green innovation is 0.244, passing the 1% significance test, indicating that green innovation can significantly promote the development of water resources management. At this point, the estimated coefficient of digital technology remains significantly positive, suggesting that digital technology can indirectly affect water resources management through green innovation. Furthermore, the p-value of the Sobel test is less than 0.05, and the 95% confidence interval of the Bootstrap test does not include 0, both of which further verify the existence of the green innovation transmission mechanism. Therefore, the results indicate that digital technology promotes the development of water resources management through green innovation, and hypothesis 2 is validated.
3.6. Heterogeneity Analysis
In fact, due to differences in resource endowment and stages of development, there is significant heterogeneity in the regional distribution of water resources management levels. Therefore, we used the average level of water resources management as a benchmark to divide the 30 provinces into regions with higher and lower levels of water resources management. The specific regression results are presented in Table 7.

Table 7.
Results of the heterogeneity analysis of water resources management levels.
Table 7 reveals that digital technology has a positive impact on regions with higher and lower levels of water resources management. It is noteworthy that the positive impact of digital technology on water resources management is greater in the regions with higher levels of water resources management. This may be due to the fact that these provinces are concentrated in the southeast and southwest regions, where water resources are more abundant than the central and northern regions. Additionally, these regions have maturer and more comprehensive water resources management systems. Furthermore, digital technology has developed rapidly, providing strong support for the digital transformation of water resources management. Consequently, the dividends of digital technology are more fully realized in these regions.
3.7. Threshold Effect Test
Considering the possible nonlinear relationship between digital technology and water resources management, we constructed a dynamic panel model with green innovation as the threshold variable. The “bootstrap” method was adopted [44]; as shown in Table 8, after conducting repeated sampling 500 times, the results indicate that the green innovation threshold variable significantly passed the single-threshold test but failed to pass the double-threshold and triple-threshold tests. Based on this, regression models with corresponding threshold numbers were established, yielding the regression results in Table 9.

Table 8.
Results of the threshold effect test.

Table 9.
Results of the threshold regression.
In Table 8 and Table 9, it can be observed from the change in the coefficient of digital technology that when the green innovation degree is lower than the threshold value of 1.840, the impact of digital technology on water resources management is not significant. However, when digital technology exceeds the 1.840 threshold, digital technology will positively contribute to the development of water resources management. It can be inferred that green innovation has a threshold effect on the influence of digital technology on water resources management, implying that as the level of green innovation continues to rise, the promotional effect of digital technology on water resources management will gradually intensify. Thus, Hypothesis 3 is validated.
3.8. Further Analysis
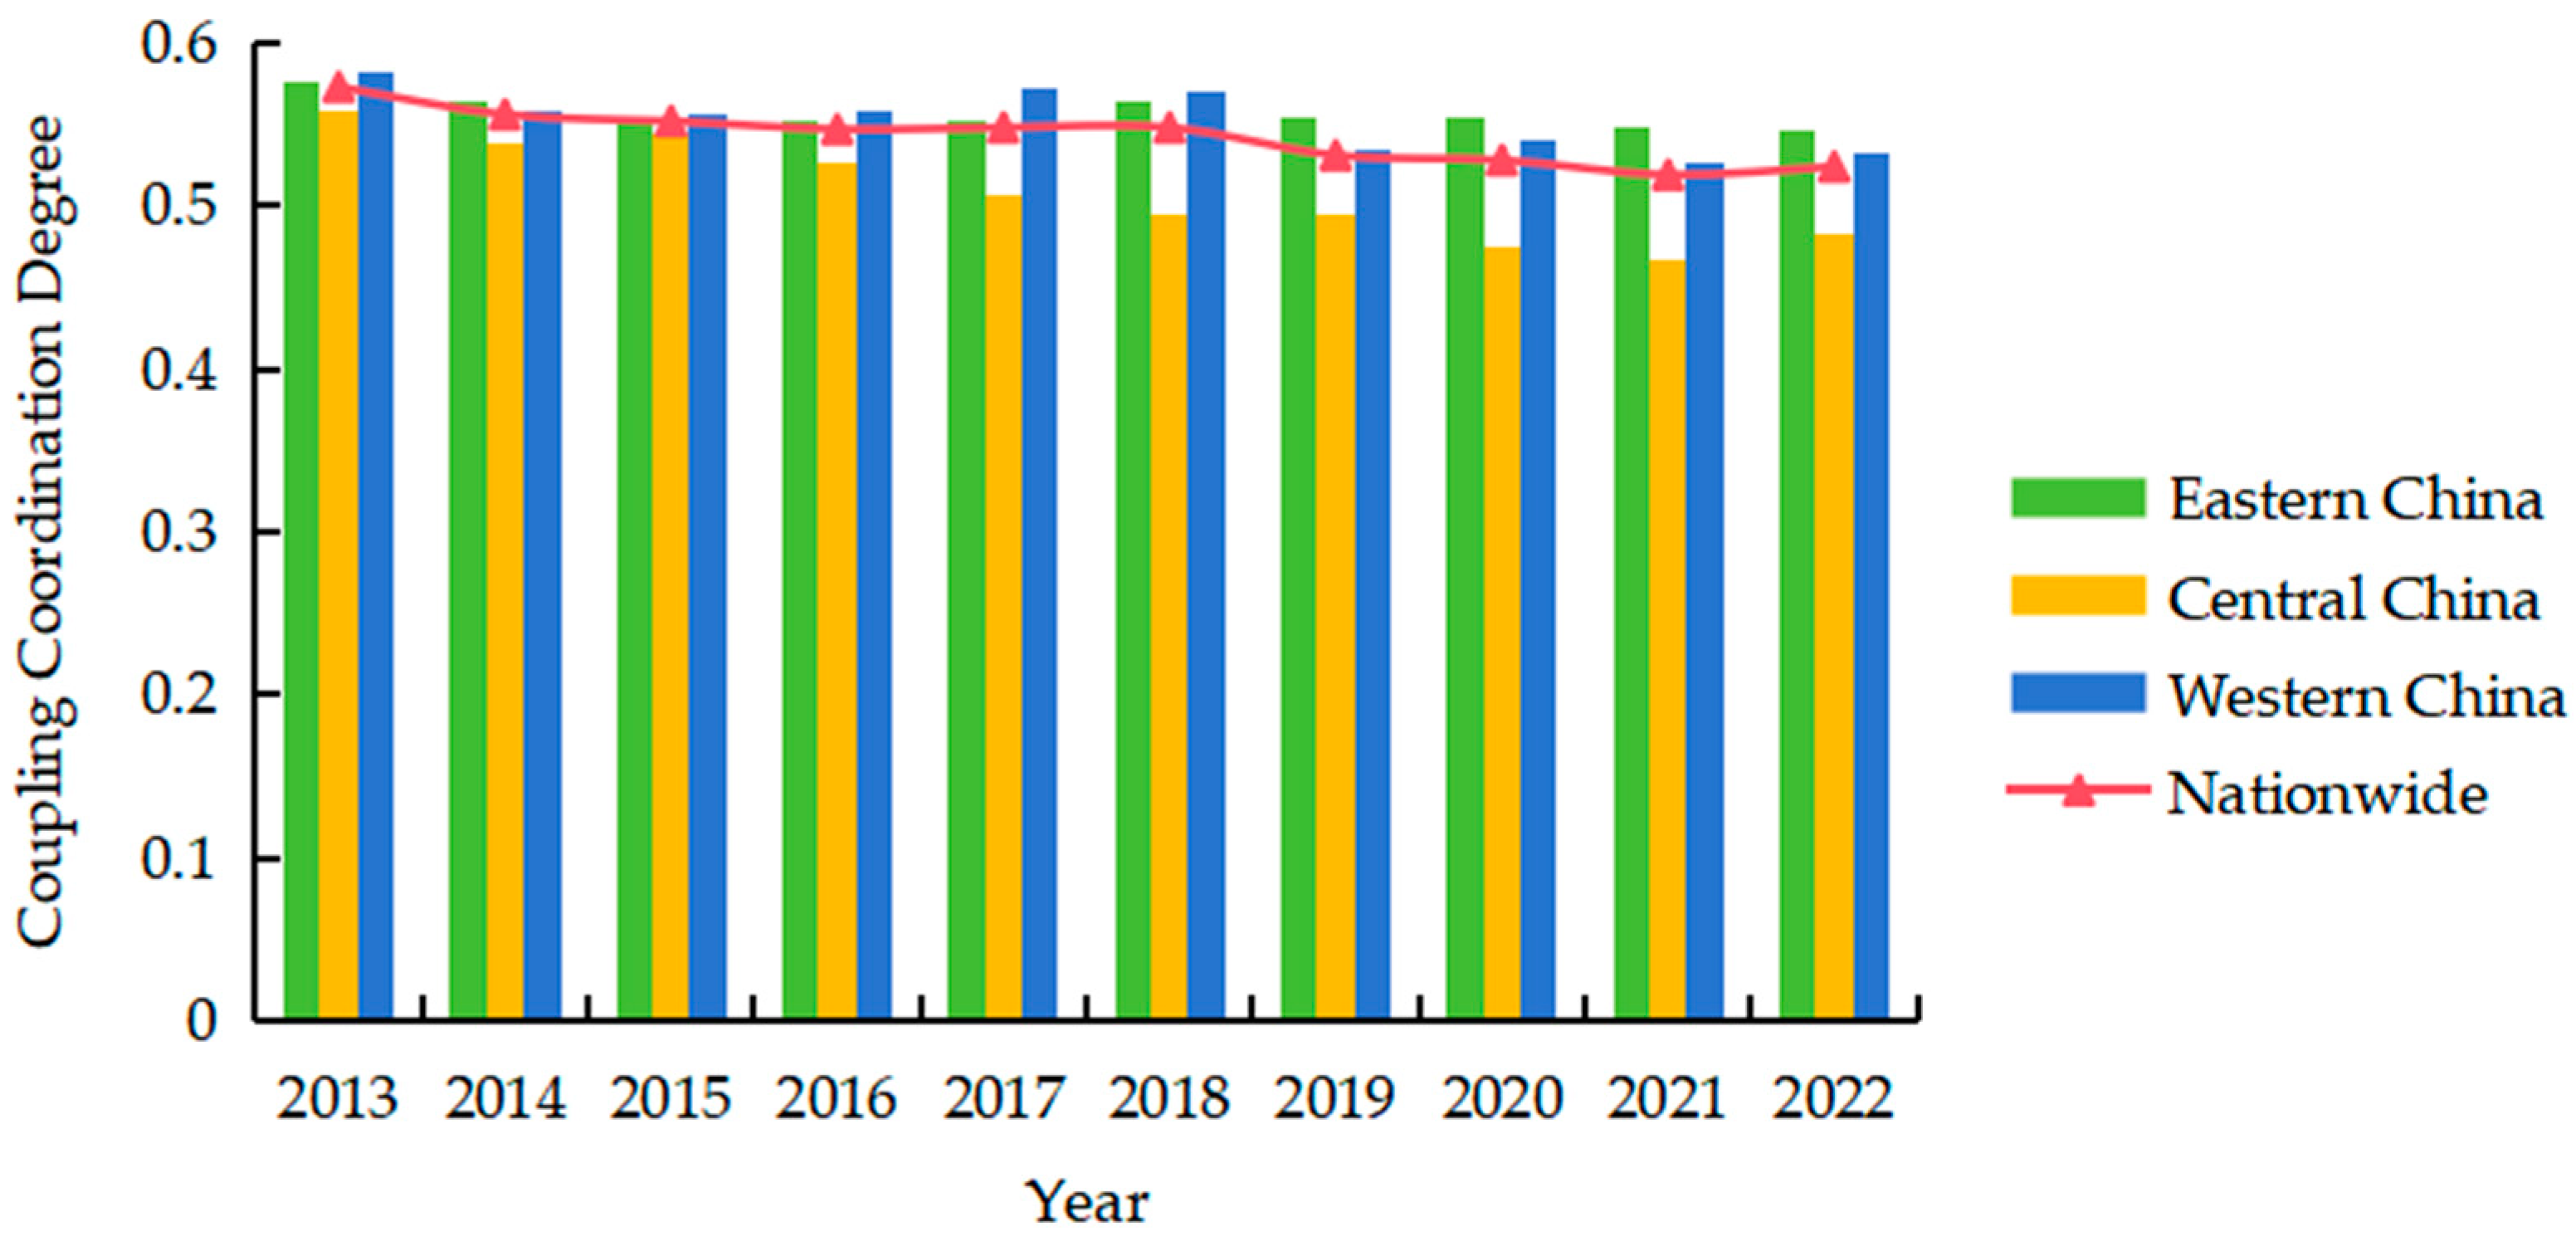
The test results in the above section indicate that there is a close relationship between digital technology and water resources management. Further exploring the coupling and coordination relationship between the two can accurately reveal the deep-seated issues of water resources management and promote digital technology to empower water resources management. Drawing on the equal interval division method proposed by Zhao et al. [45], the coupling coordination degree of digital technology and water resources management was divided into 10 types, as shown in Table 10. Based on Equations (16)–(18), the coupling coordination degree of digital technology and water resources management in China from 2013 to 2020 was calculated. In addition, referring to the method of regional division proposed by Wang and Wang [46], China was divided into Eastern China, Central China, and Western China, as presented in the results in Table 11. Furthermore, the trend of changes in the average coupling coordination degree of digital technology and water resources management in Eastern China, Central China, Western China, and nationwide is illustrated in Figure 4.

Table 10.
Types of coupling coordination degrees.

Table 11.
Coupling coordination degrees of digital technology and water resources management in China from 2013 to 2022.
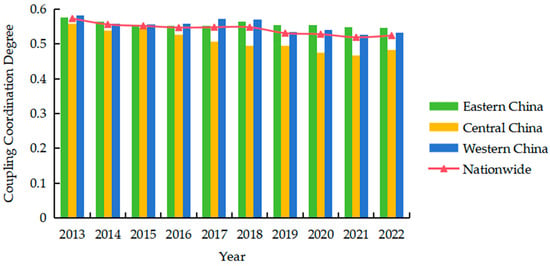
Figure 4.
The average coupling coordination degrees of digital technology and water resources management in the three major regions and nationwide from 2013 to 2022.
Table 11 indicates that, nationally, the mean value of the coupling coordination degree of digital technology and water resources management was between 0.5 and 0.6, which corresponds to a state of barely adequate coordination. Furthermore, the coupling coordination degree exhibited a decreasing trend, with the mean value decreasing from 0.573 in 2013 to 0.524 in 2022, which indicates that although digital technology plays a certain role in water resources management, the overall coordination degree is not high and is still in the initial stages of coordination.
At the region level, it can be seen from Figure 4 that there are significant differences in the coupling coordination degree of digital technology and water resources management in various regions. Regarding regional disparities, for example, in 2022, the national average of the coupling coordination degree of digital technology and water resources management was 0.524, with an average of 0.546 in Eastern China, 0.483 in Central China, and 0.533 in Western China. The coupling coordination degree of digital technology and water resources management in Eastern China and Western China was higher than the national average, while in Central China, it was significantly lower than the national average. This may have been caused by the imbalance in the level of economic development, scientific and technological innovation capacity, and water resources endowment between regions.
At the provincial level, disparities are also evident. In Eastern China, Beijing boasted the highest overall coupling coordination degree of digital technology and water resources management, while the coupling coordination degree of Fujian was 0.3–0.4 in most years, corresponding to a state of mild imbalance. In Western China, the coupling coordination degree of digital technology and water resources management in Gansu and Yunnan was greater than 0.7 in most years, generally reaching a state of intermediate coordination, and the degree of integration of the provinces was more desirable. In contrast, the provinces of Central China with lower coupling coordination degrees, such as Jilin and Heilongjiang, were on the verge of imbalance, lagging behind other provinces in the central region. Therefore, there is also a significant imbalance between provinces in different regions.
4. Discussion
Traditional methods of water resources management often rely on human experience and static data analysis. So, water resources management is difficult to adapt to the rapidly changing market demand and complex external environment. The widespread application of digital technology has not only continuously transformed social production and lifestyles but also injected new impetus into enhancing the level of water resources management [47,48]. Against this backdrop, this paper proposes three hypotheses. Evaluation index systems of digital technology and water resources management were constructed based on panel data from 30 provinces in China spanning from 2013 to 2022. This paper systematically reveals the direct impact of digital technology on water resources management, providing robust empirical support for the widespread application of digital technology in the field of water resources management. Importantly, this paper introduces green innovation as a mediator and a threshold variable to further explore the influence of digital technology on water resources management. Additionally, this paper further analyzes the coupling coordination degree between digital technology and water resources management. We believe that during the process of digital transformation, not only economic effects but also ecological effects should be investigated. Therefore, in the process of water resources management, firstly, it is necessary to promote the application and upgrading of digital technology to build a smart water resources management system. Relevant departments should strengthen the penetration of digital twin and other technologies in the whole chain of water resources management, which will widen the scope of water resources management decisions from mainly focusing on the identification of water status to the integrated simulation and control of water quantity, water quality, and ecology. Secondly, a deep integration of green innovation, digital technology, and water resources management should be fostered to create a collaboratively evolving innovation ecosystem. By establishing interdisciplinary research platforms, we can jointly explore the potential applications of digital technology and green innovation in the dynamic assessment of water supply and demand, water pollution prevention, and ecological restoration, with the collaboration of multiple parties. Finally, different strategies should be used for the application of digital technology. When formulating strategies for the promotion of digital technologies, it is crucial to fully consider regional differences and tailor policies and measures to local conditions. Additionally, strengthening regional cooperation is also an effective way to enhance the level of water resources management nationwide. The task of promoting the digital transformation of water resources management is arduous and requires our long-term and unremitting efforts.
5. Conclusions
Our research findings are as follows: Firstly, in terms of the direct impact, digital technology has a significant promotional effect on water resources management, with an estimated coefficient of 0.221 and a significance level of 1%. The endogeneity and robustness tests also confirmed the reliability of this result. Secondly, from the perspective of transmission mechanisms, digital technology can improve water resources management by enhancing green innovation. Thirdly, in terms of heterogeneity analysis, the enabling role of digital technology in water resources management exhibits notable regional heterogeneity. The estimated coefficient was 0.125 in regions with lower levels of water resources management, while it was 0.270 in regions with higher levels, indicating a stronger positive effect of digital technology on water resources management in these regions. Fourthly, based on the threshold effect analysis, the impact of digital technology on water resources management is influenced by the level of green innovation. When the level of green innovation reaches 1.840, digital technology will facilitate water resources management. Fifthly, from the perspective of the coupling coordination degree of digital technology and water resources management, the overall performance is not ideal. China was generally in the stage of barely adequate coordination from 2013 to 2022. Additionally, there are significant differences in the coupling coordination degrees between regions, mainly showing a trend of Eastern China > Western China > Central China, indicating that there is still considerable room for development.
Although this study has achieved some results in terms of the impact of digital technology on water resources management, there are still limitations. Future research can incorporate policy environment and institutional factors into the analytical framework. What is more, it would be more ideal if future research could expand its scope to the prefecture-level-city level or industrial level.
Author Contributions
Conceptualization, X.Z.; formal analysis, Y.Z.; investigation, D.Y.; methodology, X.Z.; project administration, Y.Z.; supervision, X.Z.; validation, D.Y.; visualization, D.Y.; writing—original draft, X.Z. and D.Y.; writing—review and editing, Y.Z. All authors have read and agreed to the published version of the manuscript.
Funding
This research was funded by the project “Optimization and Practice of Management Methodology Curriculum System under the Background of New Liberal Arts” (2023jyxm0096).
Data Availability Statement
The data presented in this study are available on request from the corresponding author.
Conflicts of Interest
The authors declare no conflicts of interest.
References
- Ahmed, A.A.; Sayed, S.; Abdoulhalik, A.; Moutari, S.; Oyedele, L. Applications of machine learning to water resources management: A review of present status and future opportunities. J. Clean. Prod. 2024, 441, 140715. [Google Scholar] [CrossRef]
- Shams, A.K.; Muhammad, N.S. Toward sustainable water resources management: Critical assessment on the implementation of integrated water resources management and water–energy-food nexus in Afghanistan. Water Policy 2022, 24, 1–18. [Google Scholar] [CrossRef]
- Dinar, A. Challenges to water resource management: The role of economic and modeling approaches. Water 2024, 16, 610. [Google Scholar] [CrossRef]
- Lv, B.; Liu, C.; Li, T.; Meng, F.; Fu, Q.; Ji, Y.; Hou, R. Evaluation of the water resource carrying capacity in Heilongjiang, eastern China, based on the improved TOPSIS model. Ecol. Indic. 2023, 150, 110208. [Google Scholar] [CrossRef]
- Grison, C.; Koop, S.; Eisenreich, S.; Hofman, J.; Chang, I.; Wu, J.; Savic, D.; Leeuwen, K. Integrated water resources management in cities in the world: Global challenges. Water Resour. Manag. 2023, 37, 2787–2803. [Google Scholar] [CrossRef]
- Bian, D.; Yang, X.; Lu, Y.; Chen, H.; Sun, B.; Wu, F.; Chen, Y.; Xiang, W. Analysis of the spatiotemporal patterns and decoupling effects of China’s water resource spatial equilibrium. Environ. Res. 2023, 216, 114719. [Google Scholar] [CrossRef]
- Kamyab, H.; Khademi, T.; Chelliapan, S.; SaberiKamarposhti, M.; Rezania, S.; Yusuf, M.; Farajnezhad, M.; Abbas, M.; Jeon, B.; Ahn, Y. The latest innovative avenues for the utilization of artificial Intelligence and big data analytics in water resource management. Results Eng. 2023, 20, 101566. [Google Scholar] [CrossRef]
- Abegeja, D. The application of satellite sensors, current state of utilization, and sources of remote sensing dataset in hydrology for water resource management. J. Water Health 2024, 22, 1162–1179. [Google Scholar] [CrossRef]
- Zhang, C.; Oki, T. Water pricing reform for sustainable water resources management in China’s agricultural sector. Agric. Water Manag. 2023, 275, 108045. [Google Scholar] [CrossRef]
- Timotewos, M.T.; Barjenbruch, M. Examining the Prospects of Residential Water Demand Management Policy Regulations in Ethiopia: Implications for Sustainable Water Resource Management. Sustainability 2024, 16, 5625. [Google Scholar] [CrossRef]
- Gupta, A.D.; Pandey, P.; Feijóo, A.; Yaseen, Z.M.; Bokde, N.D. Smart water technology for efficient water resource management: A review. Energies 2020, 13, 6268. [Google Scholar] [CrossRef]
- Ivanov, D.; Dolgui, A.; Sokolov, B. The impact of digital technology and Industry 4.0 on the ripple effect and supply chain risk analytics. Int. J. Prod. Res. 2019, 57, 829–846. [Google Scholar] [CrossRef]
- Ciarli, T.; Kenney, M.; Massini, S.; Piscitello, L. Digital technologies, innovation, and skills: Emerging trajectories and challenges. Res. Policy 2021, 50, 104289. [Google Scholar] [CrossRef]
- Available online: https://www.digitalchina.gov.cn/ (accessed on 3 September 2024).
- Alsufyani, N.; Gill, A.Q. Digitalisation performance assessment: A systematic review. Technol. Soc. 2022, 68, 101894. [Google Scholar] [CrossRef]
- Ghimire, A.; Ali, S.; Long, X.; Chen, L.; Sun, J. Effect of Digital Silk Road and innovation heterogeneity on digital economy growth across 29 countries: New evidence from PSM-DID. Technol. Forecast. Soc. Chang. 2024, 198, 122987. [Google Scholar] [CrossRef]
- Hasan, M.M.; Yajuan, L.; Khan, S. Promoting China’s inclusive finance through digital financial services. Glob. Bus. Rev. 2020, 23, 984–1006. [Google Scholar] [CrossRef]
- Costa, F.; Frecassetti, S.; Rossini, M.; Portioli-Staudacher, A. Industry 4.0 digital technologies enhancing sustainability: Applications and barriers from the agricultural industry in an emerging economy. J. Clean. Prod. 2023, 408, 137208. [Google Scholar] [CrossRef]
- Arefiev, S.; Zhyhlei, I.; Pereguda, Y.; Kryvokulska, N.; Lushchyk, M. The use of digital technologies to ensure environmental safety in the context of the green economy development. Rev. Univ. Zulia. 2024, 15, 353–369. [Google Scholar] [CrossRef]
- Peng, H.; Zhang, Y.; Liu, J. The energy rebound effect of digital development: Evidence from 285 cities in China. Energy 2023, 270, 126837. [Google Scholar] [CrossRef]
- Chen, Y.; Wang, Y.; Zhao, C. From riches to digitalization: The role of AMC in overcoming challenges of digital transformation in resource-rich regions. Technol. Forecast. Soc. Chang. 2024, 200, 123153. [Google Scholar] [CrossRef]
- Liu, Y.; Tang, T.; Ah, R.; Luo, L. Has digital technology promoted the restructuring of global value chains? Evidence from China. Econ. Anal. Policy 2024, 81, 269–280. [Google Scholar] [CrossRef]
- Popkova, E.G.; De Bernardi, P.; Tyurina, Y.G.; Sergi, B.S. A theory of digital technology advancement to address the grand challenges of sustainable development. Technol. Soc. 2022, 68, 101831. [Google Scholar] [CrossRef]
- Tang, M.; Liu, Y.; Hu, F.; Wu, B. Effect of digital transformation on enterprises’ green innovation: Empirical evidence from listed companies in China. Energy Econ. 2023, 128, 107135. [Google Scholar] [CrossRef]
- Satı, Z.E. Comparison of the criteria affecting the digital innovation performance of the European Union (EU) member and candidate countries with the entropy weight-TOPSIS method and investigation of its importance for SMEs. Technol. Forecast. Soc. Chang. 2024, 200, 123094. [Google Scholar] [CrossRef]
- Wang, H.; Wang, Y.; Zeng, G.; Qian, Z.; Lu, S. The differential impact of the digital economy on urban energy efficiency in China: The mediating mechanism of FDI. Environ. Dev. Sustain. 2024, 1–28. [Google Scholar] [CrossRef]
- Irfan, M.; Razzaq, A.; Sharif, A.; Yang, X. Influence mechanism between green finance and green innovation: Exploring regional policy intervention effects in China. Technol. Forecast. Soc. Chang. 2022, 182, 121882. [Google Scholar] [CrossRef]
- Sun, L.; Fang, J.; Li, J.; Wang, L. Research on the impact of the integration of digital economy and real economy on enterprise green innovation. Technol. Forecast. Soc. Chang. 2024, 200, 123097. [Google Scholar] [CrossRef]
- Cheikh, N.B.; Rault, C. Financial inclusion and threshold effects in carbon emissions. Res. Policy 2024, 192, 114265. [Google Scholar]
- Tomal, M. Evaluation of coupling coordination degree and convergence behaviour of local development: A spatiotemporal analysis of all Polish municipalities over the period 2003–2019. Sustain. Cities Soc. 2021, 71, 102992. [Google Scholar] [CrossRef]
- Godinez-Madrigal, J.; Van Cauwenbergh, N.; van der Zaag, P. Production of competing water knowledge in the face of water crises: Revisiting the IWRM success story of the Lerma-Chapala Basin, Mexico. Geoforum 2019, 103, 3–15. [Google Scholar] [CrossRef]
- Bozorg-Haddad, O.; Baghban, S.; Loáiciga, H.A. Assessment of global hydro-social indicators in water resources management. Sci. Rep. 2021, 11, 17424. [Google Scholar] [CrossRef]
- Maurya, S.P.; Singh, P.K.; Ohri, A.; Singh, R. Identification of indicators for sustainable urban water development planning. Ecol. Indic. 2020, 108, 105691. [Google Scholar] [CrossRef]
- Wang, H.; Guo, J. New way out of efficiency-equity dilemma: Digital technology empowerment for local government environmental governance. Technol. Forecast. Soc. Chang. 2024, 200, 123184. [Google Scholar] [CrossRef]
- Liu, J.; Yu, Q.; Chen, Y.; Liu, J. The impact of digital technology development on carbon emissions: A spatial effect analysis for China. Resour. Conserv. Recycl. 2022, 185, 106445. [Google Scholar] [CrossRef]
- Chenic, A.Ș.; Burlacu, A.; Dobrea, R.C.; Tescan, L.; Creţu, A.I.; Stanef-Puica, M.R.; Godeanu, T.N.; Manole, A.M.; Virjan, D.; Moroianu, N. The impact of digitalization on macroeconomic indicators in the new industrial age. Electronics 2023, 12, 1612. [Google Scholar] [CrossRef]
- Wan, Q.; Tang, S.; Jiang, Z. Does the development of digital technology contribute to the innovation performance of China’s high-tech industry? Technovation 2023, 124, 102738. [Google Scholar] [CrossRef]
- Chen, R.; Ramzan, M.; Hafeez, M.; Ullah, S. Green innovation-green growth nexus in BRICS: Does financial globalization matter? J. Innov. Knowl. 2023, 8, 100286. [Google Scholar] [CrossRef]
- Available online: https://www.stats.gov.cn/ (accessed on 1 September 2024).
- Tiwari, S.; Mentel, G.; Mohammed, K.S.; Mohd Ziaur Rehman, M.Z.; Lewandowska, A. Unveiling the role of natural resources, energy transition and environmental policy stringency for sustainable environmental development: Evidence from BRIC+ 1. Res. Policy 2024, 96, 105204. [Google Scholar]
- Zhao, L.; Chen, H.; Ding, X.; Chen, Y. Does Digital Village Construction Empower the Green Allocation of Agricultural Water Resources? Systems 2024, 12, 214. [Google Scholar] [CrossRef]
- Cassidy, J.; Barbosa, B.; Damião, M.; Ramalho, P.; Ganhão, A.; Santos, A.; Feliciano, J. Taking water efficiency to the next level: Digital tools to reduce non-revenue water. J. Hydroinform. 2021, 23, 453–465. [Google Scholar] [CrossRef]
- Yuan, S.; Pan, X. Inherent mechanism of digital technology application empowered corporate green innovation: Based on resource allocation perspective. J. Environ. Manag. 2023, 345, 118841. [Google Scholar] [CrossRef] [PubMed]
- Hansen, B.E. Threshold effects in non-dynamic panels: Estimation, testing, and inference. J. Econom. 1999, 93, 345–368. [Google Scholar] [CrossRef]
- Zhao, G.; Deng, Z.; Liu, C. Assessment of the Coupling Degree between Agricultural Modernization and the Coordinated Development of Black Soil Protection and Utilization: A Case Study of Heilongjiang Province. Land 2024, 13, 288. [Google Scholar] [CrossRef]
- Wang, Q.; Wang, S. A comparison of decomposition the decoupling carbon emissions from economic growth in transport sector of selected provinces in eastern, central and western China. J. Clean. Prod. 2019, 229, 570–581. [Google Scholar] [CrossRef]
- Alves, R.G.; Maia, R.F.; Lima, F. Development of a Digital Twin for smart farming: Irrigation management system for water saving. J. Clean Prod. 2023, 388, 135920. [Google Scholar] [CrossRef]
- Yin, W.; Hu, Q.; Liu, W.; Liu, J.; He, P.; Zhu, D.; Kornejady, A. Harnessing Game Engines and Digital Twins: Advancing Flood Education, Data Visualization, and Interactive Monitoring for Enhanced Hydrological Understanding. Water 2024, 16, 2528. [Google Scholar] [CrossRef]
Disclaimer/Publisher’s Note: The statements, opinions and data contained in all publications are solely those of the individual author(s) and contributor(s) and not of MDPI and/or the editor(s). MDPI and/or the editor(s) disclaim responsibility for any injury to people or property resulting from any ideas, methods, instructions or products referred to in the content. |
© 2024 by the authors. Licensee MDPI, Basel, Switzerland. This article is an open access article distributed under the terms and conditions of the Creative Commons Attribution (CC BY) license (https://creativecommons.org/licenses/by/4.0/).

